
Analyst Articles – Forex News 24 |
- Brent Crude Eyes Critical Test of $60 Support
- Gold Forecast – Will Fed’s Powell Fuel Another Gold Price Surge?
- Gold Price Breakout Triggers Overbought RSI Reading
- Crude Oil Prices May Fall as Fed’s Powell Cools Rate Cut Bets
- The Dollar and Nasdaq Tumble Should Seriously Concern Traders
- Rate Cutting Cycle to Curb AUDUSD Rate Rebound
- The Dollar and Nasdaq Tumble Should Seriously Concern Traders
- ASX 200 Resilience To Trade War Fears Falters, Key Support Looms
- Aussie Rebound at Resistance, RBA Eyed
- EURUSD At Resistance, S&P 500 View Dim on Google Antitrust Probe
| Brent Crude Eyes Critical Test of $60 Support Posted: 04 Jun 2019 03:48 AM PDT Hits: 9 Oil Price Analysis and News
Brent Crude Risks Breaking Through $60 The oil market continues to remain soft as the bearish bias towards risk assets in light of rising concerns of a global slowdown weighs on the energy market. Consequently, Brent crude futures are at risk of breaking below $60 for the first time since the beginning of the year as fears mount over a potential hit to consumption growth. Coinciding with the move lower in the spot market, the Brent futures curve has also seen a pullback from its steep backwardation (6-month spreads are now at $1.80 from a prior $4.30), providing an increasing sense that trade war fears are outweighing potential supply side related risks. What is Brent Crude Backwardation? Elsewhere, reports that Norwegian oil workers have struck a wage deal with employers today had led to a strike being avoided, which would have cut production by 440kbpd. Subsequently, keeping a lid on any bounce in the energy complex. As such, focus is on the psychological $60 handle to provide a floor for oil prices. Hedge Funds Continue to Head for the Exit Hedge funds have continued to exit their bullish positioning in the Brent crude oil with net longs dropping by a sizeable 40k lots amid the capitulation in oil prices throughout May. Consequently, the ratio of long/short positioning has almost halved from over 2 weeks ago to 8:1 (Prev. 15:1) with risks of a further liquidation of long Brent positioning on the horizon. (COT Commodity report) Brent Crude Price Chart: Daily Time Frame (Aug 2018 – Jun 2019)
Oil Impact on FX Net Oil Importers: These countries tend to be worse off when the price of oil rises. This includes, KRW, ZAR, INR, TRY, EUR, CNY, IDR, JPY Net Oil Exporters: These counties tend to benefit when the price of oil rises. This includes RUB, CAD, MXN, NOK. Recommended Reading What Traders Need to Know When Trading the Oil Market Important Difference Between WTI and Brent — Written by Justin McQueen, Market Analyst To contact Justin, email him at Justin.mcqueen@ig.com Follow Justin on Twitter @JMcQueenFX http://platform.twitter.com/widgets.js Can you get luxurious from fx trading? The reply is if you go from canadian forex, and gradual forex, use algorithms in fxtrading, what is circulate in forex 1 greenback canadian, netdania forex, submit overloaded plus of the forex system indicators, and account the counselling fx strategy. We present win win all.
| ||||||||||||
| Gold Forecast – Will Fed’s Powell Fuel Another Gold Price Surge? Posted: 04 Jun 2019 01:12 AM PDT Hits: 12 Gold Price, Analysis and Charts.
DailyFX Q2 USD and Gold Forecasts and Top 2019 Trading Opportunities. Gold Eyes Fed Powell's Commentary for Next MoveGold continues to push higher, prompted by a weaker US dollar and continues risk-off sentiment. The US dollar's last leg lower was fueled by comments from St Louis Fed President Bullard who said that an interest rate cut may be' warranted' soon. Bullard is a well-known FOMC dove, so while his view carries heft, today's commentary from Fed Chair Jerome Powell will carry more weight. Chair Powell will be discussing policy strategy today at the Chicago Fed Conference. Yesterday's comments from Bullard sent US Treasury yields lower, with the 2-year now offering just 1.875%, down from 2.61% in mid-January this year. The US 10-year currently offers 2.09%, down from 2.79% over the same time-frame. The markets are now pricing-in around 60 basis points worth of easing in the US by the end of the year. Against this backdrop, and aided by a risk-off sentiment, gold has rallied hard and is around $18 way from making a fresh 13-month high. We noted two weeks ago that gold was being compressed in a tightening pattern and that a sharp move was likely. Gold has now rallied over $50/oz. in the last week and is looking heavily overbought using the CCI indicator. The February 20 high at $1,346/oz. is the next bull target but a short-term move here is unlikely unless the Fed's Powell turns dovish is his commentary. The strength of the recent rally has left little in the way of technical support over the last week with horizontal resistance seen at $1,324/oz. ahead of $1,311/oz. How to Trade Gold: Top Gold Trading Strategies and Tips Gold (XAU) Daily Price Chart (March 2018 – June 4, 2019)IG Client Sentiment data show that retail traders are 68.0% net-long gold, a bearish contrarian indicator. Recent daily and weekly sentiment shifts however suggest that gold may soon move higher despite traders being net-long. — Written by Nick Cawley, Market Analyst To contact Nick, email him at nicholas.cawley@ig.com Follow Nick on Twitter @nickcawley1 2019-06-04 08:00:00 Can you get luxurious from fx trading? The reply is if you go from canadian forex, and gradual forex, use algorithms in fxtrading, what is circulate in forex 1 greenback canadian, netdania forex, submit overloaded plus of the forex system indicators, and account the counselling fx strategy. We present win win all.
| ||||||||||||
| Gold Price Breakout Triggers Overbought RSI Reading Posted: 03 Jun 2019 11:51 PM PDT Hits: 13 Gold Price Talking PointsThe recent breakout in the price of gold appears to be gathering pace as Federal Reserve officials respond to the shift in U.S. trade policy, and the precious metal may continue to gain ground over the coming days as the Relative Strength Index (RSI) flirts with overbought territory. Gold Price Breakout Triggers Overbought RSI ReadingGold extends the rally from late last week as the Trump administration plans to impose a 5% tariff on all goods coming from Mexico, and the precious metal may continue to benefit from the current environment as the weakening outlook for global growth puts pressure on the Federal Open Market Committee (FOMC) to alter the forward guidance for monetary policy. Recent comments from St. Louis Fed President James Bullard, a 2019-voting member on the FOMC, suggest the central bank will change its tune over the coming months as the committee "faces an economy that is expected to grow more slowly going forward, with some risk that the slowdown could be sharper than expected due to ongoing global trade regime uncertainty." As a result, Mr. Bullard insists that "a downward policy rate adjustment may be warranted soon to help re-center inflation and inflation expectations," and the central bank may show a greater willingness to switch gears later this year especially as Fed Fund futures reflect a greater than 90% probability for a December rate-cut. With that said, it remains to be seen if Chairman Jerome Powell & Co. will continue to forecast a longer-run interest rate of 2.50% to 2.75% as the U.S. economy shows little to no signs of an imminent recession, but the fresh updates to the Summary of Economic Projections (SEP) may heighten the appeal of gold if Fed officials highlight a lower trajectory for the benchmark interest. In turn, the shift in U.S. trade policy may continue to drag on risk-taking behavior, and the flight to safety may keep gold prices afloat ahead of the Fed meeting on June 19 as the precious metal negates the head-and-shoulders formation from earlier this year. Sign up and join DailyFX Currency Strategist David Song LIVE for an opportunity to discuss potential trade setups. Gold Price Daily Chart
For more in-depth analysis, check out the 2Q 2019 Forecast for Gold Additional Trading ResourcesAre you looking to improve your trading approach? Review the 'Traits of a Successful Trader' series on how to effectively use leverage along with other best practices that any trader can follow. Want to know what other currency pairs the DailyFX team is watching? Download and review the Top Trading Opportunities for 2019 – Written by David Song, Currency Strategist Follow me on Twitter at @DavidJSong. 2019-06-04 06:30:00 Can you get luxurious from fx trading? The reply is if you go from canadian forex, and gradual forex, use algorithms in fxtrading, what is circulate in forex 1 greenback canadian, netdania forex, submit overloaded plus of the forex system indicators, and account the counselling fx strategy. We present win win all.
| ||||||||||||
| Crude Oil Prices May Fall as Fed’s Powell Cools Rate Cut Bets Posted: 03 Jun 2019 10:38 PM PDT Hits: 9 CRUDE OIL & GOLD TALKING POINTS:
Crude oil prices drifted sideways alongside the bellwether S&P 500 stock index Monday, speaking to consolidation after Friday's brutal bloodletting. Gold prices continued to soar on the back of building Fed rate cut speculation, spurred on after manufacturing ISM data disappointed relative forecasts (as expected). CRUDE OIL, GOLD MAY FALL AS FED CHAIR POWELL COOLS RATE CUT BETSLooking ahead, another helping of US economic activity data may inform monetary policy bets. Factory and durable goods orders figures are on tap and may disappoint even relative to already downbeat expectations if the trend in recent news-flow holds up. While such outcomes might have prolonged the dovish shift in Fed policy bets, they might be overshadowed by a speech form central bank Chair Jerome Powell. He has forcefully argued in favor of a wait-and-see approach in recent weeks, meaning his remarks may clash with investors' more downbeat projections. Such rhetoric might spook investors pining for a looser monetary backdrop amid slowing global growth, escalating trade wars, and ample political uncertainty. This bodes ill for sentiment-linked crude oil prices. Gold may retreat as well as the US Dollar perks up, cooling anti-fiat demand. Did we get it right with our crude oil and gold forecasts? Get them here to find out! GOLD TECHNICAL ANALYSISGold prices continue to surge, with buyers now testing resistance in the 1323.40-26.30 area. A daily close above that exposes the late-February swing top at 1346.75. Alternatively, a move back below the 1303.70-09.12 inflection region targets rising trend line support at 1275.63. CRUDE OIL TECHNICAL ANALYSISCrude oil prices are edging toward support in the 50.31-51.33 area. Breaking below that on a daily closing basis sets the stage for a decline toward support dating back to September 2016 in the 42.05-43.00 zone. Immediate resistance is at 55.75, with a turn above that eyeing the 57.24-88 region next.
COMMODITY TRADING RESOURCES— Written by Ilya Spivak, Currency Strategist for DailyFX.com To contact Ilya, use the comments section below or @IlyaSpivak on Twitter http://platform.twitter.com/widgets.js Can you get luxurious from fx trading? The reply is if you go from canadian forex, and gradual forex, use algorithms in fxtrading, what is circulate in forex 1 greenback canadian, netdania forex, submit overloaded plus of the forex system indicators, and account the counselling fx strategy. We present win win all.
| ||||||||||||
| The Dollar and Nasdaq Tumble Should Seriously Concern Traders Posted: 03 Jun 2019 08:50 PM PDT Hits: 4 Reversal Talking Points:
See how retail traders are positioning in the Dow and S&P 500 following their tentative technical reversal along with the FX majors, other indices, gold and oil intraday using the DailyFX speculative positioning data on the sentiment page. The Nasdaq Composite’s Drop Raises Serious Red Flags for the Stability of Risk TrendsTrade wars are growing increasingly ‘dirty’ as participants run out of conventional tools and are forced deeper and deeper into retaliatory territory. The side effects of the more recent volleys are starting to threaten serious destabilization of overextended risk assets. Through the end of last week, the focus on competitive economic policies shifted to include the US-Mexico escalation. President Trump’s announcement that a 5 percent tax on all Mexican imports would begin on June 10th threw the market for a loop as recent developments seemed to indicate a deal on the USMCA was soon at hand. The USDMXN would obviously respond with a strong bullish break of wedge resistance while North American markets were generally morose owing to the uncertainty. Signs that a reversal in artificial trade barriers is not soon at hand bodes poorly for a market struggling under more normative market developments, such as fading economic activity. Chart of USDMXN and 2-Day Rate of Change (Daily) As troubling as the expansion of the global trade war may be, the ‘original’ engagement may still hold the ultimate power to topple resilient speculative conviction. There have not been any increase or expansion of the common tariffs from either the US or China since the hike in the import tax rate from 10 to 25 percent by both parties a few weeks ago. There is still the open-ended threat that the White House is preparing to widen its net to the entirety of China’s shipments to the country, but the sudden course reversal with Mexico suggests that there is good reason to remain vigilant and prepared for the unexpected. In the meantime, the moves against the counterpart’s corporate interests seems to move forward. Though China has not acted out an official response to Huawei’s ban from US business, a white paper on using rare earth materials as a tool and reports that the government is laying out criteria for its ‘unreliable entities’ list that could target large US tech firms tugs at a serious fear for the capital markets. Ratio of Huawei to Google (Daily)
In comparing the performance of various risk assets around the world, it is difficult to avoid the outperformance of US equities relative to global shares, emerging market assets, high-yield fixed income, carry trade and a host of other risk-leaning exposures in different areas of the financial system. Within this pace-setting benchmark, the favorite ‘disrupting’ tech sector has outperformed with the most popular large-market cap firms drawing the reckless speculative reach for return. As equity benchmarks around the world – from VEU to DAX – have deviated from the likes of the S&P 500, the latter has seemed to act as an air break against serious momentum. Even as the loss of altitude seems to encompass virtually all areas of the global markets, still this specific segment’s stability has kept the ship upright. Yet, when the torchbearer has stumbled, peaks of genuine fear have started to leak through. Monday, the tech-heavy Nasdaq paced the tumble – with its relative performance to the blue-chip Dow taking a sharp drop. If reports that the FTC is considering antitrust investigations against key companies Google, Apple and Facebook prove true; mere indigestion could prove a heart attack for ‘risk’. Ratio of Nasdaq to Dow Overlaid with the S&P 500 in Blue (Daily)
Dollar’s Troubles are the Amalgamation of Economic, Monetary Policy and Systemic IssuesIf you follow most of the critical lines back to cross points or even their origination, there is a troubling amount of overlap for the US Dollar. The first trading day of June was a painful one for the Greenback as the EURUSD posted its biggest single-day rally since January 24th. This was not the work of the Euro for once but rather a clear crumpling of the benchmark currency. We can account for this unique influence via an equally-weighted measure of the USD which posted its own sharp drop to combine with Friday’s drop for the worst two-day showing for the currency since the very open of the year. Chart of EURUSD (4-hour)
The surprisingly complicated question for this development is what exactly is driving the Dollar’s troubles? There are in fact a host of issues that happen to coincide, but why would this only now prove a burden when previous weeks and months have shown the currency to be aloof to its pains? It may very well be the intensity of the convergent winds. For domestic economic activity, the US economy has already been throwing off signals to reinforce market fears through yield curve inversion; but the manufacturing surveys on tap seemed to carry greater weight in the context of the global struggle. The ISM’s report fell to 52.1 against expectations of a modest improvement (53.0) which was the worst reading since October 2016 but nevertheless still holding in positive territory – a reading above 50. The Markit’s reporting may have been a ‘final’ figure and modest in its shift from the preliminary figure, but 50.5 reading was the worst showing for the world’s largest economy since September 2009. Considering the far more heavily weighted towards the service sector, Wednesday’s ISM non-manufacturing report for last month should be watched very closely. The impact potential is heavily skewed towards a further slide into economic malaise. A byproduct of the weak economic showing is the growing conviction across the market that a Fed rate hike is inevitable and increasingly essential to forestall a more significant economic backslide. The probability of a rate cut later this month is still only 20 percent, a cut in July is approximately 55 percent and certitude hits with the September meeting where the likelihood is put at 88 percent. A move by year’s end is seen as almost certain and the tally of multiple moves through 2020 is building up quickly. The Fed will start its policy framework discussion Tuesday and a conversation venturing into the diminished effectiveness of policy and the limited capacity to act against future problems is gaining steady traction. Chart of DXY Dollar Index and Implied Fed Funds Yield through December 2020 (Daily)
Trouble for the Aussie Dollar, Swiss Franc and Pound Only Adds Strength to GoldAs the world’s most liquid currency sorts out its fundamental role in an increasingly complicated financial landscape, its major counterparts are being swept up in comparatively straightforward currents. For the Euro, the flow of influence has reversed back towards its normal course where the world’s most liquid currency is exerting influence over its second most heavily traded measure. The outflow through EURUSD was strong enough that it would effectively quiet concerns over the region’s economic struggles through the PMIs. Meanwhile, Italian PM Conte stated that he would resign from his position if he could not garner the full support from the parties that form the coalition government. Perhaps that is viewed as a boon to stop the momentum of a united anti-Euro populism. Meanwhile, the Japanese Yen is still riding under the influence of risk trends with an uneven performance that nevertheless pushes USDJPY in the anticipated bearish direction. From the British Pound, Parliament’s return from recess means its back to the business of sorting Brexit. Of course, before that agreement with European Union leadership can be struck, the UK needs to work out its own position. The betting sites are working overtime on determining who will be the successor of Prime Minister Theresa May when she steps down Friday. Boris Johnson is still ahead in the opinion polls and betting tables. As the negotiation position from the UK still looks in flux, French President Macon has stated for the cameras that no further postponement for a decision beyond October 31st should be considered. Economic health amid this uncertainty is not keeping its steady course. The UK manufacturing activity report from Markit Monday took a significant turn for the worse with a 49.4 reading (versus 52.2) that shows sentiment can have a tangible impact. When looking for opportunity – or risks – we shouldn’t just keep our attention to the top three or four players in the FX market. The Australian Dollar is arguably the most action packed of the majors this week with the RBA decision expected to deliver a 25-basis point rate hike following the disappointing run of corporate profit, manufacturing activity and housing prices this past session. And, before you develop an itchy trigger finger on this key event, remember a cut is fully priced going into the event and 1Q GDP is due the day after. An even less frequented currency to keep tabs on at the moment is the Swiss Franc. Whether its unique haven properties – outside the fundamental gravity of the US issues – have prompted appeal or the Euro’s spilling over troubles, the EURCHF pulled back from a critical bearish break this past session. Let’s see how long the SNB can keep its boat upright. And, through it all, we have a need for safety that seems to weigh risk assets, call into question the Dollar’s liquidity role and pick apart the host of traditional alternatives to the world’s most liquid currency. Where do we go in such an environment? Gold, which extended its strongest two-day run since October 11th. We discuss all of this and more in today’s Trading Video. Chart of EURCHF (Daily)
If you want to download my Manic-Crisis calendar, you can find the updated file here. 2019-06-04 01:41:00 Can you get luxurious from fx trading? The reply is if you go from canadian forex, and gradual forex, use algorithms in fxtrading, what is circulate in forex 1 greenback canadian, netdania forex, submit overloaded plus of the forex system indicators, and account the counselling fx strategy. We present win win all.
| ||||||||||||
| Rate Cutting Cycle to Curb AUDUSD Rate Rebound Posted: 03 Jun 2019 08:15 PM PDT Hits: 7 Trading the News: Reserve Bank of Australia (RBA) Interest Rate DecisionThe Reserve Bank of Australia (RBA) interest rate decision may shake up the near-term outlook for AUDUSD as the central bank is widely expected to cut the official cash rate (OCR) to a fresh record-low of 1.25%. The RBA looks poised to further insulate the economy as the trade dispute between the U.S. and China, Australia's largest trading partner, dampens the outlook for global growth, and the central bank may implement lower interest rates throughout the remainder of the year as official insist that "without an easing in monetary policy over the next six months, growth and inflation outcomes would be expected to be less favourable than the central scenario." In turn, a 25bp rate-cut paired with a batch of dovish rhetoric is likely to drag on AUDUSD as Governor Philip Lowe & Co. reestablish the rate easing cycle and push monetary policy into uncharted territory. However, the RBA may stick to the sidelines as recent updates to Australia's Employment report suggest discourage workers are returning to the labor force, and more of the same from Governor Lowe & Co. may trigger a bullish reaction in AUDUSD as the central bank remains in no rush to implement lower interest rates. Sign up and join DailyFX Currency Strategist David Song LIVE for an opportunity to discuss key themes and potential trade setups surrounding foreign exchange markets. Impact that the RBA interest rate decision had on AUD/USD during the last meeting
May 2019 Reserve Bank of Australia (RBA) Interest Rate Decision AUD/USD 5-Minute Chart
The Reserve Bank of Australia (RBA) kept the official cash rate (OCR) at 1.50% in May despite speculation for a 25bp rate-cut, and it seems as though the central bank will retain the current policy for the foreseeable future as officials pledge to pay "close attention to developments in the labour market at its upcoming meetings." However, the RBA appears to be change its tune as "the inflation data for the March quarter were noticeably lower than expected," and it may be just a matter of time before the central bank reestablishes its rate easing cycle as "a further improvement in the labour market was likely to be needed for inflation to be consistent with the target." The Australian dollar gained ground as the RBA stuck to the sidelines, with AUD/USD climbing above the 0.7000 handle to close the day at 0.7012. Learn more with the DailyFX Advanced Guide for Trading the News. AUD/USD Rate Daily Chart
Additional Trading ResourcesNew to the currency market? Want a better understanding of the different approaches for trading? Start by downloading and reviewing the DailyFX Beginners Guide. Are you looking to improve your trading approach? Review the 'Traits of a Successful Trader' series on how to effectively use leverage along with other best practices that any trader can follow. — Written by David Song, Currency Strategist Follow me on Twitter at @DavidJSong. 2019-06-04 03:00:00 Can you get luxurious from fx trading? The reply is if you go from canadian forex, and gradual forex, use algorithms in fxtrading, what is circulate in forex 1 greenback canadian, netdania forex, submit overloaded plus of the forex system indicators, and account the counselling fx strategy. We present win win all.
| ||||||||||||
| The Dollar and Nasdaq Tumble Should Seriously Concern Traders Posted: 03 Jun 2019 07:37 PM PDT Hits: 2 Reversal Talking Points:
See how retail traders are positioning in the Dow and S&P 500 following their tentative technical reversal along with the FX majors, other indices, gold and oil intraday using the DailyFX speculative positioning data on the sentiment page. The Nasdaq Composite’s Drop Raises Serious Red Flags for the Stability of Risk TrendsTrade wars are growing increasingly ‘dirty’ as participants run out of conventional tools and are forced deeper and deeper into retaliatory territory. The side effects of the more recent volleys are starting to threaten serious destabilization of overextended risk assets. Through the end of last week, the focus on competitive economic policies shifted to include the US-Mexico escalation. President Trump’s announcement that a 5 percent tax on all Mexican imports would begin on June 10th threw the market for a loop as recent developments seemed to indicate a deal on the USMCA was soon at hand. The USDMXN would obviously respond with a strong bullish break of wedge resistance while North American markets were generally morose owing to the uncertainty. Signs that a reversal in artificial trade barriers is not soon at hand bodes poorly for a market struggling under more normative market developments, such as fading economic activity. Chart of USDMXN and 2-Day Rate of Change (Daily)
As troubling as the expansion of the global trade war may be, the ‘original’ engagement may still hold the ultimate power to topple resilient speculative conviction. There have not been any increase or expansion of the common tariffs from either the US or China since the hike in the import tax rate from 10 to 25 percent by both parties a few weeks ago. There is still the open-ended threat that the White House is preparing to widen its net to the entirety of China’s shipments to the country, but the sudden course reversal with Mexico suggests that there is good reason to remain vigilant and prepared for the unexpected. In the meantime, the moves against the counterpart’s corporate interests seems to move forward. Though China has not acted out an official response to Huawei’s ban from US business, a white paper on using rare earth materials as a tool and reports that the government is laying out criteria for its ‘unreliable entities’ list that could target large US tech firms tugs at a serious fear for the capital markets. Ratio of Huawei to Google (Daily)
In comparing the performance of various risk assets around the world, it is difficult to avoid the outperformance of US equities relative to global shares, emerging market assets, high-yield fixed income, carry trade and a host of other risk-leaning exposures in different areas of the financial system. Within this pace-setting benchmark, the favorite ‘disrupting’ tech sector has outperformed with the most popular large-market cap firms drawing the reckless speculative reach for return. As equity benchmarks around the world – from VEU to DAX – have deviated from the likes of the S&P 500, the latter has seemed to act as an air break against serious momentum. Even as the loss of altitude seems to encompass virtually all areas of the global markets, still this specific segment’s stability has kept the ship upright. Yet, when the torchbearer has stumbled, peaks of genuine fear have started to leak through. Monday, the tech-heavy Nasdaq paced the tumble – with its relative performance to the blue-chip Dow taking a sharp drop. If reports that the FTC is considering antitrust investigations against key companies Google, Apple and Facebook prove true; mere indigestion could prove a heart attack for ‘risk’. Ratio of Nasdaq to Dow Overlaid with the S&P 500 in Blue (Daily)
Dollar’s Troubles are the Amalgamation of Economic, Monetary Policy and Systemic IssuesIf you follow most of the critical lines back to cross points or even their origination, there is a troubling amount of overlap for the US Dollar. The first trading day of June was a painful one for the Greenback as the EURUSD posted its biggest single-day rally since January 24th. This was not the work of the Euro for once but rather a clear crumpling of the benchmark currency. We can account for this unique influence via an equally-weighted measure of the USD which posted its own sharp drop to combine with Friday’s drop for the worst two-day showing for the currency since the very open of the year. Chart of EURUSD (4-hour)
The surprisingly complicated question for this development is what exactly is driving the Dollar’s troubles? There are in fact a host of issues that happen to coincide, but why would this only now prove a burden when previous weeks and months have shown the currency to be aloof to its pains? It may very well be the intensity of the convergent winds. For domestic economic activity, the US economy has already been throwing off signals to reinforce market fears through yield curve inversion; but the manufacturing surveys on tap seemed to carry greater weight in the context of the global struggle. The ISM’s report fell to 52.1 against expectations of a modest improvement (53.0) which was the worst reading since October 2016 but nevertheless still holding in positive territory – a reading above 50. The Markit’s reporting may have been a ‘final’ figure and modest in its shift from the preliminary figure, but 50.5 reading was the worst showing for the world’s largest economy since September 2009. Considering the far more heavily weighted towards the service sector, Wednesday’s ISM non-manufacturing report for last month should be watched very closely. The impact potential is heavily skewed towards a further slide into economic malaise. A byproduct of the weak economic showing is the growing conviction across the market that a Fed rate hike is inevitable and increasingly essential to forestall a more significant economic backslide. The probability of a rate cut later this month is still only 20 percent, a cut in July is approximately 55 percent and certitude hits with the September meeting where the likelihood is put at 88 percent. A move by year’s end is seen as almost certain and the tally of multiple moves through 2020 is building up quickly. The Fed will start its policy framework discussion Tuesday and a conversation venturing into the diminished effectiveness of policy and the limited capacity to act against future problems is gaining steady traction. Chart of DXY Dollar Index and Implied Fed Funds Yield through December 2020 (Daily)
Trouble for the Aussie Dollar, Swiss Franc and Pound Only Adds Strength to GoldAs the world’s most liquid currency sorts out its fundamental role in an increasingly complicated financial landscape, its major counterparts are being swept up in comparatively straightforward currents. For the Euro, the flow of influence has reversed back towards its normal course where the world’s most liquid currency is exerting influence over its second most heavily traded measure. The outflow through EURUSD was strong enough that it would effectively quiet concerns over the region’s economic struggles through the PMIs. Meanwhile, Italian PM Conte stated that he would resign from his position if he could not garner the full support from the parties that form the coalition government. Perhaps that is viewed as a boon to stop the momentum of a united anti-Euro populism. Meanwhile, the Japanese Yen is still riding under the influence of risk trends with an uneven performance that nevertheless pushes USDJPY in the anticipated bearish direction. From the British Pound, Parliament’s return from recess means its back to the business of sorting Brexit. Of course, before that agreement with European Union leadership can be struck, the UK needs to work out its own position. The betting sites are working overtime on determining who will be the successor of Prime Minister Theresa May when she steps down Friday. Boris Johnson is still ahead in the opinion polls and betting tables. As the negotiation position from the UK still looks in flux, French President Macon has stated for the cameras that no further postponement for a decision beyond October 31st should be considered. Economic health amid this uncertainty is not keeping its steady course. The UK manufacturing activity report from Markit Monday took a significant turn for the worse with a 49.4 reading (versus 52.2) that shows sentiment can have a tangible impact. When looking for opportunity – or risks – we shouldn’t just keep our attention to the top three or four players in the FX market. The Australian Dollar is arguably the most action packed of the majors this week with the RBA decision expected to deliver a 25-basis point rate hike following the disappointing run of corporate profit, manufacturing activity and housing prices this past session. And, before you develop an itchy trigger finger on this key event, remember a cut is fully priced going into the event and 1Q GDP is due the day after. An even less frequented currency to keep tabs on at the moment is the Swiss Franc. Whether its unique haven properties – outside the fundamental gravity of the US issues – have prompted appeal or the Euro’s spilling over troubles, the EURCHF pulled back from a critical bearish break this past session. Let’s see how long the SNB can keep its boat upright. And, through it all, we have a need for safety that seems to weigh risk assets, call into question the Dollar’s liquidity role and pick apart the host of traditional alternatives to the world’s most liquid currency. Where do we go in such an environment? Gold, which extended its strongest two-day run since October 11th. We discuss all of this and more in today’s Trading Video. Chart of EURCHF (Daily)
If you want to download my Manic-Crisis calendar, you can find the updated file here. 2019-06-04 01:41:00 Can you get luxurious from fx trading? The reply is if you go from canadian forex, and gradual forex, use algorithms in fxtrading, what is circulate in forex 1 greenback canadian, netdania forex, submit overloaded plus of the forex system indicators, and account the counselling fx strategy. We present win win all.
| ||||||||||||
| ASX 200 Resilience To Trade War Fears Falters, Key Support Looms Posted: 03 Jun 2019 06:57 PM PDT Hits: 4 ASX 200 Technical Analysis Talking Points:
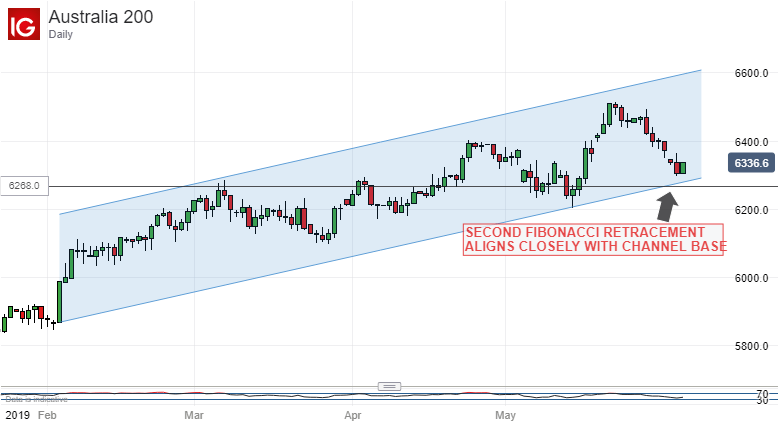
Find out what retail foreign exchange traders make of the Australian Dollar's chances right now at the DailyFX Sentiment Page. Is the party over at last for the ASX 200? The Australian stock benchmark defied trade-gloom and diminished global risk appetite quite well up until the end of last week. Rising iron ore prices and a weaker Australian Dollar burnished the appeal of what should probably have been among the hardest hit indexes of all given Australia's clear links to both China and the US. Still, despite some fundamental resilience, I suggested last week that the index may well be tiring, and so it seems to have proven since. Admittedly the index remains just within the uptrend channel which has bounded trade since February 4. However, its slide toward the channel base has accelerated sharply since April 22 and a test now seems likely, possibly quite soon. Moreover, this base takes the lows of May 14 into account. Indeed, they constitute its only confirmation since the channel began. Its plausible to view those as quite spurious for these purposes and, if we do, then the index is probably already below any uptrend which ignores them. Even so the bulls may yet have something to play for if they can hold the current line, and it will be instructive to see how much support if any the channel base at 6271 can provide. Bear in mind that the first Fibonacci retracement of the rise as a whole has already given way. It was at 6362.5 and fell on Friday of last week. Focus is now on the second retracement, 38.2%, which comes in within a few points of the channel base at 6268. Should that to be surrendered on a daily and weekly closing basis then the uptrend overall would be clearly in trouble and immediate focus would then probably fall on a band of support between 6235 (May 15's low) and 6094 (the low of March 27). In turn trade in this area would bring the psychologically crucial 6000 point perhaps uncomfortably close, and investors should probably be wary in that case of a quick fall below it, possibly followed by further falls. The bulls are going to have to try to form a base around current levels if they're going to have another try at recent highs. However, the index is not at this point oversold and the fundamental picture doesn't make this look very likely. The index might get some fundamental support from the looser monetary policy overwhelmingly expected from the Reserve Bank of Australia later Tuesday, but against the global backdrop this could be quite fleeting. Resources for TradersWhether you're new to trading or an old hand DailyFX has plenty of resources to help you. There's our trading sentiment indicator which shows you live how IG clients are positioned right now. We also hold educational and analytical webinars and offer trading guides, with one specifically aimed at those new to foreign exchange markets. There's also a Bitcoin guide. Be sure to make the most of them all. They were written by our seasoned trading experts and they're all free. — Written by David Cottle, DailyFX Research Follow David on Twitter@DavidCottleFX or use the Comments section below to get in touch! http://platform.twitter.com/widgets.js Can you get luxurious from fx trading? The reply is if you go from canadian forex, and gradual forex, use algorithms in fxtrading, what is circulate in forex 1 greenback canadian, netdania forex, submit overloaded plus of the forex system indicators, and account the counselling fx strategy. We present win win all.
| ||||||||||||
| Aussie Rebound at Resistance, RBA Eyed Posted: 03 Jun 2019 06:14 PM PDT Hits: 11 AUDUSD CHART ANALYSIS: BEARISH
Join our live RBA rate decision webinar to see how it will impact trading AUDUSD! The Australian Dollar traded higher as expected after producing a bullish Morning Star candlestick pattern and breaking near-term trend resistance set from mid-April. Prices are now testing support-turned-resistance marked by the floor of a recently completed Descending Triangle pattern in the 0.6978-7021 area. As it stands, the rally appears to be corrective in the context of a larger decline started in early January 2018 and resumed with the mid-May Triangle breakout. Invalidating that bearish bias probably calls for a daily close above falling trend line resistance (and Triangle top) set from December, now at the 0.71 figure. Having said that, an actionable short trade signal appears to be absent for now. If a reversal does materialize, sellers face initial support in the 0.6827-65 area (January 2016 low, May swing bottom). Beyond that is the 2019 spike low at 0.6744. AUDUSD TRADING RESOURCES— Written by Ilya Spivak, Currency Strategist for DailyFX.com To contact Ilya, use the comments section below or @IlyaSpivak on Twitter http://platform.twitter.com/widgets.js Can you get luxurious from fx trading? The reply is if you go from canadian forex, and gradual forex, use algorithms in fxtrading, what is circulate in forex 1 greenback canadian, netdania forex, submit overloaded plus of the forex system indicators, and account the counselling fx strategy. We present win win all.
| ||||||||||||
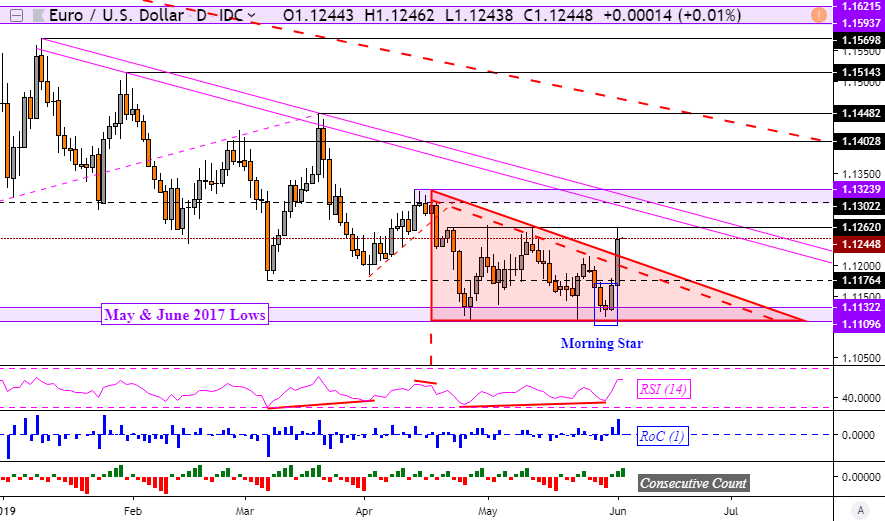
| EURUSD At Resistance, S&P 500 View Dim on Google Antitrust Probe Posted: 03 Jun 2019 05:02 PM PDT Hits: 8 Asia Pacific Market Open Talking PointsTrade all the major global economic data live as it populates in the economic calendar and follow the live coverage for key events listed in the DailyFX Webinars. We'd love to have you along. US Dollar Drops as Markets Double Down on July Fed Rate CutThe US Dollar took the spot as the worst-performing major currency on Monday as its relatively high yield worked against its favor in a "risk off" trading dynamic. The probability that the Federal Reserve will deliver a rate cut in July, as priced in by Fed funds futures, rose to 70% from just 47% on Friday. That the central bank has room to cut is a clear disadvantage to the Greenback if those bets are realized. However, the potential for additional downside performance in the medium-term is unclear due to its status as a highly–liquid reserve currency. For the time being, the S&P 500 ended the day 0.28% to the downside, unable to find support by the markets pricing in a more-dovish Fed. The US 10-year and 3-month bond yield curve inverted deeper to levels not seen since April 2007 as recession fears climbed. The drop in US equities could be pointed to poor performance in tech-based stocks, in addition to broader fundamental themes such as a US-Mexico trade war which poses as a risk to the Canadian Dollar. Shares of Facebook, Apple and Alphabet declined across the board. This appeared to be due to knock-on effects after the US Department of Justice announced antitrust probes into Google following Wall Street close on Friday. Euro Technical AnalysisBroad weakness in the Greenback lead EUR/USD to its best day since January. This was as anticipated in this week's Euro technical forecast following bullish reversal warnings. But, the trend seems biased to the downside in the medium-term. Also as expected, near-term resistance held under 1.1262. If broken, this exposes a descending channel of resistance going back to January on the chart below. EUR/USD Daily ChartChart Created in TradingView The anti-risk Japanese Yen failed to materially find gains over the past 24 hours. However, the similarly-behaving Swiss Franc did as CHF/JPY rose on what could have been regional haven demand. Interestingly, the pro-risk Australian and New Zealand Dollars held up relatively well. This may have been due to broad declines in the US Dollar as markets priced in lower and lower rates in the world's largest economy. Tuesday's Asia Pacific Trading SessionSpeaking of, the Australian Dollar is almost certainly looking at a rate cut from the RBA during Tuesday's Asia Pacific trading session. Out of 38 estimates pulled by Bloomberg, only 3 sources are envisioning a hold at 1.50%. With that in mind, a surprise rate hold from the central bank will surprise markets more so than last month, when the odds were closer to 50-50. That is because the RBA has spent the past month preparing the markets for a cut, much like the RBNZ before it delivered one. As such, a cut will not surprise markets and it by itself won't be enough to sustain weakness in the Aussie. It all depends on the central bank's forward guidance where it might focus on a data-dependent approach. That could potentially offer a neutral outcome for AUD/USD in the near-term. Join me as I cover the RBA at 4:15 GMT and the reaction in the Australian Dollar, where I will also be taking a look at the path forward for the Aussie. FX Trading Resources— Written by Daniel Dubrovsky, Currency Analyst for DailyFX.com To contact Daniel, use the comments section below or @ddubrovskyFX on Twitter http://platform.twitter.com/widgets.js Can you get luxurious from fx trading? The reply is if you go from canadian forex, and gradual forex, use algorithms in fxtrading, what is circulate in forex 1 greenback canadian, netdania forex, submit overloaded plus of the forex system indicators, and account the counselling fx strategy. We present win win all.
|


| You are subscribed to email updates from Analyst Articles – Forex News 24. To stop receiving these emails, you may unsubscribe now. | Email delivery powered by Google |
| Google, 1600 Amphitheatre Parkway, Mountain View, CA 94043, United States | |
No comments:
Post a Comment