
Forex analysis review |
- GBP/USD near resistance, a drop is possible!
- AUD/USD reversed off resistance, potential reversal!
- USD/JPY approaching support, possible bounce!
- Fractal analysis of major currency pairs on June 20
- EUR / USD h4 vs #USDX h4 vs GBP / USD h4. Comprehensive analysis of the movements options from June 20, 2019. Analysis of
- GBP/USD. June 19. Results of the day. Boris Johnson receives additional support from Dominic Raab
- When will the Fed hike rates?
- EUR /USD. June 19. Results of the day. Jerome Powell's rhetoric will have a fateful effect on the US dollar
- USD/CAD. The Canadian dollar spreads its wings, but the downward trend is in the hands of the Fed
- June 19, 2019 : EUR/USD maintains short-term bullish outlook above 1.1175.
- Bitcoin analysis for June, 19.2019
- Analysis of Gold for June 19,.2019
- June 19, 2019 : The GBP/USD may end the ongoing current bearish decline. Bullish reversal is anticipated.
- GBP/USD: Bank of England has no reason to lower rates, unlike the Fed and the ECB, which will support the pound in the medium
- GBP / USD plan for the US session on June 19. Inflation supports the British pound
- June 19, 2019 : GBP/JPY demonstrating early signs of bullish recovery. Suggested BUY position to be considered.
- EUR / USD plan for the US session on June 19. Traders took a break and wait for the results of the Fed meeting
- GBP/USD analysis for June 19,.2019
- Technical analysis of USD/CAD for June 19, 2019
- Technical analysis of NZD/USD for May 19, 2019
- Trading Plan 19/06/2019 EURUSD
- Trump's unexpected discovery (review of EUR / USD and GBP / USD on 06/19/2019)
- Simplified wave analysis and forecast for EUR / USD & GBP / USD pairs on June 19
- Bitcoin: Buyers are building new support for continued growth
- Gold votes for Fed independence
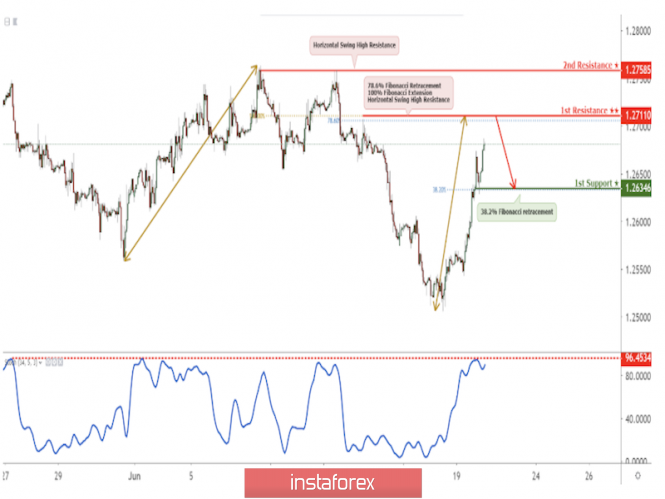
| GBP/USD near resistance, a drop is possible! Posted: 19 Jun 2019 07:58 PM PDT
GBPUSD is near resistance, a drop to 1st support is possible Entry: 1.2711 Why it's good : 100% Fibonacci extension, 78.6% Fibonacci retracement, horizontal swing high resistance Stop Loss : 1.2759 Why it's good :horizontal swing high resistance Take Profit : 1.2635 Why it's good: 38.2% Fibonacci retracement
|
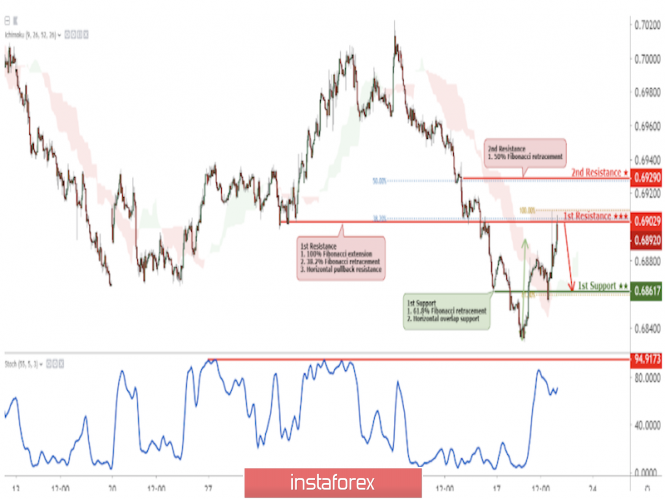
| AUD/USD reversed off resistance, potential reversal! Posted: 19 Jun 2019 07:56 PM PDT
Price reversed off its resistance where we expect to see it drop further to its support at 0.6861. Entry : 0.6902 Why it's good : 38.2% Fibonacci retracement, 100% Fibonacci extension, horizontal overlap resistance Stop Loss : 0.6929 Why it's good : 50% Fibonacci retracement Take Profit : 0.6861 Why it's good : 61.8% Fibonacci retracement, horizontal overlap support
|
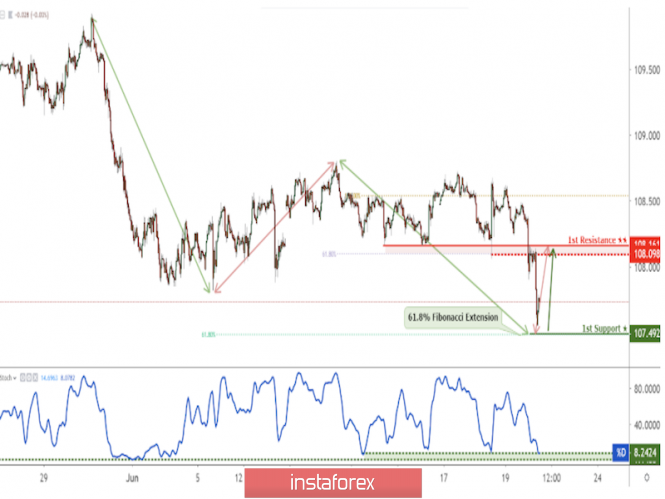
| USD/JPY approaching support, possible bounce! Posted: 19 Jun 2019 07:53 PM PDT
Price is approaching its support where it could potentially bounce up to its resistance at 108.161 Entry : 107.492 Why it's good : 61.8% Fibonacci extension Take Profit : 108.161 Why it's good : 50% Fibonacci retracement, horizontal pullback resistance, 61.8% Fibonacci extension
|
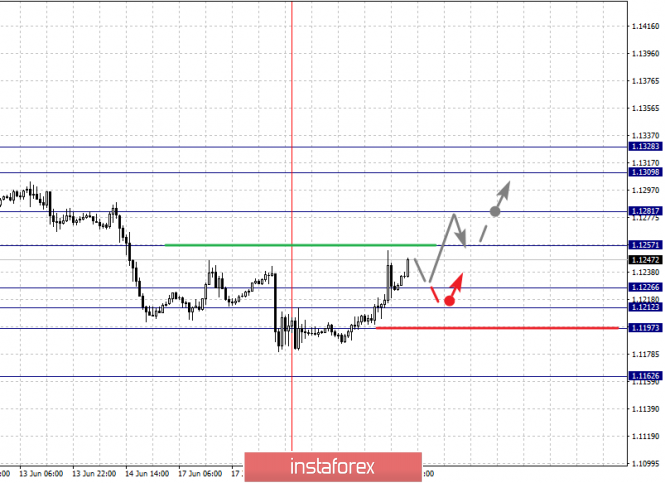
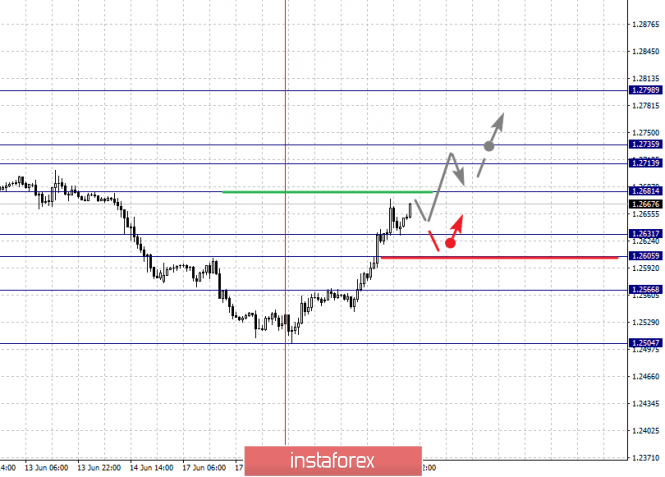
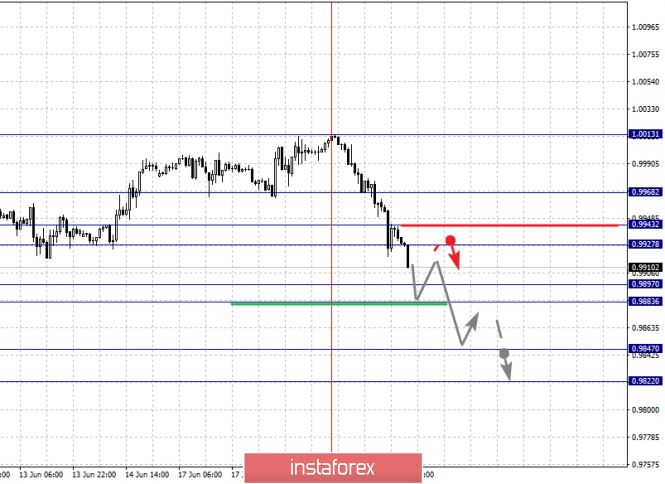
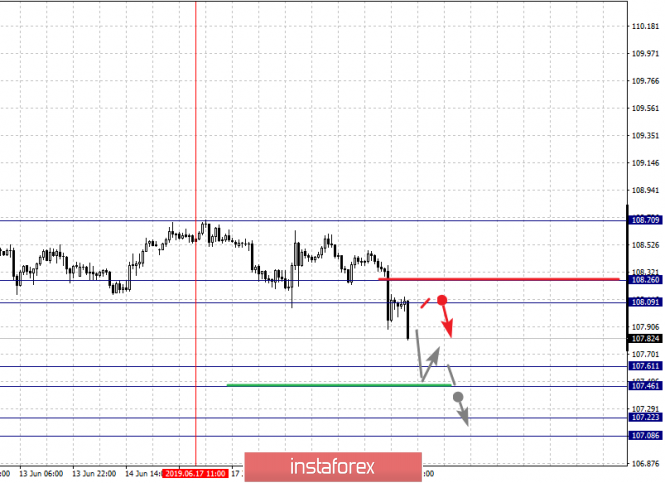
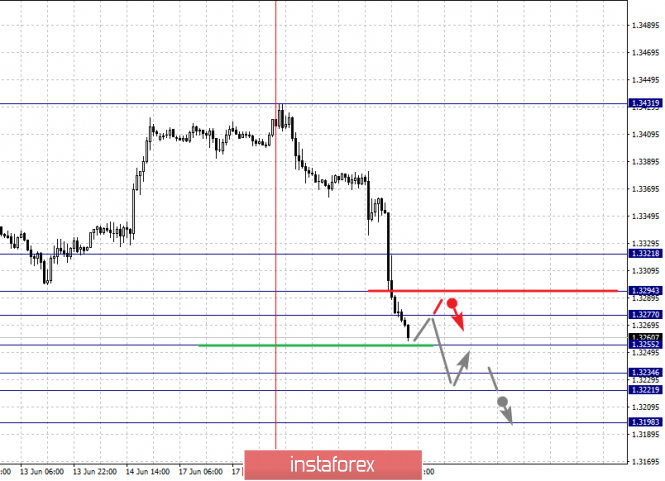
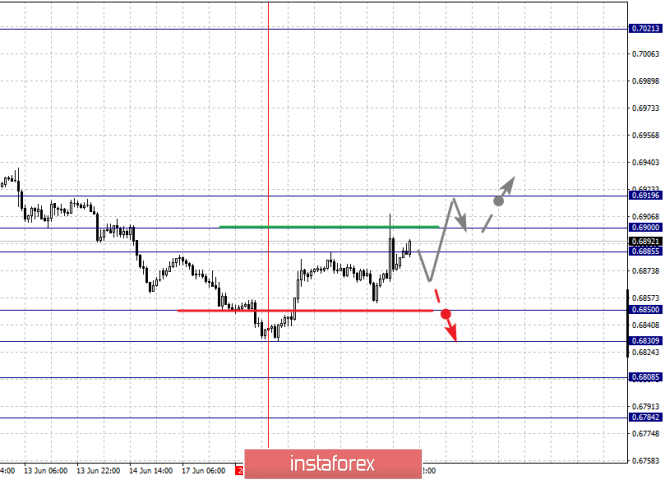
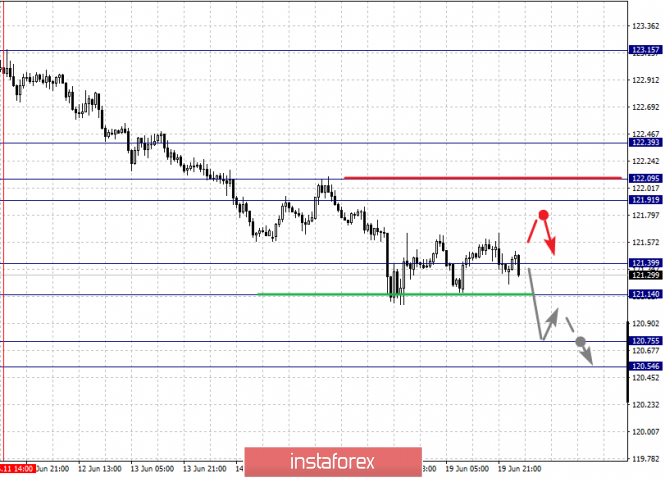
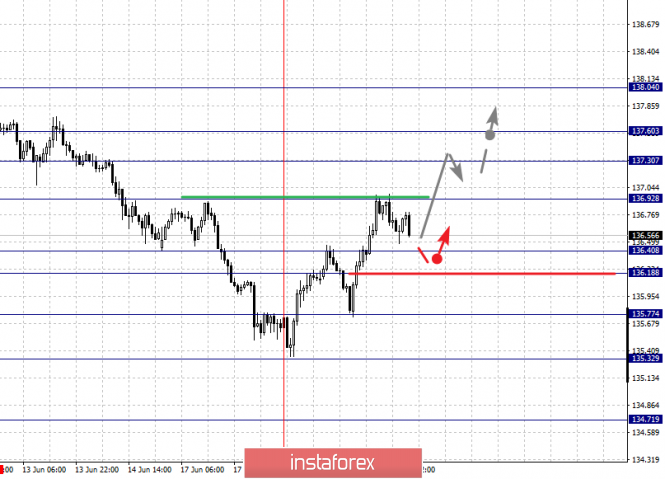
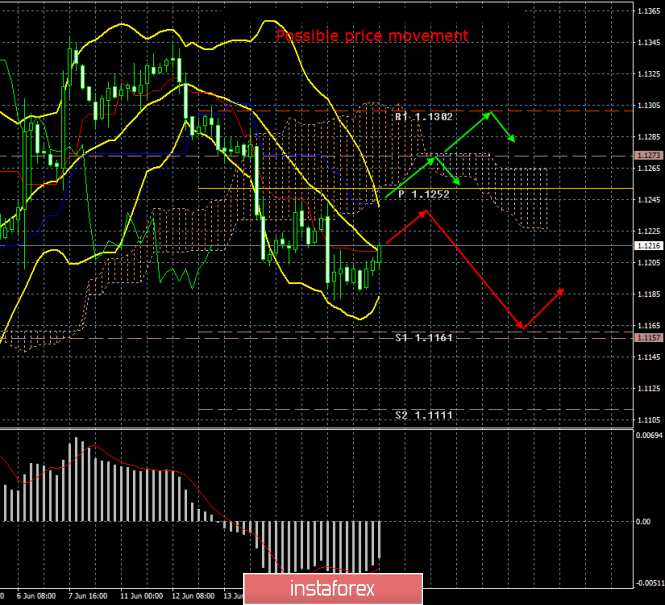
| Fractal analysis of major currency pairs on June 20 Posted: 19 Jun 2019 06:28 PM PDT Forecast for June 20: Analytical review of H1-scale currency pairs: For the euro / dollar pair, the key levels on the H1 scale are: 1.1328, 1.1309, 1.1281, 1.1257, 1.1226, 1.1212, 1.1197 and 1.1162. Here, the price forms the potential for upward movement from June 16. The continuation of the movement to the top is expected after the breakdown of the level of 1.1257. In this case, the goal is 1.1281, wherein consolidation is near this level. The breakdown of the level 1.1282 will lead to the development of a pronounced movement. Here, the goal is 1.1309. For the potential value for the top, we consider the level of 1.1328. After reaching which, we expect a consolidation, as well as a rollback to the bottom. Short-term downward movement is possible in the range of 1.1226 - 1.1212. The breakdown of the latter value will lead to in-depth correction. Here, the goal is 1.1197. This level is a key support for the top. Its price will have a downward trend. In this case, the potential goal is 1.1162. The main trend - the formation of potential for the top of June 18. Trading recommendations: Buy 1.1257 Take profit: 1.1280 Buy 1.1283 Take profit: 1.1309 Sell: 1.1226 Take profit: 1.1212 Sell: 1.1196 Take profit: 1.1162 For the pound / dollar pair, the key levels on the H1 scale are: 1.2798, 1.2735, 1.2713, 1.2681, 1.2631, 1.2605 and 1.2566. Here, the price forms the expressed initial conditions for the top of June 18. The continuation of the movement to the top is expected after the breakdown of the level of 1.2681. In this case, the target is 1.2713, wherein consolidation is near this level. The price passage of the noise range 1.2713 - 1.2735 should be accompanied by a pronounced upward movement. Here, the potential target is 1.2798. Upon reaching this level, we expect a rollback to the bottom. Short-term downward movement is expected in the range of 1.2631 - 1.2605. The breakdown of the last value will lead to a prolonged correction. Here, the target is 1.2566. This level is a key support for the top. Its price will have a downward trend. In this case, the potential target is 1.2504. The main trend is the formation of initial conditions for the top of June 18. Trading recommendations: Buy: 1.2681 Take profit: 1.2713 Buy: 1.2736 Take profit: 1.2796 Sell: 1.2630 Take profit: 1.2606 Sell: 1.2603 Take profit: 1.2568 For the dollar / franc pair, the key levels on the H1 scale are: 0.9968, 0.9943, 0.9927, 0.9897, 0.9883, 0.9847 and 0.9822. Here, the price forms the potential for the downward cycle of June 19th. The continuation of the movement to the bottom is expected after the price passes the noise range of 0.9897 - 0.9883. In this case, the goal is 0.9847. For the potential value for the bottom, we consider the level of 0.9822. After reaching which, we expect consolidation, as well as rollback to the top. Short-term upward movement is possible in the range of 0.9927 - 0.9943. The breakdown of the latter value will lead to the development of a protracted correction. Here, the target is 0.9968. This level is a key support for the downward structure. The main trend is the formation of the potential for the downward movement of June 19. Trading recommendations: Buy : 0.9927 Take profit: 0.9942 Buy : 0.9945 Take profit: 0.9966 Sell: 0.9883 Take profit: 0.9850 Sell: 0.9845 Take profit: 0.9824 For the dollar / yen pair, the key levels on the scale are : 108.70, 108.26, 108.09, 107.61, 107.46, 107.22 and 107.08. Here, we follow the development of the downward structure of June 17. The continuation of the movement to the bottom is expected after the price passes the noise range 107.61 - 107.46. In this case, the goal is 107.22. Price consolidation is in the range of 107.22 - 107.08. Hence, the probability of a rollback to the correction is also high. The range of 108.09 - 108.26 is a key support for the downward structure. Its price passage will have to form the potential for the upward cycle. In this case, the potential target is 108.70. The main trend: the downward cycle of June 17. Trading recommendations: Buy: 108.09 Take profit: 108.24 Buy : 108.28 Take profit: 108.70 Sell: 107.61 Take profit: 107.47 Sell: 107.44 Take profit: 107.22 For the Canadian dollar / US dollar pair, the key levels on the H1 scale are: 1.3321, 1.3294, 1.3277, 1.3255, 1.3234, 1.3221 and 1.3198. Here, we are following the development of the downward structure of June 18. The continuation of the movement to the bottom is expected after the breakdown of the level of 1.3255. In this case, the target is 1.3234. Meanwhile, in the range of 1.3234 - 1.3221, there is a price consolidation. For the potential value for the bottom, we consider the level of 1.3198. After reaching which, we expect a rollback to the top. Short-term upward movement is possible in the range of 1.3277 - 1.3294. The breakdown of the latter value will lead to a prolonged correction. Here, the target is 1.3321. This level is a key support for the downward structure. The main trend - the downward structure of June 18. Trading recommendations: Buy: 1.3277 Take profit: 1.3294 Buy : 1.3295 Take profit: 1.3320 Sell: 1.3253 Take profit: 1.3234 Sell: 1.3220 Take profit: 1.3198 For the pair Australian dollar / US dollar, the key levels on the H1 scale are : 0.6919, 0.6900, 0.6885, 0.6849, 0.6830, 0.6808 and 0.6784. Here, the price forms the potential for the top of June 18th. The consolidated movement is expected in the range of 0.6885 - 0.6900. The breakdown of the last value will begin the development of the ascending structure on the scale of H1. In this case, the potential target is 0.6919. The continuation of the movement to the bottom is expected after the breakdown of the level of 0.6830. In this case, the goal is 0.6808, wherein consolidation is near this level. For the potential value for the bottom, we consider the level of 0.6784. After reaching which, we expect a rollback to the top. The main trend - the formation of potential for the top of June 18. Trading recommendations: Buy: Take profit: Buy: 0.6902 Take profit: 0.6919 Sell : 0.6849 Take profit : 0.6832 Sell: 0.6829 Take profit: 0.6808 For the euro / yen pair, the key levels on the H1 scale are: 122.39, 122.09, 121.91, 121.39, 121.14, 120.75 and 120.54. Here, we continue to follow the development of the downward cycle of June 11. The continuation of the movement to the bottom is expected after the breakdown of the level of 121.39. In this case, the target is 121.14, wherein consolidation is near this level. The breakdown of the level of 121.14 must be accompanied by a pronounced downward movement. Here, the goal is 120.75. For the potential value for the bottom, we consider the level of 120.54. After reaching which, we expect a consolidation, as well as a departure to the correction. Short-term upward movement is expected in the range of 121.91 - 122.09. The breakdown of the last value will lead to a prolonged correction. Here, the goal is 122.39. This level is a key support for the downward structure. The main trend is the development of the downward structure of June 11. Trading recommendations: Buy: 121.91 Take profit: 122.09 Buy: 122.11 Take profit: 122.37 Sell: 121.39 Take profit: 121.18 Sell: 121.12 Take profit: 120.77 For the pound / yen pair, the key levels on the H1 scale are : 138.04, 137.60, 137.30, 136.92, 136.40, 136.18, 135.77 and 135.32. Here, we monitor the formation of the potential for the top of June 18. The continuation of the movement to the top is expected after the breakdown of the level of 136.92. In this case, the goal is 137.30. Meanwhile, in the range of 137.30 - 137.60, there is a short-term upward movement, as well as consolidation. For the potential value for the top, we consider the level of 138.04. The movement to which is expected after the breakdown of the level of 137.60. Short-term downward movement is possible in the range of 136.40 - 136.18. The breakdown of the latter value will lead to a prolonged correction. Here, the goal is 135.77. This level is a key support for the top. Its price passage will count on movement towards the first goal for the downward movement 135.32. The main trend - the formation of potential for the top of June 18. Trading recommendations: Buy: 136.92 Take profit: 137.30 Buy: 137.32 Take profit: 137.60 Sell: 136.18 Take profit: 135.80 Sell: 135.75 Take profit: 135.33 The material has been provided by InstaForex Company - www.instaforex.com |
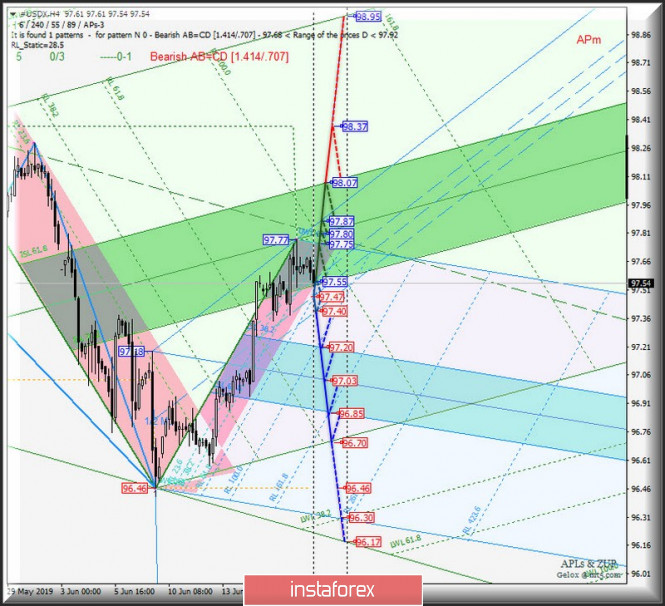
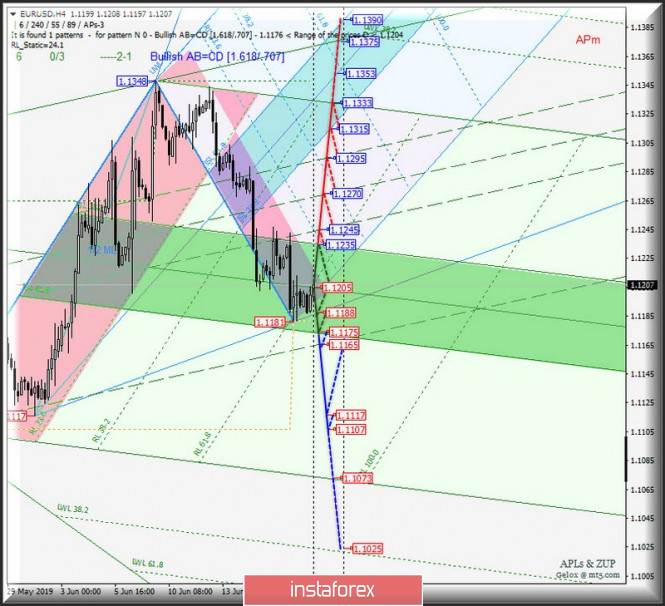
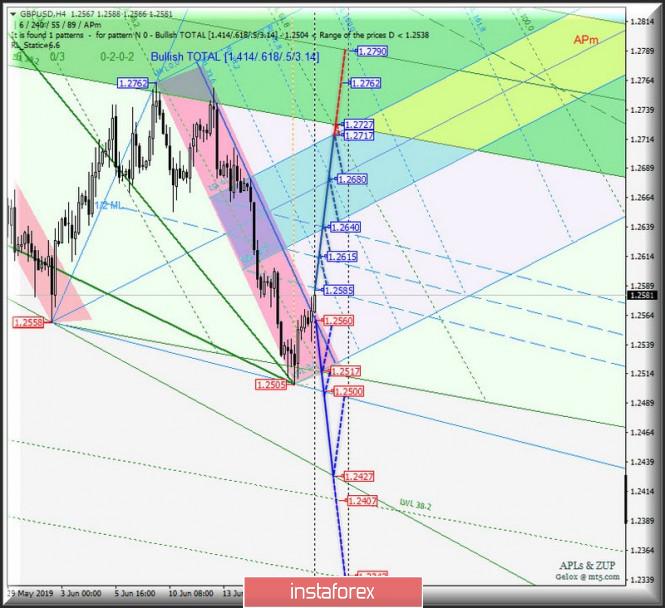
| Posted: 19 Jun 2019 05:15 PM PDT We prepare a comprehensive analysis of movement options of the main currency instruments EUR / USD h4 vs #USDX h4 vs GBP / USD H4 from June 20, 2019. Minuette (h4) operating scale ____________________ US Dollar Index From June 20, 2019, the development of the dollar index movements #USDX will be determined by working off and the direction of the breakdown of the boundaries of the channel of the 1/2 Median Line (97.55 <-> 97.47 <-> 97.40) Minuette operational scale fork. The breakdown of the lower boundary (the level of support 97.40) channel of the 1/2 Median Line Minuette make urgent continuation of the downward movement of the dollar index to the boundaries of the equilibrium zone (97.20 <-> 97.03 <-> 96.85) Minuette operational scale fork with a view to achieving the initial line of the SSL (96.70) Minuette operational scale fork. In the case of #USDX returning above the resistance level of 97.55 (the upper boundary of the 1/2 Median Line channel is at the Minuette operating scale), the development of the #USDX movement will begin again within the equilibrium zone (97.55 <-> 97.80 <-> 98.07) of the Minuette operational scale, and if the breakdown of ISL61.8 Minute (98.07) happens, then the dollar index movement can continue to maximum 98.37. Details of the movement of the #USDX can be seen at the chart. ____________________ Euro vs US Dollar From June 20, 2019, the development of the movement of the single European currency EUR / USD will most likely continue in the equilibrium zone (1.1175 <-> 1.1205 <-> 1.1235) of the Minuette operational scale (we look at the details on the chart), but there may be other options that we consider below: -> The breakdown of the upper boundary of ISL38.2 (resistance level of 1.1235) of the balance zone of the Minuette operational scale fork with subsequent breakdown of the resistance level of 1.1245 will determine the movement of the single European currency within the boundaries of the channel of the 1/2 Median Line Minute (1.1245 <-> 1.1270 <-> 1.1295) with the prospect of reaching the lower boundary of the ISL38.2 (1.1315) equilibrium zone of the Minuette operating scale fork and the initial line SSL Minute (1.1333). -> When sharing the breakdown of the level of resistance of 1.1175 (the lower boundary of the ISL61.8 balance scale Minuette operational zone fork) and the final Line Schiff Minuette (1.1165) will probably be a continuation of the downward movement of EUR / USD to the local minimums (1.1117 <-> 1.1107). The details of the EUR / USD movement are presented in the chart. ____________________ Great Britain Pound vs US Dollar On the other hand, the development of the movement of Her Majesty's currency GBP / USD from June 20, 2019 will be determined by the direction of the range breakdown : -> resistance level of 1.2585 (lower boundary of the 1/2 Median Line channel Minuette); -> support level of 1.2560 (reaction line RL23.6 Minuette operating scale fork). In the case of the breakdown of the level of resistance of 1.2585, the development movement of GBP / USD will continue within the boundaries of the channel of the 1/2 Median Line (1.2585 <-> 1.2615 <-> 1.2640) and the equilibrium zone (1.2640 <-> 1.2680 <-> 1.2717) Minuette operational scale fork. The breakdown of the line reaction RL23.6 Minuette (level of support 1.2560) -> the resumption of the downward movement of this currency instrument to targets -> level of support 1.2517 (the intersection of the primary lines SSL Minute and the SSL Minuette) <-> control line LTL Minuette (1.2500) <- > LTL control line (1.2427) of the Minuette operational scale fork. Details of the GBP / USD movement are presented in the chart. The review was compiled without taking into account of the news background. The opening of trading sessions of the main financial centers does not serve as a guide to action (placing orders "sell" or "buy"). The formula for calculating the dollar index is: USDX = 50.14348112 * USDEUR0.576 * USDJPY0.136 * USDGBP0.119 * USDCAD0.091 * USDSEK0.042 * USDCHF0.036. where power ratios correspond to the weights of currencies in the basket: Euro - 57.6%; Yen - 13.6%; Pound sterling - 11.9%; Canadian dollar - 9.1%; Swedish krona - 4.2%; Swiss franc - 3.6%. The first coefficient in the formula gives the index value to 100 on the starting date - March 1973, when the main currencies began to be freely quoted relative to each other. The material has been provided by InstaForex Company - www.instaforex.com |
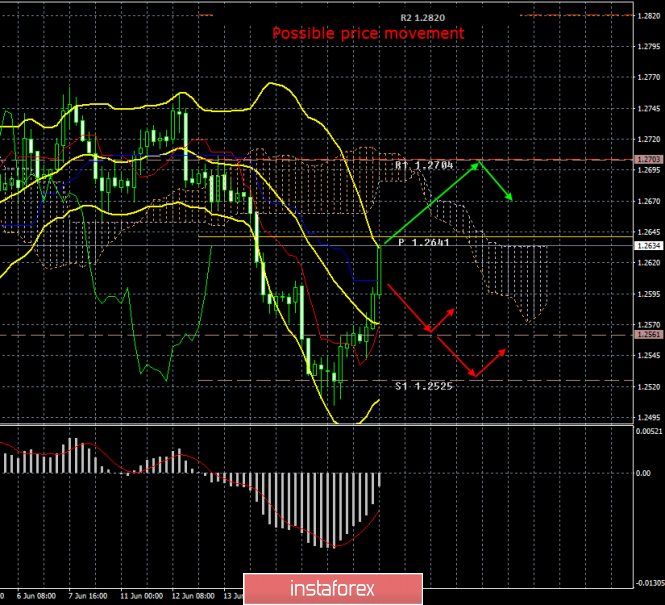
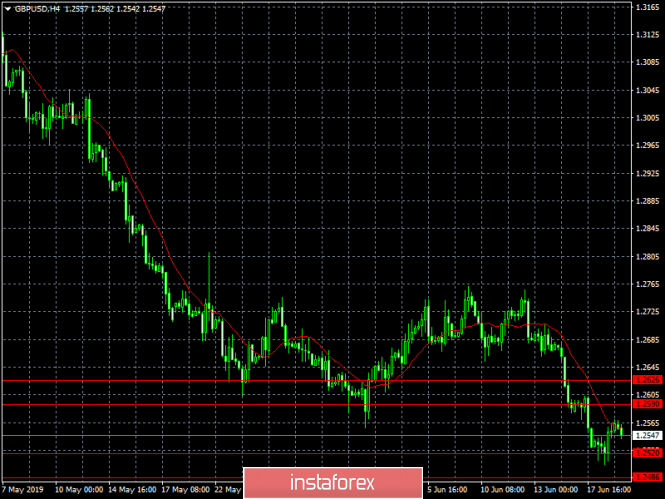
| GBP/USD. June 19. Results of the day. Boris Johnson receives additional support from Dominic Raab Posted: 19 Jun 2019 04:36 PM PDT 4-hour timeframe The amplitude of the last 5 days (high-low): 77p - 46p - 102p - 76p - 59p. Average amplitude for the last 5 days: 72p (73p). The British pound sterling shows an enviable growth against the US currency on the eve of the announcement of the results of the Fed meeting and the speech of Jerome Powell. It is even difficult to assume what has caused such a sharp strengthening of the British currency, which has lately been falling almost non-stop. No encouraging news on Brexit has been reported to the press today. In the UK today, Boris Johnson won the second round of elections for the prime minister post and immediately received the support of Dominic Raab, ex-Minister for Brexit issues, who said that now the only candidate who can provide Brexit until October 31 is Johnson. By the end of May, inflation in the UK slowed down to 2.0% y/y, which is fully consistent with the forecast values. Thus, at the moment we see no weighty reasons for the market to make such strong purchases of the British pound. On the other hand, perhaps it's not a matter of buying the pound sterling, but rather closing short positions before the results of the FOMC meeting are released. Traders got bogged down in dollar positions lately, but before such an important event as the Fed meeting, waiting for a dovish rhetoric from Powell, they began to simply close their shorts. That is what led to an impressive increase in the pound. Such an explanation seems most plausible to us. Now the only thing that remains is to figure out how the market will react to evening events. The rate is unlikely to be changed today. Traders do not react to the words of Donald Trump, in which he criticizes Powell, Draghi and the Bank of China for not adhering to the right US monetary policy. Thus, it remains to be seen whether the rate cut will be announced today in 2019, what will be the forecasts for the main macroeconomic indicators for 2019-2020 and what Powell will be in tune with. The more dovish he is, the more likely it is that the pound will strengthen. However, everything could be different here: as the pound rises in price in the morning, if the assumption of a dovish rhetoric turns out to be true, then the market will have nothing to react to. Thus, the market has already worked out the weakness of Powell's statements in advance. Trading recommendations: The pound/dollar currency pair started a strong correction. The next goal for the short – 1,2561 and 1,2525 and we recommend them to buy long after the Fed meeting, if the pair remains below the Kijun-sen line and will rebound from it. Theoretically, it will be possible to buy the British currency when the pair has consolidated above the Kijun-sen line. However, even taking into account the strong upward movement, the bulls' positions still appears very weak today. In addition to the technical picture should also take into account the fundamental data and the time of their release. Explanation of the illustration: Ichimoku indicator: Tenkan-sen - the red line. Kijun-sen - the blue line. Senkou Span A - light brown dotted line. Senkou Span B - light purple dotted line. Chikou Span - green line. Bollinger Bands indicator: 3 yellow lines. MACD Indicator: Red line and histogram with white bars in the indicator window. The material has been provided by InstaForex Company - www.instaforex.com |
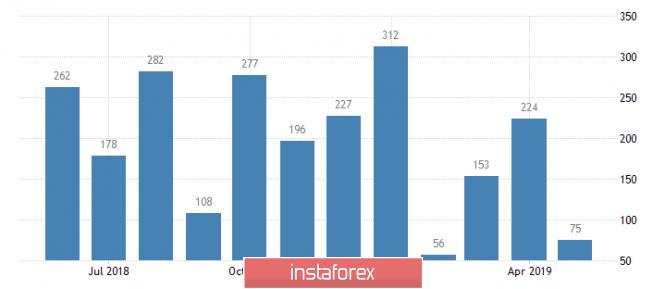
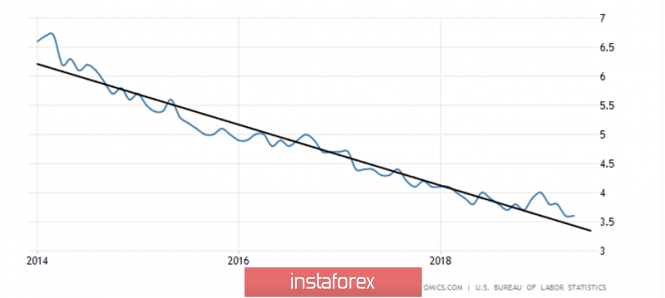
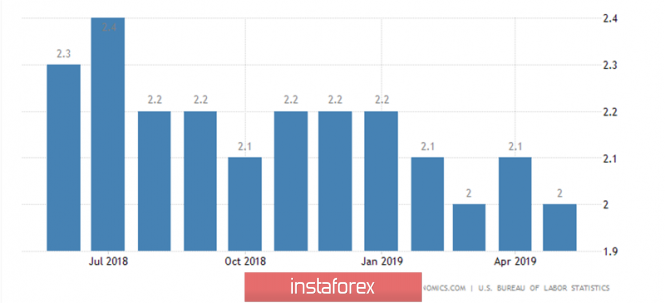
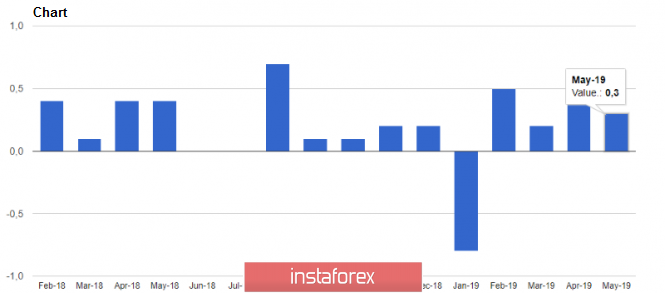
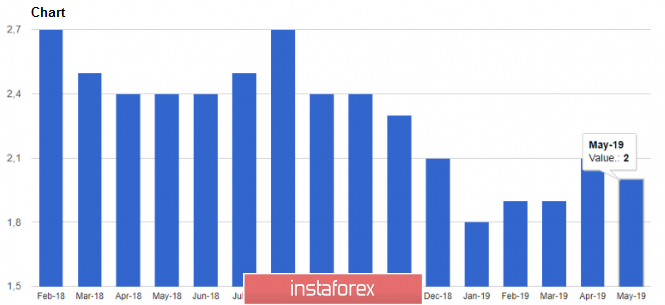
| Posted: 19 Jun 2019 04:08 PM PDT Today, just when there is literally a few hours left before the announcement of the decision of the Federal Open Market Committee of the United States, the title issue is fundamental to understanding what will happen in the markets in the next three months. While one thing is clear - at the current meeting, the key rate will not be lowered. However, the farther into the forest, the thicker the partisans, but still try to sort out this issue. The Fed's actions are regulated by the Federal Reserve Act, where two goals are set as the main objectives: controlling inflation and maintaining employment at high levels. According to this law, inflation targets should be 2% in the medium term, and the unemployment rate should be below 4.5%, although this is an unofficial indicator. Among other factors affecting monetary policy, the US Federal Reserve Committee on Open Market (FOMC) monitors the situation in the stock market, which is the basis of the well-being of the middle class. Also taken into account are other indicators of the economy and monetary circulation, which, although they are important elements of the assessment of the economic situation, still only complement the main objectives. The Committee (FOMC) holds eight meetings per year, of which four meetings are held at the end of each quarter - in March, June, September and December - we call them "main". Four other meetings - in January, April, July and October - fall in the middle of the quarter, we call these meetings "additional". Previously, the "additional" meetings, in contrast to the "main" meetings, were one-day meetings. Later on, these meetings became two days, but were held without a press conference. In 2019, the Fed changed the order of the "additional" meetings, and now after them, as after the "main" meetings, a press conference of the Fed chairman is held, in this case, by Jerome Powell. From 2019, the main difference between the "main" meetings and the "additional" is the publication and voicing of the FOMC forecasts and its view on the economic situation: an employment and inflation forecast is published, GDP growth prospects are given, the views of the future monetary policy committee members "Dot charts". To determine the objectives of the Fed's policy, traders use the FedWatchTool tool from the CME futures exchange, which assesses the likelihood of a rate increase as traders who trade in futures on federal funds see it. According to the indicators of this instrument, traders do not expect a rate increase at the June meeting, 79.2% of them believe that the rate will remain in the current band of 2.25-2.50 percent. But then miracles begin, and 66.5% of traders believe that the rate will be trimmed by 0.25% at the meeting on July 31, another 17.5% believe that the rate will be reduced by 0.5%. Thus, 84% of traders predict a rate reduction at the next meeting! To be honest, I don't really understand this opinion about the current situation, so let's deal with the causes and consequences of this situation. Now, Donald Trump has unprecedented pressure on the Fed, which for some reason does not cause outrage in the United States. Other actions of the US president may infuriate the American press, but not his criticism of Fed Chairman Jerome Powell and interference with the work of the central bank. So, answering the question whether he wants to dismiss the head of the Fed, Trump told reporters on Tuesday: "We'll see what he does!". Earlier, the Trump administration was considering the possibility of Powell's removal from his post, but now, according to the White House's economic adviser Larry Cudlow, the administration is not considering this step. Trump's wishes are, of course, a serious thing, but, unfortunately, for the US president they are not spelled out in the Federal Reserve Act. The law spelled inflation rates and high employment. Let's see what happens with these key indicators. Here is what CNBC writes about this: "Now that the labor market is showing signs of tension, economists and investors firmly believe that the Federal Reserve will begin lowering rates by next month. The economy added only 75,000 jobs in May, which is 100,000 fewer than expected, a sign that the slowdown that is emerging in other parts of the economy currently affects the labor market." The following are the words of the chief economist of the Wilmington Trust: "I think this is a real slowdown in hiring. Sometimes you can neglect monthly volatility a bit, but I think we have enough signs. " Figure 1: Newly created jobs in the United States. Oh, horror, horror, horror! But still look at the data on the newly created jobs. Indeed, only 75 thousand jobs were created in May, but 224 thousand were created in April, 153 thousand in March, 56 thousand in February and 312 thousand in January. The year 2017 created 200 thousand jobs per month, then 175 thousand were created in 2019. However, employment also increased! At the beginning of 2016, unemployment was 5.2%, now its level is 3.6% (Figure 2), and this is already an overheating of the economy. Here it is time to raise the rate, and not to lower it! Fig.2: Unemployment in the USA Now look at inflation. The core inflation indicator, i.e. excluding food and energy, the Fed uses it to analyze the situation, is now 2% (Fig. 3). The consumer inflation rate is 1.8%, and consumer inflation is now growing, and it has grown from the level of 1.6% since the beginning of the year. This should take into account the fact that consumer inflation has not yet been affected by Donald Trump's actions, who increased duties on Chinese goods. Indeed, there are some rates of slowing inflation, but certainly they are not so terrible that the Fed will take emergency measures. Figure 3: Core inflation Perhaps slowed US GDP growth? Again, no, GDP is growing at a rate of 3.2% per year, and so far no signs of a slowdown have been found. Then maybe the stock market is declining, which is causing concern for the middle class and Wall Street gatekeepers? Again, no! The Dow is just a couple of hundred points away from record highs. The Fed's greatest concern is the inversion of the yield curve in the bond market, when the yield of government treasury bonds with a short maturity becomes higher than the yield of bonds with a longer maturity. Yield inversion is considered a "true" sign of a near recession in the economy, but is this enough for emergency measures? Is it necessary to reduce the rate in July? I think that the Fed can really go for a two-fold rate cut in September and December, but on the whole it is unlikely that it will do it in July. However, here I can be mistaken, the future actions of the Fed are too unequivocally interpreted now. Therefore, it is quite possible that the FOMC will indeed succumb to blackmail from the motley public, which today, like a financial addict, requires money for another dose. In principle, there is no big difference for the Fed, to lower the rate in July or lower it in September. I can assume that in order to avoid problems and quietly go on vacation in August, the Open Market Committee will take such an unconventional step. However, then the Committee should be prepared for the fact that the Fed will demand money at every opportunity, because, according to the markets, the trees should and will grow to the skies! The material has been provided by InstaForex Company - www.instaforex.com |
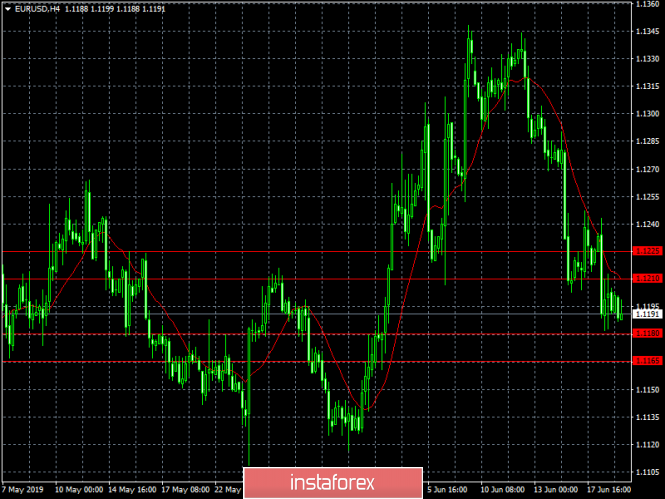
| Posted: 19 Jun 2019 04:08 PM PDT 4-hour timeframe The amplitude of the last 5 days (high-low): 61p - 36p - 86p - 43p - 62p. Average amplitude for the last 5 days: 58p (53p). A few hours ahead of the announcement of whether the key rate of the Fed will change, the European currency rises in price against the US dollar. Right now, Mario Draghi, head of the ECB, is also giving another speech. A day earlier at the ECB forum in Sintra, he had already said that the regulator is ready to lower the key rate, thus bringing it to a negative value, and stimulate the economy with any available tools. Inflation is of a particular concern for Draghi, which was only 1.2% y/y in May. Today, Draghi can also tell traders anything related to monetary policy, but the strengthening of the euro started earlier, so we can conclude that traders expect a negative today, first of all, from the Federal Reserve. Indeed, after a whole year of Donald Trump's pressure on Jerome Powell, the Fed Chairman finally admits a reduction in the key rate. This idea was immediately picked up by the markets, as they treat this as an accomplished action, and only the timing of the decline remains unknown. However, we believe that it is too early to wait for the Fed to weaken monetary policy. Firstly, Powell can not go as fast in the wake of Trump. Secondly, although macroeconomic statistics has been extremely weak in recent weeks, this is not a reason to talk about recession. In any case, in a few hours we will find out what Jerome Powell's rhetoric is, which is likely to remain dovish. The only question is how dovish will he be? The rate at the end of today's meeting is unlikely to change. Thus, all attention is on the Powell press conference. Trading recommendations: EUR/USD started a new round of upward correction. Thus, we recommend that you sell the euro to the level of 1.1161, but when opening new sell-positions we recommend to wait until the end of the Fed's press conference. It will be possible to buy the euro/dollar pair if traders manage to gain a foothold above the critical line, with the first targets of 1.1273 and 1.1302. In this case, the initiative on the EUR/USD will be back in the hands of the bulls. In addition to the technical picture should also take into account the fundamental data and the time of their release. Explanation of the illustration: Ichimoku indicator: Tenkan-sen - the red line. Kijun-sen - the blue line. Senkou Span A - light brown dotted line. Senkou Span B - light purple dotted line. Chikou Span - green line. Bollinger Bands indicator: 3 yellow lines. MACD Indicator: Red line and histogram with white bars in the indicator window. The material has been provided by InstaForex Company - www.instaforex.com |
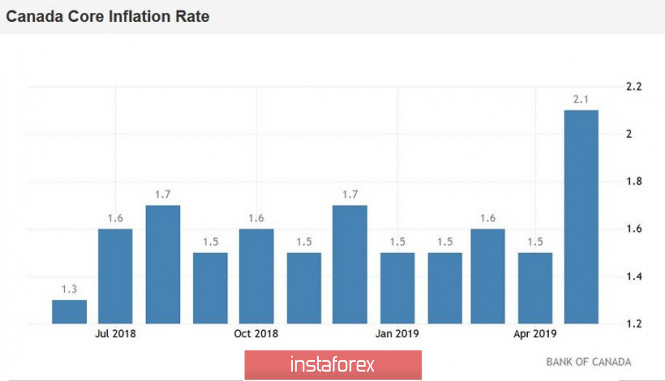
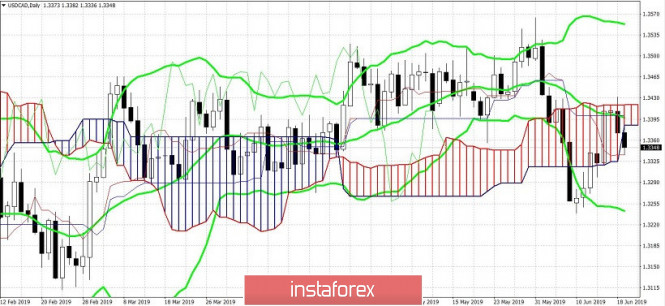
| USD/CAD. The Canadian dollar spreads its wings, but the downward trend is in the hands of the Fed Posted: 19 Jun 2019 03:31 PM PDT Today, the Canadian dollar received significant support after the release of inflation data in the country. Contrary to contradictory forecasts, the consumer price index was in the "green zone", exceeding the forecast values. This fact returned confidence to the USD/CAD pair, after which the loonie returned to the bottom of the 33rd figure. The situation is as follows in terms of numbers. On a monthly basis, inflation remained at the level of April (0.4%), while most experts predicted a decline to 0.1% (some of them did not rule out a decline in the negative area). In annual terms, the CPI jumped immediately to 2.4%. By the way, this is the strongest growth dynamics since October last year, while the indicator has consistently increased for the fourth month in a row. Especially surprised by core inflation. In monthly terms, the index came out of the negative area and reached 0.4% (the best result since February of this year). But on an annualized basis, the indicator shot immediately to 2.1%, with a forecast of growth to 1.2% (the previous value of the indicator is 1.5%). It is worth noting that the last time such an increase was recorded was in August 2016. The structure of the indicators suggests that prices rose for all major components, whereas in six categories, growth accelerated. In particular, the cost of durable goods increased by 2.5%, for food products - by 3.5%, for transport - by 3.1%. In general, today's results have exceeded the most courageous and optimistic forecasts of experts. Let me remind you that in the last quarterly report of the Canadian central bank, which was published in April, the regulator raised its forecast for consumer inflation from 1.7% to 1.9%. Thus, the figures published today significantly exceeded not only the forecasts of experts, but also the forecasts of the central bank. In many ways, these results offset the fears of traders that the Bank of Canada would stand on a par with the RBA, the RBNZ, the Fed and the ECB, whose members either began to ease monetary policy or expressed readiness for such a step. It should be noted here that the next meeting of the Canadian regulator will take place on July 10, therefore members of the central bank of Canada can watch the events taking place "from the podium" - in contrast to the US Fed, whose members are forced to orient market participants now, in a contradictory fundamental background. But the fundamental picture is indeed controversial - including for the Canadian dollar. Donald Trump, who announced yesterday a meeting with his colleague from China, had a significant impact on the mood of traders. Demand for defensive assets decreased, and risky and commodity currencies to some extent resumed growth. Xi Jinping, commenting on the telephone conversation with Trump, noted that the escalation of the trade conflict "is not in the interests of both parties," so the parties will hold preliminary talks before the G-20 summit. The decline in anti-risk sentiment coincided with the growth of the oil market: a barrel of Brent crude traded within the range of 60-62 dollars, and today oil traders even tried to overcome the upper limit of the price range. At the same time, WTI futures on electronic trading on the New York Mercantile Exchange rose by 3.9% to $54 per barrel. Actually, the growth of the oil market is also based on optimism about the resumption of trade negotiations between the United States and China. After a multi-week period of whipping up the situation, an unexpected "thaw" in the relations of the two superpowers has a strong influence on both the foreign exchange market and the commodity market. But in the context of the USD/CAD pair, this "thaw" plays a slightly different role. After all, the renewed contacts between Beijing and Washington at the level of top state officials can also affect the rhetoric of the US regulator. Here it is worth remembering that until yesterday, the market was 80-85% certain of the Fed rate cut at the July meeting. If the Fed maintains the status quo and/or takes a more "hawkish" position than traders expect, the US dollar can fire across the entire market, including paired with Canadian currency. It is this factor that stopped USD/CAD bears at 1.3333 (Tenkan-sen line on the daily chart), interrupting the downward impulse. Thus, the further dynamics of the loonie depend on the position of the US Federal Reserve. If Jerome Powell decides to follow general market expectations, the greenback will weaken against a basket of major currencies and the USD/CAD pair can move further down to the level of 1.3250 (the bottom line of the Bollinger Bands indicator on the daily chart), which acts as a support level. Otherwise, we expect a price rebound at least to the upper boundary of the Kumo cloud on D1 - a price of 1.3420. The material has been provided by InstaForex Company - www.instaforex.com |
| June 19, 2019 : EUR/USD maintains short-term bullish outlook above 1.1175. Posted: 19 Jun 2019 09:27 AM PDT
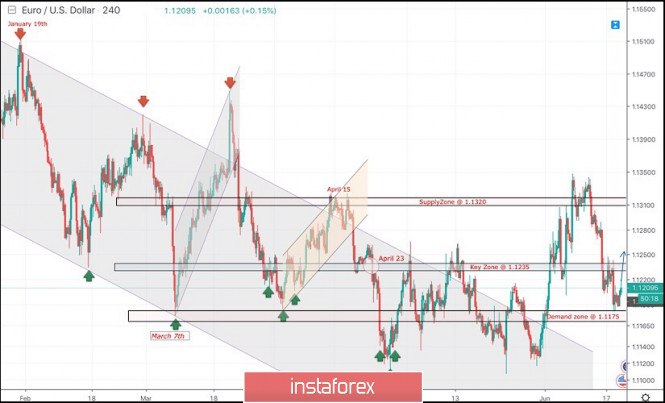
Since January 19th, the EURUSD pair has been moving within the depicted channel with slight bearish tendency. Short-term outlook turned to become bearish towards 1.1175 (a previous weekly bottom which has been holding prices above for some time. On the period between May 17th and June 5th, a bearish breakdown below 1.1175 was temporarily achieved. As expected, further bearish decline was expected towards 1.1115 where significant bullish recovery was demonstrated bringing the EUR/USD pair back above 1.1175 demonstrating a significant bullish breakout off the depicted bearish channel. Short-term outlook remains positive/bullish as long as bullish persistence above 1.1175 (Demand-Zone) is maintained on the H4 chart. Although Temporary Bullish breakout above 1.1320 was initially demonstrated (suggesting a high probability bullish continuation pattern), Recently, The EURUSD pair has failed to maintain bullish persistence above 1.1320 - 1.1290 (Neckline of the double-top pattern) followed by a quick breakdown below the next key-zone around 1.1235. This triggered a deeper bearish pullback towards 1.1200-1.1175 where price action and possible bullish rejection scenario remains expected. On the other hand, any bearish decline below 1.1175 opens the way directly towards 1.1115 invalidating the mentioned bullishscenario. Trade recommendations : Intraday traders should wait for a bullish breakout above 1.1235 as a valid BUY signal. Initial Target levels to be located around 1.1320 and 1.1390. Bearish breakdown below 1.1175 invalidates the current bullish scenario. The material has been provided by InstaForex Company - www.instaforex.com |
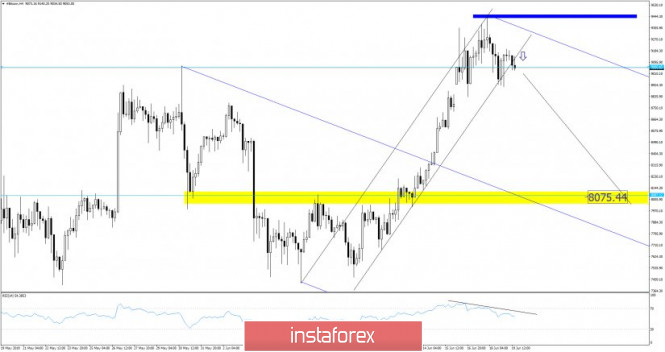
| Bitcoin analysis for June, 19.2019 Posted: 19 Jun 2019 08:12 AM PDT BRC bulls are unable to trade above the resistance at $9.444 and bears reacted. At current market conditions I prefer to be bearish since there is the breakout of upward channel.. With FOMC today my advice is to define proper risk control before you make any trade.
Black lines – Upward channel (broken) Blue rectangle – Major resistance Yellow rectangle – Support Blue lines – Downward Pitchfork channel BTC did break the upward channel and on the way it confirmed that bears took control from bulls. The RSI oscillator showed the bearish divergence, which is another great confirmation that there is potential downward movement in the next period. I did placed Pitchfork lines to see where the BTC can go down. The level of $8.075 seems like a good place to scale position. Only if I see breakout of the $9.444, I would watch for potential buying opportunities. The material has been provided by InstaForex Company - www.instaforex.com |
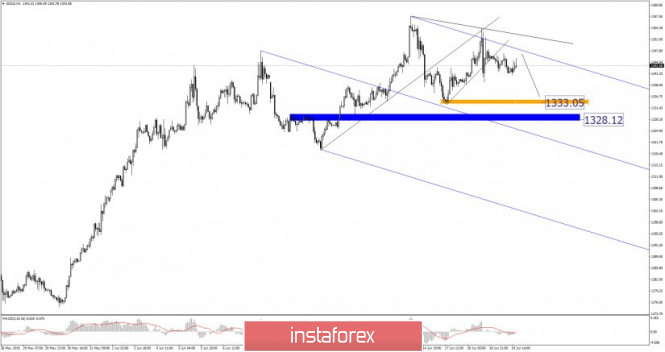
| Analysis of Gold for June 19,.2019 Posted: 19 Jun 2019 07:54 AM PDT Gold bulls are unable to trade above the resistance at $1.357 and bears reacted. At current market conditions I prefer to be neutral to bearish since the price inside of the downward channels. With FOMC today my advice is to define proper risk control before you make any trade.
Blue lines – Pitchfork downward channel Orange rectangle - Support Blue rectangle – Support 2 Black downward sloping line - Resistance Gold is trading inside of the downward sloping channel, which is sign that bears are in control. Key resistance is set at the price of $1.357 and as long as the Gold is trading below that level, I would watch for selling opportunities. Support levels are seen at the price of $1.333 and $1.328. Only if you see breakout of $1.357, watch for potential long positions. The material has been provided by InstaForex Company - www.instaforex.com |
| Posted: 19 Jun 2019 07:51 AM PDT
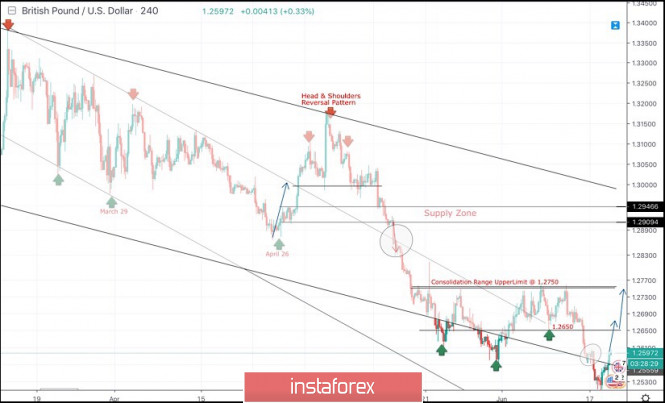
On March 29, a visit towards the price levels of 1.2980 (the lower limit of the newly-established bearish movement channel) could push the GBPUSD pair again towards the upper limit of the minor bearish channel around (1.3160-1.3180). Since then, Short-term outlook has turned into bearish within the depicted movement channel with intermediate-term bearish target near 1.2850. On April 26, another bullish pullback was initiated towards the price zone of 1.3130-1.3170 where the depicted bearish Head and Shoulders reversal pattern was demonstrated on the H4 chart with neckline located around 1.2980-1.3020. Bearish breakdown below 1.2980 allowed the recent significant bearish movement to occur towards the lower limit of the long-term channel around (1.2700-1.2650) where temporary bullish rejection was expressed. Shortly after, temporary bullish breakout above 1.2650 was demonstrated for a few trading sessions. This enhanced the bullish side of the market towards 1.2750 which prevented further bullish advancement. Moreover, recent bearish decline below 1.2600 was demonstrated on Friday thus invalidating the mentioned bullish scenario for the short-term. As long as bearish persistence below 1.2650 is maintained on H4 chart, further bearish decline should be expected towards 1.2535 then 1.2485. SELL positions shouldn't be considered at such low price levels unless bearish breakout below 1.2570 becomes confirmed on higher timeframes (low probability). For the bullish side of the market to regain dominance, a quick bullish breakout above 1.2650 is mandatory. Otherwise, the mentioned bearish targets shall be visited soon. Trade Recommendations: Conservative traders should wait for a valid BUY entry upon bullish breakout above 1.2650. T/P levels to be located around 1.2750, 1.2820, 1.2900 and 1.2940. S/L should be placed below 1.2600. The material has been provided by InstaForex Company - www.instaforex.com |
| Posted: 19 Jun 2019 07:42 AM PDT The British pound strengthened slightly against the US dollar on Wednesday in the first half of the day after the release of the report, which showed that the level of inflation in the UK corresponds to the target value of the Bank of England and there is no cause for concern yet. On the one hand, good inflation leaves a wide margin for the actions of the British regulator in the event of slowing economic growth. On the other hand, raising interest rates to curb inflationary pressures, if necessary, will also help British pound buyers. According to the Agency of Statistics, the CPI UK consumer price index increased by 0.3% in May 2019 compared with April. On an annualized basis, March inflation remained at 2.0%, which coincides with the target level of the Bank of England. As for core inflation, it is also within acceptable limits. Prices excluding volatile categories in the UK rose by 0.2% in May compared with April and by 1.7% per annum. The main annual growth was recorded in the retail price index, which added 3.0%. The UK Output PPI producer selling price index rose 0.3% and 1.8% respectively in May, while the input price index of manufacturers PPI Input in the UK in may remained unchanged and increased by 1.3% per annum. The data almost coincided with the forecasts of economists, who expected that inflation in the UK would be 2.1%. The British pound strengthened its position, as the Bank of England is unlikely to signal a possible reduction in interest rates amid uncertainty about Brexit. However, regulators in other countries, particularly the European Central Bank and the US Federal Reserve, are going to get back on the path of soft monetary policy, which will support the British pound in the medium term. As for the technical picture of the GBP/USD pair, the further upward trend in the pound will depend entirely on the statements made by the Fed today. A break of resistance around 1.2605 will lead to a larger upward correction and the update of the highs of the 1.2650 and 1.2690 areas. On the other hand, maintaining the former approach of the Fed to interest rates will increase the pressure on the pound, which will lead to a breakthrough of support for 1.2540 and a bigger sale of the trading instrument to the lows of 1.2490 and 1.2405. As for the technical picture of the EUR/USD pair, it remained unchanged. The further direction of the market will depend entirely on today's Fed decision on interest rates. Although none of the economists expects rates to be lowered at this meeting, the committee may declare monetary policy easing in the future, which will hit the US dollar and support the euro. If the Fed chairman is quite sharp in his statements, the short-term demand for the euro may return, which will allow the bulls to break through the resistance of 1.1240 and update the highs around 1.1290 and 1.1340. A break of support at 1.1180 will increase the pressure on risky assets and will lead to updating of the next lows in the area of 1.1140 and 1.1080. The material has been provided by InstaForex Company - www.instaforex.com |
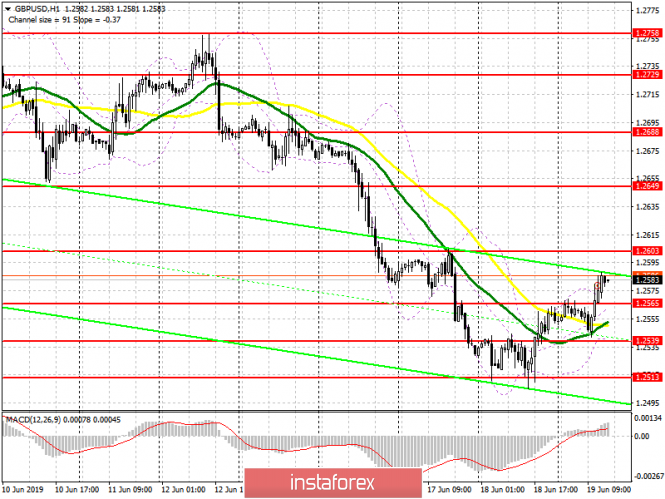
| GBP / USD plan for the US session on June 19. Inflation supports the British pound Posted: 19 Jun 2019 07:38 AM PDT To open long positions on GBP/USD pair, you need: Inflation data led to an increase in the pound in the first half of the day, as well as fixing above the support of 1.2565. As long as trade will be conducted above this level, the demand for the pound will remain and the Fed report may allow continuing the upward correction in the area of resistance 1.2603 and 1.2649, where I recommend fixing the profit. In the case of a pound decline scenario in the second half of the day, it is best to return to long positions on a false breakdown from a minimum of 1.2539 or to a rebound from a larger support area of 1.2510. To open short positions on GBP/USD pair, you need: Bears will rely on the Fed and to maintain the same policy, which will return the pressure on the pound. The formation of a false breakdown in the area of resistance 1.2603 in the afternoon will be a signal to sell. The main goal of the bears will be to return to the support area of 1.2539 and update the minimum of 1.2513, where I recommend taking profits. Given the GBP/USD growth scenario, it is best to consider short positions on a rebound from a large high of 1.2649. Indicator signals: Moving averages Trade is conducted above 30 and 50 moving averages, however, it is still very early to talk about a trend reversal. Bollinger bands In case of a pair decline, support will be provided by the lower limit of the indicator in the area of 1.2539. Description of indicators MA (moving average) 50 days - yellow MA (moving average) 30 days - green MACD: fast EMA 12, slow EMA 26, SMA 9 Bollinger Bands 20 The material has been provided by InstaForex Company - www.instaforex.com |
| Posted: 19 Jun 2019 07:32 AM PDT
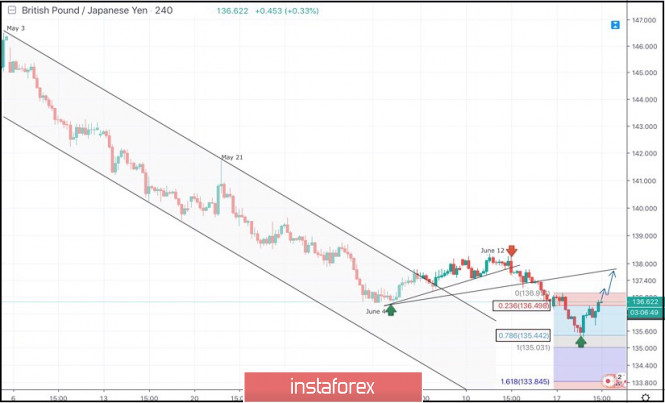
On May 3rd, the GBPJPY pair initiated the depicted bearish movement channel around 146.45 On March 21, another visit towards the upper limit of the same channel (141.70) was demonstrated. Since then, the depicted downtrend/channel has been intact until June 4 when the pair failed to achieve a new low below 136.50. This was followed by a bullish breakout off the depicted bearish channel. Moreover, a short-term uptrend line was established around the same Price levels (136.50) until June 12 when the latest bearish pullback was initiated towards 136.50(23.6% Fibonacci Expansion) then 135.44 (78.6% Fibonacci Expansion). Recently, obvious bullish recovery has been manifested. Bullish persistence above 136.50 is currently being demonstrated on the H4 chart. Technically, a quick bullish advancement should be expected towards 137.80 initially where the backside of the broken uptrend is currently located. On the other hand, H4 re-closure below 136.50 enhances the bearish side of the market towards 135.44 and probably 135.03 for further retesting. Trade Recommendations: Short-term outlook remains bullish as long as bullish persistence above 136.50 is maintained on the H4 chart. Conservative traders can wait for bullish breakout above 136.95 for further confirmation. Initial Target levels should be located around 137.80 and 138.50. Any bearish breakdown below 136.00 invalidates the mentioned bullish scenario. The material has been provided by InstaForex Company - www.instaforex.com |
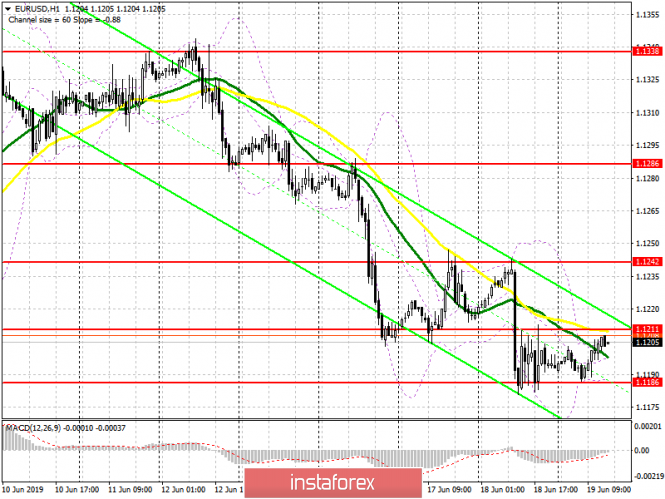
| Posted: 19 Jun 2019 07:09 AM PDT To open long positions on EUR/USD pair, you need: The situation in the morning did not change. Consolidation above 1.1211 resistance is required to return to the buyers' market, which will lead to a larger upward correction in the area of yesterday's maximum of 1.1242 and to its updating in the area of 1.1286, where I recommend fixing profits. However, the entire emphasis will be shifted to the Fed's decision. Therefore, in the case of a pair lowering scenario under the support level of 1.1186, you can take a long look at a rebound from the minimum of 1.1161 and 1.1138. To open short positions on EUR/USD pair, you need: In the second half of the day, the bears will try to break through the support of 1.1186, which will lead to the preservation of the downtrend and the test of the minimums 1.1161 and 1.1138, where I recommend taking profits. If EUR/USD buyers manage to return to the resistance of 1.1211, then it is best to rely on short positions after updating the maximum of 1.1242 or to rebound from a larger level of 1.1286. Indicator signals: Moving averages Trade is conducted in the region of 30 and 50 moving averages, which is typical of the market before the release of important data. Bollinger bands Volatility dropped sharply before the publication of the Fed report. Description of indicators MA (moving average) 50 days - yellow MA (moving average) 30 days - green MACD: fast EMA 12, slow EMA 26, SMA 9 Bollinger Bands 20 The material has been provided by InstaForex Company - www.instaforex.com |
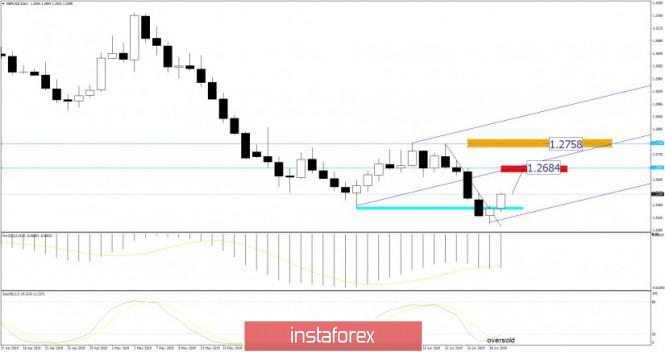
| GBP/USD analysis for June 19,.2019 Posted: 19 Jun 2019 07:08 AM PDT GBPUSD bulls are unable to trade below the support at 1.2557 and bulls reacted and GBP went higher..At current market conditions I prefer to be bullish. With FOMC today my advice is to define proper risk control before you make any trade.
Blue lines – Pitchfork upward channel Blue rectangle - Support Red rectangle – Median channel line and resistance Orange rectangle – Swing high resistance GBPUSD is trading above the blue rectangle support area and inside the upward sloping channel. I found the morning start candle pattern, which is positive sign for further upward movement. As long as price remains above the blue rectangle and inside the upward channel bulls will remain in control of the short-term trend. Upward targets are set at the price of 1.2684 and 1.2758, Additionally, I found that Stochastic is on oversold zone and it is fliping up. The material has been provided by InstaForex Company - www.instaforex.com |
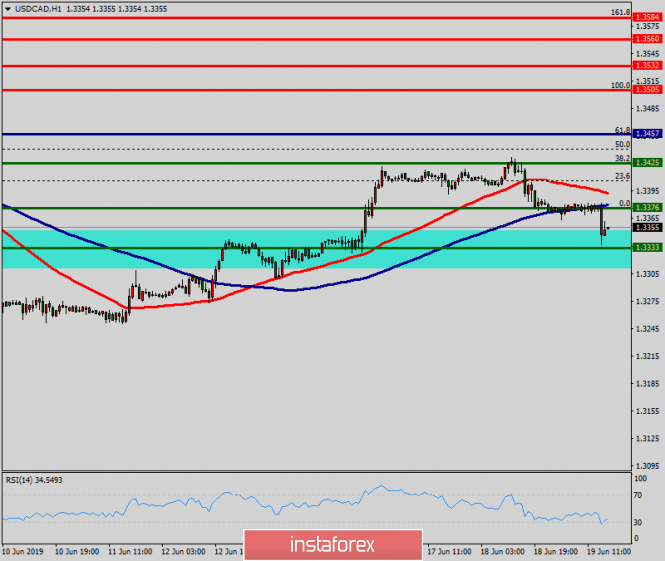
| Technical analysis of USD/CAD for June 19, 2019 Posted: 19 Jun 2019 07:03 AM PDT |
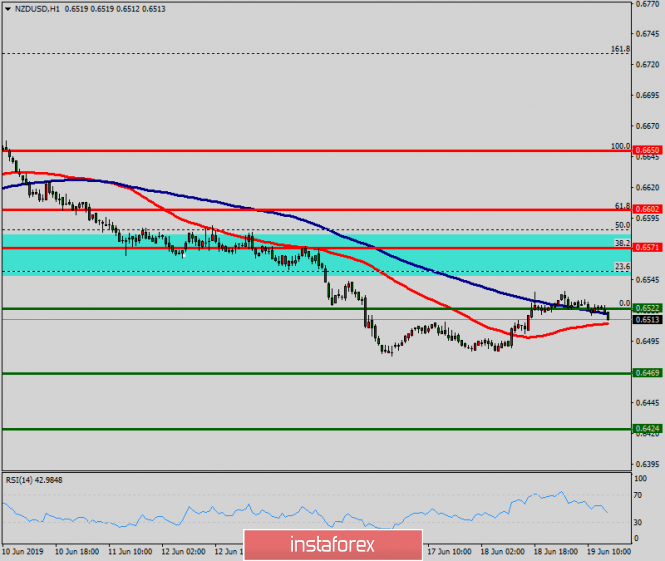
| Technical analysis of NZD/USD for May 19, 2019 Posted: 19 Jun 2019 06:59 AM PDT The NZD/USD pair is showing signs of weakness following a breakout of the lowest level of 0.6571. On the H1 chart, the level of 0.6571 coincides with 38.2% of Fibonacci, which is expected to act as minor resistance today. Since the trend is below the 38.2% Fibonacci level, the market is still in a downtrend. However, the resistance is seen at the level of 0.6571. Furthermore, the trend is still showing strength above the moving average (100). Thus, the market is indicating a bearish opportunity below the above-mentioned support levels, for that the bearish outlook remains the same as long as the 100 EMA is headed to the downside. Therefore, resistance will be found at the level of 0.6571 providing a clear signal to buy with a target seen at 0.6500. If the trend breaks the first supprt at 0.6500, the pair is likely to move downwards continuing the bearish trend development to the levels 0.6469 and 0.6424. The material has been provided by InstaForex Company - www.instaforex.com |
| Trading Plan 19/06/2019 EURUSD Posted: 19 Jun 2019 05:43 AM PDT
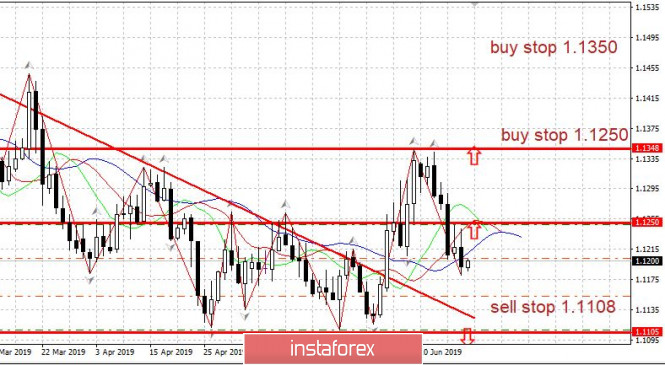
The ECB President Draghi tried to lower the euro on Tuesday, June 18: Draghi said that the ECB could make the policy even softer in July. This, however, did not greatly lower the EURUSD rate. The fact is that the possibilities of the ECB to stimulate growth are almost exhausted: the ECB rate is zero, for deposits for banks and generally minus 0.4%. A new incentive package (cash infusion) is unlikely. The moment of the rate increase has been postponed until mid-2020. No tools. Do not forget that the term of office of Draghi is already expiring on October 31 of this year - and the new head of the ECB may have a more conservative view. The move is now for the Fed - today, June 19, at 21:00 Moscow time, the Fed will announce its policy. In case of a statement of readiness to lower the rate, the Fed is able to turn the dollar to fall - and send the EURUSD rate sharply to the top. In addition, on Tuesday, June 18, important news about the Trump-China trade war came out. Trump had a telephone conversation - Xi Jing Ping - on trade disputes. According to the US. the conversation is very positive - and negotiations will continue at the G-20 summit next week. Euro: Purchase from 1.1250. Sales from 1.1108. The material has been provided by InstaForex Company - www.instaforex.com |
| Trump's unexpected discovery (review of EUR / USD and GBP / USD on 06/19/2019) Posted: 19 Jun 2019 05:39 AM PDT Donald Trump unexpectedly found out that since 2008 the single European currency has fallen its price from 1.60 to current values, and concluded that not only the Bank of China manipulates the yuan exchange rate. The European Central Bank also practices similar pranks. However, the reason for the outrageous tweet made by Donald Trump was yesterday's decline of the single European currency, which allegedly provoked Mario Draghi, who spoke with a regular speech. Almost all means of mass agitation and misinformation were engaged only in those that shouted about how Mario Draghi announced the imminent reduction of the refinancing rate. However, during his speech on the twentieth anniversary of the European Central Bank, he once mentioned the regulator's plans for the future, saying that " further reductions in interest rates and measures to mitigate (monetary policy) to curb any side effects remain part of our tools. "In fact, he didn't say anything new. After all, at a recent press conference following the last board meeting of the European Central Bank, Mario Draghi said in plain text that questions about lowering the refinancing rate and resuming the quantitative easing program were in fact being considered. Moreover, during his speech, fluctuations in units of European currencies did not exceed 30 points, but when the inflation data in the euro zone came out, the single European currency went down steadily. But, it was six hours before Mario Draghi's speech. The thing is that, as shown on the preliminary data, inflation was 1.2%. However, it turns out that it did not remain stable, and instead, it seriously decreased. Data for April was revised from 1.2% to 1.7%. It turns out that inflation in Europe is rapidly declining, which means, almost certainly, questions about lowering the refinancing rate and resuming the quantitative easing program at the next meeting of the European Central Bank will be considered very seriously.
The pound stopped yesterday, awaiting the results of the second round of the election of the new head of the Conservative Party, which became known at midnight. Five candidates has attended the elections, in addition to Boris Johnson, Foreign Minister Jeremy Hunt, Environment Minister Michael Gove, Minister for International Development Rory Stewart, as well as Interior Minister Sajid Javid, who remained in the race. Those who get less than 33 votes drop out of the race. The tours themselves will be held until only two candidates remain, after which all members of the party. About one hundred forty thousand will elect the head of the Conservative Party. The action-packed Brexit series will keep all viewers in suspense for a long time. However, this did not have any particular effect, since the result turned out to be quite expected, and investors simply continue to mentally prepare for the unregulated Brexit with its unpredictable and frightening consequences.
Today, a light warm-up will begin in the form of inflation in the UK, that should decline from 2.1% to 2.0%. Of course, this is considered as unpleasant news, but it can hardly grieve more than the almost inevitable ascension of Boris Johnson to the throne of the Prime Minister of the United Kingdom with an obligatory booth that follows such a joyous event. However, the main event of the day, of course, is the meeting of the Federal Commission on Open Market Operations and the subsequent press conference of Jerome Powell. The parameters of the monetary policy will undoubtedly remain unchanged, but the head of the Federal Reserve System is likely to announce a change in the regulator's plans, and instead of raising the refinancing rate, we will soon see its decline. On similar thoughts, this also pushes the persistence of all the representatives of the Federal Reserve System, without exception, constantly talking about precisely reducing the refinancing rate. Of course, such a step is not yet envisaged. However, they are not even talking about raising the refinancing rate. So, the society has long been prepared precisely for such a change in the course of the Federal Reserve System.
Thus, the probability that the single European currency, to the delight of Donald Trump, will grow to 1.1225 today is quite high. If Jerome Powell continues to gradually prepare the public for a change of course and does not make sharp statements, then everything will remain as it is.
Pound events will develop in a similar scenario, and it is worth waiting for its growth to 1.2625. However, if Jerome Powell does not fulfill the role of the herald who brought the sad news, then under the influence of lower inflation, as well as the prospects to see Boris Johnson as prime minister, the pound will move to around 1.2500.
|
| Simplified wave analysis and forecast for EUR / USD & GBP / USD pairs on June 19 Posted: 19 Jun 2019 05:15 AM PDT EUR / USD pair The main euro rate is given by the rising wave of May 23. A correctional wave lasting in recent weeks appears to be fully formed. The price is within the powerful support zone. The upward movement that began yesterday has not yet undergone a reversal potential. Forecast: The expected price fluctuations of the euro today are stacked in a narrow corridor between the nearest oncoming zones. Before the price rises, a repeated attempt to put pressure on the support zone is not excluded. The current flat mood may continue for several days. Recommendations: Today, trade deals in Euro pair can be recommended only to traders who trade in separate sessions on the smallest TFs. For longer transactions, there are no conditions in the market. When the price reaches the resistance zone, it is worth focusing on the search for selling signals. Resistance zones: - 1.1230 / 1.1260 Support areas: - 1.1180 / 1.1150 GBP / USD pair The downward wave of the pound, which dominated in March, reached the potential reversal zone. The structure of the whole wave looks complete and the proportions of the parts are met. There is no reversal signal on the chart, therefore, the oncoming movement that began yesterday is nothing more than a rollback. Forecast: Today, the pound price is waiting to move between nearby areas. In the morning, a rising vector is more likely. In the area of the resistance zone, the probability of a change in direction and a return to the main course of movement increases sharply. Recommendations: Be careful and minimize the lot when buying a pound today and if the price reaches the resistance zone, it is recommended to look for signs of a reversal in order to search for signal sales of the instrument. Resistance zones: - 1.2580 / 1.2610 Support areas: - 1.2520 / 1.2490 Explanations to the figures: The simplified wave analysis uses waves consisting of 3 parts (A – B – C). Each of these analyzes the last incomplete wave. Zones show calculated areas with the highest probability of reversal. The arrows indicate the wave marking by the method used by the author. The solid background shows the formed structure and the dotted exhibits the expected movement. Note: The wave algorithm does not take into account the duration of tool movements over time. |
| Bitcoin: Buyers are building new support for continued growth Posted: 19 Jun 2019 05:14 AM PDT The area of 8,960 is a good support level to which I have repeatedly drawn attention and apparently, cryptocurrency buyers will try to continue from him a further upward trend in the region of 10,000 USD. An interesting report was published yesterday, indicating that the number of citizens' requests for cryptocurrency in Japan increased by 170%. The CAA study shows that in 2018, there were 3,657 requests for cryptocurrency exchanges, which is 1.7 times more than a year earlier. Bitcoin Buy Signal (BTC): The main goal of Bitcoin buyers remains a breakthrough of the 9,350 range, reaching the highs of 9,540 and 9,800, where I recommend taking profits. In the case of a decrease in cryptocurrency, support will be provided around the area of 8,960 and it is best to open long positions for a rebound near the minimum of 8,630. Bitcoin Sales Signal (BTC) I do not recommend opening short positions in Bitcoin in the current conditions since in the near future a new wave of growth may occur. Large resistance levels can be traced around 9,350 and 9540, where it will be possible to observe the profit taking in long positions, which will necessarily lead to a downward correction. The task of bears is to break through and consolidate below the support of 8 960, which will increase pressure on bitcoin and lead to a minimum of 8,630 and 8,190. |
| Gold votes for Fed independence Posted: 19 Jun 2019 05:13 AM PDT On the eve of the announcement of the FOMC meeting results, gold continues to wander around 14-month highs. He is not particularly confused by either the rally of US stock indices or the return of investor interest in the US dollar. Stocks of specialized exchange-traded funds (ETF) rose to their highest level since February, as well as rising geopolitical tensions in the Middle East. Also, the weak statistics on industrial production in China and an increase in the likelihood of erratic Brexit create a favorable environment for the XAU/USD bulls. However, after the press conference of Jerome Powell, the situation may seriously change. Donald Trump said that he had a telephone conversation with his colleague from Beijing and their meeting on the sidelines of the G20 summit in Japanese Osaka will take place. The owner of the White House called Xi Jinping a great leader but stressed that the deal with China should be fair. The contact groups will work even before the two presidents meet, which allows us to count on the de-escalation of the conflict and gives rise to the growth of the US stock market. Improving the global risk appetite coupled with a strong US dollar puts serious pressure on gold as a rule but this time, the precious metal decided to wait for the results of the FOMC meeting. The dynamics of US interest rates on loans, dollars and S&P 500 On the one hand, Jerome Powell is under serious pressure from the US president, who does not tire of criticizing the Fed's monetary policy, the growing recession risks and the weak report on US employment in May. On the other hand, everything is not so bad in the US economy, as is commonly believed amid the growth of retail sales, industrial production and an increase in the yield curve signal. In addition, if the Fed unexpectedly reduces rates, it will lose its credibility. The market will say that the Central Bank went in the wake of Donald Trump. The FOMC forecast on the federal funds rate will be important. If in December the open market Committee expected that it would increase twice in 2019, it did not expect a weakening of monetary policy in March. The futures market signals two acts of monetary expansion in the current year. If the Fed does not give a hint about any of them, the US dollar will strengthen against the main world currencies and the XAU/USD "bears" will go on the counter-attack. Thus, the importance of the Federal Reserve June meeting for gold is difficult to overestimate. The reaction of the market to its results will either show whether the precious metal has not climbed too high or on the contrary, will its success at the beginning of summer be the beginning of a long rally? Technically, the gold update of the June highs is able to open the way for the bulls upwards in directed to the target of 161.8% according to the AB = CD pattern. It is located near the mark of $1395 per ounce. As long as quotes are above the support of $1311 (23.6% of the upward long-term wave), the situation is controlled by the buyers of the precious metal. Gold daily chart |


| You are subscribed to email updates from Forex analysis review. To stop receiving these emails, you may unsubscribe now. | Email delivery powered by Google |
| Google, 1600 Amphitheatre Parkway, Mountain View, CA 94043, United States | |
No comments:
Post a Comment