
Forex analysis review |
- EUR/USD approaching support, potential bounce!
- NZD/USD approaching support, potential bounce!
- EUR/JPY near key support, a bounce is possible!
- Powell did not make Armageddon, but what Draghi will say on Thursday
- Britain's exit from the EU threatens to turn around for the next prime minister of the country "shot in the foot"
- What to expect from the upcoming ECB meeting and what will happen to the euro?
- The Fed is more likely to lower rates, the dollar is ready for this
- EUR/USD. The rise and fall of the euro: traders are nervous on the eve of the ECB meeting
- GBP/USD. June 5th. Results of the day. Trump supports the candidacy of Boris Johnson in the election of the prime minister
- EUR/USD. June 5th. Results of the day. Macroeconomic statistics again helps the euro currency
- EURUSD: The euro declined after reports on producer prices and retail sales
- Gold threw a red rag to the bulls
- Technical analysis of EURUSD for June 6, 2019
- Technical analysis of Gold for June 6, 2019
- June 5, 2019 : EUR/USD Intraday technical analysis and trade recommendations.
- June 5, 2019 : GBP/USD Intraday technical analysis and trade recommendations.
- GBP/USD analysis for June 05,.2019
- Analysis of Gold for June 05,.2019
- Bitcoin analysis for June, 05.2019
- GBP/USD: plan for the American session on June 5. Buyers of the pound do not have enough strength to continue growth
- EUR/USD: plan for the American session on June 5. Weak inflation and retail sales stopped the growth of the euro
- Technical analysis of AUD/USD for June 05, 2019
- Technical analysis of GBP/USD for June 05, 2019
- Trading plan for EURUSD on 06/05/2019
- Wave analysis of EUR/USD and GBP/USD on June 5. Euro and pound continue to grow thanks to the "dovish" rhetoric of Powell
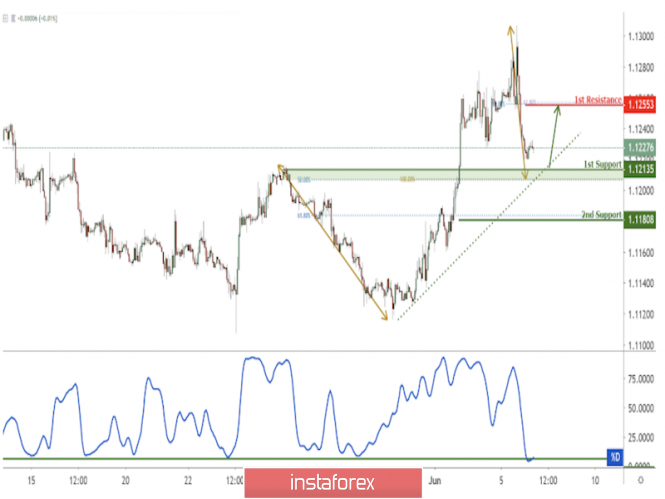
| EUR/USD approaching support, potential bounce! Posted: 05 Jun 2019 06:48 PM PDT
Price is approaching our first support where we might be seeing a bounce above this level. Entry : 1.1213 Why it's good : Horizontal pullback support, 50% Fibonacci retracement, 100% Fibonacci extension, short term ascending support line Stop Loss : 1.1180 Why it's good : 61.8% Fibonacci retracement Take Profit : 1.1255 Why it's good : 50% Fibonacci retracement, 61.8% Fibonacci extension
|
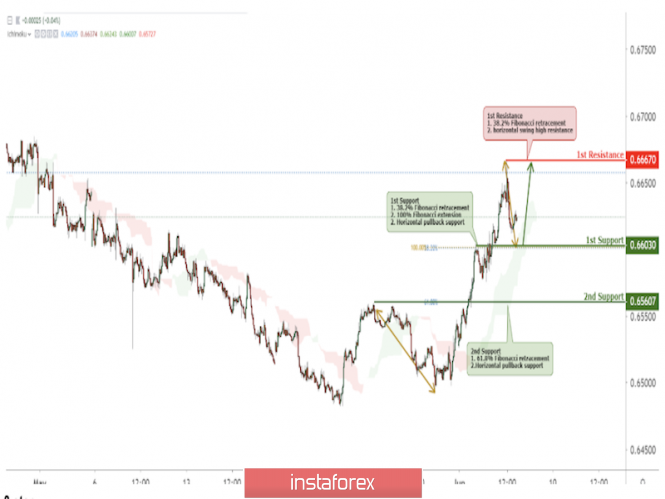
| NZD/USD approaching support, potential bounce! Posted: 05 Jun 2019 06:46 PM PDT
Price is approaching support where it is expected to bounce to its resistance. We are expected some NZD strength later today due to risk-on sentiment back in the market.. Entry : 0.6603 Why it's good : 38.2% Fibonacci retracement, 100% Fibonacci extension, horizontal pullback resistance Stop Loss : 0.6561 Why it's good : 61.8% Fibonacci retracement, horizontal pullback support Take Profit : 0.6667 Why it's good : Horizontal swing low support, 38.2% Fibonacci retracement
|
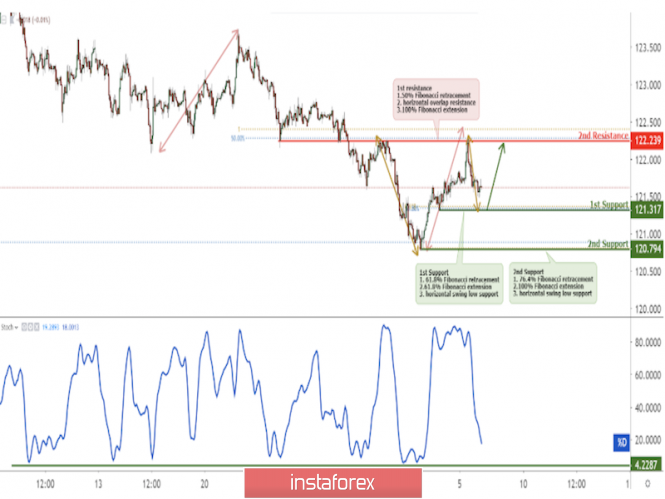
| EUR/JPY near key support, a bounce is possible! Posted: 05 Jun 2019 06:43 PM PDT
EURJPY near key support, a bounce to 1st resistance is possible Entry: 121.32 Why it's good : 61.8% Fibonacci extension, 61.8% Fibonacci retracement, horizontal overlap resistance Stop Loss : 122.24 Why it's good :50% Fibonacci retracement, 100% Fibonacci extension, horizontal overlap resistance Take Profit : 120.79 Why it's good: 76.4% Fibonacci retracement, 100% Fibonacci extension, horizontal swing low support
|
| Powell did not make Armageddon, but what Draghi will say on Thursday Posted: 05 Jun 2019 05:39 PM PDT No matter which way, but it seems that Donald Trump has achieved his goal. Long resisted by Jerome, Powell saw the need for a rate cut. Members of the Federal Reserve are closely watching the recent escalation of trade friction and will react if the economic situation in the country deteriorates, the head of the regulator said. Market participants perceived his words as a "dovish" signal. The S&P 500 jumped more than 2%, and the dollar has been in a state of weightlessness for the fifth day in a row. On Wednesday, the US currency continued its free fall relative to its six main competitors. At the same time, a month ago, CME derivatives issued only a 32 percent probability of easing policy at the September FOMC meeting. Expectations soared to 86%, after the White House owner announced new tariffs against China and Mexico, and Powell dropped the standard mention that the bank was "patient" in terms of interest rates. The July figure jumped to 50% from 18.5% previously. Market participants are waiting for a three-fold reduction in rates in the second half of the year. Analysts at Barclays expect that the central bank will twice soften the policy - in the autumn by 50 b.p. and in the winter at 25 b.p. A similar opinion is held in JP Morgan. It is worth noting that not so long ago, both banks did not predict any changes in monetary policy until the end of 2020. If you turn to yesterday's comments of Powell, then you can be sure that he did not directly mention the rate cut, but only made it clear that the Fed is vigilant. In fact, he agitated the markets and reinforced the confidence of traders in easing the policy of the head of the Federal Reserve Bank of St. Louis, James Bullard. However, one should not forget that this official adheres to a "dovish" position; he had not hesitated to say that the Federal Reserve had gone too far with tightening policies in December. President of the Federal Reserve Bank of Dallas, Robert Kaplan wants to see whether some of the recent developments in the field of trade wars will be canceled, and his colleague from Chicago, Charles Evans, feels great at the current level of the federal funds rate. It is not excluded that the derivatives market runs ahead of the locomotive, since it firmly believes in easing the policy. About the euro As for the dynamics of the EUR/USD pair, it now looks better than it owes to the weakened dollar. The long-term strengthening of the euro can be expected after the cessation of trade friction. While Trump is going to war against everyone, you can safely buy the yen, the franc and gold. Moreover, the World Bank is constantly reducing forecasts for the growth of the global economy. Today, the estimate for the current year was worsened from 2.9% to 2.6%. The main pair tested the resistance of $1.1265 and briefly rose slightly above the round mark of $1.13. It is unlikely that it will possibly develop an upward movement, because after the Fed the "dovish" motives will start to play around the European Central Bank. Euro positions may suffer significantly if Mario Draghi announces new incentive measures on Thursday. The market, despite the deterioration of statistics, trade wars and consumption stagnation, does not expect any global changes in the area of monetary policy. Moreover, it is believed that the ECB will want to strengthen the position of the recently suffering euro. Of particular interest will be the updated macroeconomic forecasts and the way Mario Draghi assesses the current state of the eurozone economy. At the next meetings of the regulator, the details of the new bank lending program (TLTRO) may be made public. Perhaps this will happen on Thursday. The material has been provided by InstaForex Company - www.instaforex.com |
| Posted: 05 Jun 2019 05:20 PM PDT The GBP/USD pair keeps a positive attitude and is trading near weekly highs at 1.2720 against the background of easing pressure from the dollar and the release of strong UK statistics. The May release on PMI was published today. It is a key release for the British economy in the services sector. The indicator unexpectedly showed an increase from 50.4 to 51.0 points. In addition, the pound was supported by a statement by the President of the United States, Donald Trump, on the intention to conclude a trade deal with the UK immediately after it left the EU. However, it is not yet clear whether the GBP/USD pair will be able to continue to grow against the background of continuing political uncertainty in the United Kingdom. "Now there is not just a deadline on October 31. It is also the election of the leader of the Conservative party, and large-scale uncertainty about the direction of the country's movement in the context of Brexit," - said Marvin Barth, currency strategist Barclays. For investors in the British currency, there are three key factors that require close attention: 1. Conservatives. In the past, the main contenders for the post of Tory head often lost the race, and this time the number of candidates exceeds ten people. If former British Foreign Secretary Boris Johnson reaches the final stage, he is guaranteed victory. According to experts, his direct charm and good sense of humor seem to be more important for members of the Conservative Party than administrative abilities. In the event that Johnson does not win, several more hard Brexit supporters take part in the race. Investors fear that the country's withdrawal from the EU will turn into a "shot in the foot" for the next prime minister. 2. House of Commons. Lawmakers so far hopelessly disagree on Brexit. There is only one consensus: they do not approve the withdrawal of the United Kingdom from the EU without a deal. 3. European Union. The Alliance can not stop the UK, which is heading for an exit, but repeatedly reiterated that it would not revise the current terms of the deal, which the British MPs rejected. However, the EU has its own problems: it will have to choose a new leadership, therefore, if London offers something new, it will be possible to resume negotiations. It is assumed that in the event of an implementation of the "hard" scenario, the pound sterling will collapse, some analysts even talking about achieving parity with the dollar. However, if Brexit is canceled, the British currency will soar and reach the mark of $ 1.50, fixed before the 2016 referendum. The material has been provided by InstaForex Company - www.instaforex.com |
| What to expect from the upcoming ECB meeting and what will happen to the euro? Posted: 05 Jun 2019 05:10 PM PDT The focus of attention this week is the next meeting of the European Central Bank (ECB), which will take place tomorrow. Amid growing concerns about the global economic slowdown due to the US-China trade war, investors have no choice but to wait for new signals from the ECB for a weaker monetary course, as well as details about the next round of long-term lending to banks (TLTRO), which starts in September . If the regulator wants to maintain market confidence, it must make it clear that it is considering the possibility of taking more decisive actions, such as a new round of quantitative easing (QE), reports Bloomberg. "The ECB needs to be proactive against the background of the policy easing expected by the market. This effect can hardly be achieved only by announcing the TLTRO parameters or by changing the interest rate forecast. The signal must be strong and unexpected. That could be a hint that the QE program will be resumed, "said Citigroup representatives. Will the regulator surprise the market and how will the euro react to the central bank's statements? "The risk/reward ratio tends to react to the market in favor of a stronger euro. Apparently, the conditions of TLTRO-III will be less attractive than TLTRO-II. We doubt that the regulator will open the door to a greater reduction in rates compared to what it did in April," said currency strategists at Nordea Bank. "The euro may extend its recent recovery, as the Governing Council of the ECB does not seem inclined to offer overly generous TLTRO. In addition, the idea of a multi-level deposit rate does not yet find a common understanding in the management of the central bank," Credit Agricole believes. "It seems that the market expects too much from the regulator. It is likely that, following the next meeting, the ECB's tone might not seem dovish. In this case, we could see a sharp jump in the euro, "said Rabobank experts. "The euro will continue to be in demand among investors, given that at the upcoming meeting, the ECB does not move the expected interest rate increase in the first half of 2020 to a later date and also does not raise the volume of the TLTRO-III incentive program above 720 billion euros," analysts at Morgan Stanley say. They predict that in the short term the EUR/USD pair will test the strength of the level of 1.1310. "Breaking through this level will open the way to impressive growth. At the same time, potential attempts to strengthen the dollar against the euro are likely to be limited to 1.1120," the experts said. The material has been provided by InstaForex Company - www.instaforex.com |
| The Fed is more likely to lower rates, the dollar is ready for this Posted: 05 Jun 2019 04:46 PM PDT The rise of the dollar was expectedly stopped by the Fed. The currency has updated the seven-week low against the backdrop of rising expectations of interest rate cuts in response to the risks associated with trade conflicts. Fed Chairman Jerome Powell did not make hints, and specifically promised that the regulator will respond "appropriately" to trade pressure. The statement immediately affected the US currency, the markets have already begun to prepare for a reduction in the Fed rate. However, given the change in the Fed's forecast and the collapse in the yield of US Treasury bonds in recent weeks, the loss of the dollar in this context looks rather subdued. If global growth worsens, the dollar will go up again. On Thursday, the ECB will begin its meeting, and there is a high probability that the attitude of the ECB will correspond to the "dovish" tone of the Fed, and perhaps the regulator will even announce more free conditions for a new scheme of cheap lending. Concerns about a recession are spreading throughout the world, and central banks have cut interest rates in recent weeks, which may signal the beginning of a global monetary easing cycle. On Tuesday, the Reserve Bank of Australia lowered its base interest rates to a record low of 1.25% and made it clear that they were ready to go further if the situation did not change. Last month, the Central Bank of New Zealand for the first time in the last 2.5 years lowered its base interest rate, trying to support the economy. Against this background, the euro is growing as well as the Australian and New Zealand dollars. |
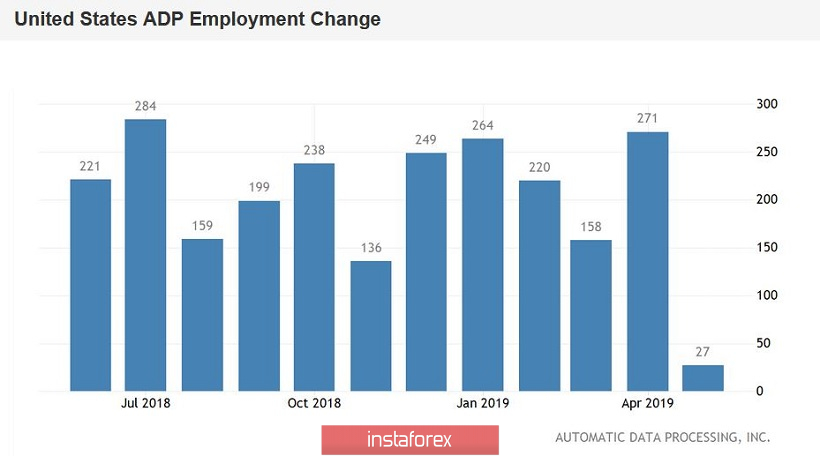
| EUR/USD. The rise and fall of the euro: traders are nervous on the eve of the ECB meeting Posted: 05 Jun 2019 04:14 PM PDT For the first time since April, the euro-dollar pair has been testing the 13th figure, thereby indicating new price horizons. True, the attack ended in failure - the price quickly moved away from two-month highs, returning first to the opening level, and then completely updating the low of the day. Nevertheless, the euro still looks more attractive than the dollar, which, in turn, cannot recover from the dovish intentions of the Fed. Tomorrow the euro is to be tested by the June meeting of the ECB, and if the European regulator maintains the status quo in its rhetoric, the eur/usd bears will be left alone with a weakening greenback. However, first things first. Today, the pair's impulsive growth was due to the extremely weak report on the US labor market from the analytical agency ADP. According to them, the number of jobs in private American companies grew by only 27 thousand in May (with a growth forecast of 180 thousand). This is a very weak result (the worst in the last 9 years), which is a disturbing harbinger of weak Nonfarms. For comparison: last month, the ADP report showed an increase in the number of employed in 270 thousand, while Nonfarms came out at the level of 263 thousand. Given the high level of correlation of these indicators, traders are worried about the fate of the Friday release: if the official data disappoint in the same way, the dollar will again fall under the wave of sales. The fact is that the labor market has always been a reliable support for the US currency: the unemployment rate is consistently kept at record-low values, and Nonfarms are in the range of 180-300 thousand (with the exception of February 2019, but in this case the statistics were distorted). The "hawks" of the Fed, arguing their position, as a rule, referred to the dynamics of the labor market, noting positive trends and steady growth of key indicators. Even the level of average hourly wages, which varies in the range of 0.1-0.3%, provided indirect support to the US currency. And if now the US economy will lose support from this side, the fate of the interest rate of the Fed will be predetermined. Such a warning has once again made traders nervous: the yield on 10-year-old treasuries again updated its local low (2.088), putting pressure on the dollar index, which tested the 96th figure. The situation was somewhat smoothed out by the ISM composite index for the non-production sphere (it unexpectedly rose to 56.9 points), but on the whole the market's mood remains depressed. If Nonfarms fail on Friday synchronously with ADP, the "hawks" and centrists of the Federal Reserve will find it harder to defend their position. In particular, the head of the Federal Reserve Bank of Chicago, Charles Evans, said today that he is concerned about the prolonged period of low inflation. According to his estimates, the US trade conflict with China will only slow down the inflation process, so the regulator may have to respond to the situation. His colleague - Robert Kaplan - was more optimistic in his assessments. In his opinion, the Fed must first make sure that the US economy has slowed down its growth, and only then decide to lower the rate. As we see, many Fed members are now talking about the probability of monetary policy easing. In one way or another, they allow the implementation of such a scenario, whereas previously most of them categorically rejected such an idea. But the single currency could not take advantage of the dollar's weakness today. The euro has lost all the points it won amid fears about the June meeting of the ECB, which will take place on Thursday. Investors rightly fear that the regulator may demonstrate a "dovish" attitude regarding the prospects for monetary policy. Much will depend on how members of the ECB interpret the latest data on the growth of European inflation. I recall that after the April growth to 1.7% y/y and 1.2% m/m, the consumer price index slowed down in May to 1.2% and 0.8%, respectively. Core inflation also disappointed - in April, this indicator jumped to 1.3%, and in May, analysts predicted a decline to one percent. But the core index was weaker than expectations, returning to the level of March, that is, to the mark of 0.8%. According to some experts, the fact that European inflation accelerrated in April was temporary and was due to seasonal fluctuations - Easter holidays and long weekends contributed to the growth of inflation indicators. In May, the situation stabilized, and inflation indicators returned to their normal course. If ECB members follow the same logic, then the European currency will be supported. But if Mario Draghi allows a return of QE, then the euro will not be able to resist the dollar, even despite the weakness of the latter. Experts estimate the likelihood of such a step differently. According to some analysts, the head of the ECB should at least hint at the announcement of new incentives, given the weak dynamics of European inflation. According to other currency strategists, the market is expecting too much from Draghi - hints of rate cuts, hints of a renewal of QE, a negative outlook for the eurozone, and details about the next round of bank loans under the TLTRO program. According to them, though Draghi has a different "dovish" character, this time the bears may disappoint EUR/USD. In particular, TLTRO-3 conditions may be less attractive compared to TLTRO-3. In general, Draghi can take the same position as in previous meetings, which will provoke a demand for the European currency. But for now, these are all assumptions, so the single currency is under pressure from uncertainty. On Thursday, the single currency will have to undergo a rather difficult test, but if the results of the ECB meeting are in favor of the euro, the eur/usd pair will soon be able to consolidate not only within the 13th figure, but also come to the next resistance level of 1.1420 (the top line of the Bollinger Bands indicator on the weekly chart). The material has been provided by InstaForex Company - www.instaforex.com |
| Posted: 05 Jun 2019 03:58 PM PDT 4-hour timeframe The amplitude of the last 5 days (high-low): 59p - 60p - 86p - 63p - 72p. Average amplitude for the last 5 days: 68p (64p). The British pound sterling continues to grow at a very sluggish pace against the US currency. Jerome Powell's words yesterday that the US economy may need to be stimulated in the near future because of all the ups and downs between the United States and China, Mexico, and perhaps even the EU, did not provide strong support for the pound sterling. That is why we believe that, firstly, Powell's words were given too much importance, and secondly, traders continue to look more towards selling the pound than towards purchasing. It is all connected with the same Brexit and political crisis in the UK. Therefore, if the euro shows a fairly strong growth, then there is a very indirect price increase in the pound. Meanwhile, Donald Trump, whose official visit to London continues, announced the names of the politicians he would like to see as prime minister. If the first name of the question does not arise - Boris Johnson, the middle name - Jeremy Hunt, who is an enemy of Brexit. However, the likelihood that Boris Johnson would take the post is still much higher. Johnson himself believes that the country should leave the EU before October 31, since carrying over Brexit to a later date may finally deprive the ruling Conservative party of support for the electorate and kill the trust in it completely. From a technical point of view, the pound/dollar pair may continue its upward movement, but its pace now leaves too many unanswered questions. In particular, is the pound being bought at all now, or are bears simply reducing their "dollar" positions? One thing is clear for sure - if positive news does not start coming from the UK, the pound can return to a downward trough at any time. Trading recommendations: The pound-dollar currency pair continues a slight upward correction. Formally, it is now possible to consider longs with a target level of 1.2794, but the positions of the bulls are still in doubt. Upward movement can be completed quickly and abruptly. Sell orders can be considered if traders manage to return the GBP/USD pair below the critical line. In this case, the target for the downward movement will be the support level of 1.2540. In addition to the technical picture should also take into account the fundamental data and the time of their release. Explanation of the illustration: Ichimoku indicator: Tenkan-sen - the red line. Kijun-sen - the blue line. Senkou Span A - light brown dotted line. Senkou Span B - light purple dotted line. Chikou Span - green line. Bollinger Bands indicator: 3 yellow lines. MACD Indicator: Red line and histogram with white bars in the indicator window. The material has been provided by InstaForex Company - www.instaforex.com |
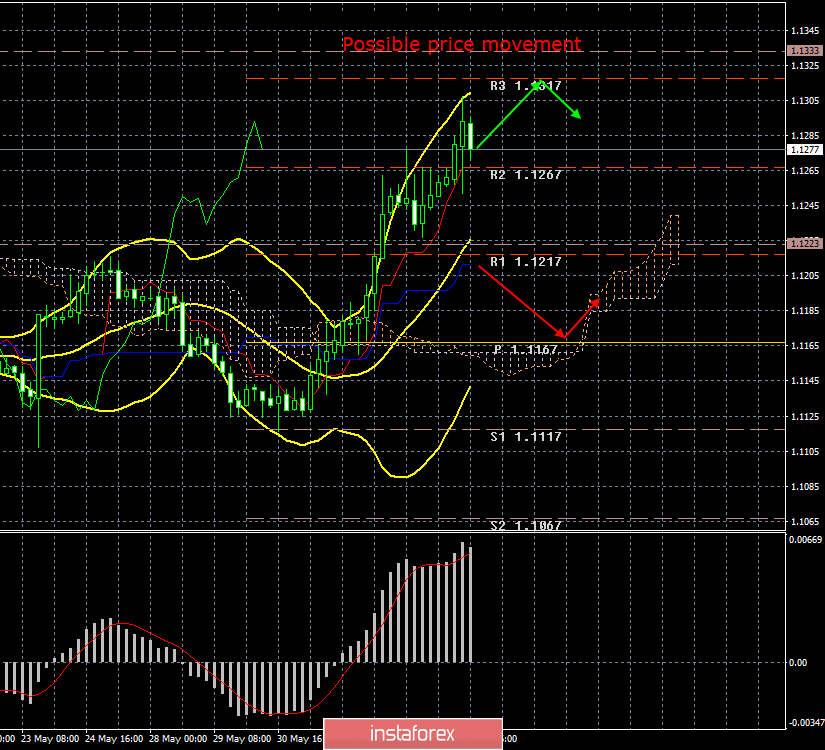
| EUR/USD. June 5th. Results of the day. Macroeconomic statistics again helps the euro currency Posted: 05 Jun 2019 03:40 PM PDT 4-hour timeframe The amplitude of the last 5 days (high-low): 49p - 27p - 45p - 102p - 50p. Average amplitude for the last 5 days: 55p (52p). The third trading day of the week went well for the European currency. Since May 30, the euro's non-stop growth continues, which has not yet been interrupted even for a correction. However, the correction still has to be, the MACD indicator is very overbought. Today, European macroeconomic statistics did not disappoint traders. The composite index of business activity in the manufacturing sector exceeded the forecast (51.8 against 51.6), the index of business activity in the services sector also turned out to be better than traders' expectations (52.9 against 52.5). Retail sales in April rose by 1.5%, which is lower than in the previous month, but fully in line with the forecasts of experts. Thus, there were no reasons for selling the euro at the European trading session. Nor did they appear in the US session. The ADP report on the change in the number of workers in the private sector recorded a slight increase of 27,000 in May (forecast +180,000). The US dollar began to strengthen against the euro literally in the last half hour thanks to the US index of business activity in the ISM services sector, which turned out to be higher than expected (56.9 against 55.5). Perhaps this particular index will start the euro/dollar pair's downward correction. In general, we would like to note that, despite the "dovish" rhetoric of Jerome Powell last night, the euro has hardly strengthened due to the Fed's speech. First, growth began a few days earlier. Secondly, the rhetoric does not mean a reduction in rates in the near future. But in the medium term, his words, coupled with the disappointing statistics from the US in recent years may put an end to the hegemony of the dollar in 2019. Trading recommendations: The EUR/USD pair continues to move up. Thus, it is now recommended to trade on the increase with a target of 1.1317 before the reversal of the MACD indicator, which will signal the beginning of a correction. Short positions can be re-considered if the bears manage to consolidate back below the critical line. In this case, the immediate goal will be the upper limit of the Ichimoku cloud. In addition to the technical picture also take into account the fundamental data and the time of their release. Explanation of the illustration: Ichimoku indicator: Tenkan-sen - the red line. Kijun-sen - the blue line. Senkou Span A - light brown dotted line. Senkou Span B - light purple dotted line. Chikou Span - green line. Bollinger Bands indicator: 3 yellow lines. MACD Indicator: Red line and histogram with white bars in the indicator window. The material has been provided by InstaForex Company - www.instaforex.com |
| EURUSD: The euro declined after reports on producer prices and retail sales Posted: 05 Jun 2019 03:32 PM PDT The data on the eurozone services sector provided little support to the euro and instilled confidence in traders in continuing the upward trend, but the inflation and retail sales report quickly returned the market to its morning opening levels. According to the final Markit report, the PMI Purchasing Managers Index for Italy was 50.0 points in May, which indicates a complete lack of growth in the sector. Economists did predict a decline to 49.5 points, which would indicate a reduction in activity. Back in April of this year, the PMI for the service sector in Italy was 50.4 points. In France, the same indicator for the service sector in May of this year increased and amounted to 51.5 points, while it was projected at 51.7 points. Back in April, the PMI for the services sector in France was 50.5 points. Germany continued to hold a leading position in the service sector. According to the report, the PMI Purchasing Managers Index for Germany was 55.4 points in May against 55.7 points in April. PMI for the services sector in Germany in May was projected at 55.0 points. Given the good data, the overall PMI Purchasing Managers Index for the eurozone services sector rose to 52.9 points in May against 52.8 points in April of this year, although it was forecast at 52.5 points. The composite PMI of the eurozone rose to 51.8 points in May against 51.5 in April and the forecast of 51.6 points. As I noted above, the disappointing report on inflation in the eurozone quickly pulled down quotes of the European currency against a number of world currencies. According to the data, the PPI producer price index in April of this year decreased by 0.3% compared with March and amounted to 2.6% per annum. The reduction was mainly due to low energy prices. Producer prices were expected to grow by 0.3% and 3.2%, respectively. As for core inflation, which does not take into account volatile categories, including energy carriers, the situation is a little better. The report indicates that the producer price index of the eurozone excluding energy in April rose by 0.2% compared with March and by 1.2% per annum. Weak inflation in the eurozone remains a headache for the European Central Bank, as even the current incentives do not allow it to reach the target level and gain a foothold near it. This situation, in turn, further delays the timing of raising interest rates in the eurozone. Retail sales in the eurozone also failed to please traders. Despite the expectations of a reduction, weak sales will necessarily affect the growth rate of the eurozone economy in the 2nd quarter of this year, which is far from ideal. According to the report, retail sales in the euro area in April this year decreased by 0.4% compared to March and increased by 1.5% compared to the same period in 2018. Economists had expected sales to decline by 0.5 percent. The material has been provided by InstaForex Company - www.instaforex.com |
| Gold threw a red rag to the bulls Posted: 05 Jun 2019 03:29 PM PDT Looking at the rapid rally of XAU/USD to the highest levels since February, gold fans can proudly declare: "What we wanted to prove." The escalation of the US-Chinese trade conflict, the rising volatility of financial markets and the chances of lowering the federal funds rate, as well as fears for the fate of the US and world economy created a favorable environment for the precious metal, which it was in no hurry to use. The threat of a 5% tariff on all Mexican imports became the straw that broke the camel's back. According to the World Bank's estimates, the world economy will expand by 2.6% in 2019, not 2.9% as expected in January. The conflict between the United States and China will have a detrimental effect on international trade, business activity and investment. If it is not resolved, then in 2019 instead of the expected + 2.7%, global GDP will grow by 1.7%. The US yield curve has inverted, signaling a quick recession. According to JP Morgan, the chances of a decline in the next 12 months increased from 25% to 40%. Against this background, the Fed is beginning to seriously talk about the need to reduce interest rates. St. Louis Federal Reserve President James Bullard believes that the time for easing monetary policy has already come, and Fed Chairman Jerome Powell says that the central bank will react to the deteriorating health of the US economy, which trade wars have a negative impact on. The dovish rhetoric of FOMC officials and the increased likelihood of a reduction in the federal funds rate at the September meeting of the regulator from 32% in early May to 86% are bullish factors for gold. On the first day of June, the largest specialized exchange fund SPDR Gold Shares marked the best influx since July 2016 (at that time the markets were shocked by Britain's desire to part with the EU), and XAU/USD soared sharply. Dynamics of capital flows in SPDR Gold Shares Donald Trump's intention to impose tariffs on Mexican exports has become a red rag for gold bulls. Oxford Economics estimates that 25% of the duties will be deducted from the US GDP by 0.7 percentage points. at 2019-2020. Yield of treasury bonds continued to fall to the lowest marks from 2017, finally pulling the US dollar behind them into the abyss. I would venture to suggest that it was the stability of the USD index which held back the offensive fervor of precious metal fans. What's next? Stock market volatility will remain high, which is good news for gold. Stock indices will continue to rush between deteriorating macroeconomic statistics for the United States, trade wars and the Fed's desire to lower the federal funds rate. The growth potential of XAU/USD is enormous: speculators' net longs account for only 27% of the highest levels in the history of 37.2 million ounces. To restrain the offensive fervor of the "bulls" there is only the US dollar, which is unlikely to surrender without a fight. Technically, the precious metal easily executed the first target of the "Wolfe Waves" pattern and continues to rally towards the next target for $1,350-1,355 per ounce. The material has been provided by InstaForex Company - www.instaforex.com |
| Technical analysis of EURUSD for June 6, 2019 Posted: 05 Jun 2019 10:11 AM PDT EURUSD made a break above 1.1260 horizontal resistance but the current 4 hour candle is a bearish one indicating a false break out. This is a bearish sign. Bulls need to retake 1.1250-1.1260 otherwise they will be in trouble.
Blue rectangle - resistance Green rectangle - support Despite breaking above the horizontal resistance at 1.1260, bulls were not strong enough to hold above it. The Daily candle implies a reversal at least in short-term trend back to bearish. Price should be heading for a back test towards 1.120 or 1.1190. It will be bullish if price touches any of these two levels and bounces. Breaking below these levels would support the bearish scenario of a false breakout. A daily close above 1.1250 would negate the negative impact of this pull back. The material has been provided by InstaForex Company - www.instaforex.com |
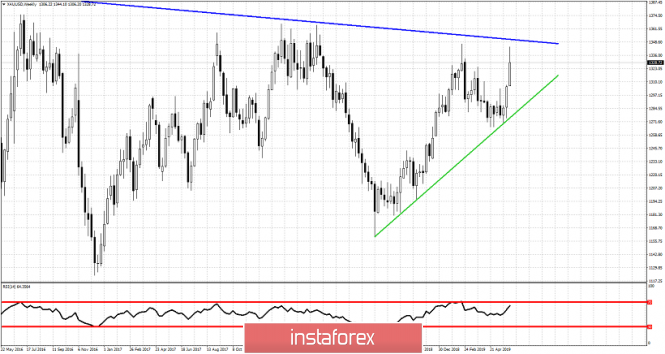
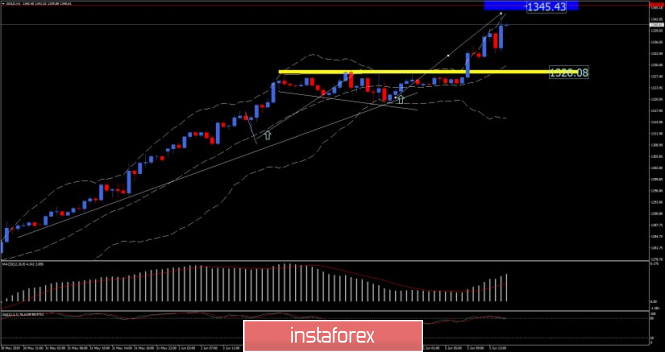
| Technical analysis of Gold for June 6, 2019 Posted: 05 Jun 2019 10:06 AM PDT Gold price approached the major resistance area of $1,350-60 and got rejected. Price made a high at $1,344 and is now trading below $1,330 with an impressive 4 hour reversal candle. Have we seen a major top in Gold?
Blue line - major resistance trend line Green line - major support trend line Gold price reached very close to the blue long-term resistance trend line and sellers put a lot of pressure as price has now found important resistance. As long as price is above the green trend line support trend will remain bearish with high chances of breaking the blue trend line and moving towards $1,400 and higher. A rejection at $1,350 and a break below the green trend line will be a bearish sign that will increase the chances of a move towards $1,200 or lower. The material has been provided by InstaForex Company - www.instaforex.com |
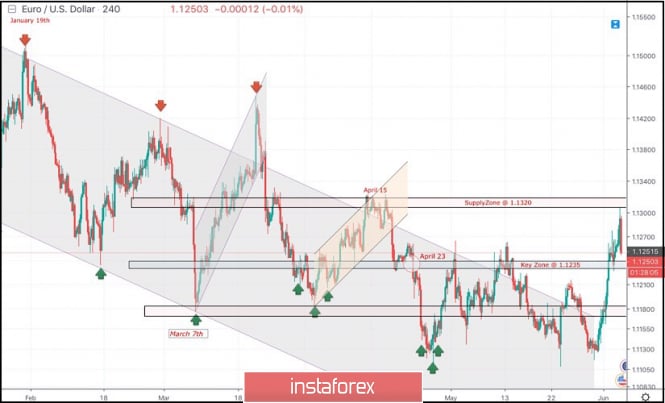
| June 5, 2019 : EUR/USD Intraday technical analysis and trade recommendations. Posted: 05 Jun 2019 08:42 AM PDT
Since January 19th, the EURUSD pair has been moving within the depicted channel with slight bearish tendency. Few weeks ago, a bullish Head and Shoulders reversal pattern was demonstrated around 1.1200 allowing further bullish advancement to occur towards 1.1300-1.1315 (supply zone) where significant bearish rejection was demonstrated on April 15. For Intraday traders, the price zone around 1.1235 stood as a temporary demand area which paused the ongoing bearish momentum for a while before bearish breakdown could be executed on April 23. Short-term outlook turned to become bearish towards 1.1175 (a previous weekly bottom which has been holding prices above for a while) On the period between May 17th and 20th, a bearish breakdown below 1.1175 was temporarily achieved. As expected, further bearish decline was expected towards 1.1115. This is where significant bullish recovery was demonstrated bringing the EURUSD pair back above 1.1175. Recently, The EURUSD pair has maintained bullish persistence above the highlighted price level (1.1175). That's why, further bullish advancement was expected towards 1.1235 which failed to apply any significant bearish pressure. Bullish breakout above 1.1235 renders it a newly-established demand level to be watched for bullish rejection and a valid BUY entry to be offered upon retesting. Bullish persistence above 1.1235 enhances further bullish advancement towards 1.1290 and 1.1320. On the other hand, bearish breakdown below 1.1235 would probably allow further bearish decline to occur towards 1.1175. Trade recommendations : Intraday traders should look for a valid BUY entry anywhere around 1.1235. T/P level to be located around 1.1320. Stop loss should be placed below 1.1190. The material has been provided by InstaForex Company - www.instaforex.com |
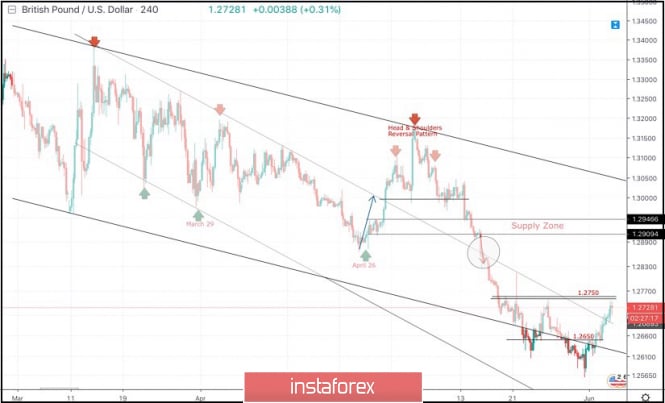
| June 5, 2019 : GBP/USD Intraday technical analysis and trade recommendations. Posted: 05 Jun 2019 07:49 AM PDT
On March 29, a visit towards the price levels of 1.2980 (the lower limit of the newly-established bearish movement channel) could bring the GBPUSD pair again towards the upper limit of the minor bearish channel around (1.3160-1.3180). Since then, Short-term outlook has turned into bearish with intermediate-term bearish targets projected towards 1.2900 and 1.2850. On April 26, another bullish pullback was initiated towards the price zone of 1.3130-1.3170 where the depicted bearish Head and Shoulders reversal pattern was demonstrated on the H4 chart with neckline located around 1.2980-1.3020. Hence, Bearish breakdown below 1.2980 allowed the recent significant bearish movement to occur. Initial bearish Targets were already reached around 1.2900-1.2870 (the backside of the broken channel) which failed to provide any bullish support for the GBPUSD pair. Further bearish decline was demonstrated towards the lower limit of the long-term channel around (1.2700-1.2650) where the GBPUSD pair looked oversold obviously. That's why conservative traders were suggested NOT to consider any SELL signals around those low price levels. As anticipated, bullish breakout above 1.2650 has already been achieved. This enhanced the bullish side of the market towards 1.2750. For the bulls to remain dominant, another bullish breakout above 1.2750 is needed to extend potential bullish targets towards 1.2800 then 1.2890 if sufficient bullish momentum is demonstrated. Otherwise, another bearish visit towards 1.2650 shouldn't be excluded. Trade Recommendations: For Intraday traders, a valid BUY entry was suggested around 1.2650. T/P level to be located around 1.2720 and 1.2820. S/L should be advanced to 1.2680 to secure more profits. Conservative traders should wait for an extensive bullish pullback towards 1.2870-1.2905 (newly-established supply zone) to look for valid sell entries. S/L should be placed above 1.2950. The material has been provided by InstaForex Company - www.instaforex.com |
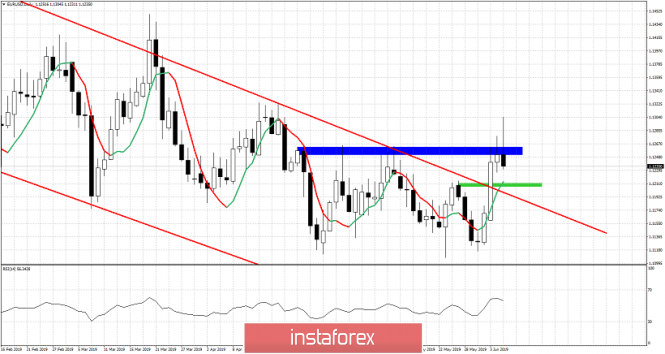
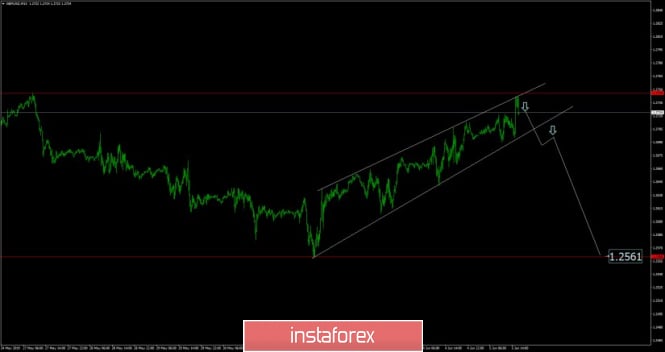
| GBP/USD analysis for June 05,.2019 Posted: 05 Jun 2019 06:38 AM PDT GBP/USD has been trading upwards. Anyway, the wedge formation is still bulding and it is question of the time when we may see sell off. Our advice is to watch for potential selling opportunities. The final destination is 1.2560.
White lines – Rising wedge Red horizontal line lower – Downward projection 1.2560 GBP/USD has been trading upwards for few days but the wedge formation on the upside is present. Our advice is to be very careful with longs on GBP and to watch for selling opportunities. If you are aggressive trader, you can sell from the top of the wedge with the risk of 50-60 pips. From other side, if you are not aggressive, you can wait for potential breakout of the lower diagonal of the wedge to confirm further downward movement. The downward target is set at the price of 1.2560. Resistance levels are set at 1.2745 and 1.2820. The material has been provided by InstaForex Company - www.instaforex.com |
| Analysis of Gold for June 05,.2019 Posted: 05 Jun 2019 06:17 AM PDT Gold has been trading upwards as we expected. The price tested the level of $1.343 and it is near our second upward target from few days ago at $1.345. Careful with longs at this stage since the potential resistance is there. It is good time to take some profit from your longs.
Yellow rectangle – support $1.320 Blue rectangle- Resistance $1.345 Gold has been trading upwards for last few days with the good up momentum. Gold is still in strong upward momentum and the MACD is showing increasing in momentum, which isgood sign for further continuation. In case of the breakout of $1.345, next upward target would be set at $1.362 (strong resistance cluster). Watch for new buying opportunities but only if you see valid breakout of the $1.345. From other side, if you see pullback, good area to unload longs is set at $1.328 (support). The material has been provided by InstaForex Company - www.instaforex.com |
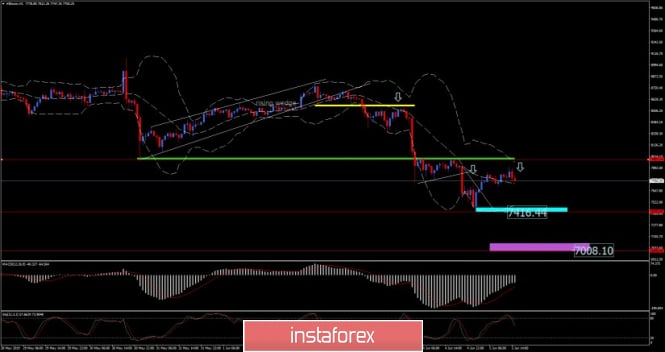
| Bitcoin analysis for June, 05.2019 Posted: 05 Jun 2019 05:55 AM PDT BTC price has been trading downwards as we expected. The price reached our downward target at $7.416 and it rejected. Anyway, we are still expecting more downside on BTC due to strong downward momentum in the background.
Blue rectangle – support $7.416 Punc rectangle- Downward target and support $7.000 BTC did reject of the support $7.416 but the strucutre looks corrective and we expect more downside to come. The Stochastic oscillator looks oversold and MACD is still in negative teritory, which is sign of the overall weakness. Support levels are seen at $7.416 and $7.008. Reistance levels are seen at $7.982 and $8.532. Watch for downward opportunities. The material has been provided by InstaForex Company - www.instaforex.com |
| Posted: 05 Jun 2019 05:52 AM PDT To open long positions on GBP/USD, you need: Despite the good data on the service sector, as well as the fact that the buyers of the pound managed to stay above the support of 1.2697 in the first half of the day and even formed a false breakdown on it, it did not allow to build a new upward trend. While trading will be conducted over this range, the demand for the British pound will remain, which can still lead to an update of the maximum of 1.2744 and 1.2800, where I recommend fixing the profit. In case of returning to the level of 1.2697, it is best to consider long positions after updating the minimum of 1.2650 or a rebound from the area of 1.2594. To open short positions on GBP/USD, you need: The repeated test of the support of 1.2697 should lead to its breakdown, which will allow us to expect a decrease in GBP/USD already in the area of larger lows 1.2650 and 1.2594, where I recommend fixing the profit. In the scenario of further growth of the pound against the backdrop of a weak US dollar due to talk about lowering the interest rate, will stop the upward correction of a large resistance level of 1.2744, where you can look at the short positions immediately on the rebound. Indicator signals: Moving Averages Trading is conducted in the area of 30 and 50 moving averages, which indicates the completion of the upward correction of the pound. Bollinger Bands The volatility of the indicator has fallen, which does not give signals on entering the market. Description of indicators
|
| Posted: 05 Jun 2019 05:52 AM PDT To open long positions on EURUSD, you need: The buyers tried to continue the growth of the European currency in the first half of the day, however, weak reports on inflation and the reduction of volume of retail sales has led to a sharp drop in the euro against the dollar. At the moment, it is best to return to long positions after updating the new support level in the area of 1.1241, provided that there is a false breakdown or a rebound from a larger area of 1.1200. The main task of the bulls by the end of the day will be to update the resistance of 1.1286, which will retain the upward potential in the pair and lead to the update of the highs in the area of 1.1333. To open short positions on EURUSD, you need: Sellers returned to the market after weak reports, and at the moment, their goal is the support of 1.1241, which will be the first profit taking on short positions. The main task for the second half of the day will be the breakdown of this level, which will allow collapsing EUR/USD in the area of the minimum of 1.1200, where I recommend fixing the profit. In the case of euro growth scenario, after weak data on the ISM index for the non-manufacturing sector of the United States, you can count on short positions from the resistance of 1.1286 or from a new high of 1.1333. Indicator signals: Moving Averages Trading is conducted in the area of 30 and 50 moving averages, which indicates a slowdown in the upward trend of the euro. Bollinger Bands Support will be provided by the lower limit of the indicator in the area of 1.1241, a breakthrough of which may increase the pressure on the euro. Description of indicators
|
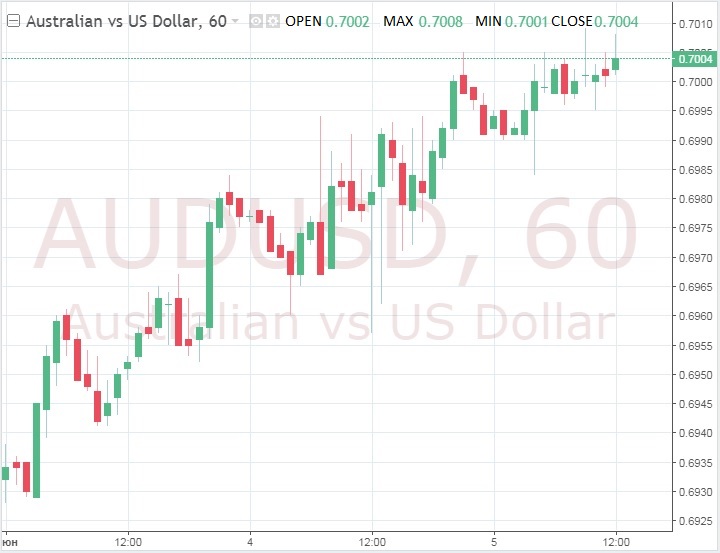
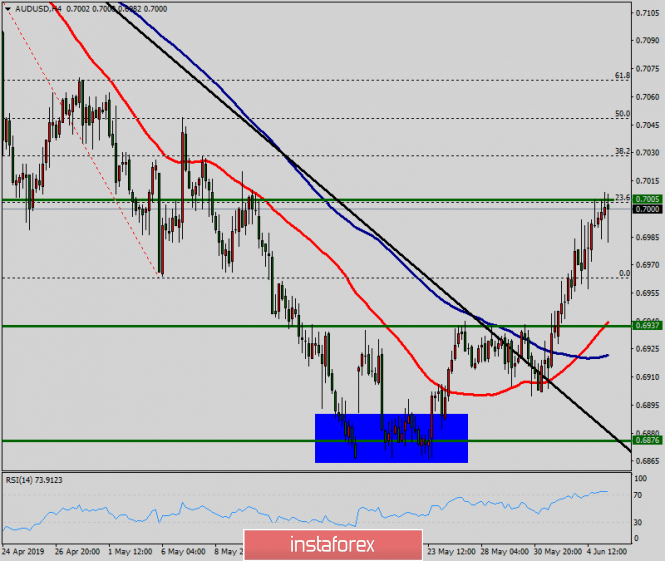
| Technical analysis of AUD/USD for June 05, 2019 Posted: 05 Jun 2019 05:47 AM PDT The AUD/USD pair is set above strong support at the levels of 0.6937 and 0.6980. This support has been rejected four times confirming the uptrend. The major support is seen at the level of 0.6937, because the trend is still showing strength above it. Accordingly, the pair is still in the uptrend in the area of 0.6937 and 0.6980. The AUD/USD pair is trading in the bullish trend from the last support line of 0.6937 towards thae first resistance level of 0.7000 in order to test it. This is confirmed by the RSI indicator signaling that we are still in the bullish trending market. Now, the pair is likely to begin an ascending movement to the point of 0.7000 and further to the level of 0.7112. The level of 0.7112 will act as the major resistance and the double top is already set at the point of 0.7112. At the same time, if there is a breakout at the support levels of 0.6937 and 0.6980, this scenario may be invalidated. The material has been provided by InstaForex Company - www.instaforex.com |
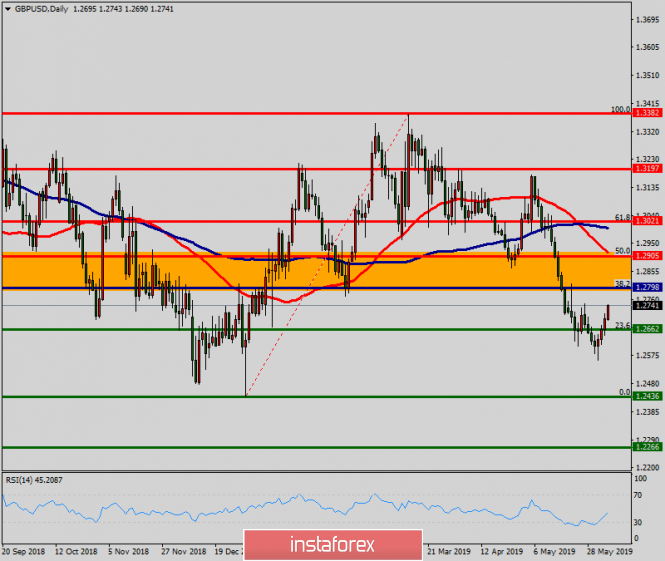
| Technical analysis of GBP/USD for June 05, 2019 Posted: 05 Jun 2019 05:40 AM PDT Overview: The GBP/USD pair continues to move downwards from the level of 1.2905. This week, the pair rose from the level of 1.2905 to a top around 1.2800 and it set around the spot of 1.2800. The first resistance level is seen at 1.2905 followed by 1.2963 , while daily support 1 is seen at 1.2798 (38.2% Fibonacci retracement). According to the previous events, the GBP/USD pair is still moving between the levels of 1.2700 and 1.2610; so we expect a range of 90 pips in coming hours. Furthermore, if the trend is able to break out through the first support level at 1.2662, we should see the pair climbing towards the double bottom (1.2436) to test it later. Therefore, sell below the level of 1.2800 with the first target at 1.2610 in order to test the daily resistance 1 and further to 1.2436. Also, it might be noted that the level of 1.2436 is a good place to take profit because it will form a double bottom. On the other hand, in case a reversal takes place and the GBP/USD pair breaks through the resistance level of 1.2905, then the stop loss should be placet at 1.2930. The material has been provided by InstaForex Company - www.instaforex.com |
| Trading plan for EURUSD on 06/05/2019 Posted: 05 Jun 2019 03:15 AM PDT The euro has given a strong technical signal for growth, breaking through the top of 1.1220 and fixing higher. Important news ahead: Today, on Wednesday, June 5 - the "Beige Book" report on the state of the economy will be released. More importantly, on Thursday, June 6, the ECB's decision on monetary policy. The market is waiting for some tightening of rhetoric from the ECB. If the ECB gives even a small hope of tightening the policy, the euro will show strong growth. |
| Posted: 05 Jun 2019 03:15 AM PDT EUR/USD Over the past three days, the EUR/USD pair has added about 120 basis points. The current wave marking involves the construction of wave 4 as part of the downward trend section. This wave has already taken a pronounced three-wave form. However, if the news background is favorable, the whole section of the trend after May 23 can be transformed into an independent upward one. Yesterday's day for the euro could end very sad. The inflation rate in May did not even reach a rather weak forecast of 1.4% and amounted to 1.2%. Thus, the markets could well start to get rid of the euro and buy the dollar again. However, this did not happen, and in the evening, the head of the Fed Jerome Powell supported the euro in his words that in the coming months the US economy may need stimulation. In addition, Powell also drew attention to the stable values of inflation, the good state of the labor market and wages. However, no one paid attention to these words, as monetary policy and its prospects are much more important for traders. Purchase goals: 1.1278 – 50.0% Fibonacci 1.1317 – 61.8% Fibonacci Sales targets: 1.1106 – 0.0% Fibonacci General conclusions and trading recommendations: The euro/dollar pair remains within the downward trend but moved to the construction of a corrective wave. In general, the purchase is now risky, as wave 4 can be completed at any time. I recommend supporting open purchases with targets at 1.1278 and 1.1317, which is equal to 50.0% and 61.8% of Fibonacci. An unsuccessful attempt to break one of these marks or the MACD signal is down – and I recommend closing the purchases. GBP/USD On June 4, the pair GBP/USD gained about 35 base points, and the wave pattern still allows for several scenarios. The minimum of May 31 can still be considered as the end of the wave C. If the instrument updates the maximum of May 27 in the coming days (the peak of the expected wave 2, C), this will show the readiness of traders to build an upward set of waves. The news background remains negative for the pound, but recently the markets have started to pay less attention to the lack of positive from the UK. Traders probably decided to wait for the election of the country's new Prime Minister and find out what vector he will choose in the Brexit issue. Unexpected support for the pound may come from the US. Yesterday, Fed Chairman Powell adhered to "dovish" rhetoric, which caused the purchase of the euro. In the medium term, the pound may also feel the support of the foreign exchange market on the basis of this mood of Powell. Sales targets: 1.2554 – 200.0% Fibonacci 1.2360 – 261.8% Fibonacci Purchase goals: 1.3175 – 0.0% Fibonacci General conclusions and trading recommendations: The wave pattern of the pound/dollar tool implies a further decline of the instrument in the framework of the proposed wave C. Thus, now I recommend waiting for the breakout level to 200.0%, and selling the pound with targets located near the calculated levels of 1.2360 and 1.2176, which corresponds to 261.8% and 323.6% of Fibonacci. An unsuccessful attempt to break the level of 200.0% could lead to the completion of the construction of the downward trend section, but there is no confirmation of this hypothesis yet. The material has been provided by InstaForex Company - www.instaforex.com |


| You are subscribed to email updates from Forex analysis review. To stop receiving these emails, you may unsubscribe now. | Email delivery powered by Google |
| Google, 1600 Amphitheatre Parkway, Mountain View, CA 94043, United States | |
No comments:
Post a Comment