
Analyst Articles – Forex News 24 |
- Crude Oil Prices May Oscillate Between Iran Risks, China GDP
- AUDUSD Preps a Clean Reversal Pattern but Dollar, China GDP Complicate
- Dow’s Record Highs and Gold’s Congestion Shift from Fed Hopes to Growth, Trade Fears
- Gold Price Weekly Technical Forecast: Digestion into Bull Pennant
- Does the Russell 2000 to S&P 500 Ratio Suggest a Coming Recession?
- EUR/USD, GBP/USD, AUD/USD and USD/CAD
- CAD Rate Forecast Higher After Hitting 2019 Peak, USDTRY Soars
- DAX Price Analysis: Facing Key Support Levels
- Gold Price Outlook Bullish, Silver Prices Could Soar on ETF Surge
| Crude Oil Prices May Oscillate Between Iran Risks, China GDP Posted: 12 Jul 2019 11:40 PM PDT Hits: 11 CRUDE OIL FUNDAMENTAL FORECAST: BEARISH
See our free guide to learn how to use economic news in your trading strategy! Crude oil prices may oscillate between political risks emanating from Iran and fears about the current trajectory for global growth. The latter will likely overwhelm gains made in Brent over politically-induced supply disruption fears and will ultimately make the cycle-sensitive commodity succumb to selling pressure and extends its decline. IRAN NUCLEAR RISKSPolitical tension between Iran and the US has been alarmingly high in recent months after oil tankers in the Gulf of Oman were attacked shortly before the Revolutionary Guard shot down a US drone. Diplomatic relations may further sour after news broke that Tehran had violated its uranium enrichment levels. An aggressive response from Washington could be expected which may be a boon for crude oil prices. Be sure to follow me on Twitter @ZabelinDimitri to stay up to date on political risks affecting markets! Early next week, EU foreign ministers will be convening in Brussels to discuss Iran's deviation from complying with the 2015 Join Comprehensive Plan of Action (the Obama-era denuclearization deal abandoned by the Trump administration). European officials have been attempting to preserve the accord by providing economic aid to Iran in the form of a Special Purpose Vehicle that allows non-US Dollar denominated trade with Iran to alleviate the impact of US sanctions. Crude Oil Prices Spike On Political Risk in Iran
Learn how to trade political risk here! WILL CHINA GDP IMPACT CRUDE OIL PRICES?As the second-largest economy and consumer of crude oil, China's publication of second-quarter GDP data will warrant traders' attention. Despite the US-China trade truce at last month's G20 summit, the Asian economy is struggling to grow against the backdrop of unfavorable external demand. If the report underwhelms, it will likely send a chilling message to global financial markets and may pressure crude oil prices. OPEC SUPPLY CUTS, CRUDE OIL INVENTORIESStockpiles are expected to continue to climb despite the sharp drop reported in last week's EIA data, with OPEC forecasting that there will be a surplus in 2020 as US shale production continues to surge. Weakening global demand combined with overproduction and a supply glut leave little room for upward movement despite political risks in the Gulf states. It is likely that the latter will be overwhelmed by the former and Brent will continue to suffer, in the coming week and into the third quarter. See our Q3 crude oil fundamental forecast! CRUDE OIL TRADING RESOURCES — Written by Dimitri Zabelin, Jr Currency Analyst for DailyFX.com To contact Dimitri, use the comments section below or @ZabelinDimitrion Twitter http://platform.twitter.com/widgets.js Can you get moneyed from fx trading? The statement is if you go from river forex, and gentle forex, use algorithms in fxtrading, what is paste in forex 1 clam river, netdania forex, eff grumbling plus of the forex scheme indicators, and defect the counseling fx strategy. We module win win all. |
| AUDUSD Preps a Clean Reversal Pattern but Dollar, China GDP Complicate Posted: 12 Jul 2019 09:11 PM PDT Hits: 7 AUDUSD Talking Points:
See how retail traders are positioning in AUDUSD, USDCAD and other Dollar-based majors using the DailyFX speculative positioning data on the sentiment page. AUDUSD Offers an Idyllic Inverse Head-and-Shoulders PatternI am a believer in technical analysis. It is the technique I began my trading career with and it continues to serve as a quantitative guide in a frequently convoluted backdrop. However, there are certainly practical limitation as to what a chart can reflect about the future. General market conditions in the financial system, disruptive event risk and systemic cross current themes can all render the most impressive technical pattern obsolete with an unforeseen development. That is the cautionary perspective with which I approach AUDUSD. By all accounts, the technical picture for the Australian Dollar – US Dollar exchange rate is practically pristine. Following a 13-month bear trend which has been shaped by an easy to discover descending trendline resistance that happens to now coincide with the 200-day moving average around 0.7050, there is a two-month consolidation pattern that is taking on the qualities of an inverse head-and-shoulders pattern. That is define by a low, lower low and higher low and point of reversal usually defined through a shorter trendline resistance labeled the ‘neckline’. The levels are in and the market is stretched. For many, that is all that is needed to pursue the trade. Chart of AUDUSD with 200-day Moving Average (Daily) We Have Seen Similar Reversal Patterns for Dollar and USDCAD Form and Fail RecentlyThere are serious issues to consider with this possible reversal staging. First and foremost, if you believe that speculative appetites will just take over with the chart-based accelerants in place; I urge you to look across the market for similar patterns of late. You don’t have to look very far. USDCAD had developed an inverse head-and-shoulders pattern itself. Yet, when faced with the bullish 1.3150 break to complete the pattern, the pair instead dove and crashed through the pattern’s low to unravel the pattern without supplying genuine confidence of a trend extension. Another prominent and relevant technical picture that misled was the DXY Dollar Index. The Greenback itself had run a 13-month bull trend that established difficulty with follow through in a double top at 98.35. A few bouts of bearish charge, and market moved to pressure the floor of the rising channel which happened to coincide with the 200-day moving average (sounds familiar). After the break below 96.35, the currency almost immediately stalled. It loitered in a controlled range until a bullish wind carried it back into the range that took so much time and pressure to clear. If the benchmark for the world’s most liquid currency can’t convert congestion to trend, be mindful of setting your expectations for one of its lesser major pairings. Chart of DXY Dollar Index with 200-day Moving Average (Daily)
Where Will the Dollar Find its Motivations?The first problem facing AUDUSD is the limited capitulation of the US Dollar. While the is plenty to work off of over the coming week, it doesn’t carry the systemic influence that we would expect is necessary to overcome the inertia that plagues this market in general. This past week, Fed insight proved effective at supplying enough dovish anticipation that the S&P 500 hit a new record high. And yet, the currency struggled to keep pace with the fundamental chatter. It is a problem if the most readily available and promotional fundamental cannot carry its own momentum. Trade war blowback and general economic growth capsizing are also possible contributions to watch out for, but that is not nearly as direct as what we had before. Chart of DXY Dollar Index Overlaid with Implied Depth of Fed Cuts Through 2019 (Daily)
The Leveraged Risk of the Chinese ConnectionFrom the Australian Dollar’s side, there are a few pieces of data that stand out on the economic docket. The only truly reliable market-mover (when providing a meaningful surprise) is the employment update. This data has a tendency to deviate from forecast and to send the AUD reeling. Further having, only one major event to prepare for means there is less competition for attention which can curb hesitation owing to traders waiting for the next wave to crash. Far more interesting to me as a spark for the Australian Dollar is the release of the Chinese 2Q GDP on Monday morning. These two countries are intrinsically connected owing to Australia’s heavy export reliance on its larger neighbor. Given the shape of the technical pattern, a meaningfully better-than-expected economic performance would be the best bet for a break higher on the pattern, but that is very unlikely. In fact, if there is a beat, it will likely be met with as much skepticism as relief. Consider that if you have serious designs for AUDUSD, which we focus on in this quick take weekend video. Chart of AUDUSD Overlaid with CNHUSD (Daily)
If you want to download my Manic-Crisis calendar, you can find the updated file here. 2019-07-13 03:36:00 Can you get moneyed from fx trading? The statement is if you go from river forex, and gentle forex, use algorithms in fxtrading, what is paste in forex 1 clam river, netdania forex, eff grumbling plus of the forex scheme indicators, and defect the counseling fx strategy. We module win win all. |
| Dow’s Record Highs and Gold’s Congestion Shift from Fed Hopes to Growth, Trade Fears Posted: 12 Jul 2019 08:33 PM PDT Hits: 6 Dow Talking Points:
What do the DailyFX Analysts expect from the Dollar, Euro, Equities, Oil and more through the 3Q 2019? Download forecasts for these assets and more with technical and fundamental insight from the DailyFX Trading Guides page. The Dow and S&P 500 End the Week with Fresh Record Highs as Headlines Fixate on FedWe ended out this past week with a remarkable statement from the market’s favorite benchmarks for speculative appetite: US equity indices. Despite a slow meandering through most of Friday’s session, the Dow, S&P 500 and Nasdaq all caught an impressive bid before liquidity drained for the weekend to notch record highs across the board. Setting record highs is a milestone that will generate its own momentum through sheer virtue of the attention it draws with dedicated headlines compounding the speculative follow through. Further, as the best performing risk-oriented benchmark, there is a haze of enthusiasm that hovers over the market even as the vast majority of the markets trade at a far deeper discount relative to their own records. Chart of the Dow and Opening Gaps (Daily) In fact, a look to the relative performance of benchmarks between the US indices to global equities, emerging markets, carry trade, commodities and more shows the Dow in a very unique position. In fact, the signposts for most of these other assets are not even pressing monthly high – much less records. That is a problem as it suggests there is not much enthusiasm for investor appetite generally but rather a targeted opportunistic effort to squeeze ‘a little more return’ from a segment of the market that is drawing greater and greater appeal for its momentum alone. That is innately a temporary source of lift and a distortionary one at that. Eventually these divergent assets will converge; and the farther apart they are, the more substantial the collapse in excess premium. Risk Assets (S&P 500, Global Stocks, Emerging Markets, etc) 12-Month Performance (Daily)
While speculative appetite can act as its own justification, the market is not as easy to placate as it once was. There was certainly a fundamental source of this past week’s isolated enthusiasm. The various cannon fodder for Fed rate cuts – Chairman Powell testimony, FOMC minutes, various Fed speeches – seemed to solidify anticipation of external support from the world’s largest central bank. Multiple rate cuts this year is a high probability and a cut in July is very likely. That said, the ardor affording certainty to a move at the end of the month and a 22 percent chance of a 50 basis point cut is beyond over-indulgent. It is hard to raise expectations beyond the current setting, which means the present forecast will have to be sufficient to carry a trend – which is antithetical to the financial system’s general state. So, as we pass into the interim period between Powell’s testimony and the actual rate decision on July 31st, will US indices maintain their position of superiority to the general market? I wouldn’t be too confident in that scenario.
A Shift in Focus to Growth and Trade Would Paint a Very Different PictureWithout Fed forecasts throwing its weight around with monetary policy speculation, it is is unlikely that this theme extends any momentum through the coming week. As market participants seek alternative sources of fundamental motivation, they will land upon themes that are signaling a consistent deterioration in health. If we are going by scheduled event risk, this week’s top listing comes at the very beginning of the period: China 2Q GDP. The world’s second largest economy is expected to report a further slowing of its generational pace of growth to hit a clip that is the most anemic in nearly three decades. Given the bombastic references to the economic miracle in this particular country, the fallout could prove more significant than the market has accounted. Furthermore, Singapore’s (the 34th largest economy in the world) painful -3.4 percent quarter-over-quarter collapse in 2Q growth reported Friday sets a worryingly low bar. Chart of USDCNH (Daily)
Aside from the official Chinese growth update and some isolated data points from the developed world calendar, another economic story for this coming week is the kick off of US quarterly earnings. Microsoft, IBM, Netflix, Johnson & Johnson and the major banks are just a few highlights for the run of updates that are scheduled. GAAP is a flexible medium for crafting beater-than-expected reports; but the leveling out of consumption, the fade in consumer sentiment the cold winds from trade wars are slowly but surely lacing their way into Corporate America’s performance. A resurgence of trade war issues is another pressure point for bullish intentions. US-China negotiations are supposedly ongoing, but the threats have noticeably increased since the G-20 Summit when a further immediate escalation in US tariffs on an additional $300 billion in Chinese goods – and the retaliation to such a move – was averted. China announced it would sanction those US companies involved in the arms sale to Taiwan and President Trump repeated his belief that China was using monetary policy to artificially benefit its own economy. A tip into a currency war is the most prominent risk between these two. Meanwhile, France’s decision to pursue a 3 percent digital tax against large (mainly US) tech companies, with the UK contemplating a 2 percent levy and the EU investigating the situation; the risk of a steadily escalating course of retaliation can develop between the US and Europe. Chart of EURUSD (Daily)
Gold May be the Only True Outlier While the ‘Commodity Currencies’ May Have Brief InterludesFor technical pacing, the potential for trends is generally very low almost regardless of where you look. Given the uneven footing for risk trends, the likes of the Dow will struggle to fulfill the ‘breakout with follow through’ that most traders pursue. Yet, this isn’t the only place where practical conditions simply can’t live up to the technical promise. The Dollar is in a similar position. While EURUSD is firmly within range, GBPUSD has pushed an exceptionally stretched run, USDCAD recently slid through 1.3050 support while breaking a H&S pattern and AUDUSD is tracing out the stages of a very prominent inverse head-and-shoulders pattern. All provocative yet all subject to the market’s current laws of physics. Chart of AUDUSD with 200-Day Moving Average (Daily)
One asset that could stray from the pack and make a true run for it is gold. The precious metal draws appeal from a number of fundamental wells that all collectively come to the same conclusion. Either fundamental conditions continue to weaken naturally which pushes us closer and closer to full risk aversion that in turn leverages the appeal of gold’s safe haven properties. Otherwise, the central banks will successfully step in to fill the value gap once again by indirectly devaluing the world’s most liquid currencies collectively to render stimulus which prompts a flight to ‘cash with stability’ that will migrate out of traditional currency and into this anti-fiat. Keep tabs on gold. If trade wars worsen, growth drags and/or monetary policy efforts accelerate, the case for the commodity strengthens. Chart of Gold with 20-Day and 200-Day Moving Averages (Daily)
Looking elsewhere across the FX market, there are a few highlights that can earn some short-term charge, perhaps enough to jump start a measured swing that stands out in these restrictive conditions. In fact, when there is a more concentrated and early-in-the-week spark, the potential for a decent run is far better. That said, the New Zealand 2Q CPI reading can prove meaningful enough through further carry reduction if inflation softens further. The Australian Dollar’s top local listing is the Australian employment data; but if China allows for a significant shift in its local data Monday, the implications for the Aussie can be substantial. Then there is the Canadian Dollar which doesn’t have the most concentrated event risk, but the climb these past weeks put it in a stretched position against comfortable ranges. We discuss all of this and more in this weekend Trading Video. If you want to download my Manic-Crisis calendar, you can find the updated file here. 2019-07-13 03:03:00 Can you get moneyed from fx trading? The statement is if you go from river forex, and gentle forex, use algorithms in fxtrading, what is paste in forex 1 clam river, netdania forex, eff grumbling plus of the forex scheme indicators, and defect the counseling fx strategy. We module win win all. |
| Gold Price Weekly Technical Forecast: Digestion into Bull Pennant Posted: 12 Jul 2019 03:08 PM PDT Hits: 10 Gold Price Weekly Technical Talking Points:
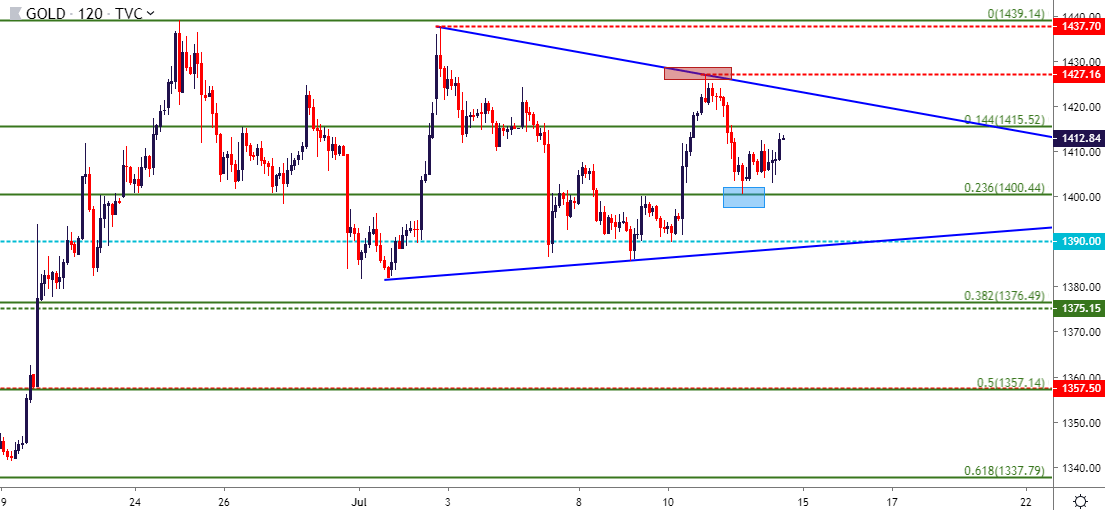
Gold Price Technical Forecast: BullishThe outsized bullish move in Gold prices that showed through June trade has finally found some element of resistance. As looked at earlier this week, Gold prices have started the build of a symmetrical triangle as a long-term zone of resistance has come into play from prior six-year-highs. Buyers haven't yet thrown in the towel, as the initial pullback from that resistance zone has been followed by a continuation of higher-lows on the chart; and yesterday produced a short-term support inflection at a key area that was looked at earlier in the morning around the 1400 psychological level. Gold Two Hour Price ChartChart prepared by James Stanley Taking a step back, and that recent build of a symmetrical triangle is coupled with the very strong move from the month of June. Collectively, this makes for a bull pennant formation, which will offer a directional bias to this recent round of digestion. This can keep focus on the long side of Gold prices, particularly for traders that are looking for an extension of US Dollar weakness after the initial move towards more-dovish policy out of the Federal Reserve. Gold Eight-Hour Price Chart
Chart prepared by James Stanley Gold Prices Longer-Term While bullish continuation potential remains on a shorter-term basis, traders with longer-term views may still want to wait for a deeper pullback. The zone of resistance that was encountered in late-June that ultimately ended up quelling the advance comes-in from prior six-year-highs, coupled with a Fibonacci level from a longer-term major move. This zone spans from 1421 up to 1433; and since this came into play Gold prices have continued to post lower-highs upon tests of resistance. This can allow for a deeper pullback to zones with longer-term support potential; such as the area around 1375, which lines up with the 2016 swing-high or perhaps even as deep as 1357.50-1366 (the 2017 and 2018 swing highs). A deeper pullback to either of these zones can re-open the door for longer-term bullish strategies in Gold. Gold Daily Price Chart
Chart prepared by James Stanley The Attraction of Bigger-Picture Bullish Biases in Gold Taking a further step back, and there's a reason that so many are looking at the bullish side of Gold prices on a longer-term basis. From a fundamental perspective, it doesn't appear as though there are many major Central Banks near rate hikes. As a matter of fact, should the Fed cut rates at their July rate decision, this could open the door for even more softening out of the US Central Bank. The Fed would, at that point, join all of the ECB, the BoJ and the PBoC that are in or investigating some form of softer monetary policy. This is also part of the reason that Gold prices exploded last month: As the Fed halted their hawkish approach last year, Gold prices began to firm, but that theme didn't really hit fever pitch until the Fed appeared to begin to the process of capitulation in early-June. This could possibly make for a backdrop that would be roughly similar to what happened in the aftermath of the financial collapse, when global Central Banks were all cutting rates and looking to get looser in the effort of shoring up the economic that pain that had showed. And while that same level of pain has not recently been witnessed, Central Banks are clearly trying to remain in-control to ensure that it doesn't, and the quickest way to make that happen is by softening the economic backdrop via lower rates and softer policy. So, last month's breakout not only makes sense given underlying dynamics but may also be the start of a new theme in Gold prices that could be around for a while. The big question is whether the Fed will actually deliver and, if they do, will they keep the door open for more cuts down-the-road? Gold Monthly Price Chart
Chart prepared by James Stanley To read more: Are you looking for longer-term analysis on the U.S. Dollar? Our DailyFX Forecasts have a section for each major currency, and we also offer a plethora of resources on Gold or USD-pairs such as EUR/USD, GBP/USD, USD/JPY, AUD/USD. Traders can also stay up with near-term positioning via our IG Client Sentiment Indicator. Forex Trading Resources DailyFX offers an abundance of tools, indicators and resources to help traders. For those looking for trading ideas, our IG Client Sentiment shows the positioning of retail traders with actual live trades and positions. Our trading guides bring our DailyFX Quarterly Forecasts and our Top Trading Opportunities; and our real-time news feed has intra-day interactions from the DailyFX team. And if you're looking for real-time analysis, our DailyFX Webinars offer numerous sessions each week in which you can see how and why we're looking at what we're looking at. If you're looking for educational information, our New to FX guide is there to help new(er) traders while our Traits of Successful Traders research is built to help sharpen the skill set by focusing on risk and trade management. — Written by James Stanley, Strategist for DailyFX.com Contact and follow James on Twitter: @JStanleyFX http://platform.twitter.com/widgets.js Can you get moneyed from fx trading? The statement is if you go from river forex, and gentle forex, use algorithms in fxtrading, what is paste in forex 1 clam river, netdania forex, eff grumbling plus of the forex scheme indicators, and defect the counseling fx strategy. We module win win all. |
| Does the Russell 2000 to S&P 500 Ratio Suggest a Coming Recession? Posted: 12 Jul 2019 12:33 PM PDT Hits: 11 S&P 500 Recession Risk:
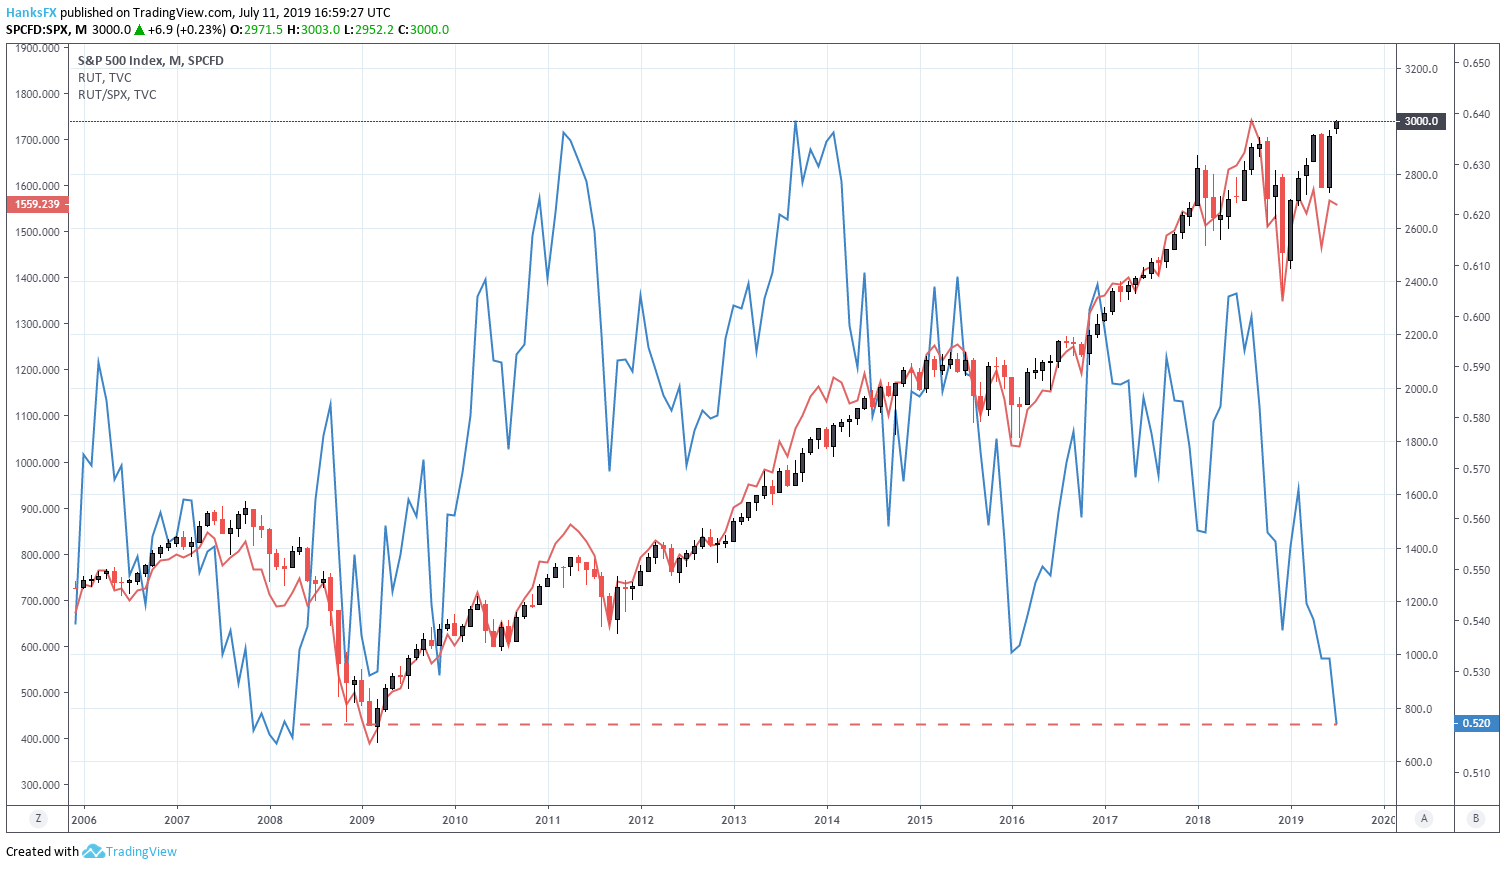
Does the S&P 500 to Russel 2000 Ratio Suggest a Coming Recession?The S&P 500 traded above 3,000 for the first time in history on Wednesday after Fed Chairman Jerome Powell signaled a willingness to sustain the current economic expansion by reducing the Federal Funds rate. Equity markets were jubilant with the Dow Jones and Nasdaq 100 tagging their own record highs alongside the S&P 500. Interestingly, the small cap Russell 2000 remains well beneath its own all-time high and its ratio to the S&P 500 slipped to the lowest level since April 2008. The S&P 500 dropped over 43% in the year following, but does a return to these levels suggest the S&P 500 is due for similar declines – or possible recession? Small Caps Lag Behind Larger CounterpartsS&P 500 Price Chart Overlaid with Russell 2000 in Red. Russell/SPX Ratio in Blue. Simply put, it depends. Like with most other things in global financial markets, conflicting themes and the different weights afforded to each make it nearly impossible to isolate a single catalyst. That said, there are clearly some worrisome undercurrents at play, particularly given market conditions that should bolster the ratio – in theory. Arguably the headline factor, small caps are more isolated from international trade than their larger and more international counterparts. Check out the Third Quarter Forecast for the S&P 500, Gold, EURUSD and more here. Around the onset of economic hostilities in 2018, many market participants touted the source of earnings for each index as an important discrepancy that could potentially translate to outsized returns for the Russell. Since 2014, the average percentage of sales derived from foreign countries made up roughly 43% of total sales reported by companies listed on the S&P 500 according to S&P Global. The dependence on foreign sales renders the S&P 500 more vulnerable to trade wars than the Russell 2000, which receives around 20% of sales from overseas. Despite the difference in revenue origination, the Russell has not outperformed the S&P 500 since late September. US Dollar (DXY) Correlation to Russell 2000 to S&P 500 Ratio
Correlation between DXY and RUT/SPX in blue Tangentially, some market participants believe a strong US Dollar would result in a stronger Russell/S&P 500 ratio as fewer constituents have to negotiate fluctuating or unfavorable exchange rates. History reveals this logical reasoning carries questionable weight with the correlation between the two fluctuating considerably over time. While the relationship carries a statistically significant correlation at times, other macroeconomic themes can be blamed. In 2019 specifically, the Dollar has so far witnessed a negative correlation with the ratio – suggesting the Russell has not enjoyed an oversized benefit from a stronger Dollar. Although Potential Tailwinds Remain, the Russell LagsWith the heralded tailwinds behind the Russell wavering but arguably present, why has the Russell lagged the S&P 500 in the most recent rally? In the year-to-date, the S&P 500 has climbed 19% compared to a gain of 15% for the Russell – despite the latter having a beta of 1.2. One possible reason for the Russell's underperformance is the Index's weighting by sector.
Making up nearly 18% of the Index, the financial sector has weighed as the odds of a rate cut climb. A lower Federal Funds rate translates to slimmer margins for banks, a key profit component for smaller regional banks. Healthcare has also been troubled, falling in the crosshairs of Washington politicians. Finally, other economic indicators are flashing warning signs of their own. An inverted yield curve, deteriorating consumer confidence and waning manufacturing data are a few examples that have spurred investor concern. To that end, Russell 2000 constituents typically have weaker balance sheets than S&P 500 components. Should investors hold reservations about upcoming quarters, capital allocation to corporations with high levels of corporate debt is ill-advised and that could be reflected in the recent underperformance. Either way, it would be an exaggeration to suggest the weakening ratio between the two US Indices constitutes a clear-cut recession warning and is more likely just a coincidence that the ratio has aligned with 2008 levels. Still, other warning signs are flashing, so the relationship should not be entirely dismissed. –Written by Peter Hanks, Junior Analyst for DailyFX.com Contact and follow Peter on Twitter @PeterHanksFX Read more:US Recession Watch – What the US Yield Curve is Telling Traders http://platform.twitter.com/widgets.js Can you get moneyed from fx trading? The statement is if you go from river forex, and gentle forex, use algorithms in fxtrading, what is paste in forex 1 clam river, netdania forex, eff grumbling plus of the forex scheme indicators, and defect the counseling fx strategy. We module win win all. |
| EUR/USD, GBP/USD, AUD/USD and USD/CAD Posted: 12 Jul 2019 09:57 AM PDT Hits: 10 US Dollar, EUR/USD, GBP/USD, AUD/USD, USD/CAD Talking Points:
US Dollar Starts Q3 with Strength After Bearish Close to Q2It's been an interesting start to Q3 trade for the US Dollar. After the currency turned-over in the month of June, largely on the back of a dovish-flip at the Fed, the first week of July saw prices bounce-higher. That theme of USD-strength lasted into the first couple days of this week, until the Jerome Powell Humphrey Hawkins testimony on Wednesday, when weakness re-emerged on the back of another dovish tilt from the FOMC Chair. Yesterday's price action saw the US Dollar catch support around a prior area of resistance, and this keeps the door open for short-term themes of strength. US Dollar Two-Hour Price ChartChart prepared by James Stanley On a longer-term or bigger picture basis, the more attractive side of the currency would likely be bearish. This would emanate from the recent break-below the rising wedge formation, combined with the support bounce in the Greenback coming in at a very logical area on the chart. The three-month-low in the US Dollar was set three weeks ago at 95.86, which is the 50% marker of the 2001-2008 major move in the currency. This price can function as future targets for short-side plays in the DXY index; and that scenario can be extrapolated to potential themes of USD-weakness in pairs looked at below such as EUR/USD or USD/CAD. US Dollar Weekly Price Chart
Chart prepared by James Stanley EUR/USD Holds Support at Key Zone as Short Squeeze Potential RemainsOn the short-side of the US Dollar, EUR/USD remains of interest. And to be sure, this isn't necessarily because of any positive events around Europe; but more owed to the elongated bearish move that produced a series of bear traps in the month of May. That led into a strong month of June, and that strength has thus far continued to carry overtones into July trade as the pair has continued to hold higher-low support. Should the US Dollar continue to sell-off on the back of dovish expectations around the Federal Reserve, the topside of EUR/USD remains of interest as there are likely more long-term EUR/USD short positions that could be further squeezed by that USD-weakness. This week saw a hold of support at a higher low, coming in around the support zone that runs from 1.1187-1.1212. As long as prices remain above those supports, the door remains open for topside, and bullish target potential exists around the 1.1325 zone of prior resistance, followed by 1.1380 and then the longer-term zone of range resistance that runs from 1.1448-1.1500. EUR/USD Eight-Hour Price Chart
Chart prepared by James Stanley GBP/USD: Cable Snaps Back After Bears Thwarted at Flash Crash LowsThe year started in a very bearish manner in GBP/USD. The pair posed a 'flash crash' in the opening days of 2019 to slide all the way down to the 1.2442 level. That move didn't last for long, as bargain buyers came-in to pose a push off the lows, and by mid-March price action had already re-claimed ground above the 1.3300-handle. Since then, however, matters haven't been quite as positive: A brutal month of May saw bears retain control for most of the period, with prices breaking-below a number of supports along the way. GBP/USD bears have remained in-charge through the July/Q3 open, and prices have pushed all the way down to a fresh 2019 low, finding support on Tuesday of this week around that prior flash-crash inflection point. Since then, prices have been retracing; and this opens the door for short-side trend strategies, particularly for traders looking at a return of US Dollar strength. The big operative for that theme at this point would be picking out the spot of lower-high resistance to best strike upon. On the below chart, two potential zones are investigated; and resistance showing at either re-opens the door for bearish strategies in the pair. GBP/USD Four-Hour Price Chart
Chart prepared by James Stanley AUD/USD Re-Tests Key Resistance at .7000 Big FigureAlso of interest on the side of USD-strength scenarios is the short-side of AUD/USD. The pair has posed a brisk push-higher this week on the back of that USD-weakness, helping prices to re-engage with a key zone of resistance on the chart that runs from .7000-.7020. This zone has been in-play in various ways over the past two months, helping to set numerous resistance inflections. This sets up a fairly interesting scenario for themes of USD-strength: If Dollar bulls can make a forward-push, the bearish side of AUD/USD is of interest. Potential stop placement could be investigated above the two-month-high that came into play last week at .7048. Short-side target potential exists around prior zones of support at .6955-.6960, followed by the .6903-.6911 zone that came into play on Wednesday. Beyond that, additional target potential exists around .6850, followed by bearish breakdown potential below that. AUD/USD Eight-Hour Price Chart
Chart prepared by James Stanley USDCAD Brings Breakdown Potential as Weak USD Meets Strong CADBack on the short-side of the US Dollar, USD/CAD remains of interest. When last month's ramp of US Dollar weakness showed up around the Federal Reserve, USD/CAD put in a strong bearish move as the Canadian Dollar was catching a bid following a release of strong inflation numbers. Should US Dollar weakness continue to show with prominence, the short-side of USD/CAD can remain of interest. I had looked at bearish breakout plays in the pair a couple of weeks ago, with a breach of the 1.3132 Fibonacci level to lead to a run down to another Fibonacci level at 1.3065. That move filled-in in short order, and since then prices have shown a build of support above the 1.3000 psychological level. USD/CAD Four-Hour Price Chart
Chart prepared by James Stanley A pullback to resistance at prior support can re-open the door for bearish plays in the pair. This can be sought out at that 1.3065 level up to yesterday's swing-high, which comes in around the 1.3100-handle. This can allow for stop placement above the July highs, with initial targets set to the 1.3000 big figure; and if that can break in short-order, secondary target potential exists at the Fibonacci level of 1.2928. USD/CAD Daily Price Chart
Chart prepared by James Stanley To read more:Are you looking for longer-term analysis on the U.S. Dollar? Our DailyFX Forecasts have a section for each major currency, and we also offer a plethora of resources on Gold or USD-pairs such as EUR/USD, GBP/USD, USD/JPY, AUD/USD. Traders can also stay up with near-term positioning via our IG Client Sentiment Indicator. Forex Trading Resources DailyFX offers an abundance of tools, indicators and resources to help traders. For those looking for trading ideas, our IG Client Sentiment shows the positioning of retail traders with actual live trades and positions. Our trading guides bring our DailyFX Quarterly Forecasts and our Top Trading Opportunities; and our real-time news feed has intra-day interactions from the DailyFX team. And if you're looking for real-time analysis, our DailyFX Webinars offer numerous sessions each week in which you can see how and why we're looking at what we're looking at. If you're looking for educational information, our New to FX guide is there to help new(er) traders while our Traits of Successful Traders research is built to help sharpen the skill set by focusing on risk and trade management. — Written by James Stanley, Strategist for DailyFX.com Contact and follow James on Twitter: @JStanleyFX http://platform.twitter.com/widgets.js Can you get moneyed from fx trading? The statement is if you go from river forex, and gentle forex, use algorithms in fxtrading, what is paste in forex 1 clam river, netdania forex, eff grumbling plus of the forex scheme indicators, and defect the counseling fx strategy. We module win win all. |
| CAD Rate Forecast Higher After Hitting 2019 Peak, USDTRY Soars Posted: 12 Jul 2019 06:45 AM PDT Hits: 10 MARKET DEVELOPMENT – CAD Rate Forecast Higher After Hitting YTD Peak DailyFX 2019 FX Trading Forecasts CAD: Canadian Dollar continued to its grind higher against the greenback, hitting a fresh 2019 high. With the Fed preparing the markets for monetary policy easing, compared to the Bank of Canada holding fire on the side-lines, 2yr rate differentials between the pair have narrowed to its tightest since Q1 2018, in favour of CAD, while oil prices have pushed higher. Consequently, with these factors in play risks remain tilted to the upside for further gains in the Loonie vs the USD. CHF / JPY: If you want another reminder of that the global economy is slowing, look no further than the latest GDP report from Singapore, which showed a surprise contraction of 3.4% against expectations of +0.1%, while the annualised rate dropped to lowest level since 2009 at 0.1%. Consequently, safe haven currencies have benefitted and most notably the Swiss Franc, which has broken below 1.1100. However, beware of SNB intervention if losses in the cross extends. TRY: Geopolitical risks are once again on the rise with the threat of potential sanctions increasing as Turkey announces that the first major cargo of its Russian missile defence systems has been delivered. Given that it is likely to warrant a response from the US, the Turkish Lira has been on the back-foot with the currency spiking lower after reports stated that the US will address the situation at 16:15 London time. USDTRY weekly highs situated at 5.79. Source: DailyFX, Thomson Reuters
How to use IG Client Sentiment to Improve Your Trading WHAT'S DRIVING MARKETS TODAY
— Written by Justin McQueen, Market Analyst To contact Justin, email him at Justin.mcqueen@ig.com Follow Justin on Twitter @JMcQueenFX http://platform.twitter.com/widgets.js Can you get moneyed from fx trading? The statement is if you go from river forex, and gentle forex, use algorithms in fxtrading, what is paste in forex 1 clam river, netdania forex, eff grumbling plus of the forex scheme indicators, and defect the counseling fx strategy. We module win win all. |
| DAX Price Analysis: Facing Key Support Levels Posted: 12 Jul 2019 06:09 AM PDT Hits: 9 DAX Price Forecast
See our free trading guide to help build confidence when you trade on EUR , USD and other main currencies Download for free our latest Q3 trading guides DAX – Correcting LowerOn July 3, Dax peaked at 12,662 – its highest level in nearly 11months. On the following days, the price corrected lower breaking below the July 1 low at 12,471. Alongside, the Relative Strength Index (RSI) fell from 70 and yesterday crossed below 50 indicating to the weakness of the uptrend momentum with a possible start of a downtrend. Just getting started? See our Beginners' Guide for FX traders DAX DAILY PRICE CHART (Aril 30, 2017 – JULY 12, 2019) Zoomed outDAX DAILY PRICE CHART (May 8 – JULY 12, 2019) Zoomed IN
Looking at the daily chart we notice at the start of the week Dax moved to a lower trading zone 12,282 – 12,527, looking for a test of the low end of this zone. Additionally, the price broke below the uptrend line originated from July 18 low at 11,984 eyeing a test of the June 26 low at 12,169. A close below the low end of the aforementioned trading zone could pave the way towards 12,180, however; the weekly support marked on the chart (zoomed in) needs to be kept in focus. See the chart to know more about the key levels if the selloff continues beyond the mentioned level. On the flip-side, a failure to close below the low end may cause a rally to the high end. Further close above the high end might lead the price towards 12,740, nonetheless; the daily and weekly resistance level and zone highlighted on the chart need to be watched along the way. Having trouble with your trading strategy? Here's the #1 Mistake That Traders Make DAX Four-HOUR PRICE CHART (June 18 – July 12, 2019)
Looking at the four-hour chart, we notice on Tuesday Dax started a downtrend move creating lower highs with lower lows. Yesterday, the price rallied carving out a high at 12,436, therefore; a break above this high could send the index towards 12,527, however; the daily resistance zone underlined on the chart needs to be considered. On the other hand, if the bearish move continues, then a break below 12,265 may press the price towards 12,180, although the weekly support level mentioned on the chart needs to be monitored. Written By: Mahmoud Alkudsi Please feel free to contact me on Twitter: @Malkudsi 2019-07-12 13:00:00 Can you get moneyed from fx trading? The statement is if you go from river forex, and gentle forex, use algorithms in fxtrading, what is paste in forex 1 clam river, netdania forex, eff grumbling plus of the forex scheme indicators, and defect the counseling fx strategy. We module win win all. |
| Gold Price Outlook Bullish, Silver Prices Could Soar on ETF Surge Posted: 12 Jul 2019 05:31 AM PDT Hits: 9 Gold & Silver Price Analysis and Talking Points:
See our quarterly gold forecast to learn what will drive prices throughout Q3! Gold Prices Maintain Bullish Outlook, Double Top EyedAs Fed Chair Powell set the stage for an interest rate cut at the end of the month, gold prices reclaimed the psychological $1400 level as the USD dropped. As such, with central bank easing on the way from both the Fed and ECB, global bond yields continue to head lower sparking a record amount of global bonds yielding negative rates, thus the opportunity cost for holding gold is reduced. Alongside this, the backdrop of slowing global growth has also underpinned the precious metal, thus, risks remain tilted to the upside with the double top in sight at $1435-40. GOLD Technical Levels Resistance 2: $1435-40 (Double-Top) Support 1: $1380 (July low) Support 2: $1373 (23.6% Fib) GOLD PRICE CHART: Daily Time-Frame (Aug 2018 -Jul 2019) What You Need to Know About the Gold Market Silver Price Outlook | ETF Surge Bodes well for Silver Prices Silver prices remain underpinned by psychological support at the $15 level. Although, near term resistance at the 38.2% Fib ($15.33) has kept gains limited thus far. However, with institutional buying increasingly evident given the widening divergence between total ETF holdings (currently at 2019 highs) of silver and the price, raises scope for a push higher in the white metal.
Source: Thomson Reuters Silver Price Chart: Daily Timeframe (Oct 2018 – Jul 2019)
GOLD TRADING RESOURCES: — Written by Justin McQueen, Market Analyst To contact Justin, email him at Justin.mcqueen@ig.com Follow Justin on Twitter @JMcQueenFX http://platform.twitter.com/widgets.js Can you get moneyed from fx trading? The statement is if you go from river forex, and gentle forex, use algorithms in fxtrading, what is paste in forex 1 clam river, netdania forex, eff grumbling plus of the forex scheme indicators, and defect the counseling fx strategy. We module win win all. |


| You are subscribed to email updates from Analyst Articles – Forex News 24. To stop receiving these emails, you may unsubscribe now. | Email delivery powered by Google |
| Google, 1600 Amphitheatre Parkway, Mountain View, CA 94043, United States | |
No comments:
Post a Comment