
Forex analysis review |
- Fractal analysis of major currency pairs on July 12
- #USDX vs GBP / USD H4 vs EUR / USD H4. Comprehensive analysis of movement options from July 12, 2019. Analysis of APLs &
- What does Powell bring to the dollar?
- The pound could rise to $1.30, but you shouldn't buy it yet - RBC
- GBP/USD. July 11th. Results of the day. The Bank of England's financial stability report leaves much to be desired
- EUR/USD: US inflation drowned out the upward impulse
- EUR/USD. July 11th. Results of the day. US inflation slows down, Powell begins second congressional speech
- EURUSD: The ECB minutes indicate the possibility of returning to the bond redemption program, which will weaken the euro's
- July 11, 2019 : GBP/USD Intraday technical analysis and trade recommendations.
- Ichimoku cloud indicator analysis of EURUSD for July 11, 2019
- Gold price remains inside trading range
- July 11, 2019 : The market is offering a valid SELL entry for the EUR/USD pair around 1.1275.
- Gold 07.11.2019 - Rejection of the important resistance at $1.425
- EUR/USD for July 11,2019 - Rejection of the key resistance at 1.1280.
- BTC 07.11.2019 - Broken upward channel and bear flag in creation
- Technical analysis of GBP/USD for July 11, 2019
- Technical analysis of AUD/USD for July 11, 2019
- Fractal analysis of major currency pairs on July 11
- GBP/USD: plan for the American session on July 11. Buyers of the pound ignored the statements of the Bank of England
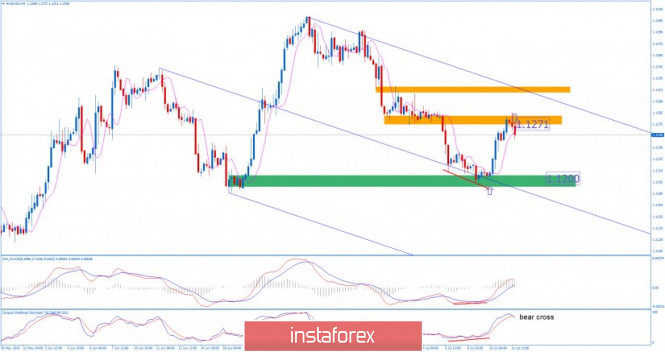
- EUR/USD: plan for the American session on July 11. Inflation data in the US may continue to rise in the euro
- Gold and platinum: partnership or competition?
- The Fed has tripped cryptocurrency
- Trading recommendations for the EURUSD currency pair - placement of trading orders (July 11)
- Powell and the Fed are apparently ready to follow the direction indicated by Trump, will the dollar follow them?
- BITCOIN below $11,500 indicates another bounce. July 11, 2019
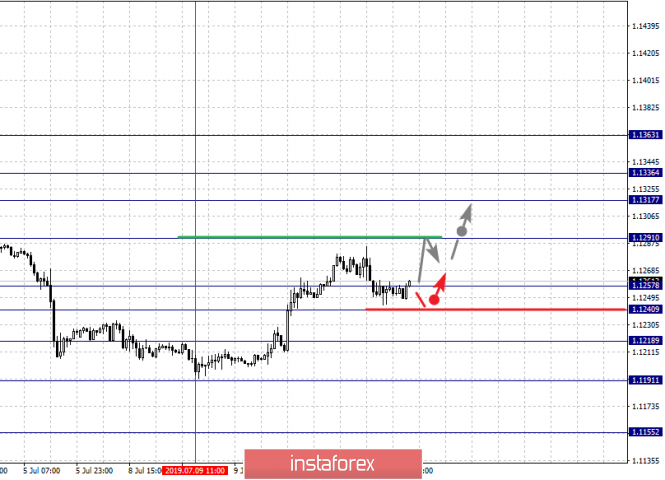
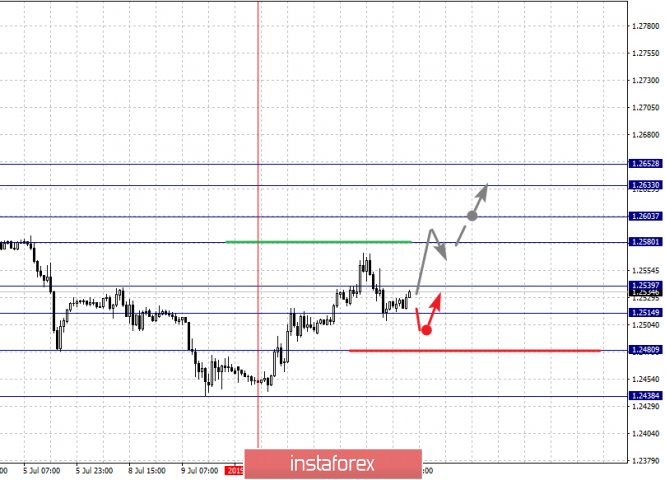
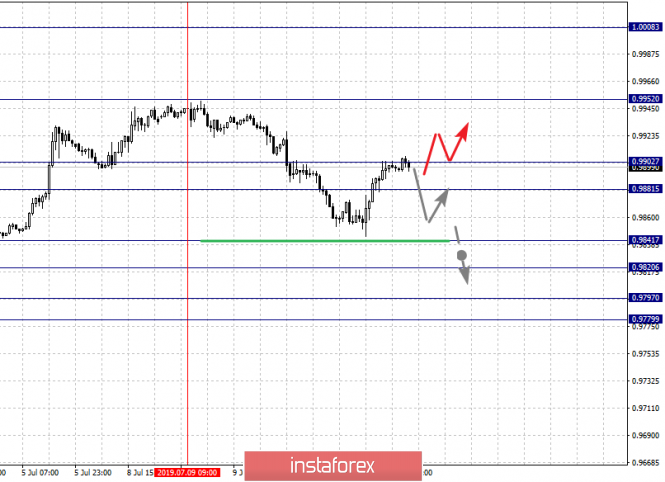
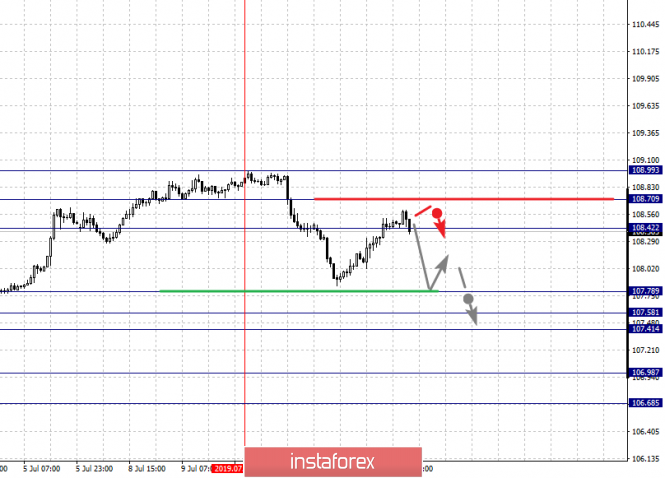
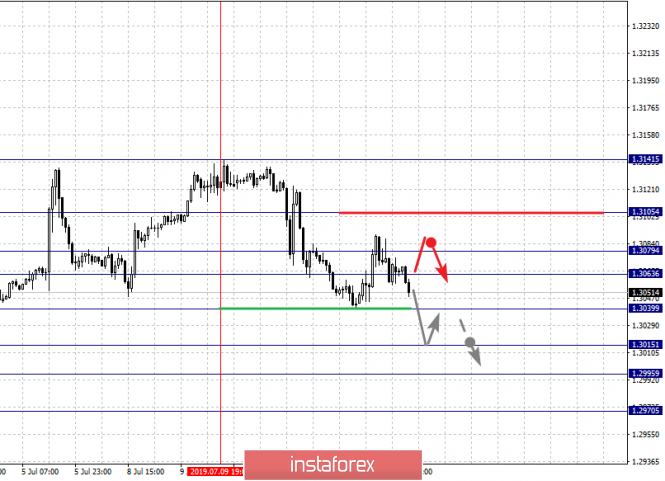
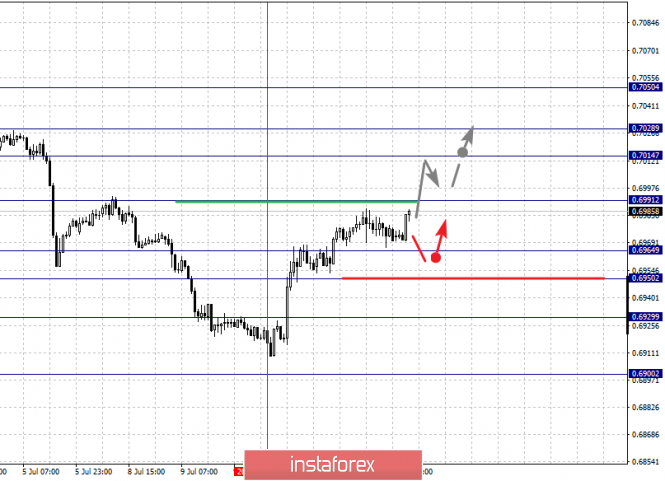
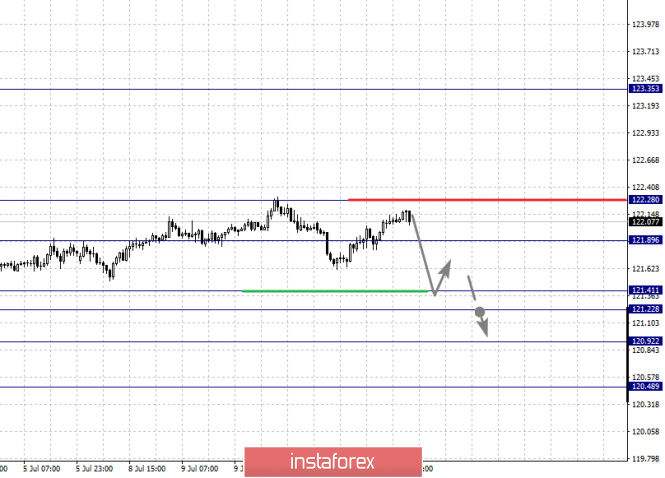
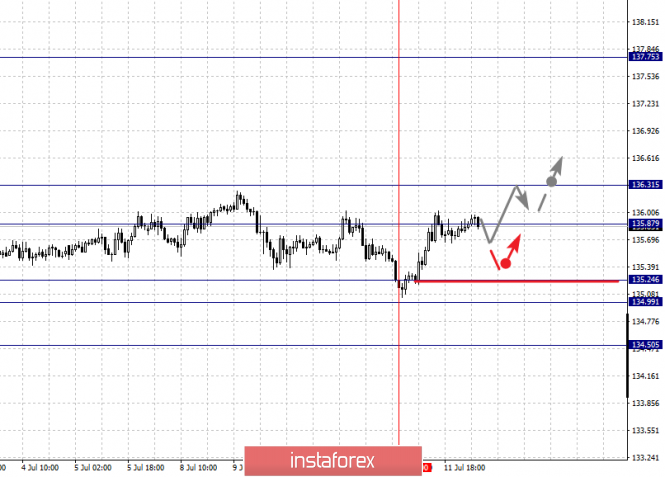
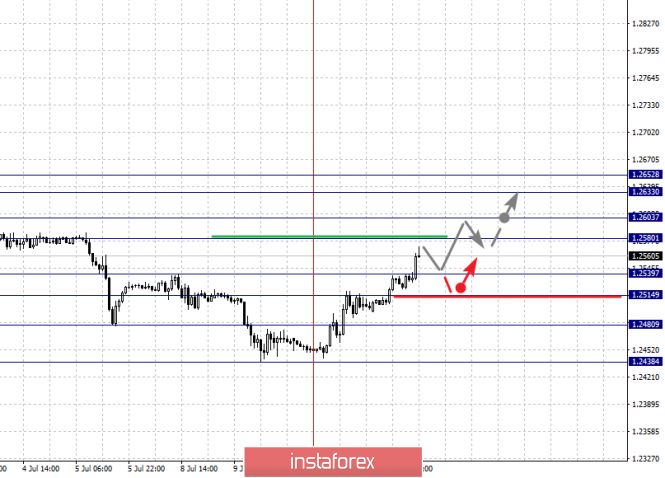
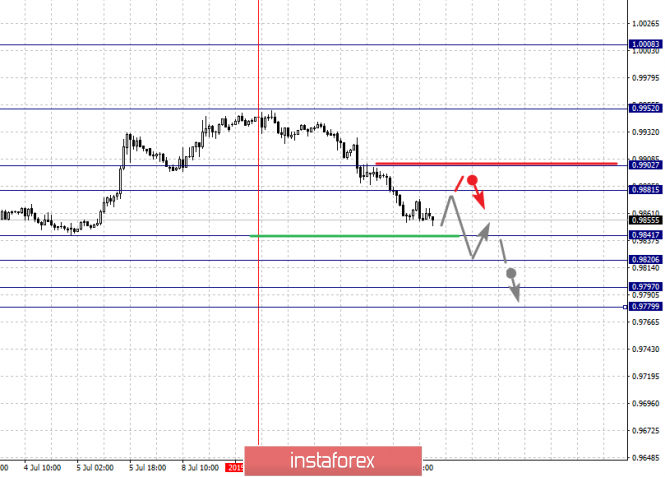
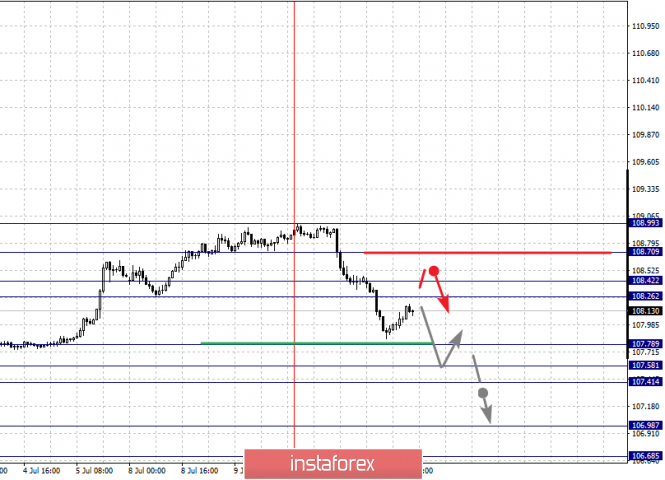
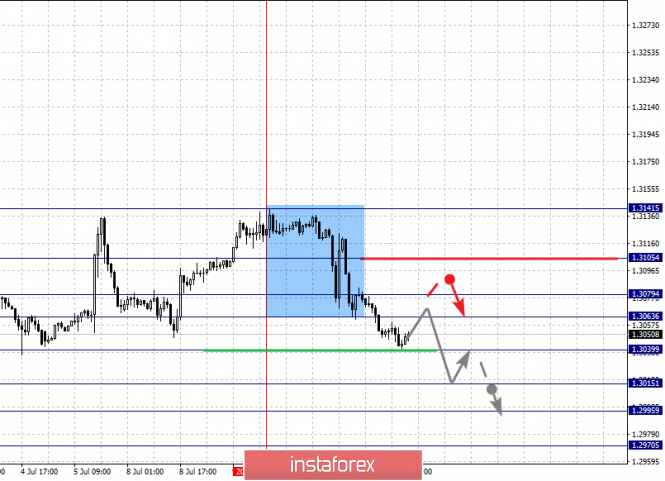
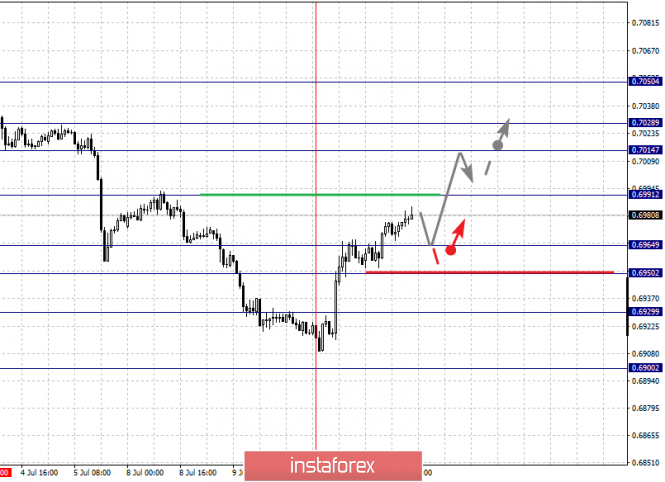
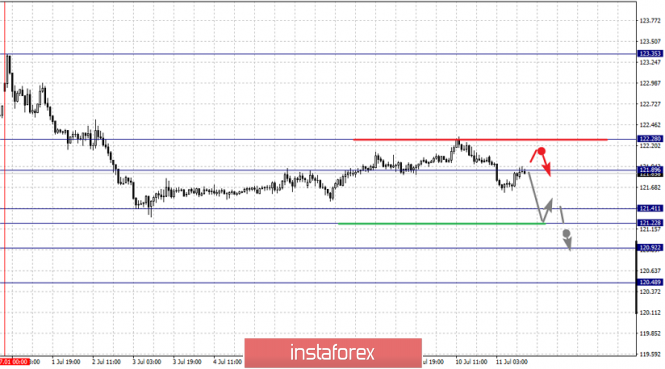
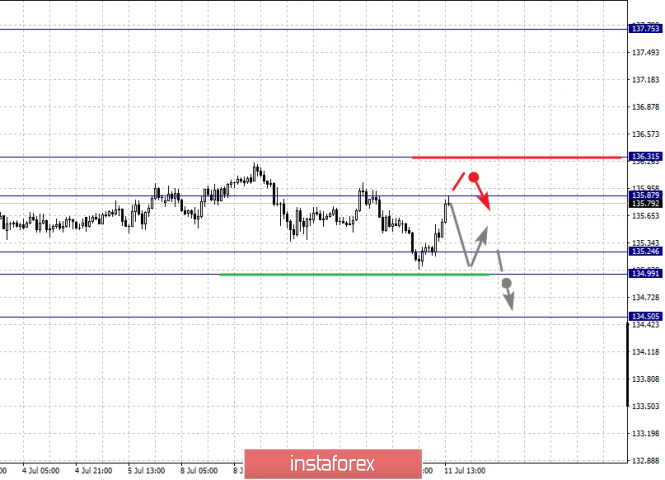
| Fractal analysis of major currency pairs on July 12 Posted: 11 Jul 2019 07:03 PM PDT Forecast for July 12: Analytical review of H1-scale currency pairs: For the euro / dollar pair, the key levels on the H1 scale are: 1.1363, 1.1336, 1.1317, 1.1291, 1.1257, 1.1240, 1.1218, 1.1191 and 1.1155. Here, the price forms the ascending structure of July 9. The continuation of the movement to the top is expected after the breakdown of the level of 1.1291. In this case, the goal is 1.1317. Short-term upward movement, as well as consolidation is in the range of 1.1317 - 1.1336 . For the potential value for the top, we consider the level of 1.1363. After reaching which, we expect a rollback to the bottom. Short-term downward movement is possible in the range of 1.1257 - 1.1240. The breakdown of the latter value will lead to in-depth correction. Here, the goal is 1.1218. This level is a key support for the downward structure. Its breakdown will allow to count on the movement to the level 1.1191. The main trend is the formation of the ascending structure of July 9. Trading recommendations: Buy 1.1291 Take profit: 1.1317 Buy 1.1336 Take profit: 1.1360 Sell: 1.1256 Take profit: 1.1241 Sell: 1.1238 Take profit: 1.1218 For the pound / dollar pair, the key levels on the H1 scale are: 1.2652, 1.2633, 1.2603, 1.2580, 1.2539, 1.2514, 1.2480 and 1.2438. Here, we are following the development of the ascending structure of July 10. At the moment, we expect to move to the level of 1.2580. Short-term upward movement is possible in the range of 1.2580 - 1.2603. The breakdown of the latter value should be accompanied by a pronounced upward movement. Here, the target is 1.2633. For the potential value for the top, we consider the level of 1.2652. After reaching which, we expect consolidation, as well as a rollback to the bottom. Consolidated movement is expected in the range of 1.2539 - 1.2514. The breakdown of the last value will lead to a prolonged correction. Here, the target is 1.2480. This level is a key support for the upward structure. The main trend - the ascending structure of July 10. Trading recommendations: Buy: 1.2580 Take profit: 1.2602 Buy: 1.2604 Take profit: 1.2633 Sell: 1.2539 Take profit: 1.2515 Sell: 1.2512 Take profit: 1.2482 For the dollar / franc pair, the key levels on the H1 scale are: 0.9952, 0.9902, 0.9881, 0.9841, 0.9820, 0.9797 and 0.9779. Here, the price forms the downward structure of July 9 and is currently in correction. The continuation of the movement to the bottom is expected after the breakdown of the level of 0.9841. In this case, the goal is 0.9820. The breakdown of which, in turn, will allow us to count on the movement to 0.9797. For the potential value for the downward trend, we consider the level of 0.9779. Upon reaching this level we expect a rollback to the correction. Consolidated movement is possible in the range of 0.9902 - 0.9881. The breakdown of the latter value will have to form the initial conditions for the upward cycle. Here, the potential target is 0.9952. The main trend is the formation of the downward structure of July 9, the stage of correction. Trading recommendations: Buy : 0.9910 Take profit: 0.9950 Sell: 0.9840 Take profit: 0.9822 Sell: 0.9818 Take profit: 0.9797 For the dollar / yen pair, the key levels on the scale are : 108.99, 108.70, 108.42, 108.26, 107.78, 107.58, 107.41, 106.98 and 106.68. Here, we are following the downward structure of July 10th. The continuation of the movement to the bottom is expected after the breakdown of the level of 107.78. Here, the goal is 107.58, and near this level is a price consolidation. A passage at the price of the noise range 107.58 - 107.41 will lead to the development of a pronounced movement. In this case, the goal is 106.98. For the potential value for the bottom, we consider the level of 106.68. From which, we expect a rollback to the top. Short-term upward movement is possible in the range of 108.26 - 108.42. The breakdown of the last value will lead to a prolonged correction. Here, the target is 108.70. This level is a key support for the top. The main trend: the formation of a downward structure of July 10. Trading recommendations: Buy: 108.26 Take profit: 108.40 Buy : 108.43 Take profit: 108.70 Sell: 107.78 Take profit: 107.58 Sell: 107.40 Take profit: 107.00 For the Canadian dollar / US dollar pair, the key levels on the H1 scale are: 1.3105, 1.3079, 1.3063, 1.3039, 1.3015, 1.2995 and 1.2970. Here, we are following the formation of the downward structure of July 9th. The continuation of the movement to the bottom is expected after the breakdown of the level of 1.3039. In this case, the target is 1.3015. Short-term downward movement, as well as consolidation is in the range of 1.3015 - 1.2995. For the potential value for the bottom, we consider the level of 1.2970. After reaching which, we expect a rollback to the top. Short-term upward movement is possible in the range of 1.3063 - 1.3079. The breakdown of the latter value will lead to in-depth correction. Here, the goal is 1.3105. This level is a key support for the downward structure of July 9. The main trend - the formation of the potential for the downward movement of July 9. Trading recommendations: Buy: 1.3063 Take profit: 1.3078 Buy : 1.3081 Take profit: 1.3105 Sell: 1.3039 Take profit: 1.3015 Sell: 1.3013 Take profit: 1.2995 For the pair Australian dollar / US dollar, the key levels on the H1 scale are : 0.7050, 0.7028, 0.7014, 0.6991, 0.6964, 0.6950, 0.6929 and 0.6900. Here, we follow the formation of the initial conditions for the upward cycle of July 10. The continuation of the movement to the top, is expected after the breakdown of the level of 0.6991. In this case, the goal is 0.7014. Short-term upward movement, as well as consolidation is in the range of 0.7014 - 0.7028. For the potential value for the top, we consider the level of 0.7050. Short-term downward movement is possible in the range of 0.6964 - 0.6950. The breakdown of the last value will lead to in-depth correction. Here, the goal is 0.6929. This level is a key support for the upward structure. The main trend is the formation of the ascending structure of July 10. Trading recommendations: Buy: 0.6991 Take profit: 0.7014 Buy: 0.7015 Take profit: 0.7026 Sell : 0.6964 Take profit : 0.6952 Sell: 0.6948 Take profit: 0.6930 For the euro / yen pair, the key levels on the H1 scale are: 122.28, 121.89, 121.67, 121.41, 121.22, 120.92 and 120.48. Here, the price entered an equilibrium state: a mid-term descending structure of July 1. The continuation of the movement to the bottom is expected after passing by the price of the noise range 121.41 - 121.22. In this case, the goal is 120.92, and near this level, there is a consolidation. For the potential value for the bottom, we consider the level of 120.48. After reaching which, we expect a rollback to the top. Consolidated movement is possible in the range of 121.89 - 122.28. The level of 122.28 is a key support for the downward structure. Its price passage will have to form the initial conditions for the upward cycle. The main trend is the mid-term descending structure of July 1, the equilibrium state. Trading recommendations: Buy: Take profit: Buy: 121.94 Take profit: 122.28 Sell: 121.22 Take profit: 120.94 Sell: 120.90 Take profit: 120.50 For the pound / yen pair, the key levels on the H1 scale are : 136.31, 135.87, 135.65, 135.24, 134.99 and 134.50. Here, the price forms a small potential for the top of July 11. The development of this structure is possible after the breakdown of the level of 136.31. Short-term downward movement is expected in the range of 135.24 - 134.99. The breakdown of the last value will allow us to expect movement towards a potential target - 134.50. After reaching this level, we expect a rollback to the top. Short-term upward movement is possible in the range of 135.87 - 136.31. Up to the level of 136.31, we expect the potential for the upward cycle to be formalized. The main trend is the downward cycle of July 1, the stage of correction. Trading recommendations: Buy: Take profit: Buy: 135.90 Take profit: 136.30 Sell: 135.24 Take profit: 135.00 Sell: 134.95 Take profit: 134.50 The material has been provided by InstaForex Company - www.instaforex.com |
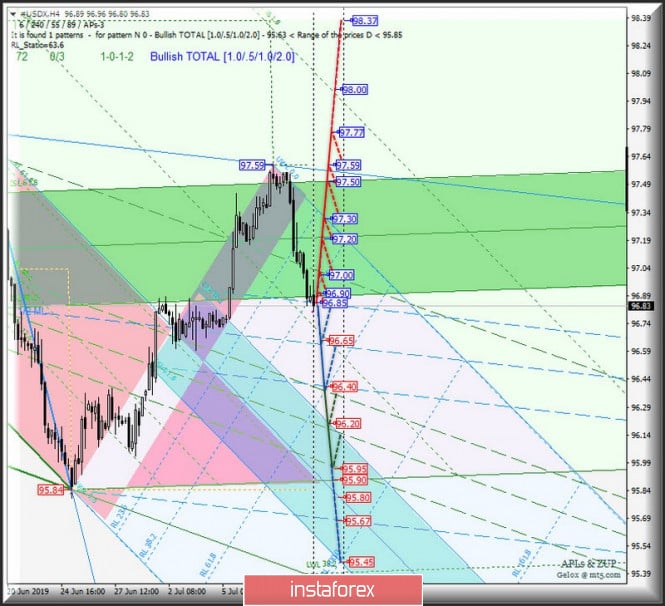
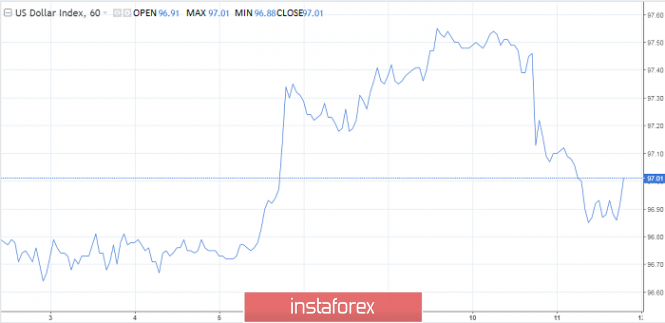
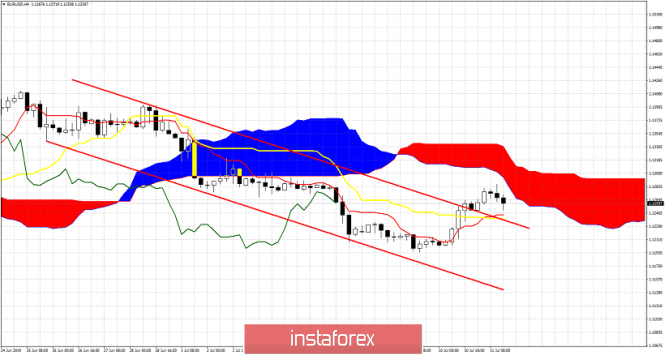
| Posted: 11 Jul 2019 05:25 PM PDT Let's take a comprehensive look at how #USDX vs EUR / USD h4 vs GBP / USD h4 will behave from July 12, 2019. Minuette operating scale (H4) ____________________ US dollar Index From July 12, 2019, the dollar index #USDX will continue to develop its movement depending on the development and direction of the breakdown of the 1/2 Median Line channel boundaries (96.85 - 96.65 - 96.40) of the Minuette operational scale. More details about the movement options inside this channel are shown in the animated graphic. In the case of a breakdown of the upper boundary of the 1/2 Median Line channel (resistance level of 96.85), Minuette operating scale fork together with ISL38.2 Minuette (96.90), the development of the dollar index movement will begin again in the equilibrium zone (96.90 - 97.20 - 97.50) of the Minuette operating scale fork, and if the breakdown of the ISL61.8 Minuette (resistance level of 97.50) happens, then updating the #USDX local maximums (97.59 - 97.77) will become necessary. On the other hand, in case of breakdown of the support level of 96.40 (the lower boundary of the 1/2 Median Line channel of the Minuette operational scale), further development of the dollar index movement will continue in the 1/2 Median Line channel (96.40 - 96.20 - 95.95) of the Minuette operational scale fork. The details of the #USDX movement are demonstrated in the animated graphics.
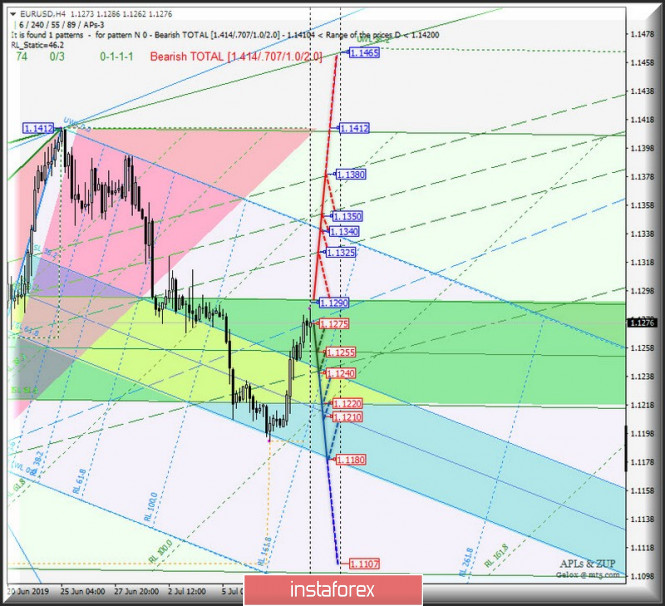
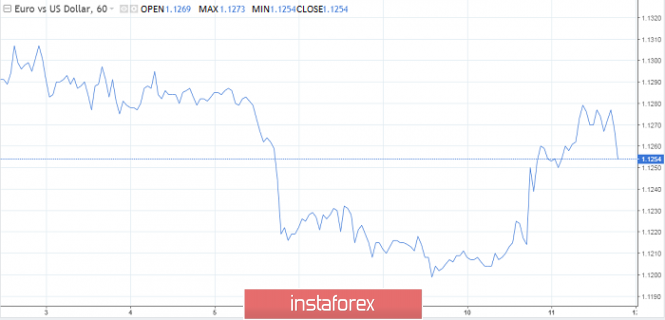
____________________ Euro vs US Dollar The development of the movement of the single European currency EUR / USD from July 12, 2019 will be due to the direction of the range breakdown: resistance level of 1.1290 at the upper boundary of the ISL38.2 equilibrium zone of the Minuette operating scale fork; support level of 1.1275 on the ultimate Schiff Line of the Minuette operating scale fork. In case that the single European currency returns below the support level of 1.1275 (final Schiff Line Minuette), then the development of this movement will be directed to the Median Line Minuette (1.1255), and if it breaks down, it will be possible to return EUR / USD to the equilibrium zone (1.1240 - 1.1210 - 1.1180) Minuette operating scale fork. The breakdown of the upper boundary of the ISL38.2 (resistance level of 1.1290) of the equilibrium zone of the Minuette operational scale fork will determine the continuation of the upward movement of the single European currency to the boundaries of the 1/2 Median Line Minuette channel (1.1325 - 1.1350 - 1.1380). Details of the EUR / USD movement options are shown in the animated graphic.
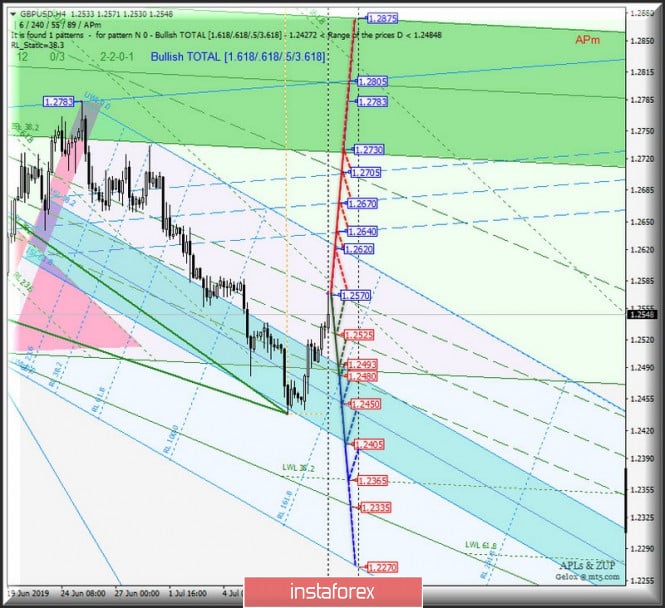
____________________ Great Britain Pound vs US Dollar Her Majesty's currency GBP / USD continues to remain in the 1/2 Median Line channel (1.2570 - 1.2525 - 1.2480) of the Minuette operating scale, and accordingly, the further development of the movement of this instrument will depend on the development and direction of the breakdown of the above levels. The options for movement within this channels can be seen in the animated graphics. The breakdown of the lower boundary of the 1/2 Median Line channel of the Minuette operating scale (support level of 1.2480) will determine the further development of GBP / USD movement in the equilibrium zone (1.2493 - 1.2450 - 1.2405) of the Minuette operational scale fork, with the option after the breakdown of ISL61.8 Minuette (support level of 1.2405), reaching the warning line LWL38.2 (1.2365) of the Minuette operating scale fork. If the resistance level of 1.2570 has broken through the upper boundary of the 1/2 Median Line Minuette channel, then the upward movement of Her Majesty's currency will be directed to the initial SSL line (1.2620) and the 1/2 Median Line channel limits (1.2640 - 1.2670 - 1.2705) of the Minuette operating scale. The details of the GBP / USD movement are presented in the animated graphic.
____________________ The review was compiled without taking into account of the news background. The opening of trading sessions of the main financial centers does not serve as a guide to action (placing orders "sell" or "buy"). The formula for calculating the dollar index is: USDX = 50.14348112 * USDEUR0.576 * USDJPY0.136 * USDGBP0.119 * USDCAD0.091 * USDSEK0.042 * USDCHF0.036. where power ratios correspond to the weights of currencies in the basket: Euro - 57.6% ; Yen - 13.6%; Pound sterling - 11.9% ; Canadian dollar - 9.1%; Swedish krona - 4.2%; Swiss franc - 3.6%. The first coefficient in the formula gives the index value to 100 on the starting date - March 1973, when the main currencies began to be freely quoted relative to each other. The material has been provided by InstaForex Company - www.instaforex.com |
| What does Powell bring to the dollar? Posted: 11 Jul 2019 04:36 PM PDT It seems that the head of the Fed finally convinced the market of a rate cut in the near future. Under the influence of the regulator's dovish mood, the dollar index fell from three-week highs, which it held in recent days. The "minutes" of the Fed were ignored by the market, although it followed that not all central bank officials were ready for policy easing. Traders preferred to listen to the words of Jerome Powell, who, in their opinion, gave a clear signal for aggressive policy easing. The head of the Federal Reserve Bank of St. Louis, James Bullard, also played a role here, stating that a quarter-percent reduction in rates is necessary to keep the US economy from slowing down due to a trade war and amid steadily low inflation. However, today the United States published a report according to which consumer prices in the country unexpectedly rose in June by 0.1%. Economists were counting zero dynamics of the indicator. Powell is set to hold another speech on Thursday. It is unlikely that he will add something fundamentally new to what he said yesterday regarding the prospects for policy easing, but anything can happen. If, for example, he more accurately speaks about an immediate rate cut by 0.50%, then the dollar can repeat yesterday's scenario. The EUR/USD pair will get every chance to go towards the 1.1400 mark. Under other circumstances, there is a risk that quotes would reverse dowards. The trigger to pull down the main pair could be the publication of the minutes from the ECB's June meeting. However, this did not happen, the euro did not pay attention to the fact that members of the ECB almost unanimously recognized the need to prepare for easing monetary policy in the region. It seems that Forex is entering a new phase of currency wars. Traders perceive that the US central bank's reduction in rates is a preventive measure modeled on 1995 and 1998, when the regulator acted on the lead and saved the country from recession. The central bank also weakened the policy in 2001 and 2007, when the negative had already begun to show its first sprouts, but in fact everything turned into a recession. The desire to prevent a possible recession is commendable, but not only Fed officials are thinking about it. The European regulator is also ready to cut rates and revive the quantitative easing program. It is worth saying that, perhaps, there are more reasons for the ECB than the Fed. Take, for example, the worsening estimates of GDP and inflation for 2020 and statements by German politicians that the EU needs to seriously tune in to a trade war with the US. The euro and the dollar are weak and their condition is supported by central banks. Thus, the EUR/USD pair will continue to stay within the consolidation range of 1.12-1.14 indicated at the beginning of July. The material has been provided by InstaForex Company - www.instaforex.com |
| The pound could rise to $1.30, but you shouldn't buy it yet - RBC Posted: 11 Jul 2019 04:26 PM PDT The British currency strengthened against the US dollar for the second consecutive day. The GBP/USD pair rebounded from multi-month lows, breaking the psychological mark of 1.25 amid statements by the head of the Federal Reserve (FED) Jerome Powell, perceived by the market as a signal of the regulator's readiness to relax monetary policy. However, the joy of "bulls" on the pound may be short-lived, since the achievements of the sterling are mainly due to the weakness of the greenback. "Despite the local improvement of the technical picture, which implies some potential for the recovery of GBP/USD, you should not count on the stability of the upward movement," strategists at Royal Bank of Canada (RBC) said. They revised their forecast for the Bank of England rate and no longer expect it to increase in the first quarter of 2020. The RBC expects that in light of the weak growth of the country's economy and the continued risks of a hard Brexit, the central bank is likely to cut its rate by 25 basis points this November. "The coming months will be a period of heightened volatility for the pound, given the possibility of holding early Parliamentary elections in the United Kingdom and a new chapter in the divorce process of Great Britain and the EU, which should be completed before October 31," analysts said. "It is possible that by the end of the year GBP/USD will return to the level of 1.30 amid easing of the Fed's monetary rate and reducing uncertainty in the UK, but the potential risk/reward ratio does not give reason to talk about the attractiveness of long positions in the pound," they added. The material has been provided by InstaForex Company - www.instaforex.com |
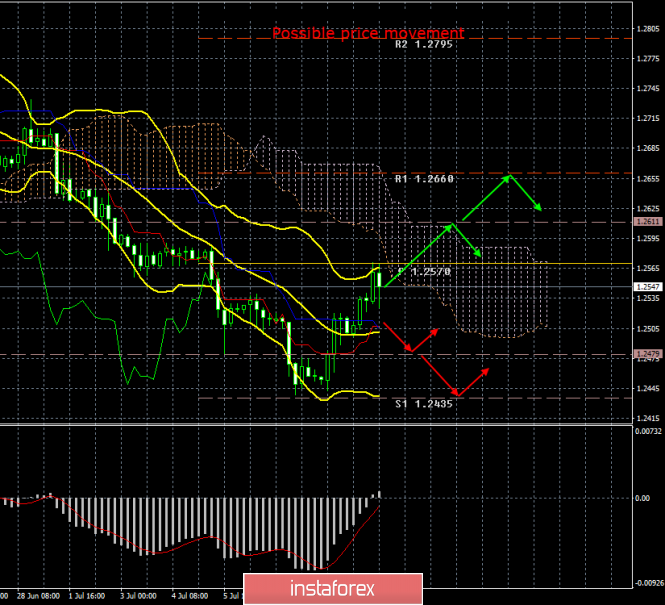
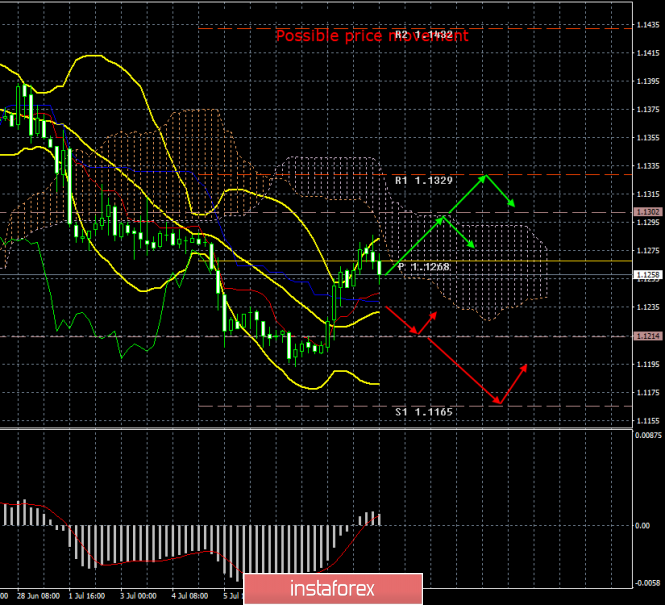
| Posted: 11 Jul 2019 04:01 PM PDT 4-hour timeframe The amplitude of the last 5 days (high-low): 25p - 107p - 40p - 81p - 77p. Average amplitude for the last 5 days: 66p (59p). The British pound sterling also continued its upward movement in the morning, but collapsed in the second. The pound's fall was due to the fact that Jerome Powell will not surprise the markets at his second consecutive speech in Congress. Everything that the Fed chairman could say was already mentioned yesterday. But in the UK there was a report on the financial stability of the central bank that was published today. It should be noted that his tonality left much to be desired, although he didn't particularly surprise market participants. Mark Carney, the head of the Bank of England, still fears a prolonged Brexit, which has a negative impact on the economy, fears of a deal with the European Union, a decline in foreign investment and a further fall in the national currency. However, it assures that the UK banking sector is ready for possible shocks, and the central bank is not going to switch to ultra-soft monetary policy in the near future. Well, now we can only wait for information from Jerome Powell's speech and we can form a picture of the state of affairs for the pound/dollar pair in the light of the new possible changes in the Fed's monetary policy. The Bank of England is not going to cut rates, but the pound is unlikely to provide support, as Brexit continues to put pressure on all sectors of the UK economy. Accordingly, despite the possible weakening of the US monetary policy, the pound may well resume a downward trend in the near future. We recommend, however, to wait for technical confirmation of the resumption of the downward movement and only after that to resume trading on the decline. Trading recommendations: The pound/dollar currency pair continues its upward correction. Thus, traders are advised to wait for its completion (consolidation below the Kijun-sen line) and re-sell the pound sterling with targets of 1.2479 and 1.2435. You can buy the British currency theoretically now with the first target of 1.2611. But the pound has already collapsed in the US trading session, which means that purchases are associated with increased risks. In addition to the technical picture should also take into account the fundamental data and the time of their release. Explanation of the illustration: Ichimoku indicator: Tenkan-sen - the red line. Kijun-sen - the blue line. Senkou Span A - light brown dotted line. Senkou Span B - light purple dotted line. Chikou Span - green line. Bollinger Bands indicator: 3 yellow lines. MACD Indicator: Red line and histogram with white bars in the indicator window. The material has been provided by InstaForex Company - www.instaforex.com |
| EUR/USD: US inflation drowned out the upward impulse Posted: 11 Jul 2019 04:01 PM PDT Data on the growth of US inflation was very controversial. The general consumer price index showed mixed dynamics: on a monthly basis, it remained at the level of May (that is, at the level of 0.1%) with the forecast of decline to zero. In annual terms, the index came out in accordance with the forecast, being at the level of 1.6% (previous value - 1.8%). But core inflation has pleased investors with minimal growth. On a monthly and annual basis, CPI turned out to be better than forecast, coming out in the "green zone" (0.3 m/m and 2.1% y/y) After the release of this report, the market hesitated for a while - on the one hand, the inflation rate was pleasantly surprising (especially the base one), on the other hand, the growth of the main indicators was minimal. But an hour later, the market decided that "the glass was half full" than vice versa, and so the US currency gradually began to restore its position. The dollar index moved away from lows of the day (and week), rising from 96.417 to the current value of 96.620. Although the growth of the greenback is not of a large scale, this situation indicates that the upward impulse of the EUR/USD pair is too unsteady and uncertain, and the dollar, in turn, retains the potential for further growth. After Powell's pessimistic comments and the release of the dovish Fed minutes, such dynamics from the greenback looks abnormal. But if we consider this situation in terms of market expectations, many things fall into place. By and large, the Fed follows the expectations of the market, and to be more precise, it prepared the traders fairly smoothly and well in advance for their further steps. Representatives of the dovish wing of the Fed (James Bullard, Rafael Bostic, Lael Brainard) first spoke about the need to mitigate monetary policy. Then the likelihood of such a scenario did not exclude Jerome Powell, however, as a necessary (extreme) measure. Over the coming weeks, the Fed chief strengthened the dovish tone, allowing for a rate cut this year. In the end, at its June meeting, the Fed excluded from the text of the accompanying statement the phrase "showing patience" regarding the prospects for monetary policy, thus opening the door to the first rate cut. Thus, the probability of monetary policy easing gradually grew and reached almost 100% at the end of last month. Moreover, the market began to exaggerate information that the Fed would reduce the rate immediately by 50 basis points or start a rate reduction cycle (one decrease in July, one more in the fall). Against the background of such conversations, the dollar has noticeably weakened - in particular, the EUR/USD pair even tested the 14th figure for the first time since March of this year. But strong Nonfarm weakened the fears of traders about an aggressive rate cut. At the same time, the likelihood of a July decline was still preserved. That is why the dollar relatively calmly survived Jerome Powell's unambiguously dovish report to Congress. Despite the clear hints of the Fed, the dollar just moved away from annual lows against the euro, but buyers could not even enter the area of the 13th figure. The thing is that the market was ready for the July rate cut - the only question was how aggressive the Fed's actions would be after this "preventive" step. In turn, today's data on inflation has suggested that the Fed will take a wait-and-see position following the decline in July. In other words, the Fed has been preparing the markets for monetary policy easing for quite a long time. Therefore, the Fed chief's semi-annual report did not provoke a large-scale weakening of the dollar. If we talk about the EUR/USD pair, in this case, Powell only interrupted the downward trend and allowed the pair's bulls to go for a correction, the "ceiling" of which is 1,1300. This ceiling is not only due to the growth of core inflation in the United States. The single currency is also under pressure from the fundamental background, primarily from the ECB. So, the minutes of the last meeting of the European regulator was released today, which demonstrated the dovish intentions of the ECB. In the opinion of the members of the Governing Council, the regulator needs to prepare for easing monetary policy in view of the reduction in inflation expectations. Almost all representatives of the ECB agreed that the central bank needed to change its position, demonstrating readiness for "retaliation". Arsenal of possible measures includes both the resumption of QE and lower interest rates. It is not known what algorithm of actions the regulator will choose for itself, but at the same time it is obvious that the ECB will take the path of easing monetary policy - just like the Fed. This fact limits the potential correctional growth of the EUR/USD pair. The first resistance level is the mark of 1,1285 (the middle line of the Bollinger Bands indicator on the daily chart, which coincides with the Tenkan-sen line). Today, the pair has reached this level, but was unable to break through it, and after the publication of the US CPI, it retreated to the level of today's opening. Just above - at around 1.1300 - is the next resistance level, which corresponds to the Kijun-sen line. But if the demand for the dollar will increase (especially if tomorrow's producer price index will be released in the "green zone"), then the pair will most likely return to the base of the 12th figure, namely, to the support of 1.1205, which corresponds to the lower Kumo cloud on D1. The material has been provided by InstaForex Company - www.instaforex.com |
| Posted: 11 Jul 2019 03:50 PM PDT 4-hour timeframe The amplitude of the last 5 days (high-low): 22p - 81p - 28p - 26p - 62p. Average amplitude for the last 5 days: 44p (40p). The euro continued to strengthen in the first half of July 11, but with the advent of the US trading session, the initiative intercepted the US dollar. The first main event of the day - the publication of a report on inflation in the United States, which did not cause any surprise among traders since the real value of the indicator was 1.6% y/y, which is fully consistent with the forecast. Indeed, inflation has slowed, but the foreign exchange market was ready for this. This was said during yesterday's speech by Jerome Powell. Today, he has already started his second speech in Congress, this time in front of the banking committee. It is unlikely that his rhetoric will differ from yesterday's and he will provide some fundamentally new information. In fact, yesterday's speech was not even surprising for market participants. Everyone has long known about low inflation. Everyone knows about the dangers for the US economy from Trump's trade wars. Everyone knows about the possible slowdown of the world economy. In light of this, we do not expect a new strengthening of the European currency today. Even in the coming days, it's prospects look very ambiguous. On the one hand, on the technical side, the correction may continue, as the traders managed to overcome the critical line. At least, now we are not talking about the resumption of a downward trend. On the other hand, the markets lose sight of the moment that the Fed has not yet lowered rates, and the ECB can lower it with the same probability as the Fed, thus preserving a certain balance, which will not allow the euro to strengthen significantly. In general, we believe that it is still too early for the euro to celebrate the victory and the completion of the dollar trend. Trading recommendations: The EUR/USD pair continues to be adjusted and has overcome the Kijun-sen line. Thus, it is now recommended to trade with targets of 1.1302 and 1.1329 in small lots and after the MACD indicator turns up. It is recommended to sell the euro/dollar again not earlier than when the price consolidates below the Kijun-sen line with targets at 1.1214 and 1.1165. In this case, the initiative will return to the hands of bears. In addition to the technical picture should also take into account the fundamental data and the time of their release. Explanation of the illustration: Ichimoku indicator: Tenkan-sen - the red line. Kijun-sen - the blue line. Senkou Span A - light brown dotted line. Senkou Span B - light purple dotted line. Chikou Span - green line. Bollinger Bands indicator: 3 yellow lines. MACD Indicator: Red line and histogram with white bars in the indicator window. The material has been provided by InstaForex Company - www.instaforex.com |
| Posted: 11 Jul 2019 03:41 PM PDT In light of Fed Chairman Jerome Powell's statements from yesterday, euro buyers ignored the readiness of the European Central Bank to return the bond redemption program, which was only recently completed. Certainly, this is not worth doing, because in the medium term, the launch of such incentive measures will negatively affect the strength of risky assets. The data, which came out today in the first half of the day on inflation in Germany, did not greatly delight investors, indicating restrained pressure. This suggests that the European regulator is still far from reaching the target level of inflation in the region of 2.0%, which makes it possible to actively engage various economic-stimulating programs. According to the report, the final CPI of Germany in June of this year increased by 0.3% compared to May, while compared to the same period in 2018, the index increased by only 1.6%, not reaching the target value. Economists had expected inflation in June to show growth of 0.3% and 1.6%, respectively. As for the harmonized according to EU standards, Germany's CPI rose by 0.3% in June, while compared to June 2018, it showed an increase of only 1.5%. Economists predicted that the final harmonized CPI of Germany would show an increase of only 0.1% and 1.3%, respectively. The publication of the minutes of the European Central Bank since the last meeting of monetary policy only confirmed the problems with inflation. Thus, at the June meeting, the ECB leaders warned that inflation expectations fell to 2016 lows and signaled their willingness to act to ensure that the target level was reached. We are talking about the possibility of resuming purchases of bonds and lower interest rates. As for the technical picture of the EURUSD pair, it remained unchanged compared with the morning forecast. The breakthrough of the major resistance at 1.1280 will provide a new influx of buyers and maintain the upward correctional potential in the trading instrument. The immediate goal will be the levels 1.1310 and 1.1340. With a scenario of good inflation in the US and a reduction in risky assets, support will be provided by the low around 1.1240 and 1.1200. The British pound continued to grow even after the Bank of England said that the markets now see a higher likelihood of Brexit without an agreement, while global risks to financial stability have increased. The English regulator is concerned about the fact that growing tensions in international trade may adversely affect economic growth, however, according to the Bank of England, the British banking system is stable in the face of disorderly Brexit and trade war. The material has been provided by InstaForex Company - www.instaforex.com |
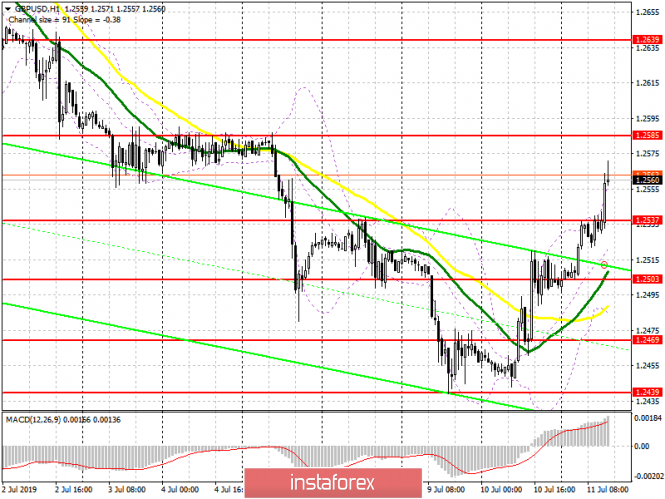
| July 11, 2019 : GBP/USD Intraday technical analysis and trade recommendations. Posted: 11 Jul 2019 09:12 AM PDT
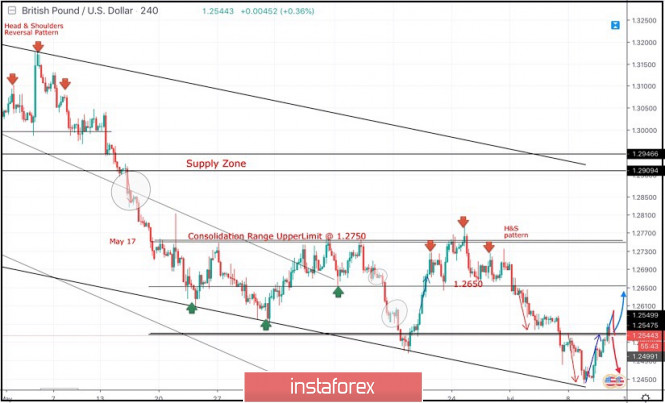
Since May 17, the previous downside movement within the depicted bearish channel came to a pause allowing the recent sideway consolidation range to be established between 1.2750 - 1.2550 with a prominent key-level around 1.2650. On June 4, temporary bullish consolidations above 1.2650 were demonstrated for a few trading sessions. However, the price level of 1.2750 (consolidation range upper limit) has prevented further bullish advancement. Moreover, early signs of bearish rejection have been manifested (Head & Shoulders reversal pattern with neckline located around 1.2650). Bearish breakdown below 1.2650 (reversal pattern neckline) confirmed the reversal pattern with bearish projection target located at 1.2550, 1.2510 and 1.2450. Short-term outlook remains under bearish pressure as long as the market keeps moving below 1.2650 (mid-range key-level and neckline of the reversal pattern). In general, the recent Bearish breakdown below 1.2570 - 1.2550 (the lower limit of the depicted consolidation range) confirms a trend reversal into bearish on the intermediate term. Immediate bearish decline was expected towards 1.2505. Further bearish decline was expected to pursue towards 1.2450 (the lower limit of the current movement channel) where early signs of bullish rejection were manifested. The current bullish pullback towards 1.2550-1.2570 should be considered as a valid SELL signal for Intraday traders. On the other hand, An Intraday bullish position can ONLY be considered if the current bullish rejection manages to bring the GBP/USD again above the price level of 1.2540. If so, Intraday bullish target would be projected towards 1.2650. Trade Recommendations: Conservative traders can have a valid SELL Entry anywhere around the lower limit of the broken consolidation range near (1.2550-1.2570). T/P levels to be located around 1.2490 and 1.2440. S/L should be placed above 1.2610. The material has been provided by InstaForex Company - www.instaforex.com |
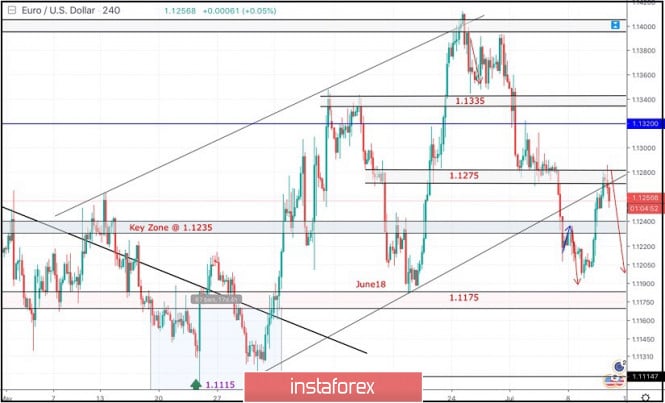
| Ichimoku cloud indicator analysis of EURUSD for July 11, 2019 Posted: 11 Jul 2019 09:07 AM PDT EURUSD has broken out of the bearish channel but price has stopped its rise right below the 4 hour Kumo (cloud) resistance. Price got rejected and has pulled back to back test the break out area of the channel at 1.1250.
EURUSD is trading above both the tenkan- and kijun-sen (yellow and red line) indicators. Price is below the Kumo (cloud) but has broken the bearish channel. Support is found at 1.1250 area where we find the broken channel and the tenkan- and kijun-sen indicators. Bulls need to bounce from current levels after forming a higher low. Bulls want to break above 1.1285 and enter the cloud area. This would increase the chances of a medium-term trend reversal to the upside and a move towards 1.14 or higher. Major resistance is at 1.1290-1.1320. Support is important at 1.1250 and next at 1.12. Breaking below 1.12 will open the way for a move towards 1.1050. The material has been provided by InstaForex Company - www.instaforex.com |
| Gold price remains inside trading range Posted: 11 Jul 2019 09:03 AM PDT Gold price has made no real progress today. Price bounced off the trading range support but bulls were not strong enough to break resistance. So far price remains inside a trading range where we prefer to sell near resistance and buy near support.
Yellow rectangle - resistance Red rectangle - support Nothing new for Gold today. Price is trading between our two important areas noted in the 4hour chart above with red and yellow color. Breaking below $1,390-85 will open the way for $1,330-$1,300. Breaking above resistance will open the way for $1,500-$1,525. Simple as that. Until then we trade the trading range with strict stops. The material has been provided by InstaForex Company - www.instaforex.com |
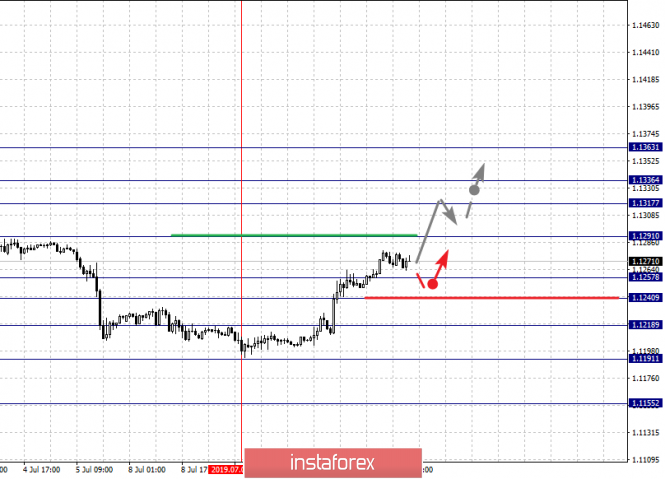
| July 11, 2019 : The market is offering a valid SELL entry for the EUR/USD pair around 1.1275. Posted: 11 Jul 2019 09:02 AM PDT
On the highlighted period between (May 17th and June 5th), temporary bearish breakdown below 1.1175 was demonstrated on the chart. This allowed further bearish decline to occur towards 1.1115 where significant bullish recovery brought the EUR/USD pair back above 1.1175 which stands as a prominent DEMAND level until now. Initially, Temporary Bullish breakout above 1.1335 was demonstrated (suggesting a high probability bullish continuation pattern). However, the EURUSD pair has failed to maintain that bullish persistence above 1.1320 and 1.1275 (the depicted price levels/zones). This was followed by a deeper bearish pullback towards 1.1175 where significant bullish price action was demonstrated on June 18. The EURUSD looked overbought around 1.1400 facing a confluence of supply levels. Thus, a bearish pullback was initiated towards 1.1275 as expected in a previous article. Further Bearish decline below 1.1275 enhanced a deeper bearish decline towards 1.1235 (the lower limit of the newly-established bullish channel) which failed to provide enough bullish support for the EUR/USD. The recent bearish breakdown below 1.1235 invited further bearish momentum to move towards 1.1175. However, significant bullish momentum was earlier demonstrated around 1.1200 bringing the EUR/USD pair again above 1.1235. That's why, the current bullish pullback was expected to pursue towards the price zone around 1.1275 where a confluence of resistance/supply levels come to meet the pair. More Bearish price action should be anticipated near the price zone of 1.1275 where a valid Intraday SELL position can be considered. Trade recommendations : For Intraday traders, a valid SELL entry can be offered at retesting of the broken key-zone around 1.1275. Initial Target levels to be located around 1.1235, 1.1200 and 1.1175. Stop Loss should be placed above 1.1300. The material has been provided by InstaForex Company - www.instaforex.com |
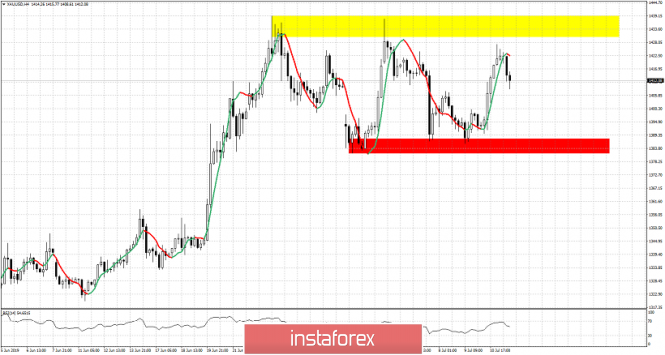
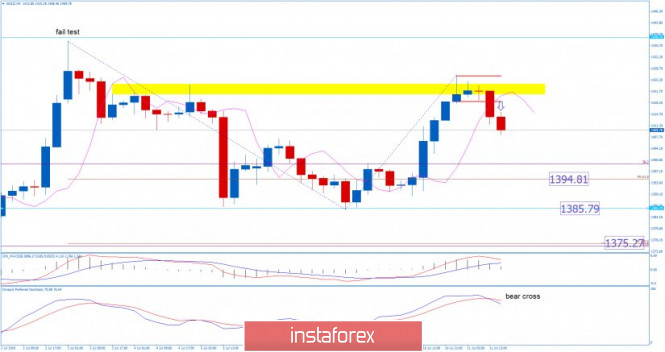
| Gold 07.11.2019 - Rejection of the important resistance at $1.425 Posted: 11 Jul 2019 07:57 AM PDT Industry news: "After a string of subdued readings, core inflation bolted back in June. Prices for goods and services rose 0.3% (0.29% before rounding), ending a four-month run of 0.1% gains. The increase reflects payback for undue softness in recent months, rather than the start of a sharp pickup in the trend." "Gains in core inflation looked more in line with recent trends." "Today's report is consistent with inflation climbing back toward the FOMC's target in the coming months. But Fed officials are increasingly concerned about the generalized weakness in inflation that has persisted this expansion. Although it is starting to get back on track, Fed officials have grown impatient over the time it is taking inflation to return to target on a sustained basis." Technical view:
Gold did find resistance at the well defined resistance cluster at the price of $1.425. I found that there is 12h balance down break and the bear cross on the Stochastic and MACD oscillators, which is sign that sellers took control from buyers. Gold did back below the 3DMA, which is another sign of the weakness. There is potential for downside on the Gold with the targets at $1.394, $1.385 and $1.375. Watch for selling opportunities. Important upward reference points: $1.425 – Resistance cluster (yellow rectangle) $1.438 – Major short-term swing high Important downward reference points: $1.394 – Fibonacci expansion 61.8% (support) $1.385 – Swing low (support) $1.375 – Fibonacci expansion 100% My advice is to watch for selling opportunities with the first downward target at the price of $1.394 The material has been provided by InstaForex Company - www.instaforex.com |
| EUR/USD for July 11,2019 - Rejection of the key resistance at 1.1280. Posted: 11 Jul 2019 07:34 AM PDT Industry news:
After climbing as high as the proximity of 1.1290, EUR/USD lost some momentum and it has now receded to the 1.1250/60 band. Technical view:
As I expected, the EUR did nice rally and did hit our first target from yesterday at the price of 1.1270. Anyway, I found nice rejection of the resistance and still the EUR is trading inside of the downward channel, which is sign of the short-term downtrend. The level of 1.1280 provided strong sell zone and I do expect potential back into the 1.1200 area. Additionally, there is the bear cross on the Stochastic oscillator, which is good clue that aggressive sellers has entered the market. Important upward reference points: 1.1280 – Previous swing low acting like resistance (orange rectangle) Important downward reference points: 1.1200 – Support cluster (green rectangle) My advice is to watch for selling opportunities with the target at 1.1200. The material has been provided by InstaForex Company - www.instaforex.com |
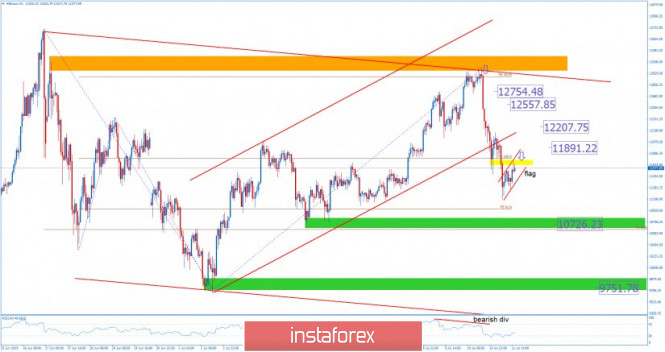
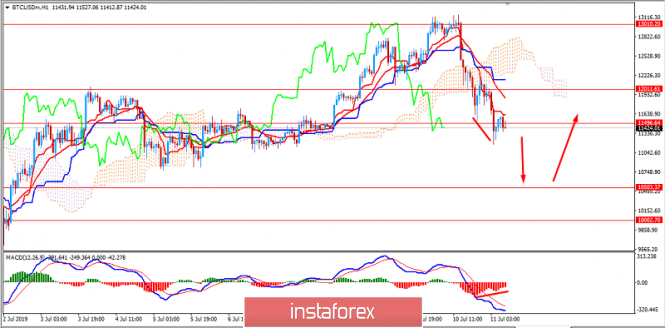
| BTC 07.11.2019 - Broken upward channel and bear flag in creation Posted: 11 Jul 2019 07:02 AM PDT Industry news: Multicoin, Coinbase Ventures, BlueYard Capital and Collaborative Fund are backing a new protocol to help developers more smoothly interact with decentralized file storage. The investment takes the form of a $1.5 million seed round in data startup Textile. Launching on the surface as a decentralized answer to Flickr, Textile has a larger mission: to help users control their own data by using the Interplanetary File System (IPFS). IPFS is an open protocol built by Protocol Labs, the same company that created the Filecoin ICO. Technical view:
As I expected, the strong resistance at $13.000 held very successfully and we got strong drop after the test. All four downward targets from yesterday got hit. Anyway, there is still more downside yet to come since there was a breakout of the upward channel (red up-sloping lines), which is good confirmation that downside pressure is strong. Most recently I found bear flag in creation on the 1H time-frame, which is good confirmation for further downside after the break of the channel. Downward targets are set at the price of $10.726 and at $9.751. As long as the BTC is trading below $13.000, I would watch for selling opportunities. Important upward reference points: $11.700 – Previous swing low acting like resistance (yellow rectangle) $12.100 – Previous hourly swing high Important downward reference points: $10.726 – FE 61.8% (green rectangle) $9.751 – Important swing low The material has been provided by InstaForex Company - www.instaforex.com |
| Technical analysis of GBP/USD for July 11, 2019 Posted: 11 Jul 2019 05:57 AM PDT The GBP/USD pair continues to move downwards from the level of 1.2580. This week, the pair dropped from the level of 1.2580 to the bottom around 1.2454. But the pair rebounded from the bottom of 1.2454 then closed at 1.2560. Today, the first support level is seen at 1.2454, the price is moving in a bearish channel now. Furthermore, the price has been set below the strong resistance at the level of 1.2529, which coincides with the 23.6% Fibonacci retracement level. This resistance has been rejected several times confirming the veracity of a downtrend. Additionally, the RSI starts signaling a downward trend. As a result, if the NZD/USD pair is able to break out the first support at 1.2454, the market will decline further to 1.2375 in order to test the weekly support 2. Consequently, the market is likely to show signs of a bearish trend. So, it will be good to sell below the level of 1.2454 with the first target at 1.2375 and further to 1.2315. However, stop loss is to be placed above the level of 1.2580. The material has been provided by InstaForex Company - www.instaforex.com |
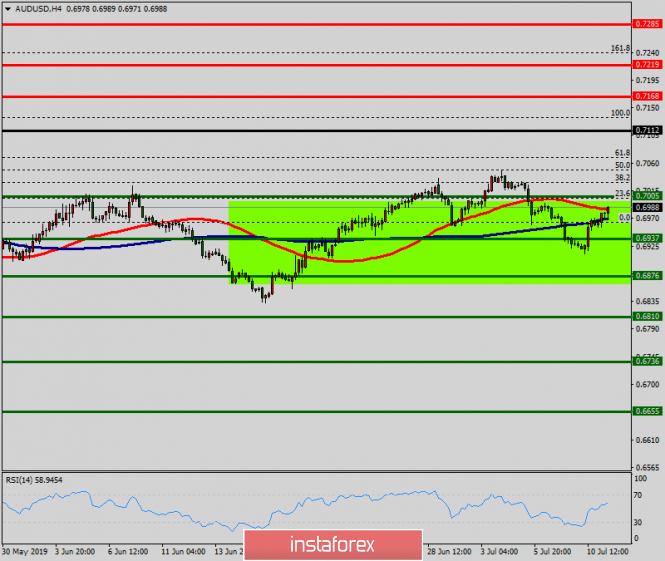
| Technical analysis of AUD/USD for July 11, 2019 Posted: 11 Jul 2019 05:47 AM PDT The AUD/USD pair is set above strong support at the levels of 0.6876 and 0.6810. This support has been rejected four times confirming the uptrend. The major support is seen at the level of 0.6810, because the trend is still showing strength above it. Accordingly, the pair is still in the uptrend in the area of 0.6810 and 0.6876. The AUD/USD pair is trading in the bullish trend from the last support line of 0.6876 towards thae first resistance level of 0.6937 in order to test it. This is confirmed by the RSI indicator signaling that we are still in the bullish trending market. Now, the pair is likely to begin an ascending movement to the point of 0.6937 and further to the level of 0.7005. The level of 0.7005 will act as the major resistance and the double top is already set at the point of 0.7005. At the same time, if there is a breakout at the support level 0.6810, this scenario may be invalidated. The material has been provided by InstaForex Company - www.instaforex.com |
| Fractal analysis of major currency pairs on July 11 Posted: 11 Jul 2019 05:16 AM PDT Hello, dear colleagues. For the Euro/Dollar pair, the price forms the initial conditions for the top of July 9 and the development of this structure is expected after the breakdown of 1.1291. For the Pound/Dollar pair, we follow the upward structure from July 10 and the level of 1.2514 is the key support. For the Dollar/Franc pair, we follow the development of the downward structure from July 9 and we expect the continuation of the downward movement after the breakdown of 0.9841. For the Dollar/Yen pair, the price forms a pronounced potential for a downward movement from July 10. For the Euro/Yen pair, the price went into a state of equilibrium in connection with the formation of the medium-term falling structure from July 1. For the Pound/Yen pair, the price is in correction and the level of 136.31 is the key support, the downward movement is expected after the breakdown of 134.99. Forecast for July 11: Analytical review of the currency pairs in H1 scale:
For the Euro/Dollar pair, the key levels on the H1 scale are: 1.1363, 1.1336, 1.1317, 1.1291, 1.1257, 1.1240, 1.1218, 1.1191 and 1.1155. The price forms an upward structure from July 9. We expect the upward movement to continue after the breakdown of 1.1291. In this case, the target is 1.1317 and in the area of 1.1317 – 1.1336 is the short-term upward movement, as well as consolidation. The potential value for the top is considered the level of 1.1363, upon reaching which we expect a rollback downwards. The short-term downward movement is possible in the area of 1.1257 – 1.1240 and the breakdown of the last value will lead to an in-depth correction. The goal is 1.1218 and this level is the key support for the downward structure. Its breakdown will allow counting on the movement to the level of 1.1191. The main trend is the formation of the upward structure of July 9. Trading recommendations: Buy 1.1291 Take profit: 1.1317 Buy 1.1336 Take profit: 1.1360 Sell: 1.1256 Take profit: 1.1241 Sell: 1.1238 Take profit: 1.1218
For the Pound/Dollar pair, the key levels on the H1 scale are: 1.2652, 1.2633, 1.2603, 1.2580, 1.2539, 1.2514, 1.2480 and 1.2438. We follow the development of the upward structure of July 10. The short-term upward movement is possible in the area of 1.2580 – 1.2603 and the breakdown of the last value should be accompanied by a pronounced upward movement. The goal is 1.2633. The potential value for the top is the level of 1.2652, upon reaching which we expect consolidation, as well as a rollback to the bottom. The short-term downward movement is expected in the area of 1.2539 – 1.2514 and the breakdown of the last value will lead to a protracted correction. The goal is 1.2480 and this level is the key support for the upward structure. The main trend is the upward structure of July 10. Trading recommendations: Buy: 1.2580 Take profit: 1.2602 Buy: 1.2604 Take profit: 1.2633 Sell: 1.2539 Take profit: 1.2515 Sell: 1.2512 Take profit: 1.2482
For the Dollar/Franc pair, the key levels on the H1 scale are: 0.9952, 0.9902, 0.9881, 0.9841, 0.9820, 0.9797 and 0.9779. The price is forming a downward structure from July 9. The continuation of the downward movement is expected after the breakdown of 0.9841. In this case, the target is 0.9820 and the breakdown of which, in turn, will allow us to count on the movement to 0.9797. The potential value for the downward trend is still the level of 0.9779, upon reaching this level, we expect a rollback to the correction. The short-term upward movement is possible in the area of 0.9905 – 0.9881 and the breakdown of the last value will have to form the initial conditions for the upward cycle. The potential target is 0.9952. The main trend is the formation of the downward structure of July 9. Trading recommendations: Buy: 0.9881 Take profit: 0.9900 Buy: 0.9910 Take profit: 0.9950 Sell: 0.9840 Take profit: 0.9822 Sell: 0.9818 Take profit: 0.9797
For the Dollar/Yen pair, the key levels in the scale are: 108.99, 108.70, 108.42, 108.26, 107.78, 107.58, 107.41, 106.98 and 106.68. We follow the downward structure of July 10. We expect the continuation of the downward movement after the breakdown of 107.78. The target is 107.58, near this level is the price consolidation. The passage of the price of the range of 107.58 – 107.41 will lead to the development of a pronounced movement. In this case, the goal is 106.98. The potential value for the bottom is the level of 106.68, from which we expect a rollback up. The short-term upward movement is possible in the area of 108.26 – 108.42 and the breakdown of the last value will lead to a protracted correction. The target is 108.70 and this level is the key support for the top. The main trend is the formation of the downward structure of July 10. Trading recommendations: Buy: 108.26 Take profit: 108.40 Buy: 108.43 Take profit: 108.70 Sell: 107.78 Take profit: 107.58 Sell: 107.40 Take profit: 107.00
For the Canadian Dollar/Dollar pair, the key levels on the H1 scale are: 1.3105, 1.3079, 1.3063, 1.3039, 1.3015, 1.2995 and 1.2970. We follow the formation of the downward structure of July 9. We expect the continuation of the downward movement after the breakdown of 1.3039. In this case, the target is 1.3015 and in the area of 1.3015 – 1.2995 is the short-term downward movement, as well as consolidation. The potential value for the bottom is considered the level of 1.2970, at which the expected roll back up. The short-term upward movement is possible in the area of 1.3063 – 1.3079 and the breakdown of the last value will lead to an in-depth correction. The target is 1.3105 and this level is the key support for the downward structure of July 9. The main trend is the formation of the potential for the downward movement of July 9. Trading recommendations: Buy: 1.3063 Take profit: 1.3078 Buy: 1.3081 Take profit: 1.3105 Sell: 1.3039 Take profit: 1.3015 Sell: 1.3013 Take profit: 1.2995
For the Australian Dollar/Dollar pair, the key levels on the H1 scale are: 0.7050, 0.7028, 0.7014, 0.6991, 0.6964, 0.6950, 0.6929 and 0.6900. We follow the formation of the initial conditions for the upward cycle of July 10. We expect the upward movement to continue after the breakdown of 0.6991. In this case, the target is 0.7014 and in the area of 0.7014 – 0.7028 is the short-term upward movement, as well as consolidation. The potential value for the top is the level of 0.7050. The short-term downward movement is possible in the area of 0.6964 – 0.6950 and the breakdown of the last value will lead to an in-depth correction. The target is 0.6929 and this level is the key support for the upward structure. The main trend is the formation of the upward structure of July 10. Trading recommendations: Buy: 0.6991 Take profit: 0.7014 Buy: 0.7015 Take profit: 0.7026 Sell: 0.6964 Take profit: 0.6952 Sell: 0.6948 Take profit: 0.6930
For the Euro/Yen pair, the key levels on the H1 scale are: 122.28, 121.89, 121.67, 121.41, 121.22, 120.92 and 120.48. the price entered the equilibrium state: the medium-term downward structure of July 1. We expect the movement to continue downwards after the price passes the range of 121.41 – 121.22. In this case, the target is 120.92 and near this level is the consolidation. The potential value for the bottom is considered the level of 120.48, after reaching which we expect a rollback to the top. The consolidated movement is possible in the area of 121.89 – 122.28 and the level of 122.28 is the key support for the downward structure. Its price passage will have to form the initial conditions for the upward cycle. The main trend is the medium-term downward structure of July 1, the equilibrium state. Trading recommendations: Buy: Take profit: Buy: 121.94 Take profit: 122.28 Sell: 121.22 Take profit: 120.94 Sell: 120.90 Take profit: 120.50
For the Pound/Yen pair, the key levels on the H1 scale are: 136.31, 135.87, 135.65, 135.24, 134.99 and 134.50. We continue to monitor the downward cycle from July 1. At the moment, the price is in the correction zone. The short-term downward movement is expected in the range of 135.24 – 134.99 and the breakdown of the last value will allow us to count on the movement to the potential target – 134.50, upon reaching this level, we expect a rollback upwards. The short-term upward movement is possible in the range of 135.87 – 136.31, to the level of 136.31, we expect the formation of the potential for the upward cycle. The main trend is the downward cycle of July 1, the stage of correction. Trading recommendations: Buy: Take profit: Buy: 135.90 Take profit: 136.30 Sell: 135.24 Take profit: 135.00 Sell: 134.95 Take profit: 134.50 The material has been provided by InstaForex Company - www.instaforex.com |
| Posted: 11 Jul 2019 04:50 AM PDT To open long positions on GBP/USD, you need: The pound continued to grow in the first half of the day, even after the Bank of England's statements on the high probability of a hard Brexit. The bulls managed to break above the support of 1.2537, and as long as trading continues above this range, the demand for the pound will remain, which will lead to an update of the highs in the area of 1.2585 and 1.2639, where I recommend taking the profit. In the scenario of GBP/USD decline in the second half of the day, you can buy when forming a false breakout at the level of 1.2537 or a rebound from a larger minimum of 1.2503. To open short positions on GBP/USD, you need: The sellers' goal for the second half of the day will be a false breakout in the resistance area of 1.2585, which can be formed after the US inflation data. Only after that can we expect the pound to fall to the support area of 1.2537, and the consolidation below this level will quickly push the pair to a minimum of 1.2503, where I recommend taking the profits. In the scenario of further growth of GBP/USD, you can look at the short positions on the rebound from the maximum of 1.2639. Indicator signals: Moving Averages Trading is above 30 and 50 moving averages, indicating a possible continuation of the pound growth. Bollinger Bands In the case of the GBP/USD decline in the second half of the day, the support will be provided by the average border of the indicator around 1.2520.
Description of indicators
|
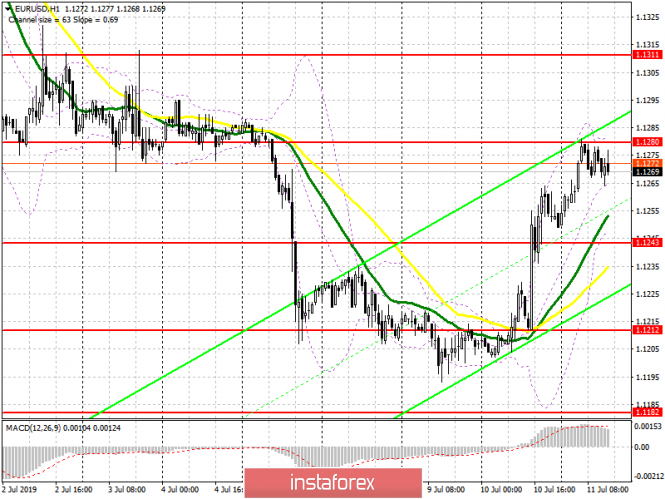
| Posted: 11 Jul 2019 04:50 AM PDT To open long positions on EURUSD, you need: The situation has not changed compared to the morning forecast, and the whole emphasis in the afternoon will be on inflation data in the US. Buyers of the euro need a breakthrough and consolidation above the resistance of 1.1280, which will continue the upward momentum and will lead to an update of the highs in the area of 1.1311 and 1.1364, where I recommend taking the profits. In the scenario of the euro decline, long positions can be looked at from the support of 1.1243 or a rebound from a large minimum of 1.1212. To open short positions on EURUSD, you need: Sellers of the euro can count on a false breakout of the resistance of 1.1280 and good data on inflation in the US, which will lead to a downward correction in the pair and the test of intermediate support of 1.1243, from which growth continued this morning. However, only a breakthrough of 1.1243 will provide the necessary pressure on EUR/USD and a return to the lows of 1.1212 and 1.1182, where I recommend taking the profit. In the trend growth scenario, the euro can be sold on a rebound from the highs of 1.1311 and 1.1338. Indicator signals: Moving Averages Trading is below 30 and 50 moving averages, indicating the continued growth of the euro in the short term. Bollinger Bands In the EUR/USD decline scenario, the support will be provided by the lower limit of the indicator around 1.1245.
Description of indicators
|
| Gold and platinum: partnership or competition? Posted: 11 Jul 2019 04:12 AM PDT
According to analysts, for a long time, gold and platinum complemented each other. There were periods when one metal became cheaper, another – more expensive, but for the market, the ratio of their prices looked harmonious. At the present time, when the gray metal in relation to the yellow began to lose ground, the balance was broken, and peaceful coexistence gave way to the competition. Over the past 40 years, platinum has been valued higher than gold, but at the moment, the situation has changed exactly the opposite. This was facilitated by the multidirectional dynamics of the world market. The first "bells" declared themselves in 1990 when after a decade of correction, the price of the yellow metal fell to $383. Platinum was more fortunate: its value reached the level of $466. In 2000, the yellow metal fell even more, to $279, and the price of the gray metal, on the contrary, increased, reaching $544, which is almost twice the price of gold. Eight years later, the cost of platinum broke all records, breaking the mark of $2,000 per ounce. The average price of the gray metal was $1,573 per ounce. Subsequently, platinum fell again, and gold in 2008 reached $1000 per 1 ounce for the first time in its history. On average, the price of precious metal was $871 per 1 ounce. According to experts, gold is usually ahead of platinum in price when investors fear political and economic instability. When the world economy is "firmly on its feet" and the level of confidence in the financial system is high enough, the gray metal takes the "reins" of yellow. That is why the ratio of gold to platinum grew during the boom in the yellow metal market in the 1970s and 2000s and declined in the bearish cycle in 1980-1990. Experts draw attention to an interesting fact: on January 23, 2013, both metals crossed in price at the same level – about $1680. However, since then, platinum began to fall in price, and now its rate is $800, and the cost of gold has increased and exceeded $1400. In the end, the yellow and gray metals are reversed from the point of view of their correlation, recorded 40 years ago. The main reason for this sharp reversal in the ratio was the so-called "deselect" that occurred with the automaker Volkswagen in 2015. Four years ago, the company had a major scandal because of falsification of data on exhaust emissions of diesel cars. The "deselect" provoked the collapse of the market of diesel vehicles and demand for platinum, analysts said. The decline in demand led to a fall in the rate of precious metals. Recall, platinum is used in catalytic converters of cars, cleaning exhaust gases from harmful impurities. According to the estimates of the World Investment Council for platinum, in the near future, we should expect an increase in investment demand for the gray metal. In the first quarter of 2019, the aggregate investment demand for precious metals amounted to 765 thousand ounces due to sales of platinum coins and bars. According to experts of the market of precious metals, this year, a significant decrease in platinum in relation to gold is not expected. Currently, the yellow metal is actively rising in price due to the growing demand for protective assets. According to analysts, gold is more of an investment asset, and platinum – industrial, which determines the growth of the ratio between these assets in favor of the yellow metal. The gray metal is in the lead largely due to the status of a rarer precious metal. Experts believe platinum is highly underestimated, but in the long term, this defect will be corrected. The material has been provided by InstaForex Company - www.instaforex.com |
| The Fed has tripped cryptocurrency Posted: 11 Jul 2019 03:26 AM PDT
On Thursday, July 11, experts recorded a significant drop in the market of digital currencies. The reason for this was the negative statements of Jerome Powell, the head of the Fed, in relation to a number of virtual assets, in particular, the Libra cryptocurrency – Facebook's "brainchild". According to the head of the regulator, the digital asset developed by the team of the popular social network is not credible and is not a reliable means of payment. Against the background of such statements, other cryptocurrencies collapsed, analysts say. Over the past day, Bitcoin has fallen by more than 11%, to $11409. The statement of the ECB representatives added fuel to the fire: the management of the largest bank did not recognize cryptocurrency No. 1 as a full-fledged means of payment. Other digital assets did not avoid a significant reduction in price: the price of Ethereum fell by almost 12% to $270.2, the value of Ripple (XRP) fell by an impressive 16% to $0.33, and the Litecoin cryptocurrency fell by 14.68% to $101.9 per day. According to leading financial strategists, the statement of the head of the Fed almost paralyzed the market, and in the near future, the fall will continue. First of all, it concerns digital currencies. In the short term, bitcoin may fall to $11,000, the price of Ethereum – to drop to $260, the cost of XRP – to drop to $0.3, and for Litecoin, they will give less than $100. The material has been provided by InstaForex Company - www.instaforex.com |
| Trading recommendations for the EURUSD currency pair - placement of trading orders (July 11) Posted: 11 Jul 2019 03:17 AM PDT For the last trading day, the euro / dollar currency pair showed a high volatility of 62 points, as a result of having a pulse jump. From the point of view of technical analysis, we see that the quote, having felt the periodic support in the area of the level 1.1180, moved to the correction stage, the support point signaled a 20-hour stagnation within the level. As written in the previous review, traders for a long time were short positions, producing partial exits while following, and just at level 1.1180 served as an excellent coordinate to completely withdraw from the transaction, in addition, it was such an important event as the rhetoric of the Fed. Considering the trading schedule in general terms, we have already said that since the beginning of the month, the euro has slipped by more than 150 points without any corrections and kickbacks, overheating of short positions on the eyes. The global downward trend was not low, and it's developing in its tact. The news background of the previous day showed a key event which all market participants were waiting for, this is the speech of Fed Chairman Jerome Powell at the hearings in the Financial Services Committee of the US House of Representatives. What did we hear? Mr. Powell announced the termination of asset repurchases will be in September of this year, noting that the uncertainty about the outcome of trade disputes and concerns about the global economy continue to put pressure on the outlook for the situation in the American economy. There was no specifics on the reduction of the key rate in the words of Jerome Powell, although according to various media sources, there is news about the reduction. The only one who announced the rate cut is the head of the Federal Reserve Bank of St. Louis, James Bullard, but it was only after the speech in the Congress of Mr. Powell. Hence the question is, where do we go from here? Recall yesterday's article , where I wrote in black and white that there could be some kind of emissions or something else that could provoke jumps. Let's talk more about this. Look at the minute schedule, Jerome Powell spoke in Congress at 14:00 UTC+00. Was there a movement? The answer is NO. The main jump occurred at 12:30 UTC+00, and it lasted for about 2 minutes. Again the question is, who leaked the information? Naturally, there is no answer, thus it remains only to contemplate the schedule. Returning to the news flow, the only thing that was published was the inventory data at wholesalers in the United States, where they received another increase of 0.4%. We do not take into account the FOMC protocol, since it was already talked about in Jerome's Powell's speech, and it was already a post-fact. Today, in terms of the economic calendar, we have the second speech by Fed Chairman Jerome Powell in the US Congress, where we will again discuss the fate of monetary policy, and perhaps there will be explanations regarding the refinancing rate. The second important event is the publication of the minutes of the ECB Board meeting, where there is a chance to see steps to mitigate monetary policy. In terms of statistics, there are data on inflation in the United States, where a slowdown is expected from 1.8% to 1.6%. Further development Analyzing the current trading schedule, we see a steady corrective move, where the quotation has already reached 1.1280, which, in principle, is very good. It is likely to assume that traders are already producing partial closures of their long positions, which kept the value of 1.1240 from the point of stagnation and breakdown. Whether there will be further movement, anything can happen, but you need to tighten restrictive orders in case something goes wrong. Based on the available information, it is possible to decompose a number of variations, let's consider them: - Positions to buy, as written in the previous review, traders lead from a value of 1.1240. If a trade is held, we move the stop to breakeven, with a primary perspective of 1.1300. - Traders quickly fixed their positions for sale on July 9-10, now we are waiting for a more optimal entry. Indicator Analysis Analyzing a different sector of timeframes (TF), we see that the indicators in the short term variably changed to the downside due to stagnation-rollback. Intraday perspective changed interest from descending to ascending due to the last jump. Medium term stably holds downward interest. Weekly volatility / Measurement of volatility: Month; Quarter; Year Measurement of volatility reflects the average daily fluctuation, based on monthly / quarterly / year. (July 11 was based on the time of publication of the article) The current time volatility is 31 points. It is likely to assume that volatility may increase due to the general information and news background. Key levels Zones of resistance: 1.1300 **; 1.1450; 1.1550; 1.1650 *; 1.1720 **; 1.1850 **; 1.2100 Support areas: 1.1180 *; 1.1112; 1.1080 *; 1.1000 ***; 1,0850 ** * Periodic level ** Range Level *** Psychological level **** The article is based on the principle of conducting a transaction, with daily adjustment. The material has been provided by InstaForex Company - www.instaforex.com |
| Posted: 11 Jul 2019 03:07 AM PDT
The US currency stood a step away from updating three-week highs, but fell on a broad front against the background of statements by the head of the US Federal Reserve System (FRS) Jerome Powell, who strengthened market participants regarding the opinion that the US Central Bank will reduce the interest rate for the first time in 11 years. Yesterday, the Fed Chairman presented a semi-annual monetary policy report to the Financial Services Committee of the US House of Representatives. "The development of some major foreign economies seems to have slowed, and this weakness could have an impact on the US economy. In addition, a number of issues still require resolution, including the situation in international trade, with a US government debt ceiling and Brexit. There is also a risk that weak inflation in the United States will turn out to be even more stable than we now expect, "said J. Powell. He also noted that a strong report on the US labor market for June did not change the Fed's plans. The Central Bank is still ready to take the necessary measures to support economic growth in the country. The market took the words of the Fed chairman as a very transparent hint that the regulator will reduce the interest rate in the near future. The minutes of the June meeting of the FOMC, published the day before, became an additional reason for expectations about the rate cut at the end of July. The discussion of Fed members at the June meeting on the prospects for monetary policy showed a clear bias towards the need to cut rates in the near future. Committee members argued in favor of such a decision a wide range of arguments - from trade relations to inflation and the labor market. The risk assessment of the Fed's own forecasts, also known as "points," showed an increase in the number of Fed representatives, which suggest a reduction in GDP growth rates and a decrease in inflation, as well as an increase in unemployment in the country. Many FOMC members considered monetary policy easing necessary in the short term while maintaining downside risks for the US economy. "The cut in July is now beyond any doubt," says James McCann of Aberdeen Standard Investments. The main thing that traders and strategists are now interested in is the scale of the rate reduction. Speaking yesterday in Congress, J. Powell did not give a direct answer to the question of whether it would be possible to reduce the rate in the United States by 0.5% at once at the July meeting. "At our meeting, which will take place in three weeks, we will evaluate a wide range of data," he said. "If the economy really slows down and you face shocks that can knock you down, a drop of a quarter percentage point will not suffice. Apparently, the Fed is switching from statistical data dependence to risk management, "says Seth Carpenter, chief economist at UBS Securities Inc. "How aggressively will the Fed behave? I think that they will go down by one baseline by 25 basis points in July, and then they will move at the speed of the glacier, "said Chad Morganlander of Washington Crossing Advisors. "The market expects that this month the rate will be reduced, because the Fed, in fact, said so. However, in order to think that a large series of declines will occur after this, you need to believe in a serious economic downturn in the United States, and there is no clarity on this, especially after strong June data on the American labor market, "said Societe Generale strategist Keith Jukes. According to Erin Brown of Pacific Investment Management Co., the fate of the dollar will depend on whether the expected Fed rate cut this month will be a one-time step or the beginning of a cycle. "It is really important whether this will be a drop in insurance rate or a consistent downward move. If the latter proves to be protracted, I think that the slope of the yield curve of treasuries will increase quite significantly from current levels and the greenback may really start to sag, "she said. "The speech of J. Powell opened the door for further dollar decline, given that the Fed chairman did not dispel expectations regarding the easing of the monetary rate," says BNP Paribas. Meanwhile, State Street Bank & Trust believes that the dollar can go up even after the Fed, having justified market expectations, will lower the rate at the end of July, since investors can take profit taking on short positions in US currency. "We share the opinion that with almost a 100 percent probability on July 31 following the FOMC meeting, the federal funds rate will be reduced by 0.25%. However, after this, the Fed will prefer to postpone, study statistics, inflationary trends, the state of the real estate market, and assess the impact of a trade war. And only after will make any decisions. Thus, after July, the American Central Bank is likely to take a neutral position, "the experts noted. "Even if the Fed becomes less optimistic about the economic outlook, the demand for the dollar will grow as an asset in a safe haven," they added. The material has been provided by InstaForex Company - www.instaforex.com |
| BITCOIN below $11,500 indicates another bounce. July 11, 2019 Posted: 11 Jul 2019 02:54 AM PDT Bitcoin has been extremely impulsive under the bearish pressure after rejecting off $13,000 with certain corrections along the way. The price turned upside down unexpectedly which aroused indecision in the market sentiment. Recently, incredibly bullish buying pressure pushed Bitcoin up to $13,000. However, the cryptocurrency was unable to maintain the rapid and steady rally and was sent reeling down. Despite bearish forecasts, many analysts believe that the latest drop may actually prove to be positive for many altcoins in the crypto markets as it may mark a pattern of capitulation that sparks a bull run. During the recent winning streak, most altcoins experienced what can be largely considered lackluster price action as the overall crypto market has been unable to mirror the massive gains of Bitcoin over the past several weeks and months. TRADING RECOMMENDATIONS: The price is currently being held by the dynamic level of Tenkan sen while also having dynamic resistances untouched like 20 EMA and Kijun sen. After the price had broken below the support area of Kumo Cloud, it formed Bullish Continuous Divergence. However, the current bearish pressure is stronger to develop a counter-trend. As the price remains below $12,000 with a daily close, it is expected to move lower towards $10,000-50 again before any bullish intervention occurs along the way. TECHNICAL LEVELS: SUPPORT: 10,000, 10,500, 11,000 RESISTANCE: 11,500, 12,000, 12,500, 13,000 CURRENT BIAS: BEARISH
|


| You are subscribed to email updates from Forex analysis review. To stop receiving these emails, you may unsubscribe now. | Email delivery powered by Google |
| Google, 1600 Amphitheatre Parkway, Mountain View, CA 94043, United States | |
No comments:
Post a Comment