
Forex analysis review |
- Gold 07.12.2019 - Trading range condition
- July 12, 2019 : EUR/USD Intraday technical analysis and trade recommendations.
- EUR/USD for July 12,2019 - ABC down potetnial completion
- BTC 07.12.2019 - Second bear flag in creation
- July 12, 2019 : GBP/USD remains under bearish pressure around 1.2550.
- USD/JPY: decrease to 102 or increase to 112. What to expect next?
- The dollar acts ahead of the curve
- Bullish scenario for EURUSD
- Weekly analysis on Gold
- EURUSD: The sharp increase in industrial production in the eurozone did not help euro buyers
- GBP/USD: plan for the American session on July 12. The pound took a wait-and-see position
- EUR/USD: plan for the American session on July 12. Euro buyers do not risk returning to the market
- Technical analysis of NZD/USD for July 12, 2019
- Analysis of GBP/CHF for July 12, 2019: consolidation to be followed by counter trend
- Technical analysis of EUR/USD for July 12, 2019
- Wave analysis of EUR / USD and GBP / USD for July 12. Jerome Powell finally pleased Donald Trump
- Review of EUR / USD and GBP / USD pairs as of 07/07/2019: We are standing still again
- Trading recommendations for the GBPUSD currency pair - prospects for further movement
- The dollar manages to balance against the background of conflicting data from the US (There is a chance that the EUR/USD
- Trading plan for EURUSD on 07/12/2019
- Breaking forecast 07/12/2019 EURUSD and trading recommendation
- Indicator analysis. Daily review of July 12, 2019 for the GBP / USD currency pair
- EURUSD: The US budget deficit rose again to record highs. The prospect of growth in risk-weighted assets under threat
- Forecast for EUR/USD and GBP/USD on July 12. The Fed decided to prevent a reduction in rates
- Indicator analysis. Daily review of July 12, 2019 for the EUR / USD currency pair
| Gold 07.12.2019 - Trading range condition Posted: 12 Jul 2019 08:48 AM PDT The Gold has been trading trading sideways in past 24 hours at the price of $1.408. Anyway, there is the well defined trading range between the price of $1.411 and $1.401. The potential break of up limit or down limit will define further direction. The potential break of the resistance at $1.411 would confirm test of $1.419 and potential break of the $1.408 would confirm the potential testing of $1.399-$1.386.
. On the 41 time-frame I found that both MACD and Stochastic are neutral and going neutral, which is sign that there is no momentum on either direction. Watch for potential breakout of the trading range to confirm further direction. The material has been provided by InstaForex Company - www.instaforex.com |
| July 12, 2019 : EUR/USD Intraday technical analysis and trade recommendations. Posted: 12 Jul 2019 08:37 AM PDT
Initially, Temporary Bullish breakout above 1.1335 was demonstrated (suggesting a high probability bullish continuation pattern). However, the EURUSD pair has failed to maintain that bullish persistence above 1.1320 and 1.1275 (the depicted price levels/zones). This was followed by a deeper bearish pullback towards 1.1175 where significant bullish price action was demonstrated on June 18. The EURUSD looked overbought around 1.1400 facing a confluence of supply levels. Thus, a bearish pullback was initiated towards 1.1275 as expected in a previous article. Further Bearish decline below 1.1275 enhanced a deeper bearish decline towards 1.1235 (the lower limit of the newly-established bullish channel) which failed to provide enough bullish support for the EUR/USD. The recent bearish breakdown below 1.1235 invited further bearish momentum to move towards 1.1175. However, significant bullish momentum was earlier demonstrated around 1.1200 bringing the EUR/USD pair again above 1.1235. That's why, the recent bullish pullback was expected to pursue towards the price zone around 1.1275 where a confluence of resistance/supply levels came to meet the pair. A recent double-top Bearish pattern was demonstrated around the price zone of 1.1275 where a valid Intraday SELL position was suggested in previous articles. Bearish persistence below the pattern neckline around (1.1235) is mandatory to confirm the short-term trend reversal into bearish towards 1.1175. Otherwise, the EUR/USD pair remains trapped between the depicted price-zones (1.1235-1.1275) until breakout occurs in either directions (More probably to the downside). Trade recommendations : For Intraday traders, a valid SELL entry was suggested at retesting of the broken key-zone around 1.1275. It's already running in profits. Initial Target levels to be located around 1.1235, 1.1200 and 1.1175. Stop Loss should be placed above 1.1300. The material has been provided by InstaForex Company - www.instaforex.com |
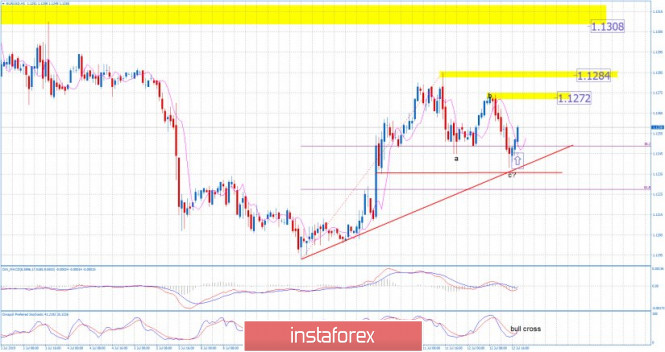
| EUR/USD for July 12,2019 - ABC down potetnial completion Posted: 12 Jul 2019 08:36 AM PDT The EURUSD has been trading trading sideways in past 24 hours. Anyway, there was the rejection of the support at the price of 1.1244. In my opinion, there is potential for the ABC down completion, which is sign that EUR may trade higher towards the resistance levels at 1.1272, 1.1284 and 1.1308. Industry news: Fed Chairman Jerome Powell testified before Congress this week, telling lawmakers that the central bank is concerned about weak inflation and other uncertainties. The Fed is expected to cut rates by 25 basis points at its next policy meeting at the end of the month. Meanwhile, core inflation data rose in June, pointing to a moderate gain in retail prices.That follows data from Thursday that showed underlying consumer prices increased in June to an almost one-and-a-half year high. Still, signs of underlying inflation picking up have failed to diminish hope that the Fed will cut rates. Technical view:
. On the H1 time-frame I found that there is bullr cross on the Stochastic and MACD, which represents short-term up momentum. The volume for today is light and there is not much going on. Anyway, rejection of the support at the price of 1.1244 is sign that buyers are still in control and that you should watch for buying opportunities with the first target at the price of 1.1272. The material has been provided by InstaForex Company - www.instaforex.com |
| BTC 07.12.2019 - Second bear flag in creation Posted: 12 Jul 2019 08:25 AM PDT Industry news: POTUS finally tweeted about Bitcoin, and it had absolutely no effect. Considering the daily Twitter-tirade that Donald Trump spews, which covers everything from an all-out war with Iran to As I expected, the level of $11.700 did provide a strong resistance for the BTC. There is still more downside yet to come since there was a breakout of the upward channel (red up-sloping lines), which is good confirmation that downside pressure is strong. Most recently I found a second bear flag in creation on the 1H time-frame, which is good confirmation for further downside after the break of the channel. The RSI oscillator is having the bear cross. Downward targets are set at the price of $10.726 and at $9.751. As long as the BTC is trading below $13.000, I would watch for selling opportunities. Important upward reference points: $11.700 – Previous swing low acting like resistance (yellow rectangle) $11.700 – Previous hourly swing high Important downward reference points: $10.726 – FE 61.8% (green rectangle) $9.751 – Important swing lowThe material has been provided by InstaForex Company - www.instaforex.com |
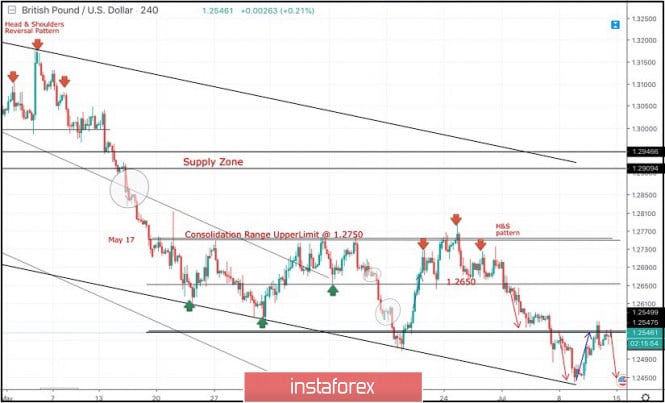
| July 12, 2019 : GBP/USD remains under bearish pressure around 1.2550. Posted: 12 Jul 2019 07:49 AM PDT
Since May 17, the previous downside movement within the depicted bearish channel came to a pause allowing the recent sideway consolidation range to be established between 1.2750 - 1.2550 with a prominent key-level around 1.2650. On June 4, temporary bullish consolidations above 1.2650 were demonstrated for a few trading sessions. However, the price level of 1.2750 (consolidation range upper limit) has prevented further bullish advancement. Moreover, early signs of bearish rejection have been manifested (Head & Shoulders reversal pattern with neckline located around 1.2650). Bearish breakdown below 1.2650 (reversal pattern neckline) confirmed the reversal pattern with bearish projection target located at 1.2550, 1.2510 and 1.2450. Short-term outlook remains under bearish pressure as long as the market keeps moving below 1.2650 (mid-range key-level and neckline of the reversal pattern). In general, the recent Bearish breakdown below 1.2570 - 1.2550 (the lower limit of the depicted consolidation range) confirms a trend reversal into bearish on the intermediate term. Immediate bearish decline was expected towards 1.2505. Further bearish decline was expected to pursue towards 1.2450 (the lower limit of the current movement channel) where early signs of bullish rejection were manifested. The current bullish pullback towards 1.2550-1.2570 should be considered as a valid SELL signal for Intraday traders. On the other hand, An Intraday bullish position can ONLY be considered if the current bullish rejection manages to bring the GBP/USD again above the price level of 1.2540. If so, Intraday bullish target would be projected towards 1.2650. Trade Recommendations: Conservative traders can have a valid SELL Entry anywhere around the lower limit of the broken consolidation range near (1.2550-1.2570). T/P levels to be located around 1.2490 and 1.2440. S/L should be placed above 1.2610. The material has been provided by InstaForex Company - www.instaforex.com |
| USD/JPY: decrease to 102 or increase to 112. What to expect next? Posted: 12 Jul 2019 07:44 AM PDT
After the January flash crash of crosses with the yen, there were enough forecasts about the fall of the USD/JPY pair to the mark of 100 and even 95. In fact, the pair managed to go to the upper limit of the range 108-112, in which it was in the last few years. The escalation of the US and China trade conflict in May and the associated hopes for easing the monetary policy of the Fed allowed the yen's exchange rate against the dollar to return to its highest levels since the beginning of the year. The positive results of the next G20 summit, at which Washington and Beijing agreed to restart trade negotiations, as well as strong data on the US labor market for June, which reduced the probability of reducing the federal funds rate by 0.5 basis points at once, made adjustments. However, the subsequent statements of the Fed leadership returned the "bears" on USD/JPY to the game. Mizuho Bank experts expect that by the end of the year, the pair will fall to 103. As the main reason, experts call the limited capacity of the Bank of Japan to weaken monetary policy. "If the Fed has room for maneuver, the Japanese Central Bank has already bought up a significant part of the local debt market and instead of the announced 80 trillion yen expands the monetary base by less than 30 trillion yen per year," they said. Experts of Morgan Stanley, in turn, draw an analogy with 2016, when inflation expectations in the Land of the rising sun fell faster than the yield of local bonds, and USD/JPY sank from 121 to 99 in a few months. According to the bank's forecast, by the end of this year, the pair will fall to 102, and by the end of the next year – to 94. It should be recognized that an integral part of the "bearish" forecasts for USD/JPY is hoping for easing the monetary rate of the Fed. A strong report on US employment for June and fears that Fed Chairman Jerome Powell in his speech to Congress may say that the time for monetary expansion has not yet come, returned the yield on ten-year treasuries above 2% and pushed the pair USD/JPY above 108. Against this background, the probability of a 50 basis point reduction in the federal funds rate in 2019 fell to 40%, although investors had little doubt about this outcome. However, bearing in mind of the past mistakes and not wanting to get on the same rake, Jerome Powell did not dispel the hopes of the market regarding the rate cut in July, once again confirmed the strength of the US economy and announced the preservation of increased international risks. This allowed the "bears" on USD/JPY to use the rebound from the level of 108.95 to form "shorts". If we assume that the trade conflict between the United States and China will be delayed (which, along with the increased risks of transferring the "fighting" to the European scene, will continue to slow down the global economy and ultimately force the Fed to weaken monetary policy), then on the medium-term horizon, short positions on USD/JPY will seem quite promising. In addition, a number of geopolitical risks remain – including Iran, Turkey, and North Korea, any of which could weaken investor sentiment. However, if there is no escape from the risk, the USD/JPY may well rise above 112 by the end of the year. The material has been provided by InstaForex Company - www.instaforex.com |
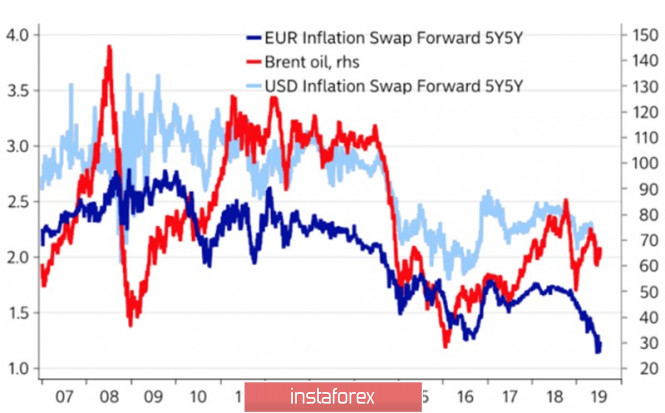
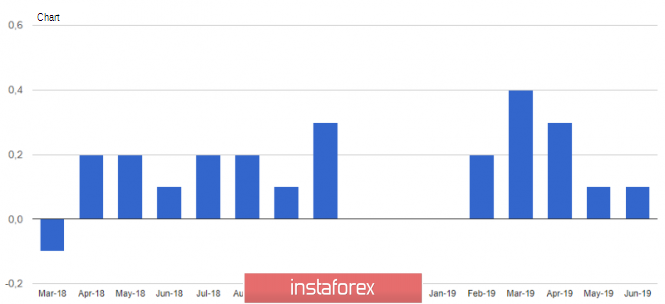
| The dollar acts ahead of the curve Posted: 12 Jul 2019 06:43 AM PDT Jerome Powell quickly stopped the intention of the "bears" on EUR/USD to bring the pair's quotes beyond the range of 1.12-1.14. In his speeches to the US Congress, the Fed Chairman made it clear that the Central Bank has grounds for reducing the federal funds rate. First, inflation leaves much to be desired. Secondly, Donald Trump's trade policy creates a headwind for the American economy. The Fed is ready to act ahead of the curve. In 1995 and 1998, its preventive monetary easing saved the States from recession. In 2001 and 2004, when the rate was lowered in response to the deterioration of macroeconomic statistics, the recession could not be avoided. If the Fed does not disdain monetary expansion when core inflation is at 2.1% and unemployment is at half-century lows, then why should the ECB restrain itself? Both central banks note the negative impact of falling inflation expectations on consumer prices, but in the eurozone, it is more pronounced than in the United States. Dynamics of oil and inflation expectations
The June Protocol of the ECB Governing Council showed that officials will discuss the issues of lowering rates and resuscitation of QE. The market is set that the European regulator will give a signal to ease monetary policy in July, and will move from words to deeds in September. If Frankfurt has more grounds for monetary expansion than Washington, why is EUR/USD growing? We have already discussed this issue. When two central banks soften their policies, the arsenal of tools they have is important. The Fed can reduce the rate by as much as 250 bp, or even more, while the rate on deposits of the ECB is already in the negative area (-0.4%). Simply put, the beginning of a cycle of monetary expansion in the United States gives speculators the opportunity to fix profits on long-term long positions on the US dollar and move to short. At the same time, if the US economy shows resistance to external factors, then reduce the federal funds rate by 50 or 75 bp won't be necessary. In this regard, the release of data on retail sales in the US in June is able to lend a helping hand to the "bears" on EUR/USD. The publication of these indicators and China's GDP for the second quarter will be the key events of the week by July 19. Investors will closely monitor the state of China's economy and the course of trade negotiations between Washington and Beijing. Pressure on the euro is created by the growing risks of a trade war between the EU and the United States, the desire of the new Greek government to revise the budget surplus established by the European Union of 3.5%, as well as the possible occupation of Boris Johnson as Prime Minister of Britain. An ardent supporter of Brexit claims that Albion will leave the EU with or without an agreement. Technically, the EUR/USD pair continues to consolidate in the range of 1.12-1.14 within the "Diamond bottom" pattern. The breakthrough of resistance at 1.132 will increase the risks of implementing targets for the models AB = CD (161.8%) and "Wolfe Waves". The material has been provided by InstaForex Company - www.instaforex.com |
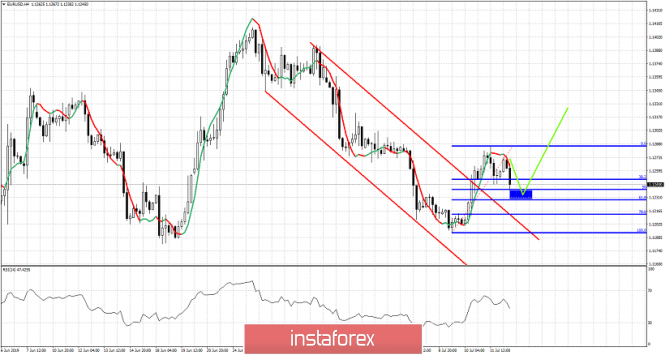
| Posted: 12 Jul 2019 06:08 AM PDT EURUSD has so far retraced 50% of the recent rise from 1.1193 to 1.1285. Short-term trend is bearish as price is making lower lows and lower highs. A reversal of trend should come once the ABC decline completes around 61.8% Fibonacci retracement and price breaks above 1.1275.
Red lines - bearish channel Blue rectangle - possible reversal area Green line - expected path EURUSD is pulling back towards the upper channel boundary and towards the 50-61.8% Fibonacci retracement levels. A reversal to the upside from these levels is highly probable. EURUSD bulls should respect the 61.8% level and break above 1,1275 resistance in order to resume their up trend. Support is at 1.1228. I expect that it is more probable to see an upward reversal. The material has been provided by InstaForex Company - www.instaforex.com |
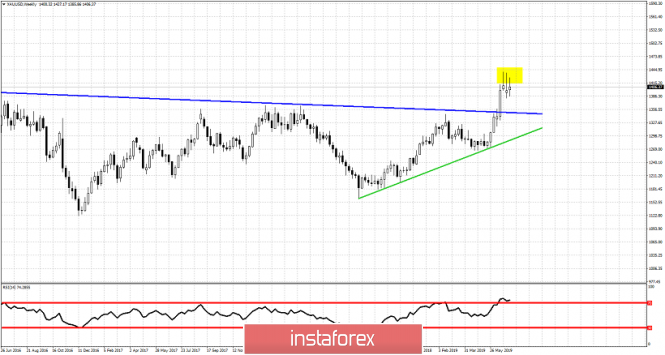
| Posted: 12 Jul 2019 06:04 AM PDT Gold price has trouble on a weekly basis to capture the $1,450-$1,440 level. This is a confirmed major resistance and puts short-term trend in danger. Prices are vulnerable to a pull back towards $1,300 as long as price gets rejected each time we challenge $1,440-50.
Blue line -long-term resistance trend line broken Green line -long-term support trend line Gold price has broken above the long-term resistance trend line and is in a medium-term bullish trend. As long as price is above the green trend line support, bulls have nothing to fear. Of course a break below the blue trend line support (previously resistance) would not be welcomed. In the last three weeks we see long upper tails in the Daily candlesticks. This is a sign that resistance is strong in this area and bulls are not strong enough. Short-term support is at $1,385-90 and if this level breaks, traders should expect a reversal towards $1,350-$1,300. The material has been provided by InstaForex Company - www.instaforex.com |
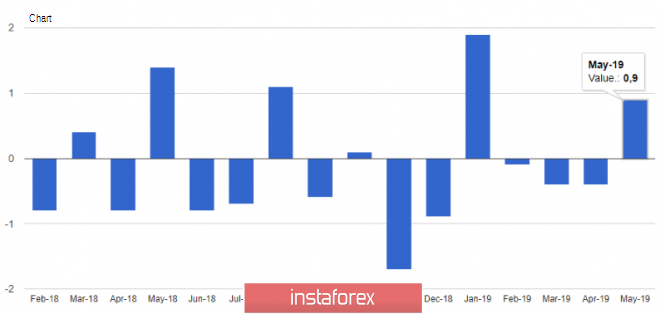
| EURUSD: The sharp increase in industrial production in the eurozone did not help euro buyers Posted: 12 Jul 2019 05:56 AM PDT The European currency ignored the good data on industrial production in the eurozone, which in May of this year increased sharply. The weak demand for the euro is directly linked to the recent report of the European Central Bank, which is seriously considering the introduction of new monetary stimulus measures, including lowering interest rates. The powers of the current ECB President Mario Draghi will end in a few months, and most likely, he will try to do everything to leave his post on a major note, having established itself as a manager who pulled the European economy from the crisis pit. Let me remind you that Christine Lagarde, who is currently the managing director of the International Monetary Fund, has been appointed as his successor. Her position also indicates a desire to continue a soft policy. Even despite the weakness of the US dollar, in the medium term, such news will not have a good impact on the exchange rate of the European currency, which will weaken the position of risky assets even more. As for the data from the statistical agency Eurostat, industrial production in the eurozone in May this year increased by 0.9% compared to April, indicating a larger GDP growth in the 2nd quarter of this year. However, compared to the same period of the previous year, production decreased by 0.5%. The growth was due to high demand and production of consumer goods. The strongest increase in production by 2.1% was recorded in France. It is worth noting that the manufacturing sector of the eurozone suffered greatly at the beginning of this year due to a sharp decline in exports against the background of trade wars, which slow down the overall growth of the world economy. The European Central Bank has repeatedly noted the weakness of the manufacturing sector, which exerts significant pressure on the rest of the economy, and this is another argument in favor of the introduction of incentive programs. Today, a report from WSJ economists was published, which stated that criticism of the Fed's policy by Trump did not cause serious damage to the idea of the independence of the Central Bank. At this point, the current Chairman of the Fed, Jerome Powell, has repeatedly drawn attention. Also, more than 68% of the economists surveyed predict a decline in Fed rates at the July meeting, which, apparently, has already been taken into account by the market, and most likely, it will not have a serious impact on the quotes of the US dollar. By the end of this year, the committee is expected to lower the key interest rate for the second time to 2.00%. As for the recession, its onset is estimated at 30.1% over the next 12 months. The technical picture of the EURUSD pair remained unchanged, and the whole emphasis in the afternoon will be on data on producer prices in the US. If they are better than economists' forecasts, the demand for the US dollar will increase. The support breakout of 1.1230 will lead to larger levels around 1.1200 and 1.1160. The material has been provided by InstaForex Company - www.instaforex.com |
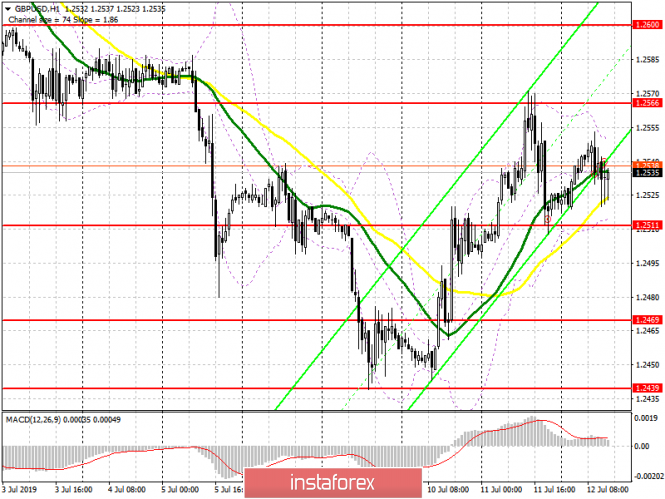
| GBP/USD: plan for the American session on July 12. The pound took a wait-and-see position Posted: 12 Jul 2019 05:56 AM PDT To open long positions on GBP/USD, you need: From a technical point of view, nothing has changed in the morning. To maintain the bullish market, buyers need a breakout and consolidation above the resistance of 1.2566, which will lead to an update of the highs in the area of 1.2600 and 1.2639, where I recommend taking the profits. In the case of a downward correction scenario in the second half of the day, long positions can be returned on a false breakdown from the support of 1.2511, as well as to a rebound from a larger minimum in the area of 1.2469. To open short positions on GBP/USD, you need: Pound sellers will expect a false breakdown in the resistance area of 1.2566, which will form a new upper limit of the downward channel. However, the main task of the bears will be to break through and consolidate the support of 1.2511, which will push GBP/USD to the area of the lows of 1.2469 and 1.2439, where I recommend taking the profits. With further growth above 1.2566, it is best to take a closer look at the short positions on the test of highs of 1.2600 and 1.2639. Indicator signals: Moving Averages Trading is conducted in the area of 30 and 50 moving averages, which indicates market uncertainty. Bollinger Bands In the case of the GBP/USD decline in the second half of the day, the support will be provided by the lower limit of the indicator around 1.2510.
Description of indicators
|
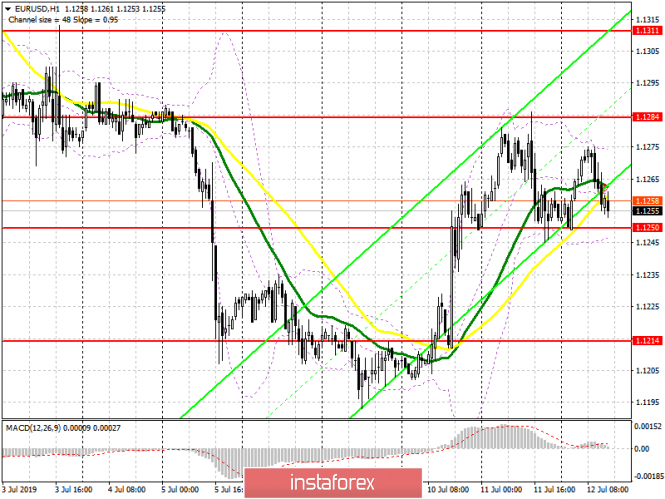
| EUR/USD: plan for the American session on July 12. Euro buyers do not risk returning to the market Posted: 12 Jul 2019 05:56 AM PDT To open long positions on EURUSD, you need: The situation has not changed compared to the morning forecast. Buyers need a breakthrough and consolidation above the resistance of 1.1284 to continue growth, and weak data on producer prices in the US will push the euro even higher in the area of 1.1311 and 1.1338, where I recommend taking the profits. In the EUR/USD decline scenario on a strong report, you can look at long positions after a false breakout in the area of yesterday's support of 1.1250, as it has already fulfilled its function once, or a rebound from a larger minimum of 1.1214. To open short positions on EURUSD, you need: Sellers of the euro can count on a false breakout of the resistance of 1.1284, which will lead to a downward correction in the pair and the test of intermediate support of 1.1250, from which growth continued this morning. However, only a breakthrough of 1.1250 with good data on the growth of producer prices in the US will provide the necessary pressure on EUR/USD and a return to the lows of 1.1214 and 1.1182, where I recommend taking the profits. In the trend growth scenario, the euro can be sold on a rebound from the highs of 1.1311 and 1.1338. Indicator signals: Moving Averages Trading is conducted in the region of 30 and 50 moving averages, which indicates market uncertainty. Bollinger Bands In the EUR/USD decline scenario, the support will be provided by the lower limit of the indicator around 1.1245.
Description of indicators
|
| Technical analysis of NZD/USD for July 12, 2019 Posted: 12 Jul 2019 03:51 AM PDT The NZD/USD pair broke the resistance that turned into strong support at the level of 0.6612. The level of 0.9966 coincides with a golden ratio (61.8% of Fibonacci), which is expected to act as a major support on the H1 chart today. Consequently, the first support is set at the level of 0.6612. Moreover, the RSI starts signaling an upward trend, and the trend is still showing strength above the moving average (100). Hence, the market is indicating a bullish opportunity above the area of 0.6612. So, the market is likely to show signs of a bullish trend around 0.6612 - 0.6650. In other words, buy orders are recommended above the ratio of 61.8% Fibonacci (0.6612) with the first target at the level of 0.6748 in order to test last bullish wave in the same time frame. If the pair succeeds to pass through the level of 0.6748, the market will probably continue towards the next objective at 0.6818 . The daily strong support is seen at 0.6612. Thus, if a breakout happens at the support level of 0.6612/0.6600, then this scenario may be invalidated. The material has been provided by InstaForex Company - www.instaforex.com |
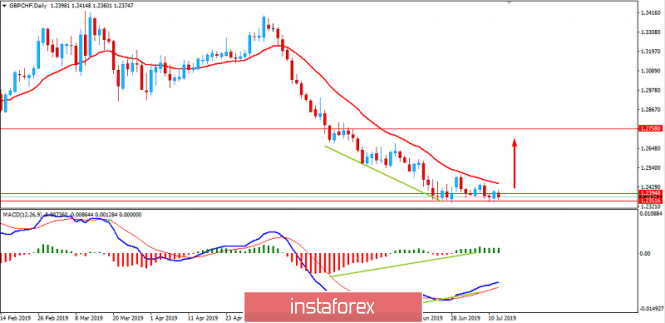
| Analysis of GBP/CHF for July 12, 2019: consolidation to be followed by counter trend Posted: 12 Jul 2019 03:16 AM PDT The volatility in the GBP/CHF pair has been low with the bearish momentum which is currently consolidating and correcting at the edge of 1.2350 support area. The British pound has gained momentum despite the comments of BOE Governor Carney who said that a no-deal BREXIT would have immediate troublesome consequences for the economy. He said it while presenting of Financial Stability Report. The BOE Governor also noted that the UK's banking system is still strong enough to continue the lend through the UK economic and financial shocks associated with Brexit. The pre-Brexit hoarding helped the UK economy to start the year on a solid footing but later the momentum was lost due to weak PMI data. The UK GDP growth on a monthly basis was seen to be lower than the previous data indicating weaker economic growth due to the global slowdown and ongoing Brexit uncertainties. This week, the monthly GDP has turned back returning from -0.4% to 0.3% intervening the decline of the growth forecast of the UK. On the other hand, the SNB has a plan of a rate cut if the FX interventions fail to dampen the upward pressure on CHF. The cut in the SNB's policy rate in September cannot be ruled out, though it is not the baseline scenario at this stage. The growth forecast for the Swiss franc has also indicated a decline due to the global growth concerns and elevated political uncertainties. The SNB inflation target is set at 0.7% on a yearly basis which is 0.1% up from the projection of last quarter. Switzerland's GDP growth has picked up in the first quarter, comparing to all large economies recording above-average expansion. The yearly retail sales have dropped from -0.8% to -1.7% missing the expectation of 0.6%. Further on, the manufacturing PMI has also dropped from 48.6 to 47.7 while the monthly CPI has declined from 0.3% to 0.0%. This week, the unemployment rate was unchanged at 2.3% down from the forecast of 2.4%. As of the current scenario, amid better economic reports and optimistic expectations, the swiss franc managed to sustain the bearish pressure against the pound sterling which is expected to continue further until the UK comes up with better solutions for economic slowdown to counter the preceding bearish trend in place. Now let us look at the technical view. The price is still quite non-volatile with the bearish trend, being held by the dynamic level of 20 EMA as resistance. The price has formed the Bullish Divergence, but it has not been established yet to work against the dominant bears in the process. As the price resides above 1.2350 with a daily close, the chances of bullish intervention will be constant.
|
| Technical analysis of EUR/USD for July 12, 2019 Posted: 12 Jul 2019 03:15 AM PDT The EUR/USD pair continues to move upwards from the level of 1.1179 (support zone). Last week, the pair rose from the level of 1.1179 to a top around 1.1222 (currently price is set at the 1.1202 price). Today, the first resistance level is seen at 1.1262 followed by 1.1295, while daily support 1 is seen at 1.1179 (23.6% Fibonacci retracement). According to the previous events, the EUR/USD pair is still moving between the levels of 1.1179 and 1.1295; so we expect a range of 116 pips. Furthermore, if the trend is able to break out through the first resistance level at 1.1222, we should see the pair climbing towards the double top (1.1295) to test it. Therefore, buy above the level of 1.1179 with the first target at 1.1262 in order to test the daily resistance 1 and further to 1.1295. Also, it might be noted that the level of 1.1295 is a good place to take profit because it will form a double top. On the other hand, in case a reversal takes place and the EUR/USD pair breaks through the support level of 1.1179, a further decline to 1.1108 can occur which would indicate a bearish market. The material has been provided by InstaForex Company - www.instaforex.com |
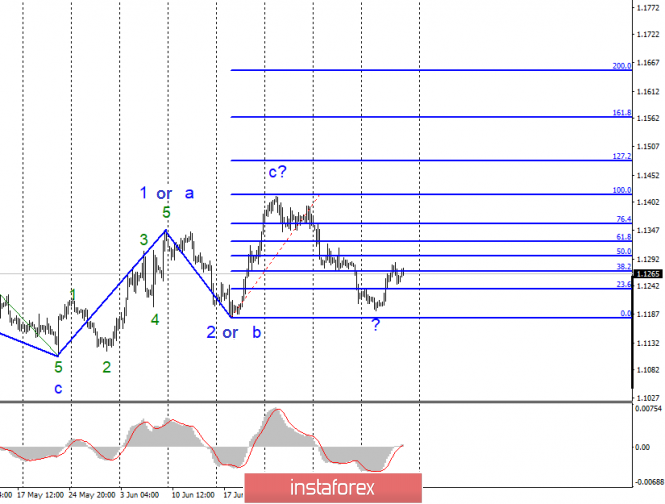
| Wave analysis of EUR / USD and GBP / USD for July 12. Jerome Powell finally pleased Donald Trump Posted: 12 Jul 2019 02:06 AM PDT EUR / USD On Thursday, July 11, trading ended with a 5 bp rise for the EUR / USD pair. Thus, the current wave pattern still has chances of resuming the construction of an upward trend, since at least for July 9, one can interpret wave 2 in the future c. If this is true, then the increase in quotations of the euro-dollar pair will continue from the current positions with targets located above the 14th figure. As for the news background, yesterday Jerome Powell confirmed the expectations of the markets and again hinted on the need to weaken the Fed's monetary policy. Thus, the probability of a reduction in the Fed's rate from the current 2.5% to 2.25% at the meeting in late July is now over 90%. By the end of June, inflation in the USA slowed down to 1.6% y / y from 1.8%. Thus, Powell's concerns about weak inflation are not an empty sound. Purchase goals: 1.1417 - 100.0% Fibonacci 1.1480 - 127.2% Fibonacci Sales targets: 1.1180 - 0.0% Fibonacci General conclusions and trading recommendations: A pair of euro / dollar presumably remains in the upward trend. I recommend to buy euros with targets located near the estimated marks of 1.1417 and 1.1480, which is equal to 100.0% and 127.2% of Fibonacci, and an order restricting possible losses under the minimum of wave 2 or b. Leaving the tool below the 0.0% level will require making adjustments to the current markup. GBP / USD
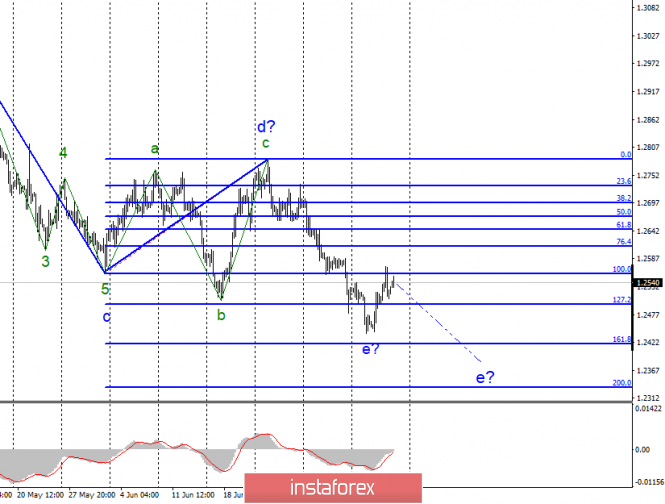
The pair GBP / USD rose on July 11 by 20 basis points and continues to move away from local minima. However, the estimated wave e still does not look fully completed, which suggests a resumption of the decline of the pound sterling in the coming days. The driver of growth and decline in the pair pound-dollar will not occur today. New speeches by Boris Johnson or Jeremy Hunt are possible, but it seems that the British political circles are now fully focused on the election of the prime minister. For the pound, this, unfortunately, does not mean anything. The currency is still not in demand among traders, although in the last two days there were grounds for purchases. Moreover, it is not clear how will the pound sterling grow within the upward trend after the completion of wave e? Or will the wave significantly complicate its internal wave structure? Sales targets: 1.2418 - 161.8% Fibonacci 1.2334 - 200.0% Fibonacci Purchase goals: 1.2783 - 0.0% Fibonacci General conclusions and trading recommendations: The wave pattern of the pound / dollar instrument involves the construction of a downward wave e. Thus, I recommend selling the pair with targets located near the estimated marks of 1.2418 and 1.2334, which corresponds to 161.8% and 200.0% in Fibonacci, when the MACD signal is down. The material has been provided by InstaForex Company - www.instaforex.com |
| Review of EUR / USD and GBP / USD pairs as of 07/07/2019: We are standing still again Posted: 12 Jul 2019 02:01 AM PDT In general, yesterday can be again described as standing still. More precisely, nothing has changed at the end of the day. Although, the dollar initially has somewhat given up its position but then, the single European currency and the pound began to retreat. At the same time, they began to decline almost immediately after the text of the minutes of the meeting of the Board of the European Central Bank was published. True, there is some delay since the text is impressive and it takes some time to read it -not to mention, comprehension. As a matter of fact, we saw nothing new in it. All of these were already voiced by Mario Draghi during a press conference following the results of the last meeting of the Board of the European Central Bank. The refinancing rate will remain unchanged, at least until the middle of next year. Also, the text of the protocol once again expresses the concern of the Board of the European Central Bank about macroeconomic dynamics, but the most important thing is that none of the board members believes in speedy recovery of inflation. This already means that the question of raising the refinancing rate will be postponed more than once. Also, the European Central Bank decided to reduce the cost of prolongation of lending to European banks, which in essence is a kind of measure to mitigate monetary policy. It is the only thing that turned out to be something new, thereafter, investors almost did not pay attention to the American statistics, which was moderately negative. As expected, inflation has slowed down from 1.8% to 1.6%, but investors are ready for this since the publication of preliminary data. However, the monthly data showed that prices rose by 0.1% and did not remain unchanged, as previously expected. Hence, the slowdown in inflation may be temporary. Therefore, we can say that it is too early to panic; just keep on being afraid. At the same time, the total number of applications for unemployment benefits increased by 14 thousand, instead of decreasing by 10 thousand. In particular, the number of initial applications for unemployment benefits actually decreased by 13 thousand, which should have increased by 1 thousand. The number of repeated requests, instead of a decrease of 11 thousand, showed an increase of 27 thousand. However, the market clung more to indirect data indicating the temporary nature of the slowdown in inflation. Today, there are not so many statistical data, although they can be very interesting. In particular, Europe is expected to deepen the decline in industrial production from -0.4% to -1.6%, which naturally does not add to investor confidence in the bright future of the European Union, as well as the single European currency. In the United States, data on producer price growth rates are published, which should slow down from 1.8% to 1.6%, as well as inflation in general. In many ways, this will somewhat force a lower level of optimism, regarding the hope that a slowdown in inflation is temporary but both of these news will level each other. The single European currency may initially decline slightly but after the publication of data on producer prices in the United States. Everything will return to where it began. So, by the end of the day, the single European currency will remain in the region of 1.1250 - 1.1275. The picture of the pound is similar, hence, it will likely hang around 1.2525. |
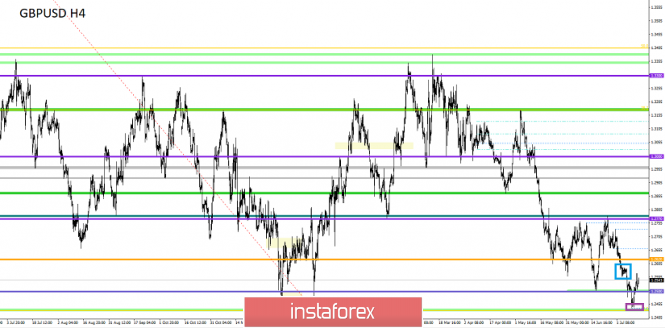
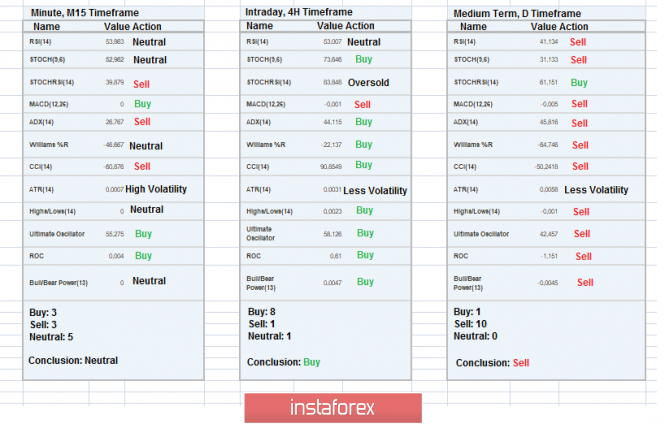
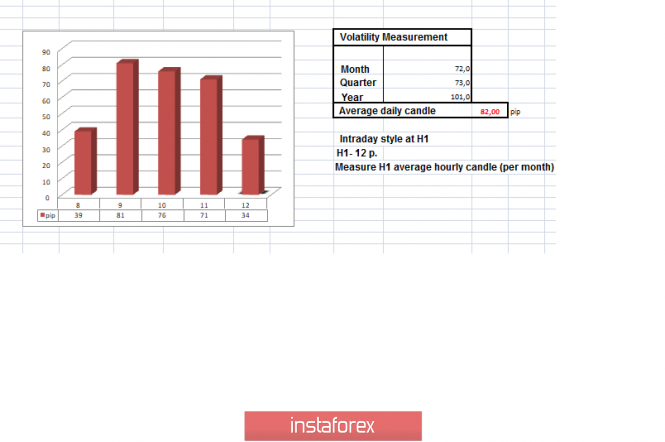
| Trading recommendations for the GBPUSD currency pair - prospects for further movement Posted: 12 Jul 2019 01:41 AM PDT Over the last trading day, the pound / dollar currency pair showed volatility, close to the average daily 71 points, as a result of having the expected pullback. From the point of view of technical analysis, we see a correctional movement from the pivot point of 1.2433, the minimum of the current year, where the quotation reached the value of 1.2569, the area of the cluster on July 3-4. After that, we see a slight overheating of long positions and, as a fact, an expected rollback to the previously passed level of 1.2500. As it was written in the previous review, after a spike in prices, traders set at partial profit taking, in case there is a rollback with the restoration of quotes. The news background of the previous day focused on the second speech by Jerome Powell in the US Congress, where the Fed chief did not say anything new, highlighting only: "The most important thing for me is the uncertainties surrounding the growth of the global economy and trade, which put pressure on the outlook." The life-giving topic of the refinancing rate was not raised during the two-day meeting, but market participants clearly heard hints of a possible reduction, and this all looks like some kind of preparation for easing monetary policy, in particular, lowering the rate. Returning to the news flow, we see that yesterday, data on inflation in the United States came out, where, as expected, they saw a slowdown from 1.8% to 1.6%. Data on the number of initial claims for unemployment benefits fell from 222K to 209K. Finally, news from England was released. According to the Bank of England, a threat to the British economy is a reduction in foreign investment in UK assets because of Brexit. Foreign investors refuse to invest in commercial real estate and corporate lending in Britain, which indicates that the country is losing its attractiveness in terms of investment against the background of the upcoming exit from the EU, as the famous publication the Wall Street Journal writes. Previously, we have repeatedly raised the topic that the English currency begins and the overcoming of the marks of 2017-2016 is not far off. Today, in terms of the economic calendar, we have data on producer prices in the United States, where they expect a decline from 1.8% to 1.6%. The upcoming trading week in terms of the economic calendar is quite moderate, the week starts with a lull, but from Tuesday we already have a stream of news. Do not forget that the finish of the election race in Britain is nearing, and soon we will officially hear about the victory of Boris Johnson. The circus regarding the divorce process of Brexit will be resumed. The most interesting events displayed below ---> Tuesday, July 16 United Kingdom 8:30 UTC+00. - Change in the number of applications for unemployment benefits (June): Prev. 23.2K ---> Forecast 22.9K United Kingdom 8:30 UTC+00. - Average wage with bonuses (May): Prev. 3.1% ---> Forecast 3.0% United States 12:30 UTC+00 - Retail sales United States 13:15 UTC+00 - Industrial production Wednesday, July 17 United Kingdom 8:30 UTC+00. - Consumer Price Index (CPI) (y / y) (June): Prev. 2.0% United States 12:30 UTC+00 - Number of building permits issued (June): Prev. 1.299M ---> Forecast 1,300M United States 12:30 UTC+00 - The volume of construction of new homes (June): Prev. 1.269M ---> Forecast of 1.265M Thursday, July 18 United Kingdom 8:30 UTC+00. - Retail Sales (YoY) (June): Prev. 2.3% ---> Forecast 2.7% These are preliminary and subject to change. Further development Analyzing the current trading chart, we see that a temporary bump with a pivot point of 1.2500 has been confirmed, and now the quotation continues to fluctuate, having borders of 1.2500 / 1.2570. It is likely to assume that the movement in this framework will still persist, where traders carefully analyze the existing framework for breakdown when paving for further deals. Based on the available information, it is possible to decompose a number of variations, let's specify them: - Positions to buy, as written in the previous review, traders were still on the value of 1.2480, and yesterday, they made a profit. Further operations are considered in the case of price fixing higher than 1.2570. - Sell positions are considered in case of price fixing lower than 1.2500. Indicator Analysis Analyzing a different sector of timeframes (TF), we see that indicators in the short term changed their interest to neutral due to ambiguous bumpiness. Intraday perspective retains an upward interest against the background of the correction. The medium-term outlook keeps the downward interest against the background of a general decline since the beginning of the month. Weekly volatility / Measurement of volatility: Month; Quarter; Year Measurement of volatility reflects the average daily fluctuation, based on monthly / quarterly / year. (July 12 was based on the time of publication of the article) The current time volatility is 34 points. It is likely to assume that the volatility will be fixated within the framework of the daily average. Key levels Zones of resistance: 1.2620; 1.2770 **; 1.2880 (1.2865-1.2880) *; 1.2920 *; 1.3000 **; 1.3180 *; 1,3300. Support areas: 1.2500; 1.2430 *; 1.2350 **; 1.2100 **; 1.2000. * Periodic level ** Range Level *** The article is based on the principle of conducting a transaction, with daily adjustment. The material has been provided by InstaForex Company - www.instaforex.com |
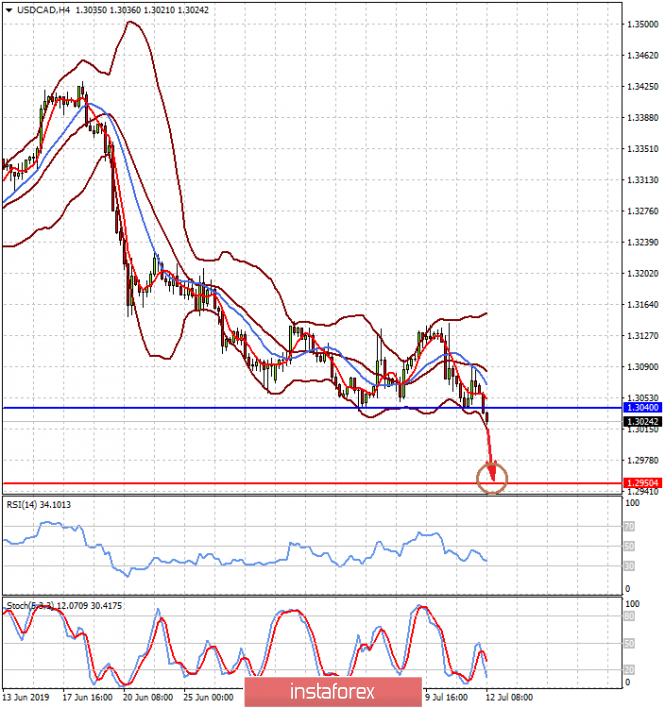
| Posted: 12 Jul 2019 01:14 AM PDT On Thursday, the markets received a new blow due to uncertainty against the background of the publication of US consumer inflation data. The data of the consumer price index presented on this day showed a growth rate of 1.6% in annual terms, as well as the June value of the index with 0.1% growth. However, the presented values of the basic consumer price index were the reason for the negative of the markets or rather the uncertainty factor in the prospects for the future monetary policy of the Fed. This reflects changes in the price of goods and services, except for food and energy. The indicator added 2.1% year-on-year, which is higher by 2.0% in June increase last year. The monthly value of the index rose even more by 0.3% in June against a rise of 0.1% in May and an increased forecast of 0.2%. These data caused mixed feelings among investors. On the one hand, they can prevent the American regulator from actively lowering interest rates, as the risk of rising inflation will stop the Central Bank in wanting to lower borrowing costs. Ultimately, this will be the basis for sales in the local stock market and then in other global markets. Recall that the only objective factor at the moment supporting the demand for shares of companies is the expectation of lowering interest rates. On the other hand, they may indicate an increase in demand in the country, which in general is a positive thing. Although it restrains the interest of market players in the shares of American companies, its cost and many of them are inadequately overestimated. How can the data on consumer inflation affect the dynamics of the US dollar? In our opinion, its strengthening will most likely be of a local nature since the US economy is experiencing a significant slowdown in growth, although not yet critical. In this situation, it seems that the Fed still has to lower rates once or twice this year by 0.25%, which will ultimately put pressure on them. Forecast of the day: The EUR/USD pair is trading below 1.1280. It can continue to grow only in the wake of raising investors' hopes for the Fed to lower interest rates, which will lead to an increase in demand for risky assets. In this situation, overcoming 1.1280 may stimulate the price increase to 1.1340. The USD/CAD pair is trading below 1.3040. We consider it possible to sell the pair against the background of the local recovery in oil prices and the meeting of the Central Bank of Canada on monetary policy, which will have a positive outcome for the Canadian currency. |
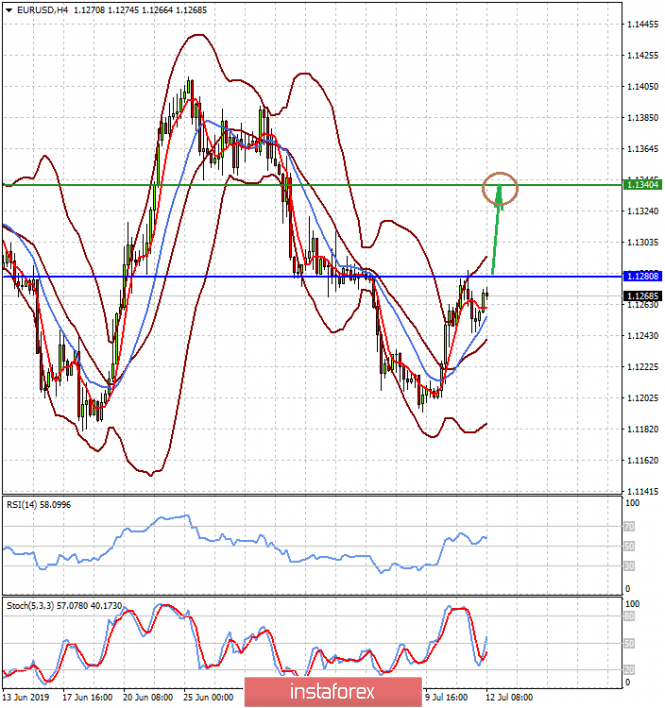
| Trading plan for EURUSD on 07/12/2019 Posted: 12 Jul 2019 12:57 AM PDT
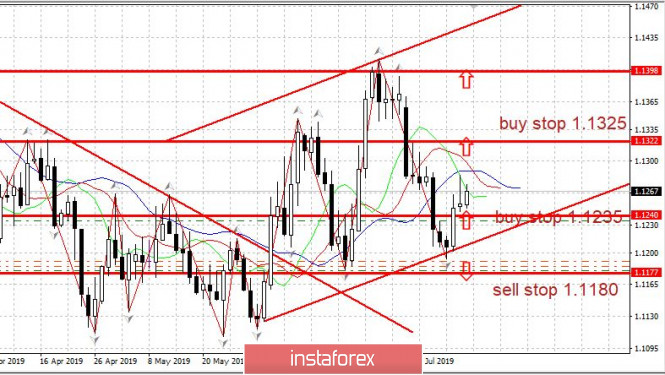
Fed Chairman Jerome Powell gave impetus to the falling dollar, confirming the Fed's willingness to lower the rate, as the US economy is under pressure from the US-China trade disputes. At the same time, the ECB is also ready to start a new round of liquidity injection into the markets in September. Against this background, on Thursday, the data showed an increase in inflation in the US. The "core" of inflation (without food and gasoline) showed an increase to +2.1% per annum (full inflation is lower, +1.6% per annum). However, the euro is still growing. EURUSD: We buy from 1.1250 and further to the breakthrough of 1.1325. We sell from 1.1180. The material has been provided by InstaForex Company - www.instaforex.com |
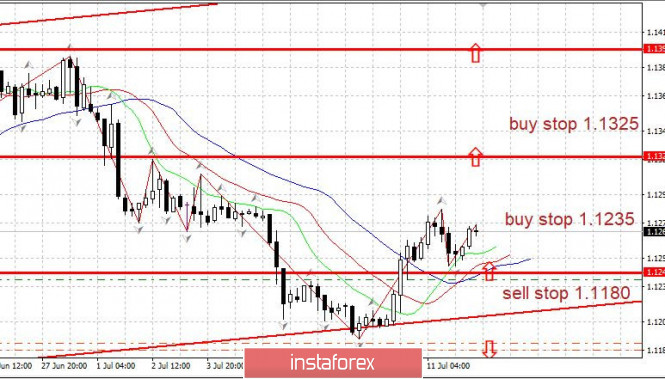
| Breaking forecast 07/12/2019 EURUSD and trading recommendation Posted: 12 Jul 2019 12:28 AM PDT The dollar unexpectedly received support on Thursday, as data on the United States showed an increase in inflation above the forecast. Nevertheless, the euro showed stability and holds growth. We expect continued growth of the euro on the expectations of the Fed rate cut. EURUSD: From the point of view of technical analysis, you can buy the euro from a pullback of 1.1250 - and further to the breakthrough of 1.1325 and 1.1395 Alternative: When turning down sell from 1.1180 The material has been provided by InstaForex Company - www.instaforex.com |
| Indicator analysis. Daily review of July 12, 2019 for the GBP / USD currency pair Posted: 12 Jul 2019 12:10 AM PDT Trend analysis (Fig. 1). On Friday, the price will continue to move up with the first goal of 1.2572 - the upper fractal. Upon reaching this, the continuation of the upward movement with the following goal is possible - a pullback level of 50.0% 1.2612 (blue dotted line).
Fig. 1 (daily schedule). Comprehensive analysis: - indicator analysis - up; - Fibonacci levels - up; - volumes - up; - candlestick analysis - up; - trend analysis - up; - Bollinger lines - down; - weekly schedule - up. General conclusion: On Friday, the price will continue to move up with the first goal of 1.2572 - the upper fractal. Upon reaching this, the continuation of the upward movement with the following goal is possible - a pullback level of 50.0% 1.2612 (blue dotted line). The material has been provided by InstaForex Company - www.instaforex.com |
| Posted: 12 Jul 2019 12:06 AM PDT The US dollar returned some of the lost positions on Wednesday against the euro and the pound after the release of the report, which showed that consumer prices in the US in June this year, though not significantly, increased, signaling the possible stabilization of inflationary pressure. According to the US Department of Labor, the consumer price index (CPI) rose 0.1% in June 2019 compared to the previous month, while economists had expected inflation to remain unchanged. The maximum increase in prices was recorded for clothing and used cars. As for the basic index, which does not take into account volatile categories, it increased by 0.3% in June compared to May, even though energy prices fell. Compared to the same period of the previous year in June, the consumer price index rose by 1.6% and the base prices increased by 2.1%. Good data on average earnings growth also helped the dollar. According to the data, taking into account the correction for inflation, the average hourly earnings in the US increased by 0.2% compared to May and by 1.5% compared to the same period of the previous year. Data on the US labor market continue to please traders. According to a report by the US Department of Labor, the number of initial jobless claims for the week from June 30 to July 6 decreased by 13,000 to 209,000. Economists had expected the number of applications to be 224,000. The US budget deficit report, which continued to grow, was completely ignored by markets. According to the US Treasury Department, the budget deficit increased by 23% from October to June this year compared to the same period last year. Total government revenues amounted to 2.6 trillion dollars, showing an increase of 3%. But the growth in spending was much higher and amounted to 3.3 trillion dollars, an increase of 7%. Thus, once again, the government's revenues and expenditures reached new record levels, and the total US budget deficit for the first 9 months of the fiscal year amounted to $747 billion. For 12 months, the budget deficit amounted to 919 billion dollars, an increase of 22.6% compared to the same period of 2019. Federal Reserve Chairman Jerome Powell, speaking yesterday before the Senate Banking Committee, drew attention to the need for the US Congress to take a decision and promptly raised the debt ceiling. As for the technical picture of the EURUSD pair, the further direction of the trading instrument remains a big question, as market expectations, after yesterday's inflation data, diverged again. The breakout of the resistance of 1.1280 will provide the euro with a new bullish momentum, which will lead to the renewal of highs in the area of 1.1310 and 1.1340. If the pressure on risky assets continues, then support can be expected in the area of 1.1230, but larger levels are seen in the range of 1.1200 and 1.1160. The material has been provided by InstaForex Company - www.instaforex.com |
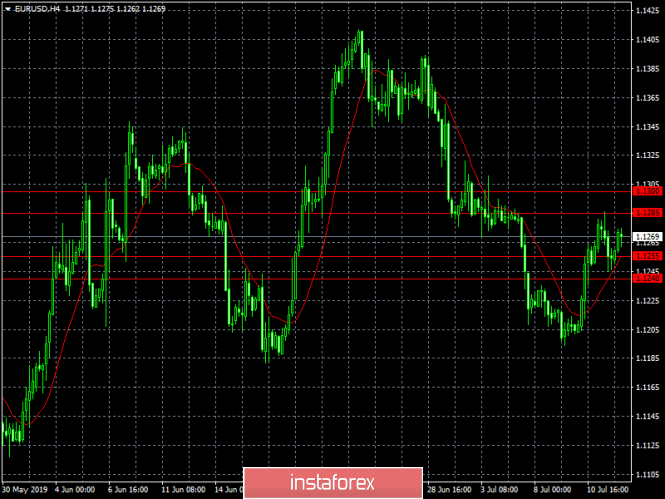
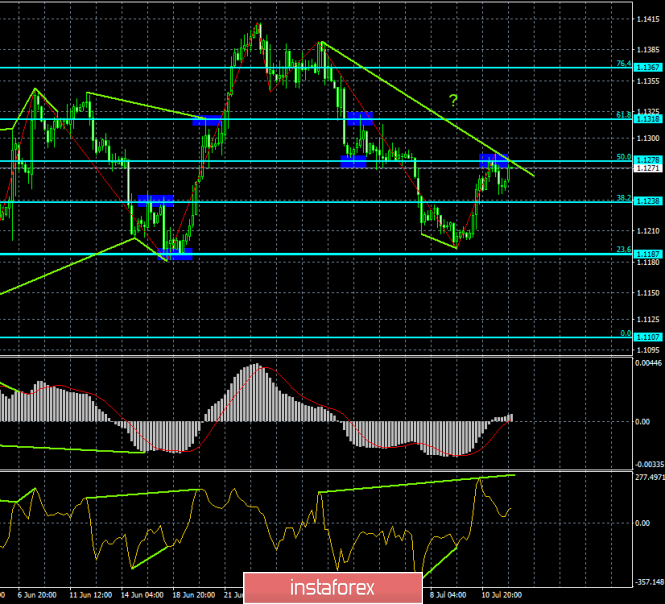
| Forecast for EUR/USD and GBP/USD on July 12. The Fed decided to prevent a reduction in rates Posted: 11 Jul 2019 11:45 PM PDT EUR/USD – 4H.
As seen on the 4-hour chart, the EUR/USD pair increased to the correction level of 50.0% (1.1278), rebound from it and return to it. A new rebound on July 12 from the Fibo level of 50.0% will work again in favor of the US dollar and some fall in the direction of the correction level of 38.2% (1.1238). The brewing bearish divergence of the CCI indicator only increases the chances of the beginning of the fall. Meanwhile, the euro was supported for two days by Jerome Powell, who spoke to two committees in Congress and made it clear that the Federal Reserve is ready to reduce the rate, which can be called preventive. In the last month, the economic performance of America has seriously decreased and slowed down. Only the labor market showed positive dynamics and only thanks to the Nonfarm Payrolls report. Thus, the Fed concluded that the pressure on the economy should be eased a little. And what about the euro? The situation in the European Union is no better, and perhaps even worse. The ECB rate may also be lowered, and economic indicators leave much to be desired for much longer than the "American month" (June). In this light, each rebound from the level of Fibo or bearish divergence can potentially return the forex market to the sales of the euro/dollar pair. The Fibo grid is built on extremums from March 20, 2019, and May 23, 2019. Forecast for EUR/USD and trading recommendations: The EUR/USD pair has fulfilled the growth to the correction level of 50.0% (1.1278). I recommend selling the pair with the target of 1.1238, with the stop-loss order above the level of 1.1278, if a new rebound from the level of 50.0% is executed, especially in conjunction with the bearish divergence. I recommend buying the pair with the target at 1.1318 and stop-loss order under the level of 1.1278, if the closing is above the level of 50.0%. GBP/USD – 4H.
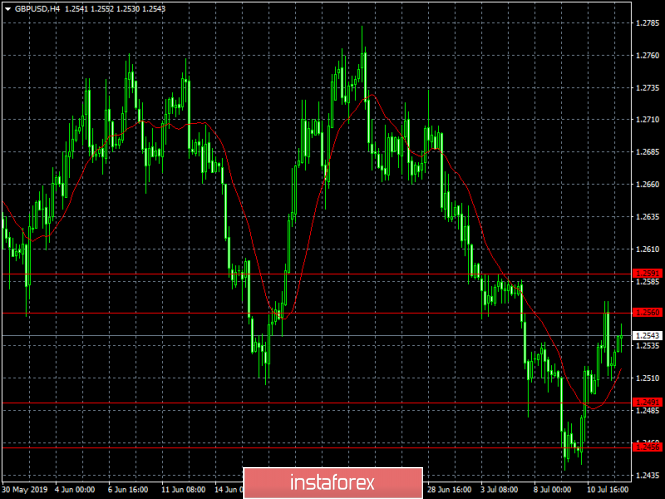
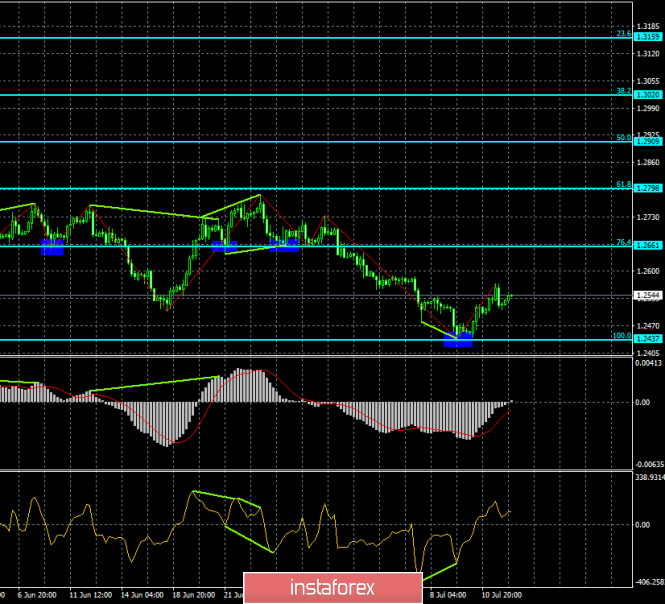
The GBP/USD pair performed a reversal in favor of the English currency after the formation of a bullish divergence at the CCI indicator. The pound continues its sluggish growth towards the correction level of 76.4% (1.2661). On the topic of Brexit, new reports and the UK has not been reported, and all participants in this process seem to be focused on the election of the leader of the Conservative Party and the Prime Minister, or just waiting for the results of these elections. Earlier, on July 23, it is not worth waiting for any changes in Brexit. And even after July 23, some time should pass before any actions of the new government begin. The pound sterling "feels" this uncertainty and does not want to grow. The topic of the trade war between China and the United States also calmed down, although both countries agreed to resume negotiations. However, "agreed to resume" and "resumed" and "agreed" are not the same. Thus, it is possible that the next round of negotiations between Xi Jinping and Trump will fail, the parties will not be able to come to an agreement, and all duties will remain in force and will be seasoned with new trade sanctions, which will further slow down global economic growth, which will force Powell to reduce rates further. In general, as in any war, there will be no winners. The Fibo grid is built on the extremes of January 3, 2019, and March 13, 2019. GBP/USD – 1H.
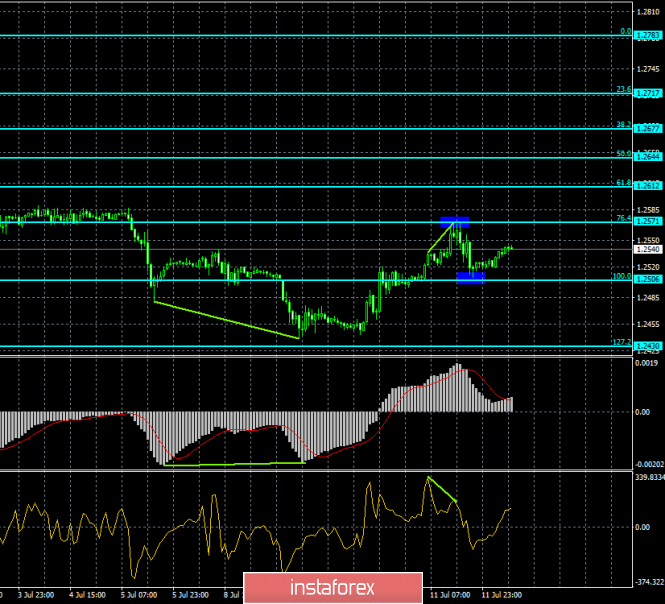
As seen on the hourly chart, the pound/dollar pair performed a rebound from the Fibo level of 76.4% (1.2571), a fall to the correctional level of 100.0% (1.2506), a rebound from it and a turn in favor of the pound sterling. As a result, on July 12, the pair continues to grow again in the direction of the correction level of 76.4%. The new rebound from this level of Fibo will again work in favor of the US dollar and some falling of quotations. The Fibo grid is based on the extremes of June 18, 2019, and June 25, 2019. Forecast for GBP/USD and trading recommendations: The GBP/USD pair performed the rebound from the Fibonacci level of 100.0%. I recommend buying the pair with the target at 1.2571, with a stop-loss order under the level of 1.2506, but in very small amounts. I recommend selling the pair with a view to 1.2506, if it will be rebounded from a Fibo level of 76.4% and with a stop-loss order above the level of 1.2571 (hourly chart). The material has been provided by InstaForex Company - www.instaforex.com |
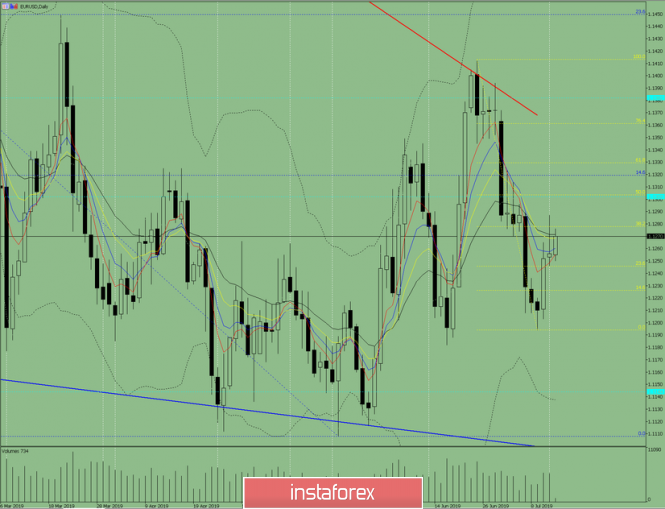
| Indicator analysis. Daily review of July 12, 2019 for the EUR / USD currency pair Posted: 11 Jul 2019 11:36 PM PDT On Thursday, technical analysis gave a strong upward, but the news made its own adjustment and the pair, after a strong top, went quite far down and closed with a question. Today, the upward trend will continue. Strong calendar news is expected at 12.30 Universal time (dollar). Trend analysis (Fig. 1). On Friday, the upward movement will continue with the first target of 1.1287 - the upper fractal. Fig. 1 (daily schedule). Comprehensive analysis: - indicator analysis - up; - Fibonacci levels - up; - volumes - up; - candlestick analysis - up; - trend analysis is neutral; - Bollinger lines - down; - weekly schedule - up. General conclusion: On Friday, the upward movement will continue with the first target of 1.1287 - the upper fractal. The material has been provided by InstaForex Company - www.instaforex.com |


| You are subscribed to email updates from Forex analysis review. To stop receiving these emails, you may unsubscribe now. | Email delivery powered by Google |
| Google, 1600 Amphitheatre Parkway, Mountain View, CA 94043, United States | |
No comments:
Post a Comment