
Forex analysis review |
- AUD / USD vs USD / CAD vs NZD / USD vs #USDX. Comprehensive analysis of movement options from July 23, 2019. Analysis of
- Fractal analysis of major currency pairs on July 24
- #USDX vs EUR / USD vs GBP / USD vs USD / JPY. Comprehensive analysis of movement options from July 24, 2019 Analysis of APLs
- Gold in anticipation of the Fed rate cut
- A hurricane in the form of Boris Johnson and a total reduction in rates is approaching the euro and the pound
- ECB may surprise the market and send the euro to new lows
- GBP/USD. July 23rd. Results of the day. Markets completely ignored the results of the prime minister elections of Great Britain
- EUR/USD. July 23rd. Results of the day. The euro continues to fall amid fears over the ECB's actions
- GBPUSD: Three scenarios for which the situation with Brexit can continue to develop after Boris Johnson's victory in the
- Brent under the hood at the White House
- USDCAD bounces as expected targeting 1.32
- EURUSD breaks support and provides new sell signal
- Gold price remains vulnerable due to Dollar strength but holds above key support
- Analysis of BITCOIN for July 23, 2019
- New low in EUR/USD is coming soon
- Technical analysis of USD/CAD for July 23, 2019
- Technical analysis of AUD/USD for July 23, 2019
- Gold 07.23.2019 - Important pivot at the price of $1.429
- Fractal analysis of major currency pairs on July 23
- EUR/USD for July 23,2019 -Buying divergence on oscillators
- BTC 07.23.2019 - Down brerakout of 2-day balance
- Murray Math: bullish moment on Mexican peso
- Forecast for Bitcoin on July 23rd. Bitcoin continues to fall after statements by Steven Mnuchin
- GBP/USD: plan for the American session on July 23. The pound bounced up after Boris Johnson became the new British Prime
- EUR/USD: plan for the American session on July 23. The euro continues to lose ground, leaving more and more in the peak
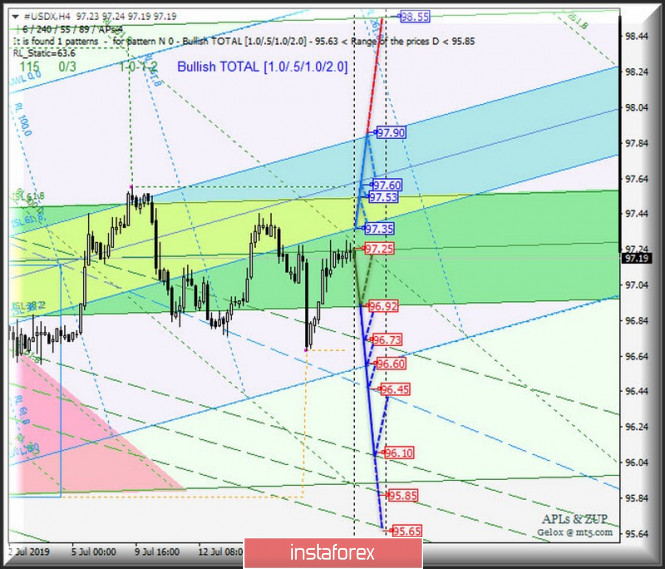
| Posted: 23 Jul 2019 07:23 PM PDT Minuette ( H4 ) Let us consider the comprehensive options for the development of the movement of currency instruments AUD / USD vs USD / CAD vs NZD / USD vs #USDX from July 23, 2019 on the Minuette operational scale (H4 timeframe). ____________________ US Dollar Index The direction of development of the movement of the dollar index #USDX from July 23, 2019 will be determined by the direction of the range breakdown :
For the breakdown of the support level of 97.25 (1/2 Median Line Minuette), the downward movement of the dollar index can be continued towards the targets - the lower limit of the ISL38.2 (96.92) Minuette operational scale fork - the final Schiff Line Minuette (96.73) - the initial SSL line (96.60) of the Minuette operational scale fork - the final Schiff Line Minuette (96.45), and the option to reach the upper boundary of the 1/2 Median Line Minuette ( 96.10 ). In the event of a breakdown of the lower limit of ISL38.2 Minuette (resistance level of 97.35), the development of the #USDX movement will continue in the equilibrium zone (97.35 - 97.60 - 97.90) of the Minuette operational scale, with the prospect of reaching the final FSL Minuette line (98.55). The markup of the #USDX motion options from July 23, 2019 is viewed on the animated graphics.
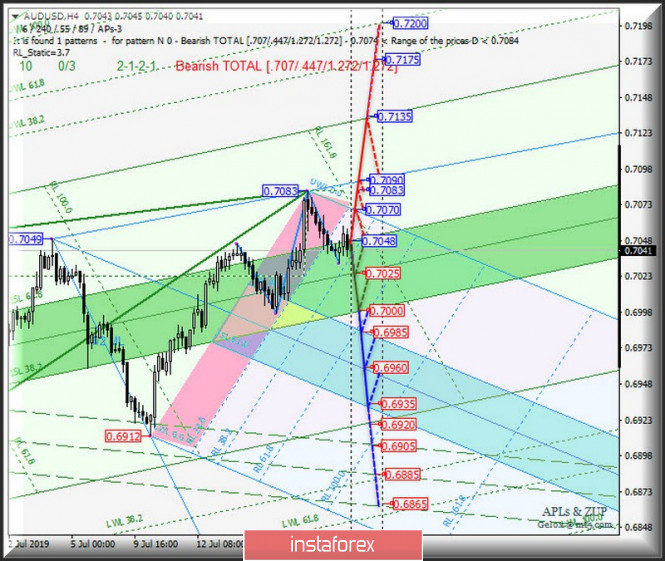
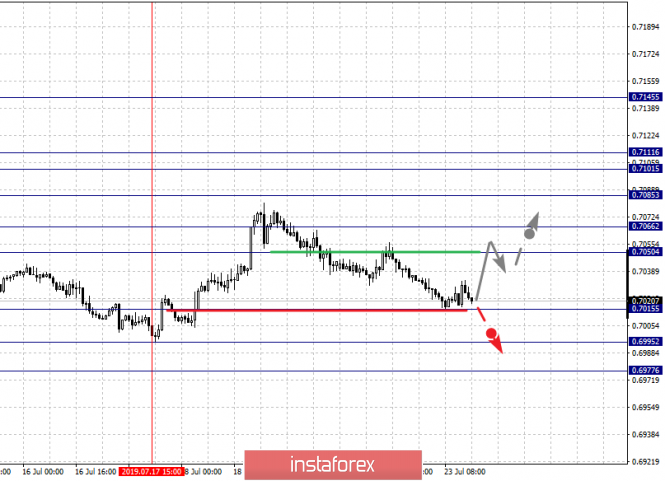
____________________ Australian dollar vs US Dollar The development of the AUD / USD movement from July 23, 2019 will be determined by working out towards the direction of the breakdown of the equilibrium zone (0.7048 - 0.7025 - 0.7000) of the Minuette operational scale fork. For the breakdown of the upper limit of the ISL61.8 (resistance level of 0.7048) of the equilibrium zone of the Minuette, it will determine the development of the AUD / USD movement towards the targets - the initial SSL line (0.7070) of the Minuette operational scale fork - the local maximum 0.7083 - the UTL Minuette control line (0.7090) - the final line FSL Minuette (0.7135). In case of a breakdown of the lower limit of ISL38.2 (support level of 0.7000) of the Minuette operational scale fork, the downward movement of theAustralian dollar will continue to the equilibrium zone (0.6985 - 0.6960 - 0.6935) of the Minuette operational scale fork. The markup of the options for the movement of AUD / USD from July 23, 2019 are viewed on the animated graphics.
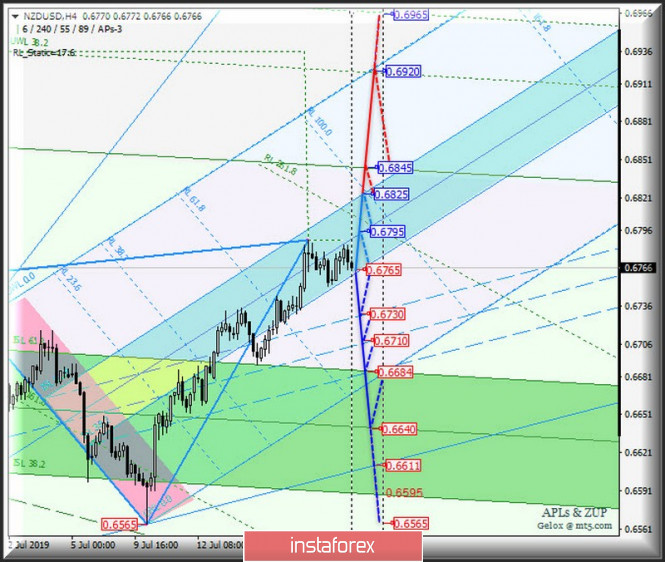
____________________ New Zealand Dollar vs US Dollar The further development of the movement of the New Zealand dollar NZD / USD from July 23, 2019 will be determined by working out towards the direction of the breakdown of the boundaries of the equilibrium zone (0.6765 - 0.6795 - 0.6825) of the Minuette operational scale. The breakdown resistance level of 0.6825 (upper limit of ISL61.8 equilibrium zone of the Minuette operational scale fork) confirms the possibility of developing the upward movement of the New Zealand dollar to the targets - the final FSL line (0.6845) of the Minuette operational scale fork - the final FSL Minuette line (0.6920). If the support level of 0.6765 is broken (ISL38.2 lower limit of the balance zone of the Minuette operational scale fork), the downward movement of NZD / USD will continue to the borders of the 1/2 Median Line channel Minuette (0.6730 - 0.6710 - 0.6684) with the possibility of reaching the Median Line (0.6640) Minuette operational scale fork. For the layout of the movement options for NZD / USD July 23, 2019, look at the animated graphics.
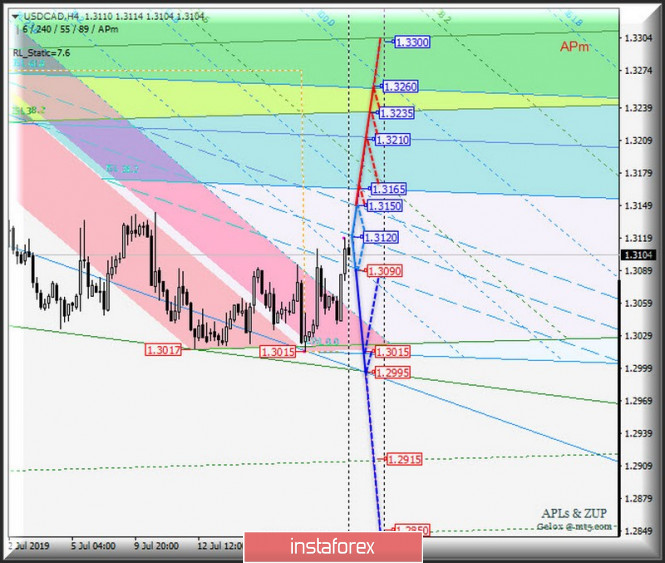
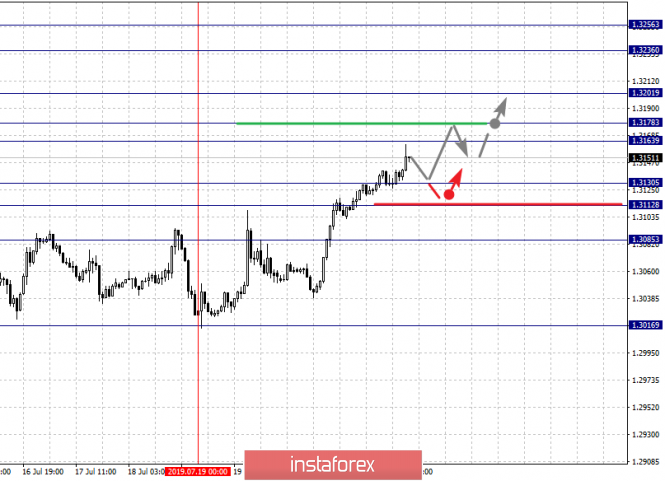
____________________ US Dollar vs Canadian Dollar The development and direction of the breakdown of the 1/2 Median Line channel borders (1.3150 - 1.3120 - 1.3090) of the Minuette operational scale will determine the development of the Canadian dollar USD / CAD movement from July 23, 2019. After the support level of 1.3090 is broken (lower channel 1/2 border Median Line Minuette) USD / CAD downward movement will be directed to the initial SSL (1.3015 - local minimum) and control LTL (1.2995) lines of the Minuette operational scale forks. As a result of the breakdown of the resistance level of 1.3150 (the upper limit of the channel 1/2 Median Line Minuette) will be relevant to the continuation of the upward movement of USD / CAD to the equilibrium zone (1.3165 - 1.3210 - 1.3260) of the Minuette operational scale fork. The layout of the options for the movement of USD / CAD from July 23, 2019 is viewed on the animated graphics.
____________________ The review was compiled without regard to the news background, the opening of trading sessions of the main financial centers and is not a guide to action (placing orders " sell " or " buy ") The formula for calculating the dollar index is USDX = 50.14348112 * USDEUR0.576 * USDJPY0.136 * USDGBP0.119 * USDCAD0.091 * USDSEK0.042 * USDCHF0.036. where power ratios correspond to the weights of currencies in the basket: Euro - 57.6%; Yen - 13.6%; Pound sterling - 11.9%; Canadian dollar - 9.1%; Swedish krona - 4.2%; Swiss franc - 3.6%. The first coefficient in the formula gives the index value to 100 on the date of the beginning of the countdown - March 1973, when the main currencies began to be freely quoted relative to each other. The material has been provided by InstaForex Company - www.instaforex.com |
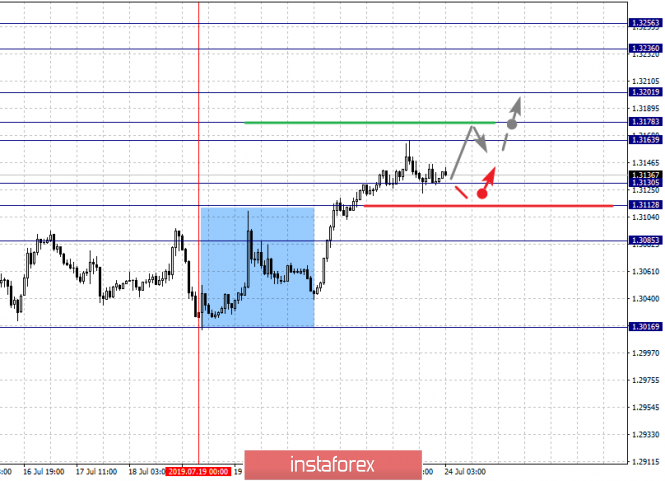
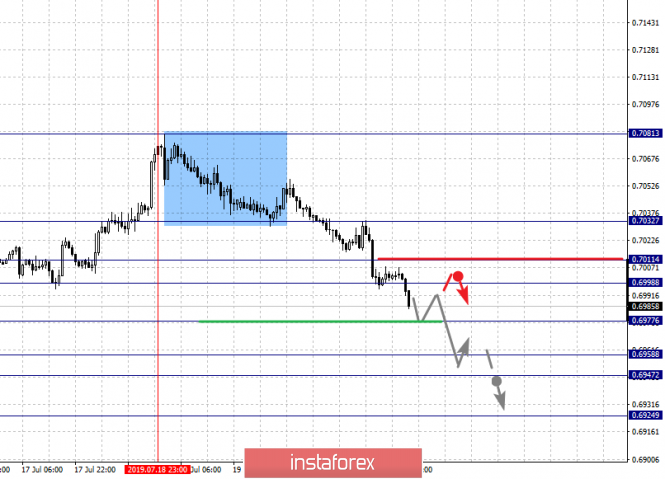
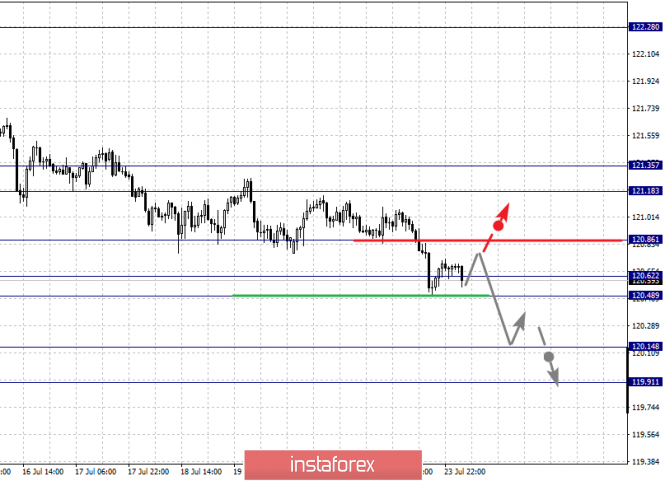
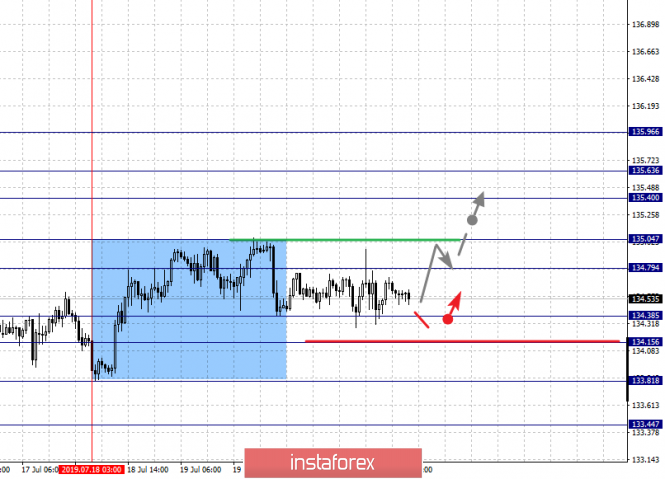
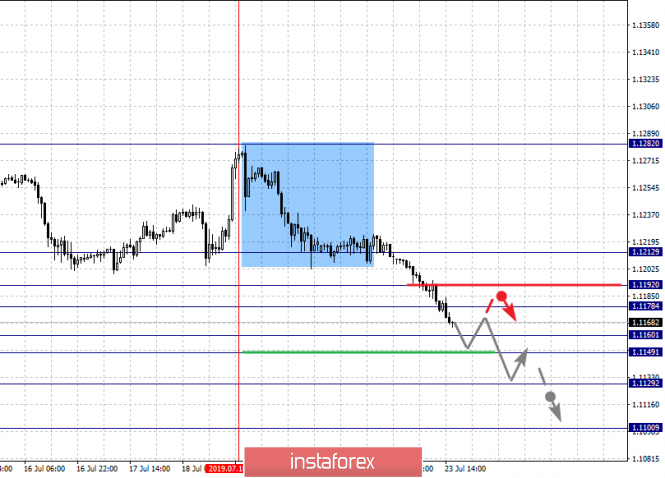
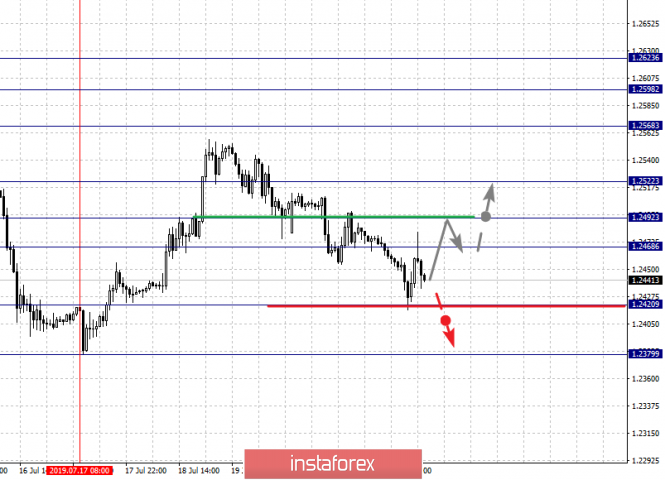
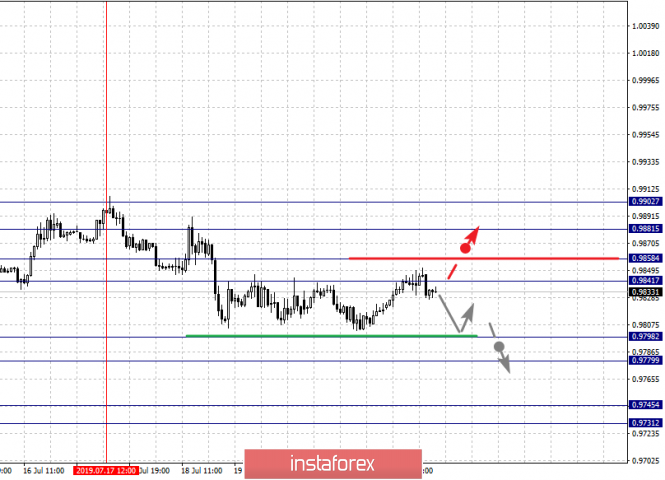
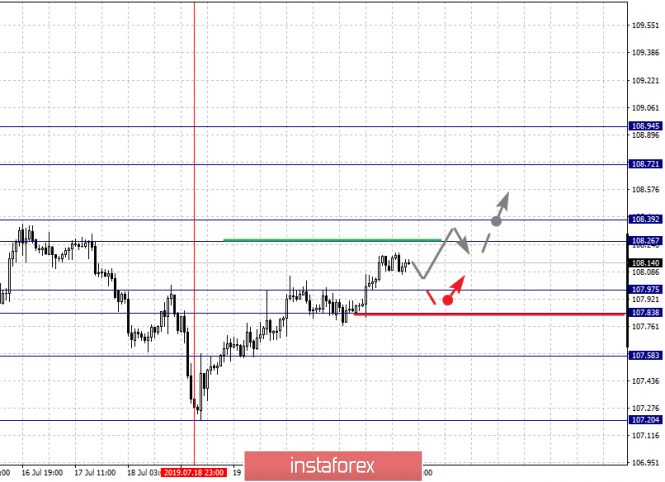
| Fractal analysis of major currency pairs on July 24 Posted: 23 Jul 2019 06:03 PM PDT Forecast for July 24: Analytical review of H1-scale currency pairs: For the euro / dollar pair, the key levels on the H1 scale are: 1.1212, 1.1195, 1.1174, 1.1162, 1.1142, 1.1119, 1.1104 and 1.1073. Here, we continue to follow the development of the downward cycle of July 18. The continuation of the movement to the bottom is expected after the breakdown of the level of 1.1142. In this case, the target is 1.1119. Price consolidation is in the range of 1.1119 - 1.1104. For the potential value for the bottom, we consider the level of 1.1073. The movement to which is expected after the breakdown of the level of 1.1104. Short-term upward movement is possible in the range of 1.1162 - 1.1174. The breakdown of the latter value will lead to a prolonged correction. Here, the target is 1.1195. We expect the registration of the expressed initial conditions for the ascending cycle to the level of 1.1212. The main trend is a local downward structure of July 18. Trading recommendations: Buy 1.1162 Take profit: 1.1174 Buy 1.1175 Take profit: 1.1195 Sell: 1.1140 Take profit: 1.1120 Sell: 1.1104 Take profit: 1.1075 For the pound / dollar pair, the key levels on the H1 scale are: 1.2623, 1.2598, 1.2568, 1.2522, 1.2492, 1.2486, 1.2420 and 1.2379. Here, the price is close to the abolition of the ascending structure of July 17, for which the breakdown of the 1.2420 level is necessary. In this case, the first potential target is 1.2379. Short-term upward movement is expected in the range of 1.2468 - 1.2492. The breakdown of the latter value will have to form a local structure for the top. Here, the target is 1.2522. This level is a key resistance for the upward trend. Its breakdown must be accompanied by a pronounced upward movement to the potential target - 1.2568. The main trend is the formation of the ascending structure of July 17, the stage of deep correction. Trading recommendations: Buy: 1.2468 Take profit: 1.2490 Buy: 1.2493 Take profit: 1.2522 Sell: 1.2420 Take profit: 1.2380 For the dollar / franc pair, the key levels on the H1 scale are: 0.9902, 0.9881, 0.9858, 0.9841, 0.9798, 0.9779, 0.9745 and 0.9731. Here, we continue to follow the formation of the downward structure of July 17. At the moment, the price is in the correction zone and forms a small potential for the top of July 22. The development of which is expected after the breakdown of the level of 0.9881. In this case, the first potential target is 0.9902. Short-term downward movement is expected in the range of 0.9798 - 0.9779. The breakdown of the last value should be accompanied by a pronounced downward movement. Here, the goal is 0.9745. For the potential value for the bottom, we consider the level of 0.9731. After reaching which, we expect consolidation, as well as rollback to the top. The main trend is the local downward structure of July 17. Trading recommendations: Buy : 0.9860 Take profit: 0.9880 Buy : 0.9882 Take profit: 0.9902 Sell: 0.9798 Take profit: 0.9780 Sell: 0.9776 Take profit: 0.9747 For the dollar / yen pair, the key levels on the scale are : 108.94, 108.72, 108.39, 108.26, 107.97, 107.83 and 107.58. Here, we are following the development of the ascending structure of July 18. The continuation of the movement to the top is expected after the price passage by the noise range of 108.26 - 108.39. In this case, the goal is 108.72. We consider the level of 108.94 to be a potential value for the top. Upon reaching this level, we expect consolidation as well as a rollback to the bottom. Short-term downward movement is possible in the range of 107.97 - 107.83. The breakdown of the latter value will lead to a prolonged correction. Here, the goal is 107.60. This level is a key support for the upward structure. The main trend: the ascending structure of July 18. Trading recommendations: Buy: 108.40 Take profit: 108.70 Buy : 108.73 Take profit: 108.94 Sell: 107.96 Take profit: 107.84 Sell: 107.81 Take profit: 107.60 For the Canadian dollar / US dollar pair, the key levels on the H1 scale are: 1.3256, 1.3236, 1.3201, 1.3178, 1.3163, 1.3130, 1.3112 and 1.3085. Here, we are following the ascending structure of July 19th. The continuation of the movement to the top is expected after the passage of the price to the noise range 1.3163 - 1.3178. In this case, the goal - 1.3201, and near this level is a consolidation. The breakdown of the level of 1.3201 will lead to a pronounced movement. Here, the target is 1.3236. For the potential value for the top, we consider the level of 1.3256. Upon reaching which, we expect a rollback to the bottom. Short-term downward movement is possible in the range of 1.3130 - 1.3112. The breakdown of the latter value will lead to a prolonged correction. Here, the target is 1.3085. This level is a key support for the top. The main trend is the ascending structure of July 19. Trading recommendations: Buy: 1.3178 Take profit: 1.3200 Buy : 1.3203 Take profit: 1.3234 Sell: 1.3130 Take profit: 1.3112 Sell: 1.3110 Take profit: 1.3085 For the pair Australian dollar / US dollar, the key levels on the H1 scale are : 0.7032, 0.7011, 0.6998, 0.6977, 0.6958, 0.6947 and 0.6924. Here, we follow the development of the downward structure of July 18. The continuation of the movement to the bottom is expected after the breakdown of the level of 0.6977. In this case, the goal is 0.6958. Price consolidation is in the range of 0.6958 - 0.6947. For the potential value for the bottom, we consider the level of 0.6924. After reaching which, we expect a rollback to the top. Short-term upward movement is possible in the range of 0.6998 - 0.7011. The breakdown of the latter value will lead to a prolonged correction. In this case, the target is 0.7032. The main trend - the downward structure of July 18. Trading recommendations: Buy: 0.6998 Take profit: 0.7010 Buy: 0.7013 Take profit: 0.7030 Sell : 0.6977 Take profit : 0.6958 Sell: 0.6945 Take profit: 0.6926 For the euro / yen pair, the key levels on the H1 scale are: 121.35, 121.18, 120.86, 120.62, 120.48, 120.14 and 119.91. Here, we continue to monitor the downward structure of July 10. At the moment, the price is in the noise range of 120.62 - 120.48. The breakdown of the level of 120.46 should be accompanied by a pronounced downward movement. Here, the goal is 120.14. For the potential value for the bottom, we consider the level of 119.91. After reaching which, we expect a rollback to the top. Care in the correction is expected after the breakdown of the level of 120.86. Here, the first target is 121.18. We expect the registration of the expressed initial conditions for the ascending cycle to the level of 121.35. The main trend - the downward structure of July 10. Trading recommendations: Buy: 120.86 Take profit: 121.15 Buy: 121.18 Take profit: 121.35 Sell: 120.48 Take profit: 120.15 Sell: 120.12 Take profit: 119.94 For the pound / yen pair, the key levels on the H1 scale are : 135.96, 135.63, 135.40, 135.04, 134.79, 134.38, 134.15, 133.81 and 133.44. Here, the price forms the expressed initial conditions for the top of July 18th. Short-term movement to the top is expected in the range of 134.79 - 135.04. The breakdown of the last value should be accompanied by a pronounced upward movement. Here, the target is 135.40. A short-term upward movement, as well as consolidation is in the range of 135.40 - 135.63. We consider the level of 135.96 to be a potential value for the top. Upon reaching this level, we expect consolidation as well as a rollback to the bottom. Short-term downward movement is perhaps in the range of 134.38 - 134.15. The breakdown of the latter value will have to develop a downward trend. Here, the goal is 133.81. For the potential value for the bottom, we consider the level of 133.44. The main trend is the downward cycle of July 9, the formation of potential for the top of July 18. Trading recommendations: Buy: 135.06 Take profit: 135.40 Buy: 135.42 Take profit: 135.62 Sell: 134.38 Take profit: 134.17 Sell: 134.12 Take profit: 133.81 The material has been provided by InstaForex Company - www.instaforex.com |
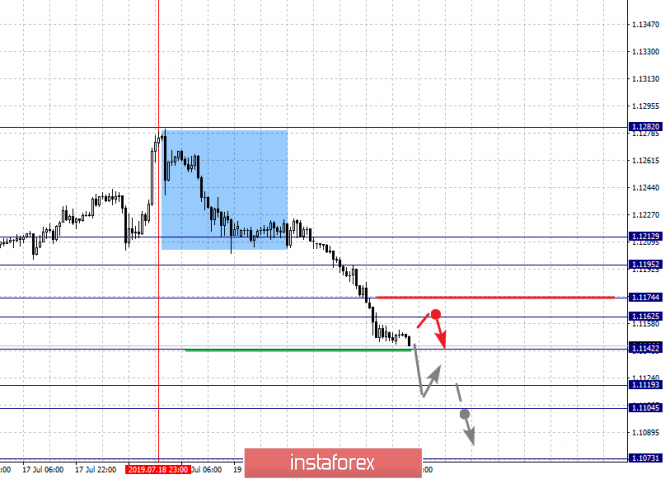
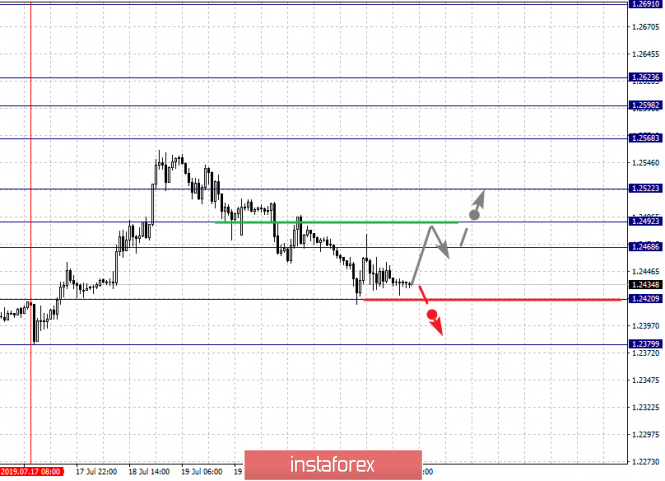
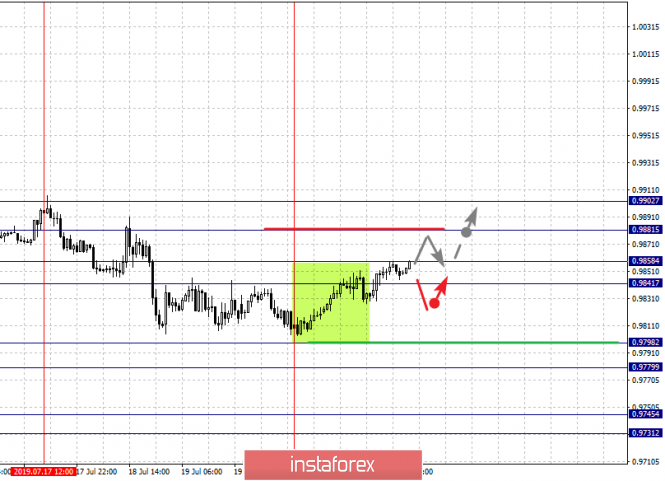
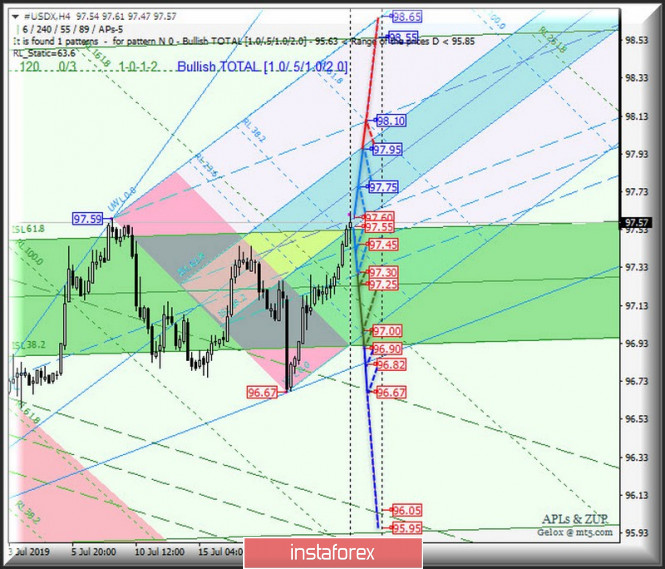
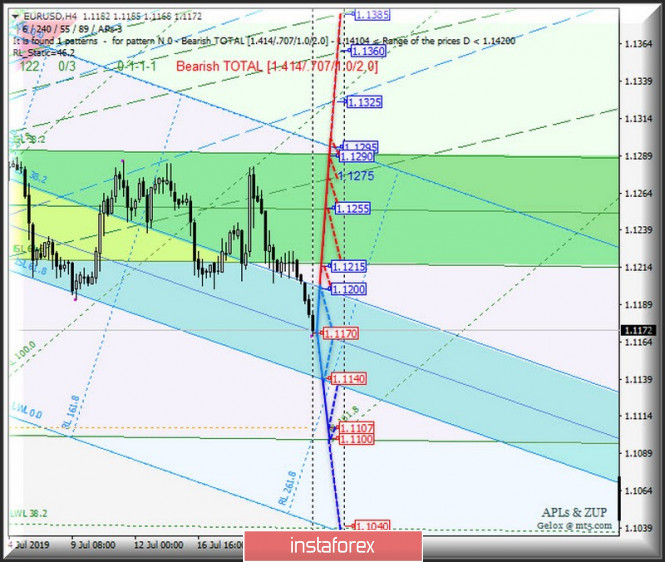
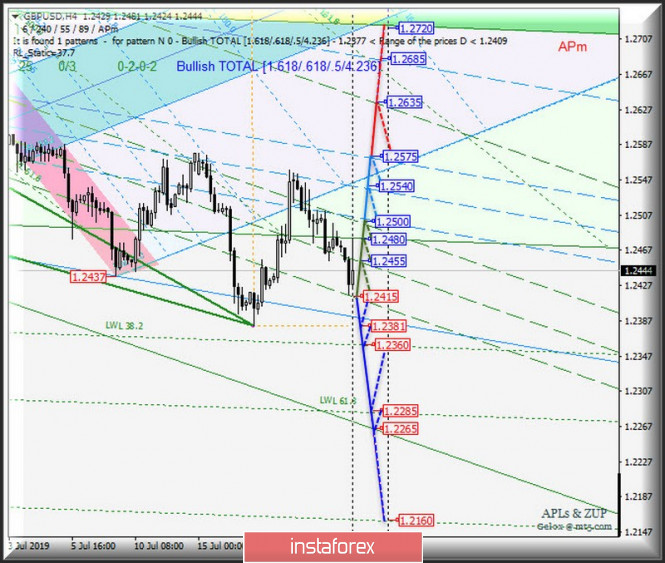
| Posted: 23 Jul 2019 05:26 PM PDT The proportion of currency instruments EUR / USD, GBP / USD and USD / JPY in calculating the dollar index #USDX is 83.1%. Thus, let's see how these instruments will behave in the market from July 24, 2019. Minuette (H4 time frame) ____________________ US dollar Index From July 24, 2019, the development of the dollar index movement #USDX will be due to the testing and direction of the breakdown of the 1/2 Median Line channel boundaries (97.60 - 97.45 - 97.30) of the Minuette operational scale. The movement options within this channel are presented in the animated graphics. If the support level of 97.30 is broken, (the lower boundary of the 1/2 Median Line channel of the Minuette operating scale fork) together with the 1/2 Median Line Minuette (97.25), the downward movement of the dollar index will be directed to the targets - the initial SSL line (97.00) of the Minuette operating scale fork - the lower boundary ISL38.2 (96.90) equilibrium zone of the Minuette operational scale fork - control line LTL Minuette (96.82) - final Schiff Line Minuette (96.67). In the case of the breakdown of the upper boundary of the 1/2 Median Line channel (resistance level of 97.60), the forwarded Minuette operational scale movement #USDX will continue in the equilibrium zone (97.55 - 97.75 - 97.95) of the Minuette operating scale with the prospect of reaching the ultimate Schiff Line Minuette (98.10). The details of the #USDX movement within the channel are shown in the animated graphics. ____________________ Euro vs US dollar The development and direction of the breakdown of the equilibrium zone (1.1140 - 1.1170 - 1.1200) of the Minuette operational scale fork will determine the further development of the movement of the common European currency EUR / USD from July 24, 2019. Let's look at the illustration. The breakdown of the upper boundary of the ISL38.2 (resistance level of 1.1200) of the equilibrium zone of the Minuette operational scale fork will direct the EUR / USD movement to the boundaries of the equilibrium zone (1.1215 - 1.1255 - 1.1290) of the Minute operational scale fork. On the other hand, if the EUR / USD breaks the lower boundary of the ISL61.8 (support level of 1.1140) equilibrium zone of the Minuette operational scale fork, then there will be a continuation of the development of the downward movement to the local minimum of 1.1107 and the final FSL line (support level of 1.1100) of the Minuette operation scale fork. The details of the EUR / USD movement options are shown in the animated graphics. ____________________ Great Britain pound vs US dollar Her Majesty's currency GBP / USD continues to remain in the 1/2 Median Line channel (1.2500 - 1.2455 - 1.2415) of the Minuette operating scale fork, and accordingly, the further development of the movement of this instrument will depend on the development and direction of the breakdown of the specified higher levels. Let's see the options for the movement within this channel in the animated graphics. The breakdown of the resistance level of 1.2570 at the upper boundary of the 1/2 Median Line channel Minuette will confirm the further movement of the GBP / USD which will begin to flow into the 1/2 Median Line channel (1.2500 - 1.2540 - 1.2575) of the Minuette operating scale fork with the prospect of reaching the ultimate Schiff Line Minuette (1.2635). The breakdown of the lower boundary of the 1/2 Median Line channel Minuette (support level of 1.2415) will determine the further development of the downward movement of Her Majesty's currency to the targets - the local minimum (1.2381) - warning line LWL38.2 Minuette (1.2360) - warning line LWL61.8 Minuette (1.2285) - control line LTL Minuette (1.2265). The details of the GBP / USD movement can be seen in the animated graphics.
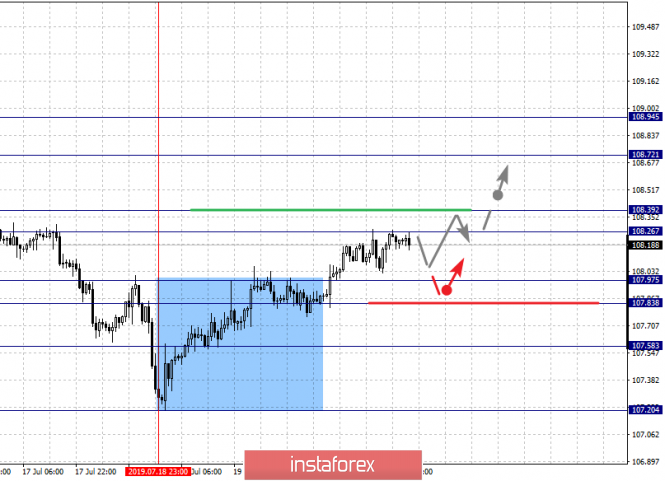
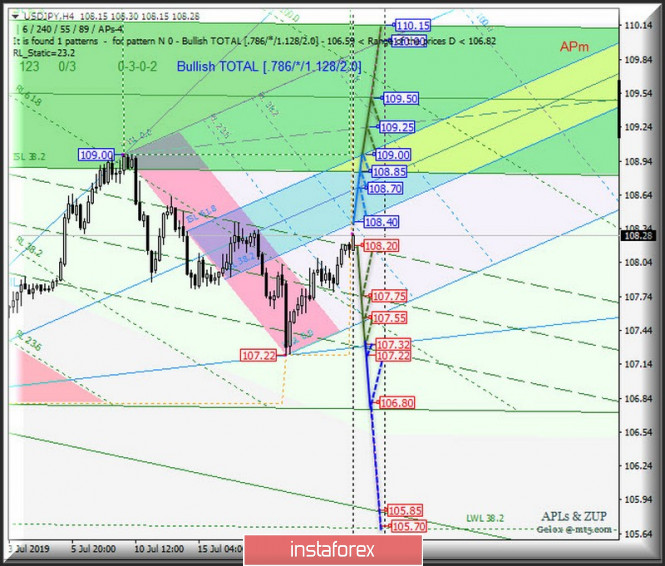
____________________ US dollar vs Japanese yen The further development of the movement of the "currency of the rising sun" USD / JPY from July 24, 2019 will be determined by the direction of the range breakdown: - resistance level of 108.40 (lower boundary of ISL38.2 equilibrium zone of the Minuette operating scale fork); - support level of 108.20 (upper boundary of the 1/2 Median Line channel of the Minuette operating scale fork) The breakdown of the support level of 108.20 will confirm the development of the USD / JPY movement within the 1/2 Median Line channel (108.20 - 107.75 - 107.32) of the Minuette operating scale with the prospect of updating the local minimum 107.32 and reaching the minimum 106.80. Meanwhile, in the case of the breakdown of ISL38.2 Minuette (resistance level of 108.40), the development of the "currency of the rising sun" movement will continue within the boundaries of the equilibrium zones of the Minuette operational scale fork (108.40 - 108.70 - 109.00) and Minuette (108.85 - 109.50 - 110.15). The details of the movement options of USD / JPY are presented in the animated graphics.
____________________ The review was compiled without taking into account of the news background. The opening of trading sessions of the main financial centers does not serve as a guide to action (placing orders "sell" or "buy"). The formula for calculating the dollar index is: USDX = 50.14348112 * USDEUR0.576 * USDJPY0.136 * USDGBP0.119 * USDCAD0.091 * USDSEK0.042 * USDCHF0.036. where power ratios correspond to the weights of currencies in the basket: Euro - 57.6% ; Yen - 13.6% ; Pound sterling - 11.9% ; Canadian dollar - 9.1%; Swedish krona - 4.2%; Swiss franc - 3.6%. The first coefficient in the formula gives the index value to 100 on the date of the beginning of the countdown - March 1973, when the main currencies began to be freely quoted relative to each other. The material has been provided by InstaForex Company - www.instaforex.com |
| Gold in anticipation of the Fed rate cut Posted: 23 Jul 2019 05:11 PM PDT Surprisingly, but a fact: amid the strengthening greenback, gold renews its perennial highs. Since 2013, the precious metal has been trading in the range of $1050-1385 per ounce, and only recently strengthened expectations regarding easing of monetary policy by the Federal Reserve System (FRS) of the United States allowed quotes to come out. The main obstacle in the path of "bulls" on XAU/USD is traditionally considered to be a strong dollar, but even now its position does not seem to be hopeless. What then is the matter? If in 2014-2018, the US currency showed growth due to the tightening of the monetary rate of the Fed, then at present it remains stable primarily due to the weakness of competitors. The Fed is signaling its intention to carry out monetary expansion for preventive purposes. The Bank of England in front of the "hawk" turns into a "dove". The ECB is also ready to ease monetary policy. In conditions when it is difficult to find a strong currency, investors switch to other assets. Promotions? The historical highs of the S&P 500 index are undoubtedly impressive, but the higher it grows, the stronger the impression that this is a "bubble". The only driver of the rally is investor confidence in aggressively lowering the Fed rate. If the US central bank does not go in the wake of the market, the fall of the S&P 500 will be guaranteed. Bonds? Under normal conditions, bonds act as an alternative to gold and take advantage of it in the form of interest income. However, when the volume of negative-yield bonds traded on the global market increases by leaps and bounds, and currently exceeds $13 trillion, investors start looking at the yellow precious metal in a completely different way. Buying gold seems to be the best choice for them. In fact, which is preferable: not having interest income or paying extra for the fact that you own bonds? Is it any wonder, then, that in the conditions of only a formally strong dollar, the increasing risks of lowering the S&P 500 and the growing number of traded bonds with negative yields, investors prefer gold? Gold ETF reserves have already exceeded 74 million ounces - less than 18 million below the record high of 92 million ounces recorded in 2011. "The vector of the monetary policy of key central banks seems to have changed, so we are optimistic about the prospects for the yellow precious metal," said experts from Citigroup. "We expect the Fed to cut its interest rate by 25 basis points at the July meeting. At the same time, we do not exclude that the regulator can reduce it immediately by 50 basis points. The beginning of the decline in interest rates in the United States will be a positive event for the bulls on gold," they added. According to Citigroup's forecast, in the third quarter the price of gold will average $1,425 per ounce, and in the fourth quarter - $1,450. The material has been provided by InstaForex Company - www.instaforex.com |
| Posted: 23 Jul 2019 05:10 PM PDT Market participants reinforce expectations of policy easing not only by the Fed, but also by the ECB. Some estimates suggest that currency quotes are predicted to lower interest rates in Europe by 10 basis points this Thursday. Traders make premature conclusions based on the dynamics of debt markets, which may be distorted by the demand for defensive assets. Perhaps this is what is happening now. On the one hand, geopolitical tensions in the Persian Gulf are pressing, and on the other, anxiety around the"hard" Brexit. This scenario is becoming more and more likely, as ardent eurosceptic Boris Johnson is announced today as prime minister of the United Kingdom. Pro pound The pound is under increased pressure and it's not just Brexit and Johnson. Representatives of the Bank of England hinted that the regulator could join the "dovish" promise of its Fed and ECB counterparts. Member of the Board of Directors of the British central bank Michael Saunders openly told Bloomberg about the weakness of the UK economy. Its prospects will worsen the painful Brexit, which the regulator is unable to stop. All this contributes to a further decrease in the pound. It is worth noting that Saunders' dovish comments were made just before the meeting of the central bank next week. This is a sharp turn in the key of the Bank of England, whose representatives sought to ease market expectations, promising to stick to their "gradual, but limited" increases in interest rates. In a weak economy, it is difficult for the leadership of the British central bank to go in the opposite direction with colleagues who bombarded the market with announcements about further mitigating policies. In addition, the United Kingdom quite inopportunely strained relations with Iran. The British currency paired with the dollar traded near the lowest level for two and a half years. Judging by how things are going, the sterling is firmly established at these levels. However, you shouldn't discount the fact that the pound looks oversold after many months of falling, which means that the pressure on it may turn out to be limited. About the euro The euro in conjunction with the dollar fell to monthly lows in the region of 1.1190. The main pair failed to consolidate at 1.12, which had been holding back its weakening since the beginning of June. The decline in yield in European debt markets puts pressure on the euro, while similar expectations regarding the dollar are already fully incorporated in the quotes. The eurozone is tensely waiting for two events - the results of the vote for the new British prime minister and the European Central Bank meeting on Thursday. The media actively exaggerates that the current head of the ECB, Mario Draghi, decides to make a resignation for the future, announcing the strengthening of economic-stimulating measures. This, of course, will not appeal to the euro. The breakdown of the level of 1.1194 became a signal for opening a short position on the main pair. If we talk about the long term, then, despite the strong expectations of traders about the growth of the dollar and the decline of the euro, things can go differently. Currency battles between titans such as the Fed, the ECB, the Bank of Japan, and the Bank of China are becoming more and more obvious. It is unlikely that the dollar will remain strong in conditions of a total reduction in interest rates. The material has been provided by InstaForex Company - www.instaforex.com |
| ECB may surprise the market and send the euro to new lows Posted: 23 Jul 2019 05:00 PM PDT After the regular speech of Federal Reserve President Jerome Powell in the Congress, the derivatives market began to believe in the soft position of the regulator so much that it started laying down the interest rate at the FOMC meeting in July by 0.5%. However, the latest statistical data on the United States stopped the weakening of the greenback that started on this background and somewhat restrained investors' expectations regarding the Fed's actions at the next meeting, which will be held on July 31. However, their belief in the reduction of the federal funds rate by 0.25% and the fact that the cycle of easing of the monetary policy of the US central bank will begin with this remains unshakable. However, the FOMC accompanying statement can still cool risk appetite. The US economy is still in good shape and does not require, in contrast to the European one, an increase in monetary incentives. This casts doubt on the feasibility of lowering the interest rate of the Fed at the moment. This step is likely to be political. In this case, the president of the White House, Donald Trump, who is increasing pressure on the Fed and even declaring him the no. 1 enemy of the US economy, will finally receive a strong trump card for conducting trade negotiations with China. It is possible that this will advance them and will become an additional positive factor for the markets. It is assumed that until the next Fed meeting, the USD index will remain sideways, and after it the greenback will not show significant weakening, but rather will even strengthen to the 98th mark. The medium-term trend for the weakening of the dollar will not start immediately, and only if the Fed confirmed its statements over the beginning of the cycle of interest rate reduction. Meanwhile, among investors, expectations of easing of monetary policy are intensifying not only on the part of the Fed, but also on the ECB. Looking at how industrial production is stalling, production orders are shrinking, inflation is not growing at the required pace in the region, the market is becoming increasingly convinced that the ECB's monetary expansion is only a matter of time. Already at the next meeting, which will be held this week, the regulator may hint about a decrease in the deposit rate from -0.4% to -0.5% in September and the resuscitation of the quantitative easing program (QE) in the amount of €2.6 trillion at the beginning 2020. According to a consensus forecast of experts recently surveyed by Bloomberg, asset purchases will be €40 billion per month. The possible easing of the ECB monetary rate is a negative for the euro, however, it is most likely already taken into account in the quotes. The absence of surprises from the regulator at the upcoming meeting may trigger the growth of the single European currency due to the implementation of the principle "sell on rumors, buy on facts". Can the ECB give the market more than it expects to keep EUR/USD from leaping up? "We do not think that the ECB has the capacity to ensure a stable and noticeable weakening of the euro, but we believe that the regulator may very well present an unpleasant surprise for the bulls," said the MUFG strategists. "The most painful reaction will be if the ECB reduces the rate on deposits in July not by 10, but immediately by 20 basis points. Such a decision would be justified if we take into account the weakness of the statistical data for the euro area and the need to apply active measures to get some visible effect. At the same time, a decline in EUR/USD in response to a cut in ECB rates is likely to be short-lived and limited, partly in view of the approaching date of the Fed meeting, which will take place on July 31," they added. The material has been provided by InstaForex Company - www.instaforex.com |
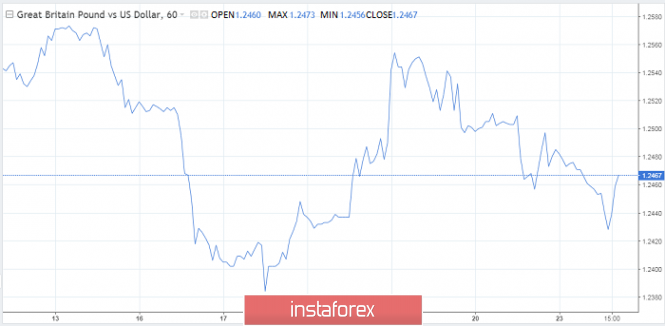
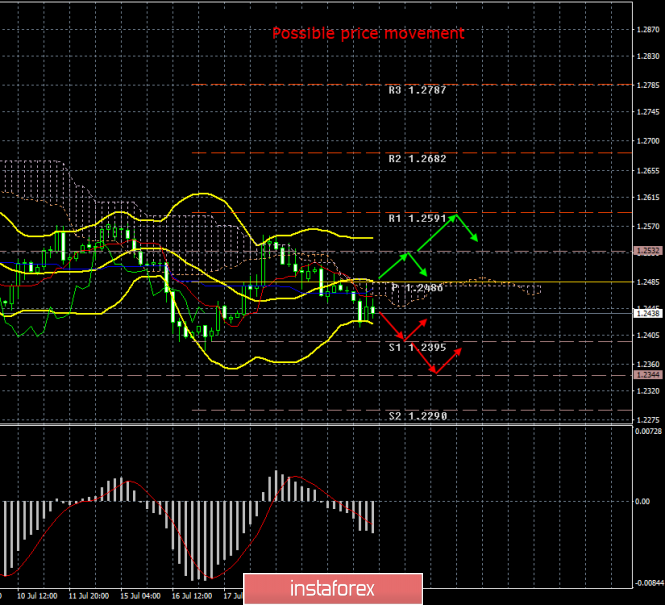
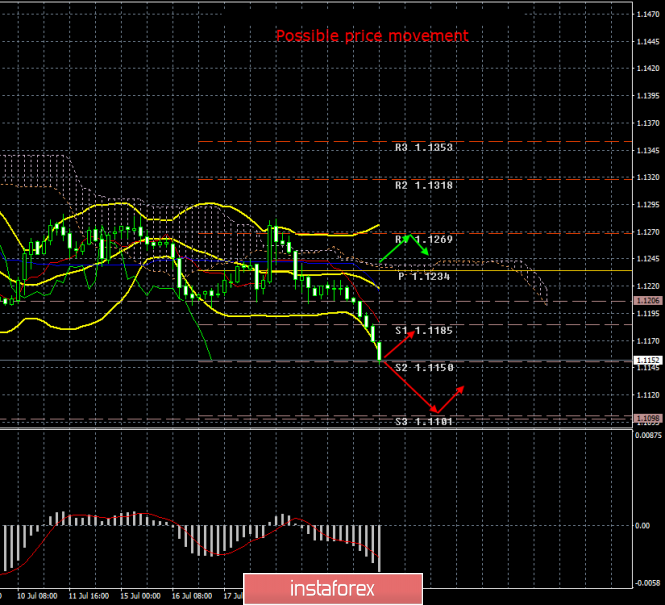
| Posted: 23 Jul 2019 04:29 PM PDT 4-hour timeframe The amplitude of the last 5 days (high-low): 125p - 75p - 134p - 80p - 58p. Average amplitude for the last 5 days: 94p (96p). The British pound sterling has not yet updated its previous local low, so it even has ghostly hopes for being able to strengthen. The main event of the day was the summing up of the election of the prime minister and the head of the Conservative Party of Great Britain. As it is easy to guess, the victory was won by Boris Johnson, the former mayor of London and the former foreign minister. However, traders did not react to this news in any way, logically assuming that it doesn't matter who won, what is important is what happens next with the country, Brexit, foreign economic policy, negotiations with the European Union, relations with the United States and the European Union. That is what really matters. In the near future, after the completion of all formalities, Johnson will take office and then begin to receive any news from the Cabinet of Ministers and Parliament. First of all, regarding the changes and dismissals among ministers and other officials. Some ministers had resigned before today, some said they would not work under the leadership of Johnson. After all the permutations among the ministers, re-election to Parliament is also possible, since the current composition is unlikely to accept the "hard" version of Brexit so hotly pushed by Johnson. Accordingly, the composition of the Parliament will have to be changed, but in this case there is a risk that the Conservative Party will not get the necessary number of votes in order to become ruling. In general, there is a risk for Boris Johnson in any case, because he already promised to withdraw the UK from the EU on time, that is, on October 31. Trading recommendations: The pound/dollar currency pair resumed the downward movement. Thus, sales of pound with targets at support levels of 1.2395 and 1.2344 are now relevant. It will be possible to buy the British currency after the pair is re-consolidated above the critical line, which will lead to a change of trend to growth. The first targets are resistance levels of 1.2532 and 1.2591. In addition to the technical picture should also take into account the fundamental data and the time of their release. Explanation of the illustration: Ichimoku indicator: Tenkan-sen - the red line. Kijun-sen - the blue line. Senkou Span A - light brown dotted line. Senkou Span B - light purple dotted line. Chikou Span - green line. Bollinger Bands indicator: 3 yellow lines. MACD Indicator: Red line and histogram with white bars in the indicator window. The material has been provided by InstaForex Company - www.instaforex.com |
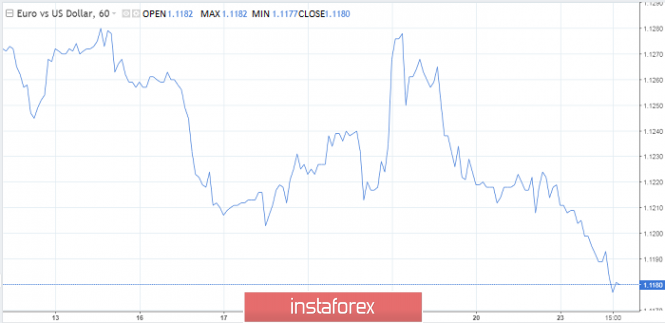
| EUR/USD. July 23rd. Results of the day. The euro continues to fall amid fears over the ECB's actions Posted: 23 Jul 2019 04:20 PM PDT 4-hour timeframe The amplitude of the last 5 days (high-low): 62p - 34p - 75p - 78p - 19p. Average amplitude for the last 5 days: 54p (56p). The second trading day for the EUR/USD pair was in a downward movement, although no macroeconomic statistics were published today. The euro/dollar pair immediately fell to the second support level of 1.1150 on July 23. Thus, it is around 50 points to the annual lows. Overcoming the low of May 23 will remove the psychological barrier from traders that keeps them from large and long-term sales at the lowest price. In general, overcoming the level 1.1107 could turn even greater losses for the euro currency. As for the reasons for the euro's fall today, they are obvious: the results of the ECB meeting will be announced on Thursday, and traders fear that during the debriefing the reduction of the key interest rate in September and the restart of the quantitative easing program will be announced immediate easing of monetary policy. Needless to say, any "dovish" rhetoric by Mario Draghi or easing of monetary policy by the regulator is a negative factor for the currency, and a very strong one. Sometimes the foreign exchange market ignores such moments, but it happens infrequently. Now bears feel that the euro can be sold, since the Fed meeting, which can also announced a reduction on the key rate (immediate or scheduled), will be next week. One way or another, the euro will have chances for growth, and chances are not bad, but not this week. Trading recommendations: The EUR/USD pair resumed its downward movement. Thus, it is again recommended to sell the euro currency with targets at levels of 1.1150 and 1.1101 before the MACD indicator reverses to the top. We recommend buying the euro/dollar pair not earlier than consolidating the price above the Kijun-sen line with the first target resistance level of 1.1269, but with minimal lots, since the bulls remain extremely weak. In addition to the technical picture should also take into account the fundamental data and the time of their release. Explanation of the illustration: Ichimoku indicator: Tenkan-sen - the red line. Kijun-sen - the blue line. Senkou Span A - light brown dotted line. Senkou Span B - light purple dotted line. Chikou Span - green line. Bollinger Bands indicator: 3 yellow lines. MACD Indicator: Red line and histogram with white bars in the indicator window. The material has been provided by InstaForex Company - www.instaforex.com |
| Posted: 23 Jul 2019 04:03 PM PDT The British pound was slightly turbulent after it became known that Boris Johnson became the leader of the British Conservative Party and defeated Foreign Secretary Jeremy Hunt in the race for the post of British prime minister. Tomorrow he will go to Downing Street and replace Teresa May. Given that such a scenario was very obvious and no one doubted his victory, the GBPUSD pair did not undergo significant changes. After a slight rise, traders began to sell the pound again, as they fear unexpected actions from the new leader of the Conservative Party. All Johnson managed to say after appearing in the media was that it was necessary to reconcile the desire for self-government and the desire for close ties with the EU. He did not say any other details regarding the policy, as well as about Brexit. All he said was, "We know we're going to do this." Most likely, more specific signals on how the political struggle within the Parliament will develop will be received tomorrow after the official assumption of the prime minister post and the first statement. Then Boris Johnson will begin to form his office. As for the scenarios, which will follow the further development of the situation with Brexit, they are quite different, but everything has a place in life. The first and the most problematic – Brexit without any agreement with the European Union – which will hit the economy and lead to serious economic and pathetic problems. The second option is the most unlikely, which is to hold early general elections, and the third is the extension of the deadline for the UK to leave the EU. All three scenarios imply the development of a full-scale political crisis in the UK, as there is still quite a lot of time to fight in Parliament with the new prime minister. Let me remind you that the official release date of the UK from the EU is October 31. As for the technical picture of the British pound, it will remain unchanged until tomorrow, when Johnson's first performance will take place. Most likely, the pressure on the pound will continue to persist, and sellers will strive for the lows around 1.2380 and for their renewal, which will resume the medium-term bearish trend and lead to annual lows of 1.2270 and 1.2160. If Johnson is soft enough in his first statements, then the upward correction that many traders are waiting for is not excluded. Demolition of stop orders above the resistance of 1.2500 and 1.2600 can set a good upward impulse for the pair. EURUSD The euro continues to fly down for a number of reasons, which have been mentioned quite a lot lately. Whoever does not know, then, most likely, the European Central Bank will announce fundamental changes in monetary policy on Thursday, and these changes are not good for the euro. Today, another report was added by the International Monetary Fund report, in which it lowered its forecast for global GDP growth in 2019, pointing to a slowdown in international trade against the background of continuing tension in US-Chinese trade. The IMF predicts global GDP growth at 3.2% in 2019, against 3.3%, which was indicated in the forecast for April. As for the growth of international trade, it will shrink and show an increase of only 2.5% in 2019, compared with the forecast of 3.4% in April. From a technical point of view, the euro has big problems, as a breakthrough of such large levels as 1.1200 and 1.1160 will not bring anything good for risky assets in the future. The goal until Thursday are local lows in the 1.1120 and 1.1040 area. The material has been provided by InstaForex Company - www.instaforex.com |
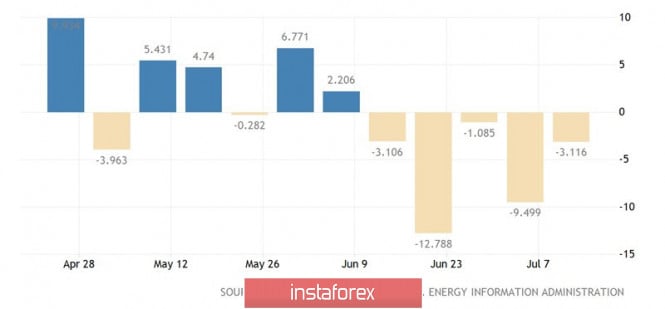
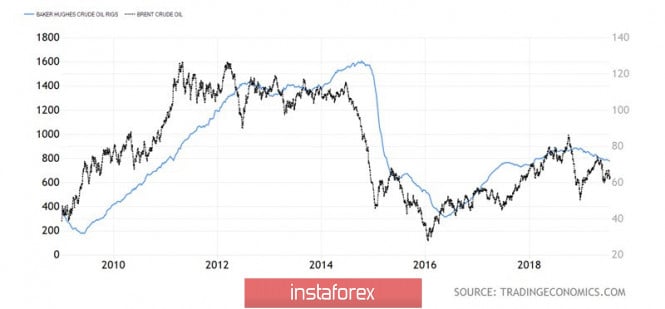
| Brent under the hood at the White House Posted: 23 Jul 2019 03:51 PM PDT While investors continue to digest information about Iran's seizure of a British tanker in the Strait of Hormuz, North Sea oil has stabilized near $62-63 per barrel. According to Commerzbank, the premium for the risk of vessels passing through the strait is significantly lower than it should have been, which indicates the underestimation of Brent. UBS, on the contrary, notes that, despite all the incidents in the Middle East, no significant supply disruption occurred. The supply is stable, the demand due to trade tensions between the US and China risks decreasing, which makes the black gold market situation moderately bearish. Even with the serious collapse of the levels of the April highs, Brent has grown by 17% since the beginning of the year. At the same time, the statement by the IEA that, despite the agreement of OPEC and other producing countries, there is a surplus in the oil market, limits the desire of the bulls to attack. The slowdown in global demand due to trade wars and the growth of US production are considered as well-working trump cards of the "bears". Tensions in the Middle East should be on the side of their opponents. The Strait of Hormuz carries one third of the world's oil by sea and approximately one fifth of all global supplies. Iran has repeatedly threatened to block it, which could potentially hurt the proposal. However, as long as threats do not go further. In addition, Donald Trump said that Tehran is ready for negotiations, which somewhat reassured investors. At least, the oil's response to a smaller reduction in US reserves in the week to July 12, than what was predicted by Bloomberg experts, turned out to be more turbulent than the news of Iran's seizure of a British tanker. Dynamics of American oil reserves It is not difficult to understand the reasons why the White House is calm. According to research by the US Energy Information Administration, three-quarters of the oil and condensate that passed through the Strait of Hormuz in 2018 went to China, Japan, India, South Korea and Singapore. Let these countries take care of their safety. As it turned out, the market can be reassured by a statement about Iran's readiness to negotiate. At the same time, threats about the expansion of the US military contingent in the region trigger "bulls" to attack. Donald Trump has repeatedly stated his desire to see low oil prices, so he prefers not to heighten the situation. One gets the feeling that the black gold market is under the cover of Washington. Even the fact that the number of Baker Hughes drilling rigs continues to fall indicates that US manufacturers are quite satisfied with current prices. They hedged the risks of reducing the cost of oil with the help of futures contracts and can now safely increase production. Dynamics of drilling rigs and oil prices Technically, Brent quotes outside the triangle may clarify the medium-term prospects of the North Sea variety. In particular, a breakthrough of support at $61.35 per barrel will raise the risks of activating the AB = CD pattern with a target of 161.8%. It corresponds to $54.2. The material has been provided by InstaForex Company - www.instaforex.com |
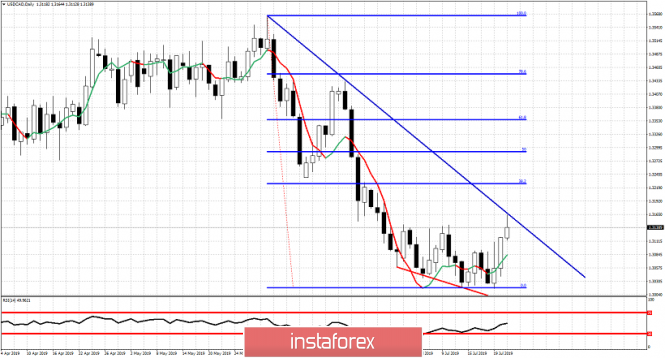
| USDCAD bounces as expected targeting 1.32 Posted: 23 Jul 2019 08:28 AM PDT USDCAD has started a move higher above 1.31 after bottoming around 1.30 when we noted the bullish divergence signs. USDCAD has the potential to move higher in order to retrace at least 38% of the downward move from 1.3565.
Blue line - resistance USDCAD is bouncing towards the downward sloping resistance trend line. I expect this trend line to be broken and price to reach at least the 38% Fibonacci retracement level. USDCAD is showing short-term bullish reversal signs and a good risk reward opportunity favoring bulls is seen here. Support and stop level for bulls is 1.3015 and target is at 1.3230 and higher. Any pull back is considered buying opportunity for the short-term. The material has been provided by InstaForex Company - www.instaforex.com |
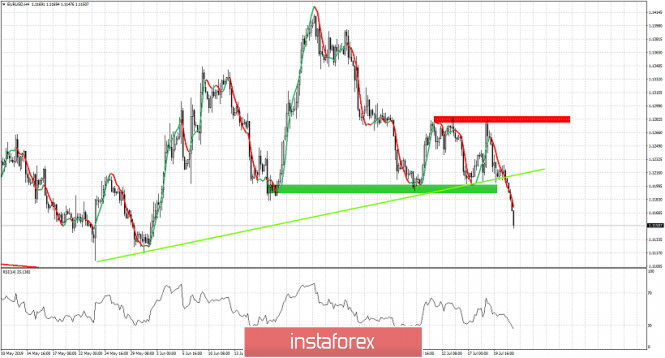
| EURUSD breaks support and provides new sell signal Posted: 23 Jul 2019 08:22 AM PDT EURUSD has broken through 1.12 and is already 50 pips lower. Trend remains bearish. As we mentioned in previous post there would not be a fourth bounce from 1.12. A break below it would be for real the next time. And here we are. EURUSD is in bearish trend looking for a move towards 1.11 again where the 2019 lows are found.
Green rectangle - support Green line - trend line support EURUSD has broken through support and is accelerating lower. Any bounce is considered a selling opportunity as long as price is below 1.1280. Trend is bearish. Target is 1.11-1.1050 over the coming days. We could see a back test of 1.12 but we will also most probably see a rejection. Current price action suggests that the entire move from 1.11 to 1.1412 was just a bounce in the bigger down trend. Taking into consideration the long-term bullish divergence, I would expect a new marginal lower low between 1.11-1.1050 and then a reversal to the upside. The material has been provided by InstaForex Company - www.instaforex.com |
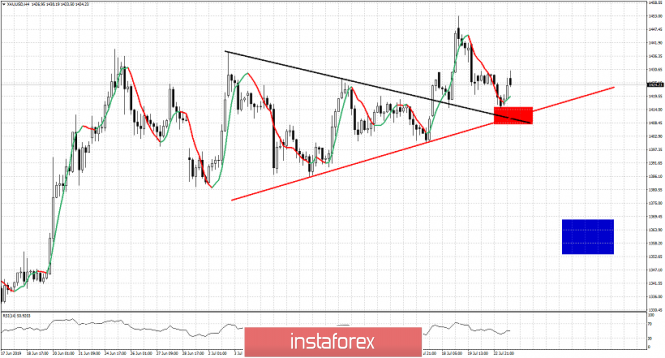
| Gold price remains vulnerable due to Dollar strength but holds above key support Posted: 23 Jul 2019 08:17 AM PDT Gold price has broken the bearish flag formation we showed yesterday and has given a new bearish signal. Gold price is vulnerable to a move towards $1,400 and lower. Gold bulls remain in control of short-term trend as long as price holds $1,400.
Black line - short-term resistance (broken) Red line - short-term support Red rectangle - key support short-term area Blue rectangle -target if support fails to hold Gold price is challenging the red rectangle area and the red upward sloping trend line. Breaking below this trend line will open the way for a move towards $1,350-60. Gold price is vulnerable to the downside. Resistance is at $1,430 for the short-term. Recapturing this level will increase the chances for a new higher high. So far Gold price since the beginning of July is making higher highs and higher lows. This confirms bulls are in control. This will change only with the break of the red trend line. So traders should keep a close eye on the $1,400-$1,415 area. The material has been provided by InstaForex Company - www.instaforex.com |
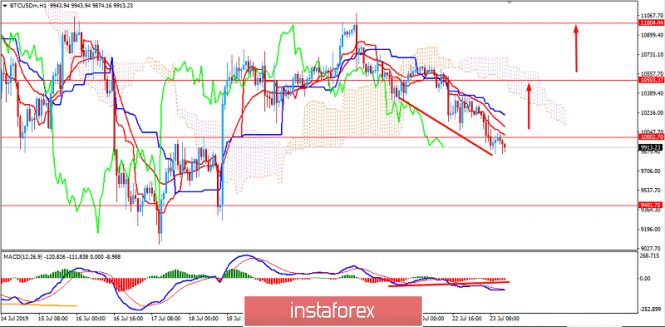
| Analysis of BITCOIN for July 23, 2019 Posted: 23 Jul 2019 07:42 AM PDT Bitcoin has been struggling at near $10,500 recently. After a nosedive, the price maintains impulsive bearish non-volatile momentum trading below $10,000. US President Trump has again targeted the Federal Reserve for dragging its feet on interest rate cuts. Moreover, Donald Trump recently declared himself as being generally opposed to Bitcoin and cryptocurrencies. Trump's economic policies have drawn considerable attention from the Bitcoin and wider crypto asset industry. Since Bitcoin represents an asset free from the meddling of politicians, policies that result in a less powerful dollar in the world are frequently met with scorn from those in favor of the Fintech innovation. The fallout from last week's US senate hearings on Facebook's Libra project is still sending waves across the crypto market. Many analysts are blaming the social media giant for Bitcoin's recent correction. In fact, it is just evidence a new market cycle. Following a week of consolidation, Bitcoin sank below $10,000 today. It is the third dip into four figures since the cryptocurrency hit its 2019 high of $13,800 in late June. The previous two times have seen lower lows, so Bitcoin is likely to fall to $9,000 or below in this correction. Bitcoin dipped to $9,870 a couple of hours ago that has resulted in a 5 percent slide on the day and another thousand dollars decline from its weekend high of $11,000. As the price remains below $10,000, there are not many chances to climb again any time soon. TECHNICAL OVERVIEW: The price is currently residing at the edge of $10,000 which is held by the dynamic levels as resistance. After the price broke below $10,500, the overall sentiment turned bearish which lead the price below the psychological level of $10,000. However, with Bullish Divergence in progress, it is still expected to climb higher. The only confirmation will be breaking above $10,000 with a daily close. The price managed to rebound after a recent dip towards $9,000. So, as the price remains above $9,000 with a daily close, the bullish bias is expected to be intact. TECHNICAL LEVELS: SUPPORT: 9,000, 9,500, 9,800 RESISTANCE: 10,000, 10,500, 11,000, 11,500 CURRENT BIAS: Bearish MOMENTUM: Volatile
|
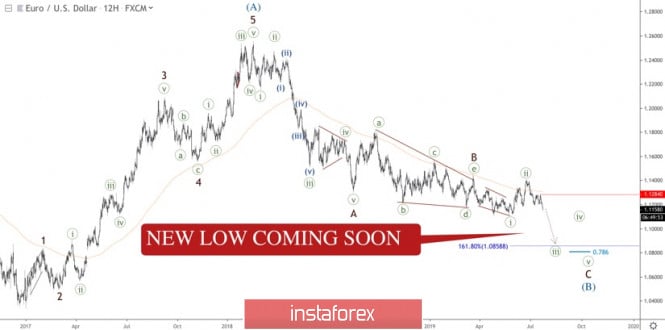
| New low in EUR/USD is coming soon Posted: 23 Jul 2019 07:13 AM PDT
The 150-period Moving Average has acted as resistance once again, so the second wave of wave C has been completed. Previously, we saw a triangle in wave B and a leading diagonal pattern, which supposed to be wave ((i)). Thus, the current decline is likely to be wave ((iii)) of C, which means the low of wave ((i)) at 1.1064 is going to be broken soon. Broadly, wave (A) finished as an upward impulse and wave (B) is taking the form of a zigzag pattern. That's why we should watch the 0.786 retracement level of wave (A) at 1.0805 as a potential target for the developing correction. The subsequent pullback from this level could be a starting point for another rally. The main critical level for this scenario is the last local high at 1.1284. If the price goes through this level before the low of wave ((i)) at 1.1064, the bearish outlook will be overclouded. For a target for wave ((iii)), we should monitor the 1.618 multiple of wave ((i)) at 1.0858, which could be a starting point of the fourth wave. The bottom line is that EUR/USD remains bearish, and there's no any bullish sign so far. The developing third wave is going to continue, so the price is about to make a new low. The material has been provided by InstaForex Company - www.instaforex.com |
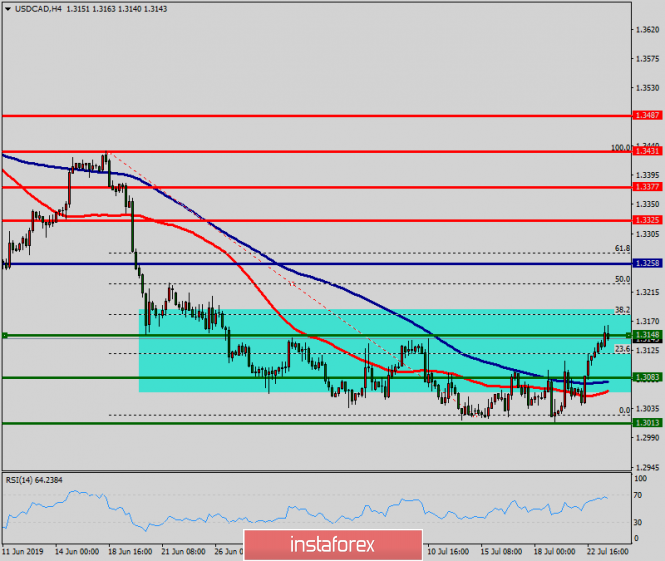
| Technical analysis of USD/CAD for July 23, 2019 Posted: 23 Jul 2019 07:07 AM PDT The USD/CAD pair continues to move downwards from the level of 1.3258. This week, the pair dropped from the level of 1.3258 (this level of 0.9965 coincides with the double top) to the bottom around 1.3148. Today, the first resistance level is seen at 1.3258 followed by 1.3325, while daily support 1 is found at 1.3148. Also, the level of 1.3258 represents a weekly pivot point for that it is acting as major resistance/support this week. Amid the previous events, the pair is still in a downtrend, because the USD/CAD pair is trading in a bearish trend from the new resistance line of 1.3258 towards the first support level at 1.3038 in order to test it. If the pair succeeds to pass through the level of 1.3038, the market will indicate a bearish opportunity below the level of 1.3038 in order to continue towards the point of 1.3013. However, if a breakout happens at the resistance level of 1.3325, then this scenario may be invalidated. The material has been provided by InstaForex Company - www.instaforex.com |
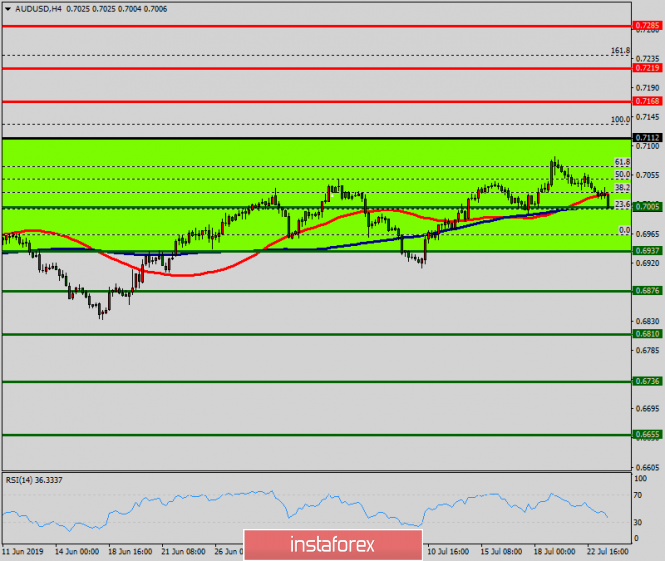
| Technical analysis of AUD/USD for July 23, 2019 Posted: 23 Jul 2019 07:03 AM PDT The AUD/USD pair is set above strong support at the levels of 0.6876 and 0.6810. This support has been rejected four times confirming the uptrend. The major support is seen at the level of 0.6810, because the trend is still showing strength above it. Accordingly, the pair is still in the uptrend in the area of 0.6810 and 0.6876. The AUD/USD pair is trading in the bullish trend from the last support line of 0.6876 towards thae first resistance level of 0.6937 in order to test it. This is confirmed by the RSI indicator signaling that we are still in the bullish trending market. Now, the pair is likely to begin an ascending movement to the point of 0.6937 and further to the level of 0.7005. The level of 0.7005 will act as the major resistance and the double top is already set at the point of 0.7005. At the same time, if there is a breakout at the support level 0.6810, this scenario may be invalidated. The material has been provided by InstaForex Company - www.instaforex.com |
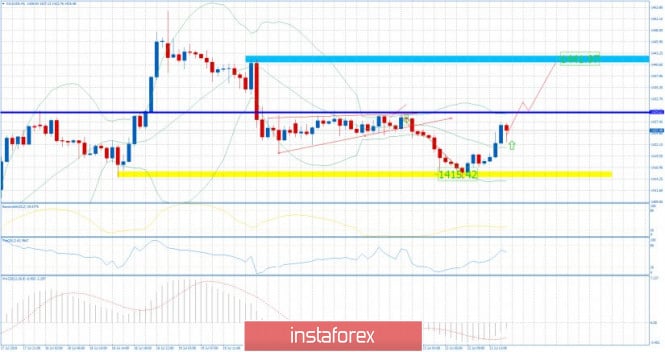
| Gold 07.23.2019 - Important pivot at the price of $1.429 Posted: 23 Jul 2019 06:49 AM PDT Gold did exactly what I expected yesterday. Gold reached my yesterday's down target at $1.415 and it rejected strongly. The resistance at $1.429 would be critical for further upside movement. Trading recommendation:
Yellow rectangle – $1.415 Support Blue horizontal line – $1.429 important resistance pivot Blue rectangle – Resistance $1.441 MACD oscillator is showing decreasing in the down power and the slow MACD line did turn from bearish to bullish, which is sign for the further upside movement. Pay attention to the level of $1.429 cause it is very important pivot-resistance. In case of the up break, there is potential for Gold going towards $1.441. If Gold doesn't break the resistance, re-test of the $1.415 would be possible. The material has been provided by InstaForex Company - www.instaforex.com |
| Fractal analysis of major currency pairs on July 23 Posted: 23 Jul 2019 06:48 AM PDT Hello, dear colleagues. For the Euro/Dollar pair, we follow the development of the downward structure from July 18 and we expect the continuation of the downward movement after the passage of the price of the range of 1.1160 – 1.1149. For the Pound/Dollar pair, the level of 1.2420 is the key support for the upward structure of July 17. For the Dollar/Franc pair, the development of the downward structure from July 17 is expected after the breakdown of 0.9779 and the level of 0.9858 is the key support. For the Dollar/Yen pair, we follow the development of the upward structure from July 18. For the Euro/Yen pair, we expect to reach the level of 120.62. For the Pound/Yen pair, the upward structure development from July 18 is expected after the breakdown of 135.04 and the level of 134.38 is the key support. Forecast for July 23: Analytical review of the currency pairs in H1 scale:
For the Euro/Dollar pair, the key levels on the H1 scale are: 1.1212, 1.1192, 1.1178, 1.1160, 1.1149, and 1.129 1.1100. We identified the subsequent targets for the downward movement from the local structure on July 18. The continuation of the downward movement is expected after the price passage of the range of 1.1160 – 1.1149. In this case, the goal is 1.1129 and near this level is the consolidation. We consider the level of 1.1100 as a potential value for the bottom, upon reaching which, we expect a rollback to the top. The short-term upward movement is possible in the area of 1.1178 – 1.1192 and the breakdown of the last value will lead to a protracted correction. The goal is 1.1212 and near this level is the consolidation. The main trend is the local downward structure of July 18. Trading recommendations: Buy 1.1178 Take profit: 1.1190 Buy 1.1194 Take profit: 1.1212 Sell: 1.1149 Take profit: 1.1130 Sell: 1.1127 Take profit: 1.1100
For the Pound/Dollar pair, the key levels on the H1 scale are: 1.2623, 1.2598, 1.2568, 1.2522, 1.2492, 1.2486, and 1.2420 1.2379. The price is close to the cancellation of the upward structure from July 17, which requires a breakdown of the level of 1.2420. In this case, the first potential target is 1.2379. The short-term upward movement is expected in the area of 1.2468 – 1.2492 and the breakdown of the last value will have to form a local structure for the top. The goal is 1.2522 and this level is the key resistance for the upward trend. Its breakdown should be accompanied by a pronounced upward movement to the potential goal – 1.2568. The main trend is the formation of the upward structure from July 17, the stage of deep correction. Trading recommendations: Buy: 1.2468 Take profit: 1.2490 Buy: 1.2493 Take profit: 1.2522 Sell: 1.2420 Take profit: 1.2380 Sell: Take profit:
For the Dollar/Franc pair, the key levels in the H1 scale are: 0.9902, 0.9881, 0.9858, 0.9841, 0.9798, 0.9779, and 0.9745 0.9731. We continue to monitor the formation of the downward structure of July 17. The short-term downward movement is expected in the area of 0.9798 – 0.9779 and the breakdown of the last value should be accompanied by a pronounced downward movement. The goal is 0.9745. The potential value for the bottom is the level 0.9731, upon reaching which we expect consolidation, as well as a rollback to the top. The short-term upward movement is possible in the area of 0.9841 – 0.9858 and the breakdown of the last value will lead to an in-depth correction. The goal is 0.9881 and this level is the key support for the downward structure. The main trend is the local downward structure of July 17. Trading recommendations: Buy: 0.9841 Take profit: 0.9856 Buy: 0.9860 Take profit: 0.9880 Sell: 0.9798 Take profit: 0.9780 Sell: 0.9776 Take profit: 0.9747
For the Dollar/Yen pair, the key levels in the H1 scale are: 108.94, 108.72, 108.39, 108.26, 107.97, and 107.83 107.58. We follow the development of the upward structure from July 18. We expect the movement to continue to the top after the price passes the range of 108.26 – 108.39. In this case, the target is 108.72. We consider the level of 108.94 as a potential value for the top, upon reaching which, we expect consolidation, as well as a rollback to the bottom. The short-term downward movement is possible in the area of 107.97 – 107.83 and the breakdown of the last value will lead to a protracted correction. The goal is 107.60 and this level is the key support for the upward structure. The main trend: the upward structure of July 18. Trading recommendations: Buy: 108.40 Take profit: 108.70 Buy: 108.73 Take profit: 108.94 Sell: 107.96 Take profit: 107.84 Sell: 107.81 Take profit: 107.60
For the Canadian dollar/Dollar pair, the key levels on the H1 scale are: 1.3256, 1.3236, 1.3201, 1.3178, 1.3163, 1.3130, 1.3112 and 1.3085. We follow the upward structure from July 19. We expect the movement to continue to the top after the price passes the range of 1.3163 – 1.3178. In this case, the target is 1.3201 and near this level is the consolidation. The breakdown of the level of 1.3201 will lead to significant motion. The target – 1.3236. We consider the level of 1.3256 as a potential value for the top, upon reaching which, we expect a rollback to the bottom. The short-term downward movement is possible in the area of 1.3130 – 1.3112 and the breakdown of the last value will lead to a protracted correction. The goal is 1.3085 and this level is the key support for the top. The main trend is the upward structure of July 19. Trading recommendations: Buy: 1.3178 Take profit: 1.3200 Buy: 1.3203 Take profit: 1.3234 Sell: 1.3130 Take profit: 1.3112 Sell: 1.3110 Take profit: 1.3085
For the Australian dollar/Dollar pair, the key levels on the H1 scale are: 0.7145, 0.7111, 0.7101, 0.7085, 0.7066, 0.7050, 0.7015, and 0.6995 0.6977. We expect the cancellation of the upward structure development from July 17 after the breakdown of 0.7015. In this case, the first goal is 0.6995. We consider the level of 0. 0.6977 as a potential value for the bottom, near which consolidation is expected. The short-term upward movement is possible in the range of 0.7050 – 0.7066 and the breakdown of the last value will lead to the development of the upward structure from July 17. The first target is 0.7085. The main trend is the local structure for the top of July 17, the stage of deep correction. Trading recommendations: Buy: 0.7050 Take profit: 0.7064 Buy: 0.7067 Take profit: 0.7085 Sell: 0.7013 Take profit: 0.6995 Sell: 0.6993 Take profit: 0.6978
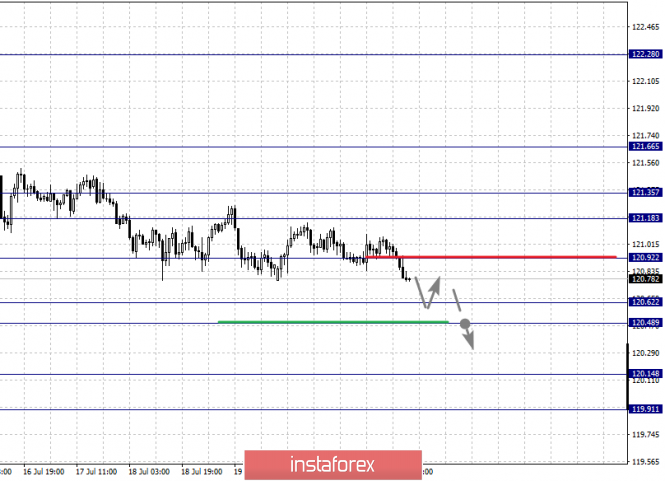
For the Euro/Yen pair, the key levels on the H1 scale are: 121.66, 121.35, 121.18, 120.92, 120.62, 120.48, and 120.14 119.91. We expect to reach the level of 120.62 and in the area of 120.62 – 120.48 is the price consolidation. The breakdown of the level of 120.46 should be accompanied by a pronounced downward movement. The goal is 120.14. We consider the level of 119.91 as a potential value for the bottom, upon reaching which, we expect a rollback to the top. The short-term upward movement is possible in the area of 121.18 – 121.35 and the breakdown of the last value will lead to a protracted correction. The goal is 121.66 and this level is the key support for the downward structure. The main trend is the downward structure of July 10. Trading recommendations: Buy: 121.18 Take profit: 121.33 Buy: 121.37 Take profit: 121.66 Sell: 120.90 Take profit: 120.62 Sell: 120.46 Take profit: 120.14
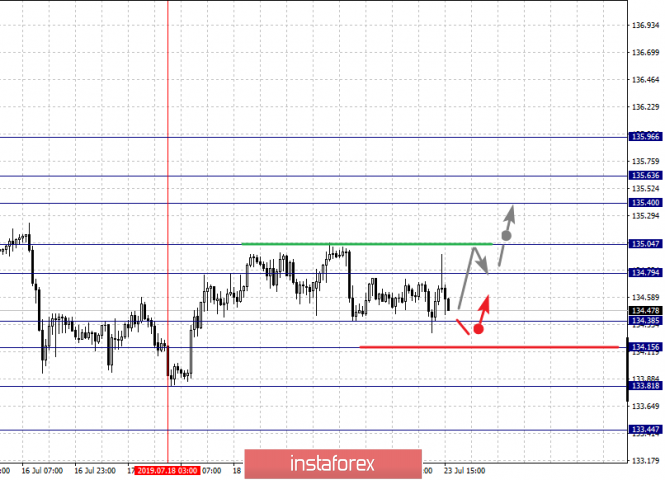
For the Pound/Yen pair, the key levels on the H1 scale are: 135.96, 135.63, 135.40, 135.04, 134.79, 134.38, 134.15, and 133.81 133.44. The price forms the expressed initial conditions for the top of July 18. The short-term upward movement is expected in the area of 134.79 – 135.04 and the breakdown of the last value should be accompanied by a pronounced upward movement. The goal is 135.40 and in the area of 135.40 – 135.63 is the short-term upward movement, as well as consolidation. We consider the level of 135.96 as a potential value for the top, upon reaching which, we expect consolidation, as well as a rollback to the bottom. The short-term downward movement is possible in the range of 134.38 – 134.15 and the breakdown of the last value will have to develop a downward trend. The goal is 133.81. We consider the level of 133.44 as a potential value for the bottom. The main trend is the downward cycle of July 9, the formation of the potential for the top of July 18. Trading recommendations: Buy: 135.06 Take profit: 135.40 Buy: 135.42 Take profit: 135.62 Sell: 134.38 Take profit: 134.17 Sell: 134.12 Take profit: 133.81 The material has been provided by InstaForex Company - www.instaforex.com |
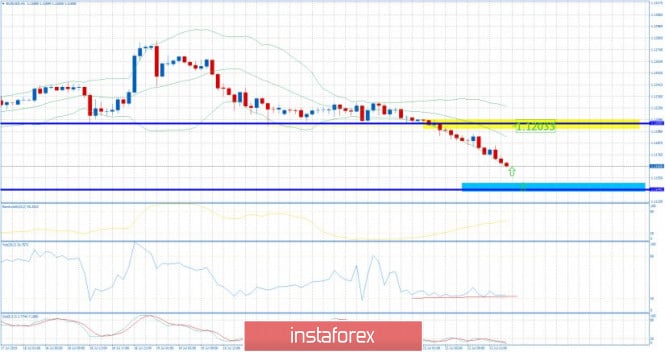
| EUR/USD for July 23,2019 -Buying divergence on oscillators Posted: 23 Jul 2019 06:22 AM PDT EUR did trade lower at the price of 1.1166 in past 15 hours during the Asia session and Europe, which is sign that there is the further risk that EUR can trade on US session downward. I do expect some kind of rotation upward during the US session. My advice is to watch for potential buying opportunities. Trading recommendation:
Yellow rectangle – 1.120 Resistance Blue rectangle – 1.1144 Support On the hourly time-frame I found that EUR found that there is still downside momentum and selling pressure. But there is the bullish divergence on the %B oscillator and stochastic oscillator, which is sign that there might be rotation up. As long as the EUR is trading above the 1.1100, I would watch for upward movements. The material has been provided by InstaForex Company - www.instaforex.com |
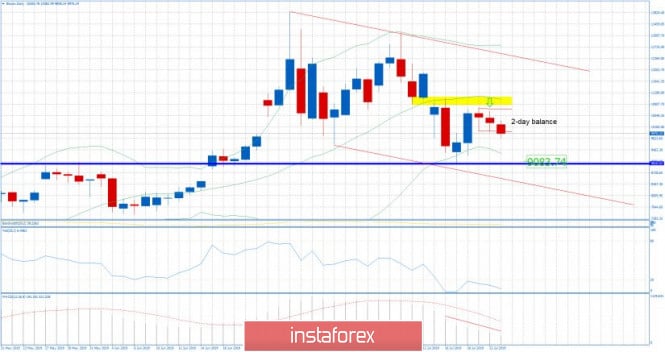
| BTC 07.23.2019 - Down brerakout of 2-day balance Posted: 23 Jul 2019 06:01 AM PDT Industry news: A U.K. financial watchdog is being impersonated in an email promoting a cryptocurrency scam. Purporting to be sent from British regulator, the Financial Conduct Authority, the email touts a "guaranteed chance to earn" via cryptocurrency, FT Advisor reports Tuesday. The message is dressed up with FCA and Bank of England logos, and sports a photo of physical cryptocurrencies – bitcoin, litecoin and XRP – over the British Union Jack flag. Trading recommendation:
BTC did exactly what I expected yesterday. Sellers did join from the important resistance at $10.800. According to daily time-frame, there is the down break of the 2day balance, which is sign that sellers are in control. You should still watch for selling opportunities on the rallies. Yellow rectangle – Key Resistance ($11.000) Blue horizontal line- Support 1 ($9.083) MACD oscillator is still showing the decreasing momentum and BTC which confirms my bearish view. Additionally, MACD oscillator is also showing that slow line did turn from bullish into bearish, which is another good confirmation for further downside. Bollinger % oscillator did show new momentum down few days ago, which is indication and BTC my at least try to re*visit the low at $9.083.BTC is trading inside of the downward channel (red lines), which is another confirmation of the downside pressure. Watch for selling opportunities with the first target at $9.083 as long as the BTC is trading below the $11.000. The material has been provided by InstaForex Company - www.instaforex.com |
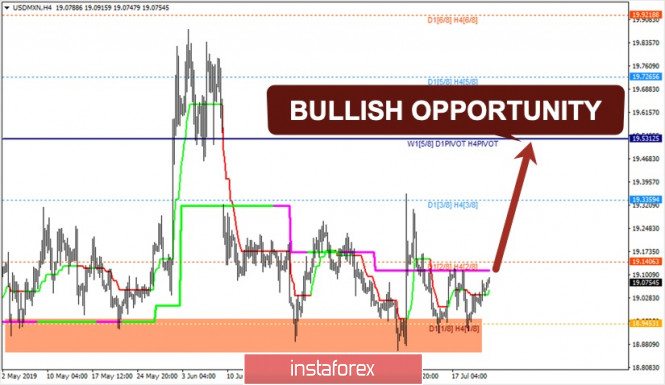
| Murray Math: bullish moment on Mexican peso Posted: 23 Jul 2019 05:39 AM PDT
The Mexican peso is getting bullish. As you can see on the 4H chart, there's pretty strong support by the 1/8 Murrey Math Level (18.9453), which becomes such a big barrier for bears. The market hasn't been fixating above this level since May, so there're seven pullbacks from it in a row. Thus, we would rather foresee a rally towards the 4/8 Murrey Math Level (19.5312), which has been confirmed by higher timeframes. For now, the price has locked between two SuperTrend indicator's Lines (from 4H and Daily charts). The bullish cross of these lines will confirm the outlook. Besides, we should watch 2/8 Murrey Math Line (19.1406), which is acting as resistance. If the pair breaks and fixates above this line, there'll be more evidence that the rally is underway. Meanwhile, if the market remains under the Super Trend Lines, the bullish outlook will be under pressure because of a risk to have just another test of 1/8 MM Line. The bottom line is that the Mexican peso has a significant bullish opportunity to reach 4/8 or even 5/8 MM Line. However, we should wait for confirmation of this scenario as a break-out of 2/8 MM level and a bullish cross of Super Trend Lines. The material has been provided by InstaForex Company - www.instaforex.com |
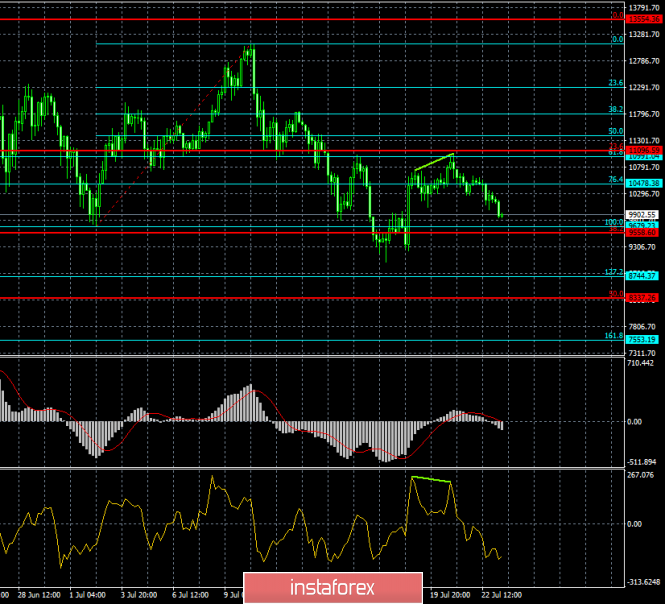
| Forecast for Bitcoin on July 23rd. Bitcoin continues to fall after statements by Steven Mnuchin Posted: 23 Jul 2019 05:09 AM PDT Bitcoin – 4H.
As seen on the 4-hour chart, bitcoin performed a turn down after rebounding from the correction level of 61.8% ($10991) and continues the process of falling in the direction of the Fibo level of 100.0% ($9679). It is logical to assume that the fall continues after the speech of the US Treasury Secretary Steven Mnuchin that bitcoin is used for criminal purposes - for money laundering, for the financing of terrorism, as well as for other illegal operations. Also, information has repeatedly surfaced that America can begin serious control over the cryptocurrency segment, up to the complete ban of bitcoin and other cryptocurrencies (Donald Trump's initiative). Trump is not a fan of cryptocurrencies, does not consider them money and focuses on their insecurity with nothing. As we all know, jokes with Donald Trump are definitely bad. It has been repeatedly checked on themselves by entire states that refused to play according to Trump's rules and immediately fell under sanctions, trade duties were introduced against them. Thus, the cryptocurrency market is still in the shadows and does not create global problems, causing only censure and angry statements from the top officials not only of the US but also of other States. This is what restrains the growth of "cue ball" to numbers like $20,000. The rebound of quotations from the correction level of 100.0% will allow traders to count on a turn-up and some growth in the direction of the correction level of 76.4% ($10478). Closing the rate under the Fibo level of 38.2% ($9558) on the red grid of Fibo will increase the likelihood of a further fall. The Fibo grid is based on the extremes of July 2, 2019, and July 10, 2019. Forecast for Bitcoin and trading recommendations: Bitcoin performed consolidation under the correction level of 76.4% ($10470). Thus, I recommend selling the cryptocurrency with the target of $9679, with the stop-loss order above the level of 76.4%. I recommend buying Bitcoin with a target of $10478, and with a stop-loss order under the level of $ 9679 if it will be rebounded from a correction level of 100.0%. The material has been provided by InstaForex Company - www.instaforex.com |
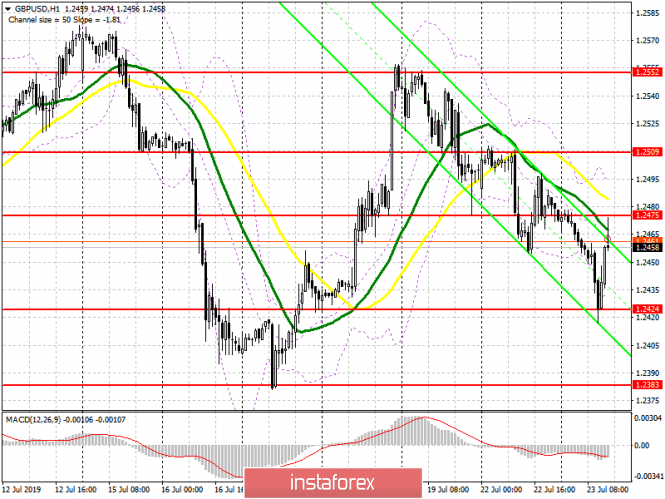
| Posted: 23 Jul 2019 05:02 AM PDT To open long positions on GBP/USD, you need: The news that Boris Johnson has become the new Prime Minister of the UK, is expected to support the British pound, which I drew attention to in my morning review. However, it is problematic to count on a larger upward movement in the pair. To do this, the bulls should try to consolidate above the resistance of 1.2475, which will lead to the demolition of a number of stop orders of sellers and to the update of a larger local maximum in the area of 1.2509, where I recommend taking the profit. In the scenario of the pound decline, and the volatility will remain quite high today, as any statements of the new Prime Minister will be perceived with particular importance, it is best to look at long positions on the support test of 1.2424 or on the rebound from a larger minimum of 1.2383. To open short positions on GBP/USD, you need: Bears will try to keep the pound below the resistance of 1.2475, and the formation of a false breakout at this level will be the first signal for the opening of short positions in the pair. Of particular importance will be the speech of the new Prime Minister of the UK, and in the case of sharp statements on the topic of Brexit, traders can again begin to quickly get rid of long positions. In this scenario, support will be provided by the level of 1.2424, but the main bearish target will be at least a month in the area of 1.2383 and its update in the area of 1.2342, where I recommend taking the profit. In case of further growth of GBP/USD, it is best to look at short positions from the maximum of 1.2509 or a rebound from a larger level of 1.2552. Indicator signals: Moving Averages Trading is below 30 and 50 moving averages, which keeps the bearish momentum. Bollinger Bands With the growth of the pound in the second half of the day, the upper limit of the indicator in the area of 1.2505 will act as a resistance.
Description of indicators
|
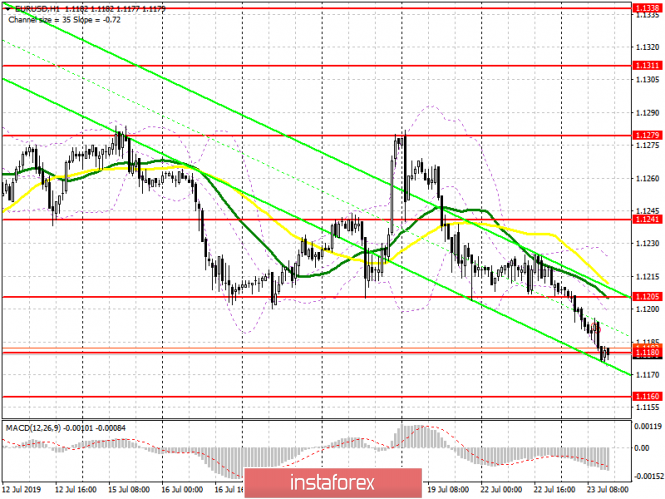
| Posted: 23 Jul 2019 04:57 AM PDT To open long positions on EURUSD, you need: Euro buyers are in no hurry to return to the market and are unlikely to do so seriously before the meeting of the European Central Bank, which is scheduled for this Thursday. We see how in the support area of 1.1180, which I paid attention to the morning. There was a slowdown in the downward trend but the appearance of bulls is not even out of the question. At the moment, it is best to consider new long positions after the next "twenty-point" jump down in the support area of 1.1160 or buy the euro immediately on the rebound from the low of 1.138. You can also use good (if any) data on consumer confidence in the eurozone, which will be released in the afternoon, and which can contribute to the return of EUR/USD to the resistance area of 1.1205, where I recommend taking the profit. To open short positions on EURUSD, you need: Sellers continued to push the pair down and reached the support level of 1.1180, which I paid attention to in my morning review. Unfortunately, it was not allowed to enter the market on a false breakout from the level of 1.1205. At the moment, further downward movement can be based on good data on the US economy, the output of which is scheduled for the second half of the day. Under this condition, we can expect to update the lows around 1.1160 and 1.138, where I recommend taking profit. In the scenario of an upward correction, the resistance of 1.1205 will be the same acceptable level for opening short positions, but selling the euro immediately on the rebound will be more correct from the maximum of 1.1241. Indicator signals: Moving Averages Trading is below 30 and 50 moving averages, which indicates the predominance of euro sellers in the market. Bollinger Bands In case of an upward correction, the upper limit of the indicator in the area of 1.1225 will act as a resistance.
Description of indicators
|


| You are subscribed to email updates from Forex analysis review. To stop receiving these emails, you may unsubscribe now. | Email delivery powered by Google |
| Google, 1600 Amphitheatre Parkway, Mountain View, CA 94043, United States | |
No comments:
Post a Comment