Forex analysis review |
- Fractal analysis of major currency pairs on July 30
- Control zones for Bitcoin on 07/30/19
- Control zones EURJPY 07/30/19
- Brexit and Johnson: What does this mean for the euro and the pound?
- The prolonged fall of the British pound: a record since March 2017
- USD / JPY vs EUR / JPY vs GBP / JPY. Comprehensive analysis of movement options from July 29, 2019. Analysis of APLs &
- Dollar is strengthening, despite the prospect of the first Fed rate cut in 10 years
- EUR/USD pair starts a busy week
- Bitcoin and gold: who will be in the lead?
- GBP/USD. July 29. Results of the day. The "hard" Brexit script can be considered officially launched
- EUR/USD. July 29. Results of the day. The euro is in one place, as traders rushed to the pound/dollar pair
- GBP/USD. A nightmare becomes reality: Britain is preparing for a "hard" Brexit
- Yen plays by the Fed's rules
- BTC 07.29.2019 - Downward pressure and new momentum down
- EUR/USD for July 29,2019 - Bullish divergence on the MACD oscillator
- USD/JPY analysis for July 29, 2019 - Selling opportunity near the strong resistance cluster
- July 29, 2019 : EUR/USD Intraday technical analysis and trade recommendations.
- July 29, 2019 : GBP/USD achieves the anticipated bearish targets. Conservative traders should wait for bullish pullback.
- GBP/USD: plan for the US session on July 29. The pound flies into the abyss against the backdrop of waiting for hard Brexit
- EUR/USD: plan for the US session on July 29. Traders are in no hurry to return to the market amid uncertainty about the Fed's
- Analysis of gold for July 29, 2019
- Analysis of AUD/USD for July 29, 2019
- Analysis for July 29, 2019: Bitcoin finds strong support at $9,400
- Analysis of BITCOIN for July 29, 2019
- Trading recommendations for the EURUSD currency pair - placement of trading orders (July 29)
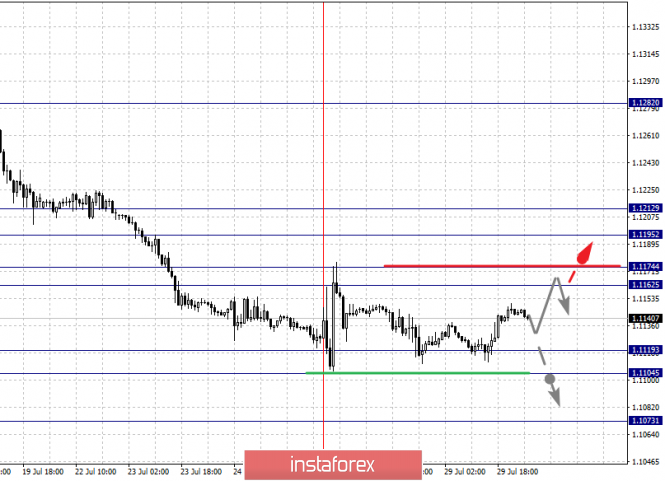
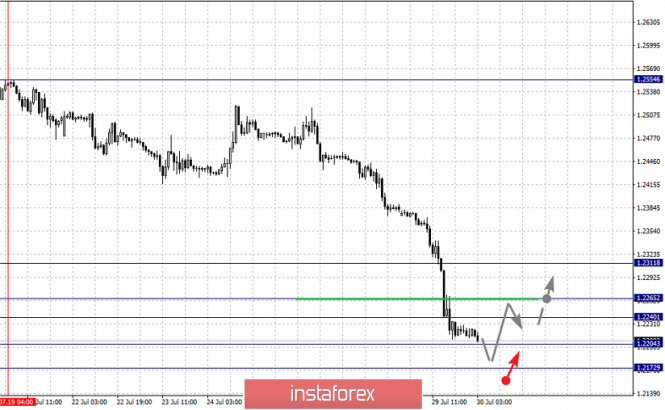
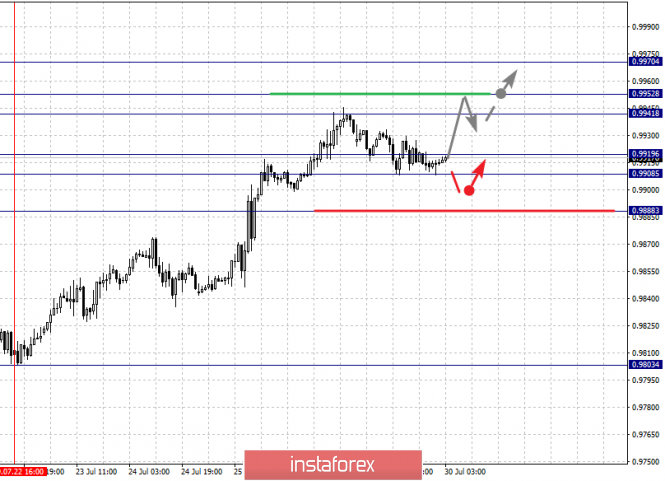
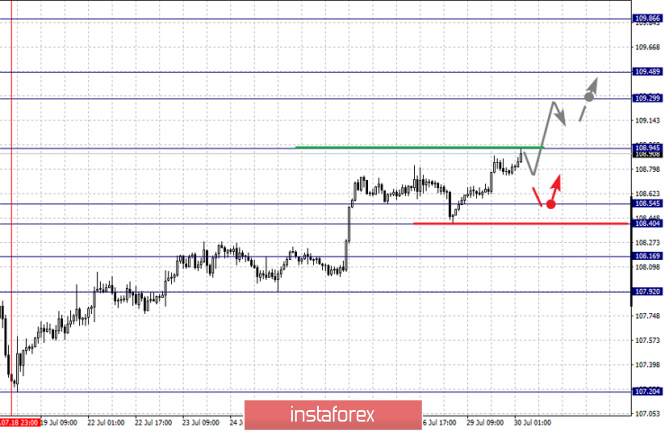
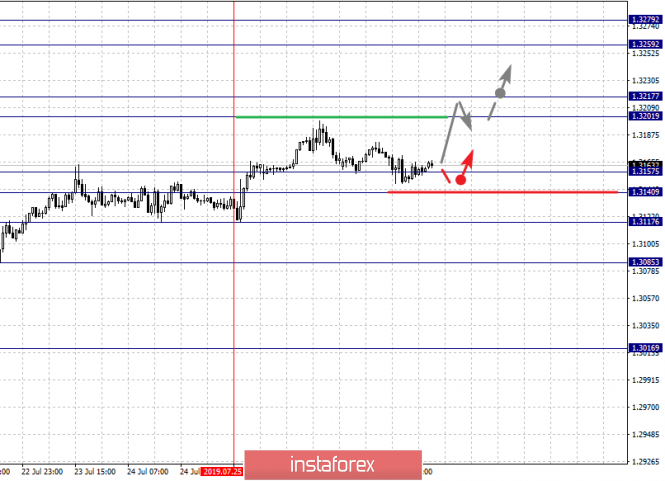
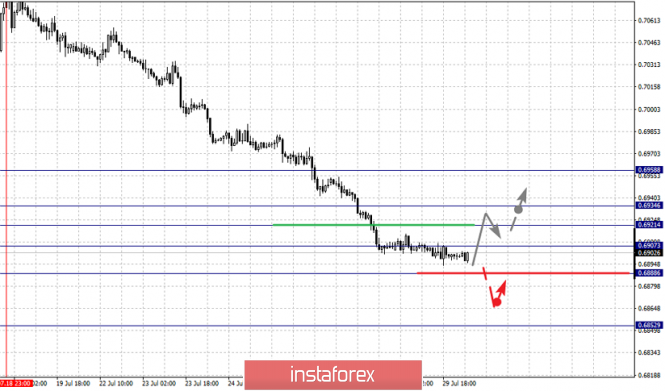
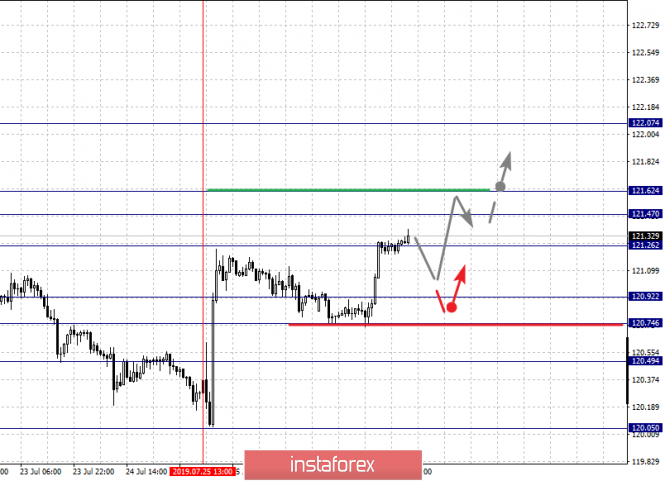
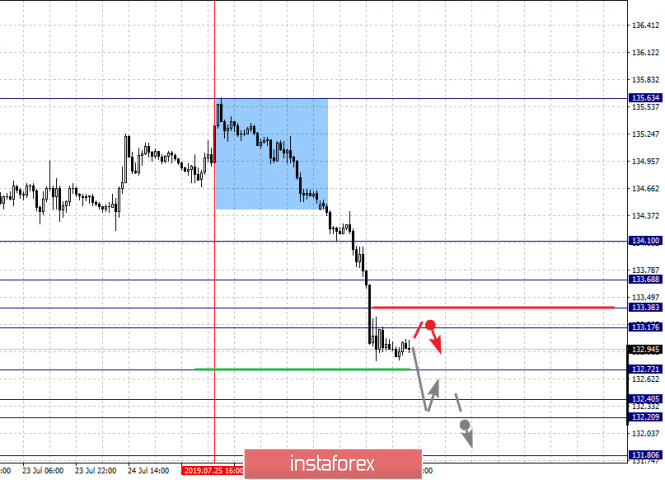
| Fractal analysis of major currency pairs on July 30 Posted: 29 Jul 2019 07:01 PM PDT Forecast for July 30: Analytical review of H1-scale currency pairs: For the euro / dollar pair, the key levels on the H1 scale are: 1.1212, 1.1195, 1.1174, 1.1162, 1.1119, 1.1104 and 1.1073. Here, the price is in the correction zone from the downward structure on July 18. The continuation of the movement to the top is expected after the price passes the noise range 1.1162 - 1.1174. In this case, the goal is 1.1195, where price consolidation is near this level. For the potential value for the top, we consider the level of 1.1212. Short-term downward movement is possible in the range of 1.1119 - 1.1104. The breakdown of the latter value will allow us to expect movement towards a potential target - 1.1073. From this level, we expect a rollback to the top. The main trend is the local downward structure of July 18, the stage of correction. Trading recommendations: Buy 1.1175 Take profit: 1.1195 Buy 1.1197 Take profit: 1.1212 Sell: 1.1119 Take profit: 1.1105 Sell: 1.1103 Take profit: 1.1075 For the pound / dollar pair, the key levels on the H1 scale are: 1.2311, 1.2265, 1.2240, 1.2204 and 1.2172. Here, we continue to follow the downward cycle of July 19th. Short-term downward movement is expected in the range of 1.2204 - 1.2172. Hence, we expect a key reversal to the correction area. Short-term upward movement is possible in the range of 1.2240 - 1.2265. The breakdown of the last value will lead to a deep correction. Here, the target is 1.2311. This level is a key support for the downward structure. The main trend is the downward cycle of July 19. Trading recommendations: Buy: 1.2240 Take profit: 1.2263 Buy: 1.2266 Take profit: 1.2310 Sell: 1.2202 Take profit: 1.2174 For the dollar / franc pair, the key levels on the H1 scale are: 0.9952, 0.9930, 0.9919, 0.9888, 0.9871 and 0.9850. Here, we are following the development of the ascending structure of July 22. At the moment, the price is in correction. Short-term upward movement is possible in the range of 0.9941 - 0.9952. The breakdown of the latter value will lead to movement to the potential target - 0.9970. From this level, we expect a rollback to the bottom. Consolidated movement is possible in the range of 0.9919 - 0.9908. The breakdown of the latter value will lead to a prolonged correction. Here, the target is 0.9888. This level is a key support for the upward structure. The main trend is the ascending structure of July 22, the stage of correction. Trading recommendations: Buy : 0.9941 Take profit: 0.9950 Buy : 0.9954 Take profit: 0.9970 Sell: 0.9919 Take profit: 0.9909 Sell: 0.9907 Take profit: 0.9888 For the dollar / yen pair, the key levels on the scale are : 109.86, 109.48, 109.29, 108.94, 108.54, 108.40, 108.16 and 107.92. Here, we are following the development of the ascending structure of July 18. The continuation of the movement to the top is expected after the breakdown of the level of 108.95. In this case, the goal is 109.29. Short-term upward movement, as well as consolidation is in the range of 109.29 - 109.48. We consider the level of 109.48 to be a potential value for the top. Upon reaching this level, we expect consolidation as well as a rollback to the bottom. Short-term downward movement is possible in the range of 108.54 - 108.40. The breakdown of the last value will lead to a prolonged correction. Here, the goal is 108.16. This level is a key support for the upward structure. Its price passage will have to form the initial conditions for the downward cycle. Here, the potential goal is 107.92. The main trend: the ascending structure of July 18. Trading recommendations: Buy: 108.95 Take profit: 109.29 Buy : 109.30 Take profit: 109.46 Sell: 108.54 Take profit: 108.42 Sell: 108.38 Take profit: 108.16 For the Canadian dollar / US dollar pair, the key levels on the H1 scale are: 1.3279, 1.3259, 1.3217, 1.3201, 1.3157, 1.3140, 1.3117 and 1.3085. Here, we are following the local ascending structure of July 25th. The continuation of the movement to the top is expected after the price passes the noise range 1.3201 - 1.3217. In this case, the goal is 1.3259. For the potential value for the top, we consider the level of 1.3279. After reaching which, we expect consolidation, as well as a rollback to the bottom. Short-term downward movement is possible in the range of 1.3157 - 1.3140. The breakdown of the latter value will have to form a downward structure. Here, the first target is 1.3117. For the potential value for the bottom, we consider the level of 1.3085. The main trend is the local ascending structure of July 25. Trading recommendations: Buy: 1.3217 Take profit: 1.3257 Buy : 1.3260 Take profit: 1.3278 Sell: 1.3157 Take profit: 1.3140 Sell: 1.3138 Take profit: 1.3118 For a pair of Australian dollar / US dollar, the key levels on the H1 scale are : 0.6958, 0.6934, 0.6921, 0.6907, 0.6888 and 0.6852. Here, we follow the development of the downward structure of July 18. Consolidated movement is expected in the range of 0.6907 - 0.6888. Hence, we expect a key reversal to the top. The breakdown of the level of 0.6888 will lead to a move to a potential target of 0.6852, but in this case, we expect an unstable trend development. Short-term upward movement is possible in the range of 0.6921 - 0.6934. The breakdown of the latter value will lead to a prolonged correction. In this case, the target is 0.6958. The main trend - the downward structure of July 18. Trading recommendations: Buy: 0.6921 Take profit: 0.6934 Buy: 0.6936 Take profit: 0.6955 Sell : Take profit : Sell: 0.6884 Take profit: 0.6861 For the euro / yen pair, the key levels on the H1 scale are: 122.07, 121.62, 121.47, 121.26, 120.92, 120.74 and 120.49. Here, we are following the formation of the ascending structure of July 25. At the moment, we expect the movement to the level - 121.47. Meanwhile, to the level of 121.62, we expect the registration of a pronounced structure of the initial conditions for the upward cycle. For the potential value for the top, we consider the level of 122.07. The movement to which is expected after the breakdown of the level of 121.62. Short-term downward movement is possible in the range of 120.92 - 120.74. The breakdown of the latter value will lead to a prolonged correction. Here, the goal is 120.49. This level is a key support for the top. The main trend is the formation of the initial conditions for the upward cycle of July 25. Trading recommendations: Buy: 121.26 Take profit: 121.45 Buy: 121.64 Take profit: 122.05 Sell: 120.72 Take profit: 120.54 Sell: 120.45 Take profit: 120.10 For the pound / yen pair, the key levels on the H1 scale are : 134.10, 133.68, 133.38, 133.17, 132.72, 132.40, 132.20 and 131.80. Here, we are following the development of the downward structure of July 25th. The continuation of the movement to the bottom is expected after the breakdown of the level of 132.72. In this case, the target is 132.40. Price consolidation is in the range of 132.40 - 132.20. For the potential value for the bottom, we consider the level of 131.80. After reaching which, we expect to go into a correction. Short-term upward trend is possible in the range 133.17 - 133.38. The breakdown of the last value will lead to a prolonged correction. Here, the goal is 133.68. This level is a key support for the downward structure. Its breakdown will have to form the initial conditions for the upward cycle. Here, the potential target is 134.10 . The main trend - the downward structure of July 25. Trading recommendations: Buy: 133.17 Take profit: 133.37 Buy: 133.40 Take profit: 133.68 Sell: 132.70 Take profit: 132.40 Sell: 132.20 Take profit: 131.80 The material has been provided by InstaForex Company - www.instaforex.com |
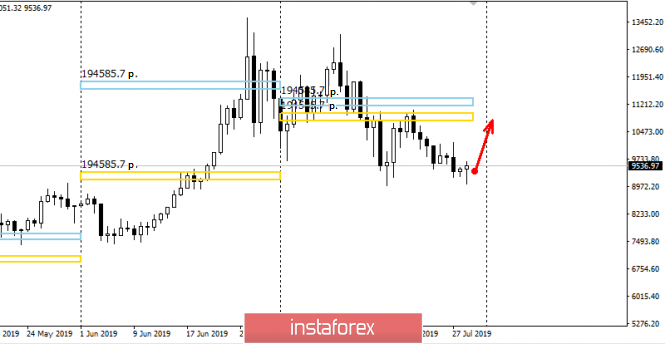
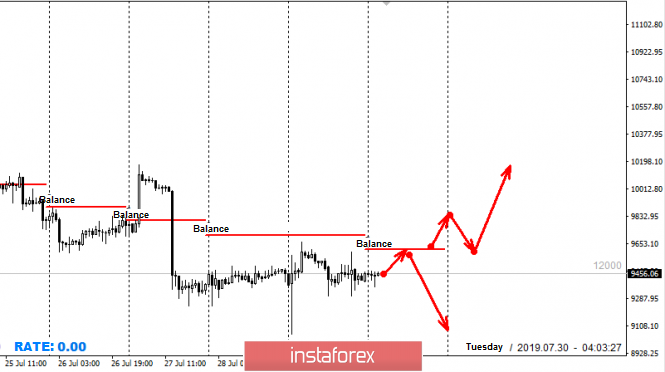
| Control zones for Bitcoin on 07/30/19 Posted: 29 Jul 2019 06:39 PM PDT Yesterday, Bitcoin has dropped to $ 9000. This allowed us to re-test the monthly minimum. The response to the test was an increase in demand. This makes it possible to indicate that there are limit buyers within the monthly minimum. While levels from 9000 and above are saturated with buyers, a further decrease remains unlikely. Thus, the likelihood of continued movement within the medium-term flat increases. It is also important to note that Bitcoin went beyond the monthly control zone. This makes it possible to search for purchases in the direction of return, since the probability of return is 90%. When building a trading plan, it is important to note that throughout the past week, the pair has been trading below the level of balance. Today, the situation is similar, so the movement towards yesterday's high will be decisive. If the price is kept below the balance, the probability of updating the monthly minimum will be more than 50%. To break the downward impulse, it will be necessary to consolidate above the balance mark. Daily CZ - daily control zone. The area formed by important data from the futures market, which change several times a year. Weekly CZ - weekly control zone. The zone formed by important marks of the futures market, which change several times a year. Monthly CZ - monthly control zone. The zone, which is a reflection of the average volatility over the past year. The material has been provided by InstaForex Company - www.instaforex.com |
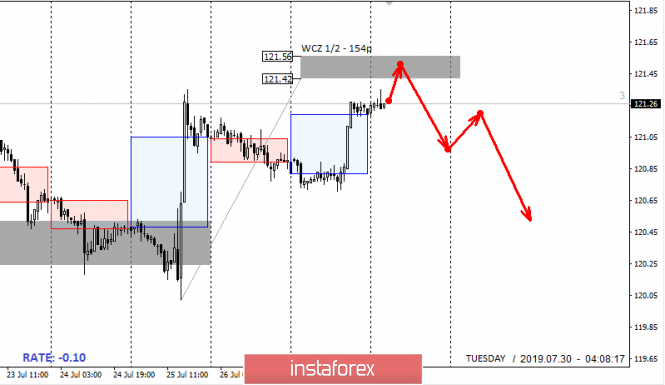
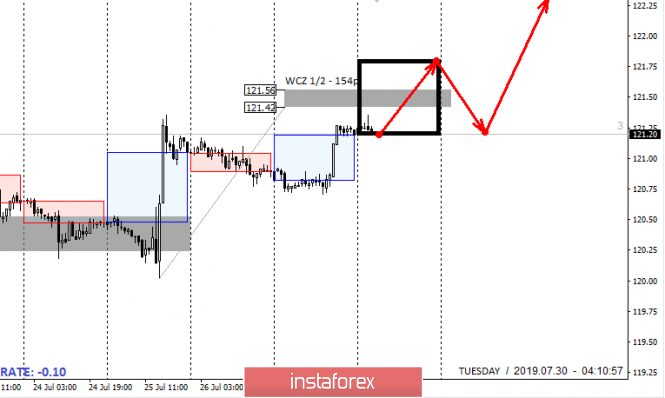
| Posted: 29 Jul 2019 06:15 PM PDT Today, the pair is trading near WCZ 1/2 121.56-121.42. The test of this zone will be decisive for further movement. If the test leads to the emergence of a bid and the formation of a false breakdown pattern of yesterday's high, then sales of the instrument will come to the fore. Selling from the WCZ 1/2 is still a priority. The first goal of the decline will be the July low, which speaks of a favorable risk/profit ratio. To break the downward impulse of the medium-term impulse, it will be necessary to close today's US session above 121.56. This will make it possible to rebuild the trade on the upward. The search for purchases will come to the fore, and the main objectives will be the highest levels of the current month. Daily CZ - daily control zone. The area formed by important data from the futures market, which change several times a year. Weekly CZ - weekly control zone. The zone formed by important marks of the futures market, which change several times a year. Monthly CZ - monthly control zone. The zone, which is a reflection of the average volatility over the past year. The material has been provided by InstaForex Company - www.instaforex.com |
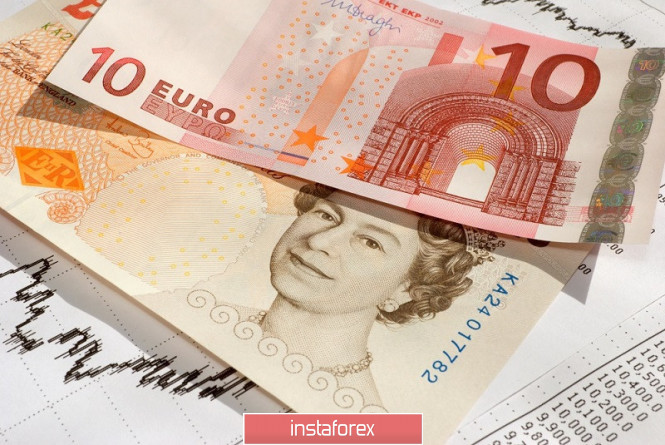
| Brexit and Johnson: What does this mean for the euro and the pound? Posted: 29 Jul 2019 05:18 PM PDT The beginning of the new week was marked by the fall of the British currency. By evening, the quotes fell to their lowest marks in the last 2 years. News of the Brexit come out one after another, all of which are negative. Judging by reports in the press, the UK is just waiting for a scandalous exit from the European Union. Hastened to notify Boris Johnson. In addition, British Foreign Secretary Dominic Raab said that his department is actively preparing for a "hard" Brexit. The pound remains hostage to the game played by the EU and Britain. In the near future, the pressure on it will not only continue but will also increase. There is almost no time left for a civilized "divorce". Given the harsh rhetoric of politicians, hopes for a new deal are melting away, and hard Brexit or early elections are becoming more realistic. What is Johnson's role? Many are now wondering: why did Boris Johnson become the leader of the Conservative Party and get the post of British prime minister? Where will this Englishman take the country with his unkempt hairdo and what will happen next? It would be naive to believe that a country accustomed to accusing and judging, ordering and domination, dividing people into masters and servants will put the naive and stupid simpleton at the head of an important post. The image of Boris Johnson was chosen by chance, this is the opinion of most analysts. It works well in negotiations. The opponent gains confidence in the atypical Briton, he says, and sometimes he does more of his position. However, the work of Boris Johnson was seen by many at the post of British foreign office. It seems that an uncompromising man has come to the post of prime minister. It is not to be underestimated. No matter how he looks or what he says, it is important what he does. If Theresa May somehow considered Brexit's decision, having agreed with the EU, then in this case it's probably worth forgetting about the deal. It is possible that May's role was only distracting and time-consuming. From an economic point of view, the UK is losing little even with hard Brexit. It has a trump card - a powerful partnership and a capacious market with a longtime ally of the United States, which, by the way, is hampered by Chinese exports. Having united with the British, it will be easier for the United States to solve the problem with China, with which England once fought with opium methods. As for Europe, Germany, as well as other countries, will lose the sales market, since in the event of a hard Brexit, Britain will no less aggressively defend its interests. It should also take into account the sanctions against Russia with the filing of the United States, from which the Europeans are uneasy. Nothing has changed, the UK still considers itself a "lady" with a capital letter. The euro is not to be envied, most likely, its rate will fall. Is it good or bad? Watching which side to watch. Given the imminent currency wars, the purpose of which is to weaken the currency, it is to the benefit. The ECB is seriously considering a reduction in rates and the launch of a printing press in order to later put pressure on the euro and support its exporter. The other side is customs duties. In the medium term, the euro against the pound may strengthen to 0.9550, and after a year - be at around 0.7320. Paired with the dollar, the next stop for the euro can be the level of 1.10. Traders agree that the euro now has only one road - down. This is due to the local strengthening of the dollar and the prospects for reducing the ECB rate. The political background is also against the euro. Trade tensions between the United States and Europe intensified after the French president signed the "digital tax" law on US technology companies. Donald Trump threatened to introduce duties on French wines and other European products. "Short" positions on EUR/USD, apparently, remain in priority. The material has been provided by InstaForex Company - www.instaforex.com |
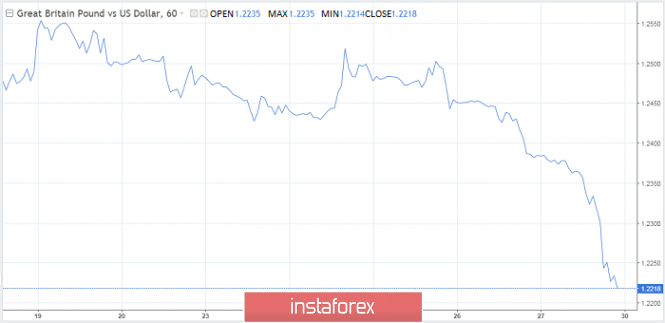
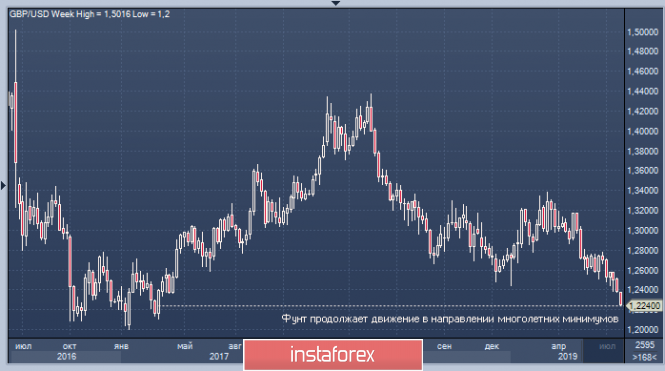
| The prolonged fall of the British pound: a record since March 2017 Posted: 29 Jul 2019 05:04 PM PDT According to analysts, the British currency has tested lows of the last two years. Its rate against the US dollar has significantly declined since March 2017. The beginning of the new week was marked by selling the pound, which started earlier. News from the UK became the catalyst for the course of the currency's fall. Recall that the new government stands for Brexit without an agreement. A country's withdrawal from the EU without a deal can bring many surprises, primarily for the British currency. Prime Minister Boris Johnson stressed that he would not resume negotiations regarding Brexit with the leadership of the euro bloc until the other side changes its position regarding the border with Ireland. He warned about the readiness to leave the EU without a deal. At the same time, Dominic Raab, Minister of Foreign Affairs of the United Kingdom, notes that the British government is not against the agreement, but this does not suit the EU. As a result, the UK was faced with the need to go on the path of a "hard" Brexit, stress analysts. In the course of the confrontation between the UK and the European Union, the pound suffered the most. It is a hostage to the current situation, analysts say. In the near future, the pressure on it will further increase. Against the background of "predatory" rhetoric of politicians, the possibility of a new deal is at zero. Analysts believe that the most likely scenario is a hard Brexit or early elections in the UK, which does not add optimism to the pound. |
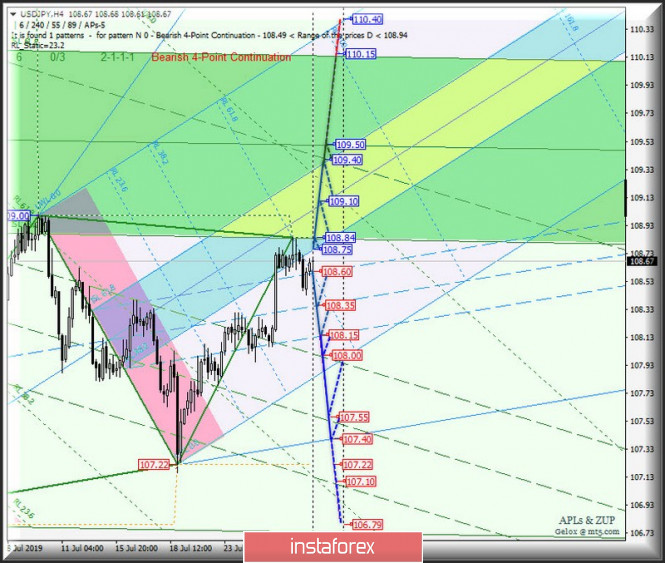
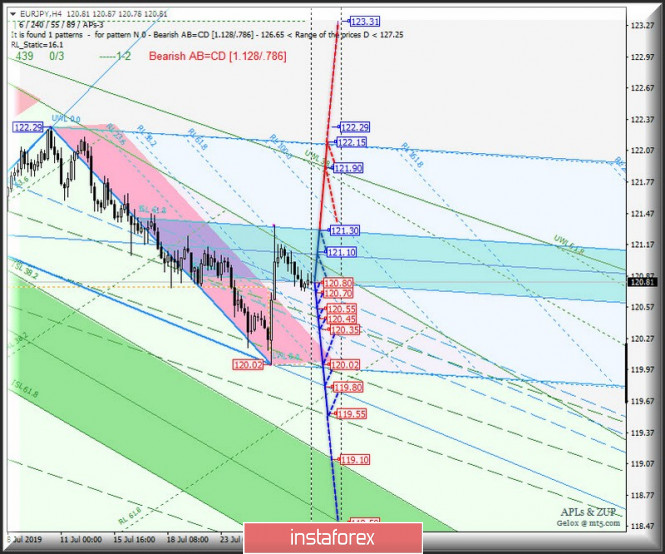
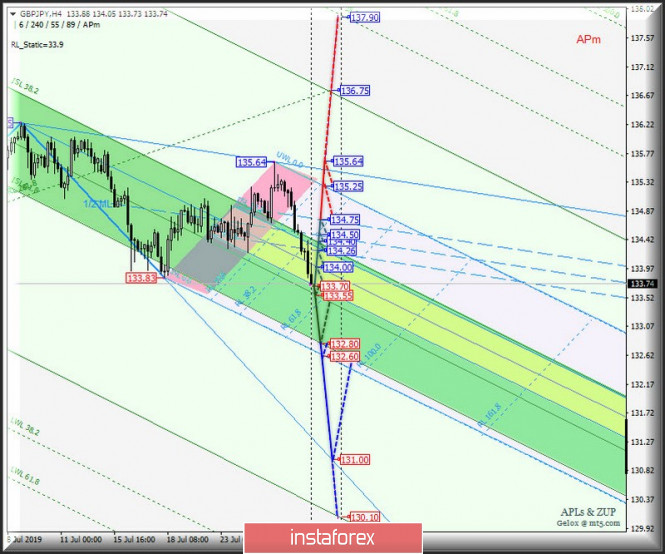
| Posted: 29 Jul 2019 04:57 PM PDT Let's consider what will happen to the movement of the "Land of the Rising Sun" USD / JPY and its cross-instruments EUR / JPY and GBP / JPY from Tuesday, July 29, 2019 Minuette (H4 timeframe) ____________________ US dollar vs Japanese yen On July 29, 2019, the movement of the "land of the rising sun" currency instrument USD / JPY will be determined by the direction of the range breakdown :
The breakdown of the support level of 108.60 - the development of the USD / JPY movement will continue in the 1/2 Median Line channel (108.60 - 108.35 - 108.15) of the Minuette operational scale fork, and in the case of the breakdown of the lower boundary (108.15) of this channel, the downward movement of USD / JPY can be continued the boundaries of the 1/2 Median Line channel (108.00 - 107.55 - 107.10) of the Minuette operating scale fork. If, however, a breakdown of the upper boundary of the 1/2 Median Line channel (108.25) takes place at the Minuette operational scale, we will determine the further development of the USD / JPY movement in the equilibrium zone (108.25 - 108.55 - 108.85) Minuette operating scale fork. ____________________ Euro vs Japanese yen On the other hand, the development of the EUR / JPY cross-instrument movement from July 29, 2019 will be due to the working out and direction of the breakdown of the boundaries of equilibrium zone (120.80 - 121.10 - 121.30) of the Minuette operating scale fork. Let's look at the animation chart. In case of the breakdown of the upper boundary of ISL61.8 (resistance level of 121.30) of the equilibrium zone of the Minuette operational scale fork, the upward movement of EUR / JPY can be continued towards the targets - the UTL control line (121.9) Minuette operational scale fork - FSL Minuette destination line (122.15). The combined breakdown of the lower boundary of ISL38.2 (support level of 120.80) of the Minuette operating scale fork and the upper boundary of the 1/2 Median Line channel of the Minuette (120.70) will make the development of EUR / JPY movement inside the 1/2 Median Line channels of the Minuette operational scale fork (120.70 - 120.55 - 120.35) and Minuette (120.45 - 120.02 - 119.55). ____________________ Great Britain pound vs Japanese yen The movement of the GBP / JPY cross-instrument from July 29, 2019 will depend on the working out and direction of the breakdown of the boundaries of equilibrium zone (133.70 - 134.00 - 134.26) of the Minuette operational scale fork. More details are presented in the animation chart. In case of a combined breakdown of the lower boundary of ISL61.8 (support level of 133.70) of the equilibrium zone of the Minuette operating scale fork and the 1/2 Median Line Minuette (support level of 133.55), the downward movement of GBP / JPY can be continued to the targets - the lower boundary of the ISL61.8 (132.80) equilibrium zone of the Minuette operational scale - the end line FSL Minuette (132.60) with the prospect of reaching the control line LTL Minuette ( 131.00 ). Meanwhile, in the case of the consecutive breakdown of the upper boundary of the ISL38.2 (resistance level of 134.26) of the Minuette operating scale fork and the upper boundary of the ISL38.2 (resistance level of 134.40) of the equilbrium zone of the Minuette operational scale fork will determine the development of GBP / JPY movement in the 1/2 Median Line channel Minuette (134.26 - 134.50 - 134.75), and in the case of the breakdown of the upper boundary (134.75) of this channel, the upward movement of this cross-instrument can be continued to the SSL Minuette start line (135.25) and local maximum 135.64. ____________________ The review was compiled without regard to the news background. The opening of trading sessions of the main financial centers does not serve as a guide to action (placing orders "sell" or "buy"). The formula for calculating the dollar index is: USDX = 50.14348112 * USDEUR0.576 * USDJPY0.136 * USDGBP0.119 * USDCAD0.091 * USDSEK0.042 * USDCHF0.036. where power ratios correspond to the weights of currencies in the basket: Euro - 57.6%; Yen - 13.6% ; Pound sterling - 11.9%; Canadian dollar - 9.1%; Swedish krona - 4.2%; Swiss franc - 3.6%. The first coefficient in the formula gives the index value to 100 on the starting date - March 1973, when the main currencies began to be freely quoted relative to each other. The material has been provided by InstaForex Company - www.instaforex.com |
| Dollar is strengthening, despite the prospect of the first Fed rate cut in 10 years Posted: 29 Jul 2019 04:57 PM PDT The USD index reached two-month highs amid positive US statistics, as well as due to the weakness of its main competitors. Last Friday, a moderate positive from GDP for the second quarter added to strong data on the US labor market, retail sales and industrial production. Despite the fact that in the period under review, economic growth in the country slowed down in annual terms (from 3.1% in January-March to 2.1%), it exceeded the forecasts of analysts who expected a rise of 1.8%. At the same time, consumer spending, which accounts for 70% of US GDP, rose 4.3% yoy in April-June, compared with 1.1% in the first quarter. In the light of the release of strong statistics on the United States, the chances of reducing the federal funds rate by 50 basis points at the July FOMC meeting decreased to 19%, but a little later they again rose above 21%. For the first time since 2008, the US central bank is planning to ease monetary policy despite the longest economic expansion since 1854, record low unemployment and record highs of the S&P 500 index. The two main reasons for the sharp change in the Fed's position, which last year actively used monetary tightening, are sluggish inflation and a slowdown in global GDP growth. While consumer prices in the United States are not responding either to the expansion of domestic demand under the influence of large-scale fiscal stimulus or to a strong labor market, the Fed's desire to help the global economy contrasts sharply with the "First of all" slogan of the US president. The greenback is strengthening not only due to the US economy's strength, but also because of the weakness of its main competitors. More than 90% of the global debt market instruments have a yield lower than the federal funds rate. For comparison: in 2015, their share was 50%. If non-US assets lose their attractiveness in the eyes of investors, why not increase the share of dollar-denominated securities in their portfolios? Meanwhile, the positive statistics for the US "bears" for EUR/USD was not enough to bring quotes beyond the range of 1.11-1.119. Probably, market participants prefer to wait for the results of the July FOMC meeting to be announced. If the reduction in the federal funds rate by 25 basis points in July is practically beyond doubt, then the Fed's further actions remain a mystery to traders. The material has been provided by InstaForex Company - www.instaforex.com |
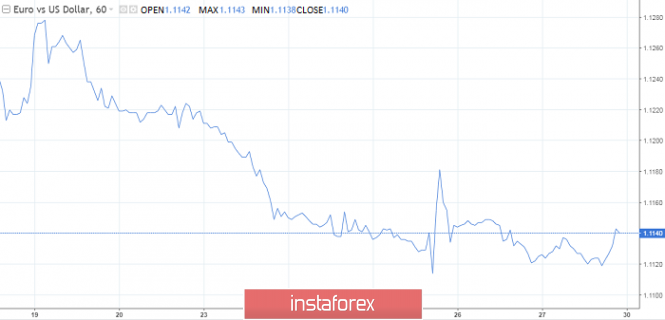
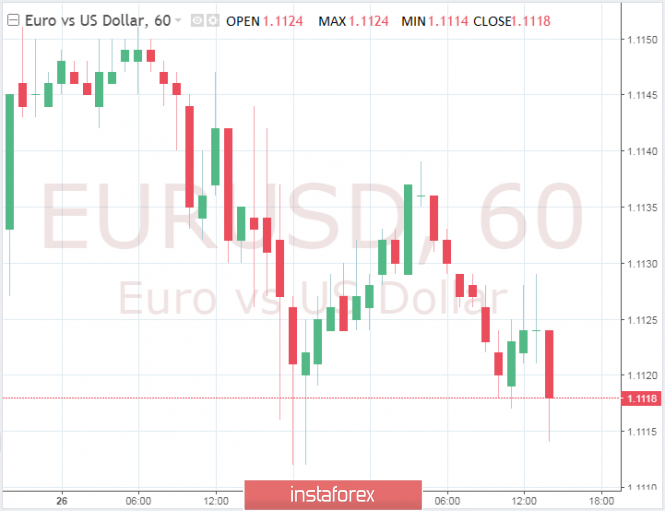
| EUR/USD pair starts a busy week Posted: 29 Jul 2019 04:52 PM PDT EUR/USD is trading near the 1,1100 mark, the trend remains downward, and the chart shows bearish signs. The relative strength index (RSI) is falling, the pair cannot consolidate even at the lowest support line - 1.1195, which is also a sign of a further fall. When a currency pair cannot restore positions on the previous support line - it has only has one direction - down. The EUR/USD pair failed to continue the rebound following Draghi's statements, and the main driving force behind the recent fall was the optimistic report on US GDP. US economic indicators have lowered expectations for significant monetary stimulus from the Fed, and lower rates will not mean the start of a new policy easing cycle. The moderate easing of the Fed contrasts with the ECB's strategy. So far, the European regulator abstained from any action, but laid the foundation for the announcement of a significant "package of measures" at its September meeting. Trade tensions between Europe and the United States intensify after French President Emmanuel Macron signed a law on the "digital tax" on technology companies, primarily American ones. Trump responded with a threat to introduce a tariff for French wines and other European products. Meanwhile, trade negotiations between the US and China are resuming in Shanghai - for the first time since May. All this time, the parties communicated only by phone, but now resume personal summits. Any positive news on the basis of these meetings will instantly affect the EUR/USD pair, and they will not be as good for the euro as for the dollar. The material has been provided by InstaForex Company - www.instaforex.com |
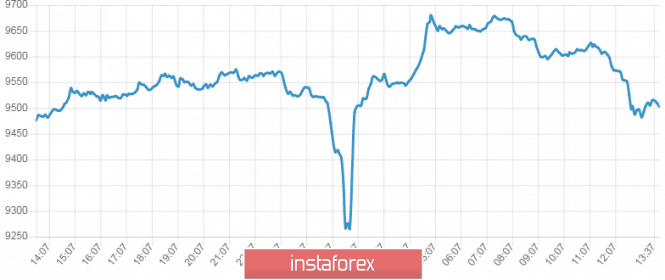
| Bitcoin and gold: who will be in the lead? Posted: 29 Jul 2019 04:37 PM PDT According to a number of analysts, in the near future, primacy among reserve financial assets may be behind the number one cryptocurrency. At the same time, the yellow metal will retain its value, but will give way to Bitcoin. Currently, the leading digital currency is competing with gold in terms of popularity, analysts say. Many participants of the cryptocurrency market are supporters of the replacement of central banks with a new system, based on the blockchain technology. One of the options for its implementation are operations with Bitcoin. An important advantage of the number one cryptocurrency is that analysts consider the fact that Bitcoin allows you to avoid hyperinflation. In the case of gold, which is provided in US dollars, this is not always possible. At the moment, the leading virtual currency has the least correlation with traditional asset classes, such as fiat currencies and the yellow metal. According to analysts, in the near future, it will be more profitable for central banks to use Bitcoin. The advantages of this implementation are to obtain clean and efficient energy, waste minimization and sustainable economic growth. Analysts believe that the lack of Bitcoin is its high volatility, which is about 10 times higher than that of gold. However, the yellow metal, more than a digital asset, is at risk of counterfeiting. In the long run, Bitcoin may win, but it loses to gold at a short distance. The number one cryptocurrency completes July with a noticeable decline after five months of growth. Most analysts believe that in August, the price of Bitcoin will continue to fall, since the cryptocurrency has almost exhausted its growth potential. Analysts believe that the reason for the fall is the criticism from the largest market players and leading central banks, the uncertainty in the issue of regulation of the number one cryptocurrency and the negative news about hacking wallets and robbery cryptoforge. According to Mike Novograts, the head of the company Galaxy Digital, the rate of BTC may fall to $8500, but in the future we can expect a rise to $20,000. According to the calculations of Gennady Nikolaev, an analyst at the Academy of Financial and Investment Management, Bitcoin moves towards the range of $3000– $ 6000 - the level at which it lasted in the second half of 2018 and in early 2019. Closer to autumn, the leading digital asset will fall in price to $5,000 and lower, which is why many market players are now actively selling BTC, analysts say. The updated "bottom" of the cryptocurrency asset will be a mark of $7,000, and the resumption of its rally should be expected in September this year. According to analysts, by the beginning of October, Bitcoin is able to give a surprise in the form of price increases, and the $16000 mark may be the limit of the number one cryptocurrency's breakthrough. Many analysts believe that a number of factors are needed for Bitcoin's new growth pulse. First, the most impatient players must leave the market - those who decided to consolidate the losses. Secondly, the current rate of BTC should reach the local bottom. Thirdly, the market should consolidate at the time near the occupied levels, and only then a new wave of increase is possible, analysts conclude. The number one cryptocurrency is considered a revolutionary asset for existing financial, monetary and auditing systems. This is the undoubted advantage of BTC over traditional defensive assets such as gold and currencies. The traditional yellow metal reduces its popularity among the younger generation. New market players believe the future is for more modern digital assets. According to Nate Gerasi, president of the ETF Store and leading investment consultant, the lion's share of millennial investors (about 90%) prefers Bitcoin to popular hedging assets, such as gold. "Sooner or later, the yellow metal will lose its luster and yield to bitcoin," summarizes N. Gerasi. Bitcoin exchange rate on 07/29/19. Price for 1 BTC - $9503. The material has been provided by InstaForex Company - www.instaforex.com |
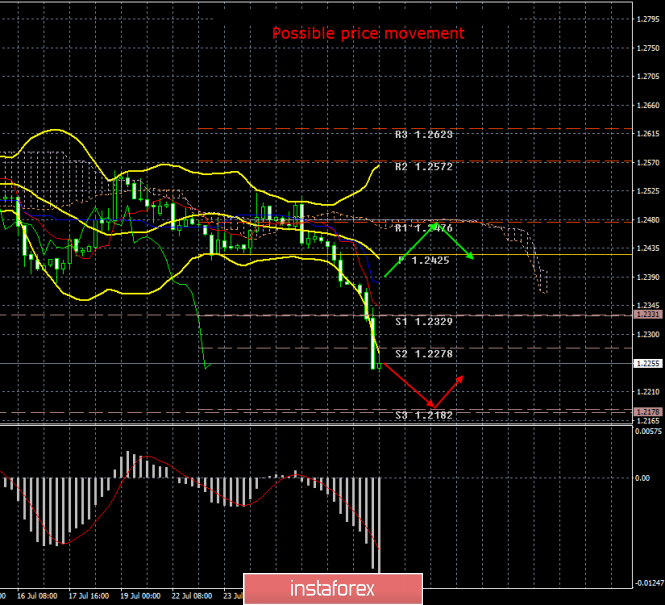
| GBP/USD. July 29. Results of the day. The "hard" Brexit script can be considered officially launched Posted: 29 Jul 2019 04:22 PM PDT 4-hour timeframe The amplitude of the last 5 days (high-low): 58p - 64p - 96p - 81p - 84p. Average amplitude for the last 5 days: 77p (76p). For the nth attempt, Boris Johnson still realized that the European Union was not ready to enter into new negotiations, or decided to start a large-scale bluff by organizing preparations for a "hard" Brexit. We are talking about a huge amount from the British budget, which will be spent on advertising an unorganized "divorce" with the European Union. Johnson intends to inform every citizen of the United Kingdom and convince him that the hard Brexit is not as scary as opposition political forces say. For example, Laborites who vehemently oppose this option. However, not only Laborists oppose Brexit "without a deal." The Confederation of British Industry, an independent organization that protects British industrialists before the government, announced that neither the EU nor the United Kingdom were prepared for such a scenario. Uncontrolled Brexit, according to the PCU, will cause problems in 24 of the 27 UK regions. In principle, the same opinion is shared by the head of the Bank of England, Mark Carney, and many other analysts. The British Parliament is frankly against such an outcome. The question still remains: how is Boris Johnson going to conduct a hard Brexit through Parliament? Nothing has been announced about special elections yet, respectively, the composition of the Parliament remains the same, which has already repeatedly blocked even the possibility of conducting an unorganized Brexit. Based on the foregoing, it is possible that Johnson is actually bluffing, trying to push Brussels into new negotiations. But the British pound and foreign exchange market do not support the optimism and intentions of Johnson. The UK currency continues to fall down, actively traded on July 29. Trading recommendations: The pound/dollar currency pair resumed the increased downward movement. Thus, it is now recommended to continue selling the pound sterling with the goal of a support level of 1.2182. After the pair is consolidated above the critical line, it will be possible to buy the British currency, however, with extreme caution and small lots. The first goal is the level 1.2476. In addition to the technical picture should also take into account the fundamental data and the time of their release. Explanation of the illustration: Ichimoku indicator: Tenkan-sen - the red line. Kijun-sen - the blue line. Senkou Span A - light brown dotted line. Senkou Span B - light purple dotted line. Chikou Span - green line. Bollinger Bands indicator: 3 yellow lines. MACD Indicator: Red line and histogram with white bars in the indicator window. The material has been provided by InstaForex Company - www.instaforex.com |
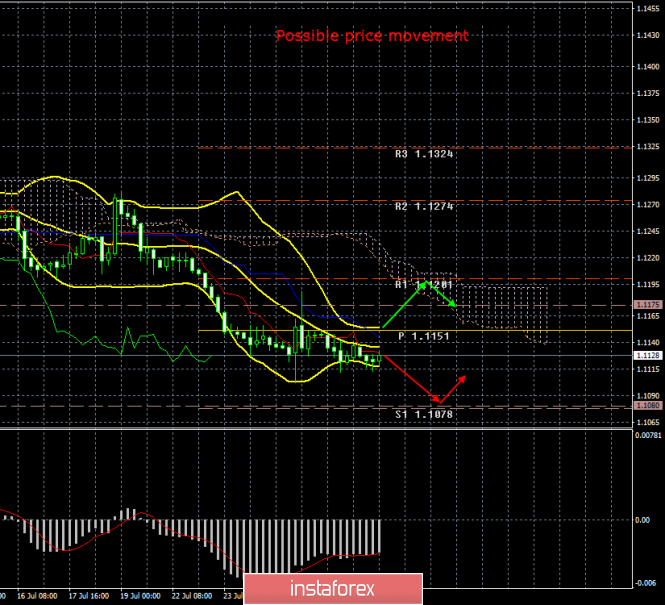
| Posted: 29 Jul 2019 04:11 PM PDT 4-hour timeframe The amplitude of the last 5 days (high-low): 19p - 64p - 29p - 86p - 39p. Average amplitude for the last 5 days: 47p (55p). Monday, July 29, was quiet and peaceful for the EUR/USD pair. There were no important macroeconomic events related to the euro or the dollar that day, traders decided not to force events before the Fed meeting, at which the regulator is likely to announce a rate cut. Moreover, there was another collapse in the "neighboring" GBP/USD pair, and there is much more news and events. More or less significant reports on income and expenditures of the US population will be released tomorrow in the United States, and the day after tomorrow - inflation and GDP in the European Union and the announcement of the results of the Fed meeting. Thus, the volatility of the euro/dollar pair today fell to its lowest level. As for the prospects of the euro currency, they still remain vague, based on the current set of fundamental factors. Of course, hypothetically Donald Trump can give a surprise tomorrow, he likes to do this and is able to give a surprise to the Fed, lowering the rate by 0.5%, China-US trade conflict may worsen and the euro will start to be in demand. But at the moment, there is no reason to buy the euro even in the medium term. Mario Draghi is not unreasonable, but he does everything so that the euro currency continues its fall. Yes, he has reasons for this, since inflation is low, economic growth is slowing. Moreover, the "cheap" euro makes it more profitable to trade with the United States, as Trump has repeatedly said, just accusing the European Union and China of deliberately lowering the rates of national monetary units. On the other hand, each country conducts its monetary policy, as it sees fit and the United States is no exception. Trading recommendations: The EUR/USD pair has moved to a sideways correction, but it can be completed tomorrow. Thus, it is now recommended to wait for the MACD indicator to turn down and re-sell the euro currency with a target level of 1.1080. We recommend buying the euro/dollar pair not earlier than when traders have overcome the Kijun-sen line with targets at 1.1175 and 1.1201, but with minimal lots, since the bulls remain extremely weak. In addition to the technical picture should also take into account the fundamental data and the time of their release. Explanation of the illustration: Ichimoku indicator: Tenkan-sen - the red line. Kijun-sen - the blue line. Senkou Span A - light brown dotted line. Senkou Span B - light purple dotted line. Chikou Span - green line. Bollinger Bands indicator: 3 yellow lines. MACD Indicator: Red line and histogram with white bars in the indicator window. The material has been provided by InstaForex Company - www.instaforex.com |
| GBP/USD. A nightmare becomes reality: Britain is preparing for a "hard" Brexit Posted: 29 Jul 2019 04:00 PM PDT The pound reached two-year lows against the dollar: the last time the price was in the 22nd figure was back in March 2017. The question of Brexit, which puts tremendous pressure on the British currency, was once again to blame. It seems that the market is beginning to realize that Boris Johnson is not bluffing, but is seriously leading the country to withdraw from the EU without an agreement with Brussels. By the way, the devaluation of the pound to a record low of 1.1986 (at the end of 2016) was due to similar reasons, when Theresa May for the first time could not agree on a deal with Europe. At that time, the market was fully confident that Brexit would take place on March 31, and the parties would not have time to coordinate their positions before this date. It was only at the beginning of 2017 that it became clear that both Europe and Britain were ready to make concessions: the deputies of the House of Commons legally "moved" the exit date from the EU, while the Europeans extended the negotiation process at an extraordinary summit. After that, the pound began to grow (having reached its local peak in the area of the 43rd figure in March 2018) and has never since dropped to current levels. The fact is that after the first postponement of Brexit, traders were already skeptical about mutual threats about the implementation of the "hard" scenario. In turn, London and Brussels justified this skepticism: the "X date" was postponed several times, the last time - until October 31. It is likely that if Theresa May was still at the helm of the government, the Brexit date would again be postponed, for a longer period - until 2022 (that is, in fact, until the next Parliamentary elections in Britain). Neither May, nor the deputies of the House of Commons, nor Brussels had and do not have the political determination to implement the hard version of Brexit. Therefore, the corresponding threats in their mouth sounded formal and did not have a significant impact on the market. But now the situation is radically different. Boris Johnson formed his government from among the ardent supporters of Brexit and began a large-scale campaign to prepare for the country's withdrawal from the European Union. For example, this week, the newly appointed British Treasury Chancellor Sajid Javid will publish an estimate of the additional costs - according to preliminary data, this amount will be one billion pounds. Moreover, a tenth of this amount will be used to conduct an "information educational program" throughout the country. On the so-called "advertising Brexit" spend more than 100 million pounds - this is an unprecedented amount for such an event. Johnson, in particular, wants to organize the delivery of informational brochures to literally every home in Britain. Information blocks of a corresponding nature will also be placed on television, radio, and internet resources - again, at the expense of the British budget. In addition, Johnson formed the so-called "military office" (as he was christened in the press) - a working group of six ministers, each of whom is responsible for preparing for the hard Brexit in his own direction. Michael Gove, who announced this weekend that the country's exit without a deal has now become a "very real prospect," heads this group, so the British should be prepared for such a scenario. Dominic Raab, who is now heading the British Foreign Office, in turn, today acknowledged that London is accelerating preparations for the hard Brekzit, which will take place "in any case and in any weather" on October 31. According to him, at his today's meeting, the prime minister instructed the government to begin preparations for the implementation of this scenario, and the Cabinet of Ministers supported this idea. Here it is worth recalling that Boris Johnson, in the course of his first speech before the deputies of the House of Commons, demanded that Brussels abandon the backstop mechanism. At the same time, he reiterated that he is ready for Brexitwithout a deal if the EU does not agree to change the existing deal. Representatives of Europe, in turn, rejected the proposal (or rather, an ultimatum) Johnson, after which he gave the "green light" to the start of the preparatory campaign. Thus, the hard Brexit gradually acquires real features, and the market gradually realizes the reality of what is happening. If the Parliament does not intervene in this process, blocking Johnson's unhindered path to the implementation of this scenario, the pound will continue to fall. The closest support level now stands at 1.2180, which corresponds to the bottom line of the Bollinger Bands indicator on the monthly chart. The material has been provided by InstaForex Company - www.instaforex.com |
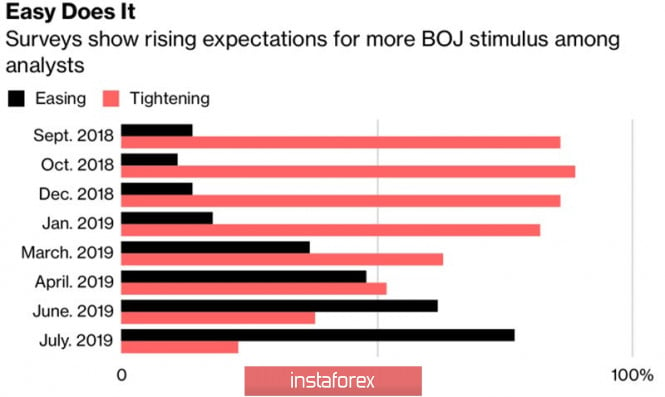
| Posted: 29 Jul 2019 03:50 PM PDT US GDP growth of 2.1% in the second quarter made it possible for the S&P 500 to rewrite record highs and somewhat dampened the enthusiasm of worshipers of the safe-haven. If the US economy is still strong and consumer spending has been expanding at the fastest rate since 2017, with global risk appetite, everything should be fine. Despite the longest economic expansion in the United States in history, unemployment at the lowest levels in half a century and strong macroeconomic statistics, the Fed is still going to reduce the rate for preventive purposes. True, the 25 bp market is hardly surprising. For a long time, it was believed that it was hopes for a weakening of monetary policy that were pushing up the US stock market, but employment, retail sales, industrial production and GDP convinced that everything was in order with the US economy. Yes, it is losing speed from the abnormally high at almost +3% in 2018 to normal. Apparently, the central bank will do everything possible so that the expansion continues. Contrast with other developed countries maintains a strong demand for the US dollar. Moreover, the main economic adviser Larry Kudlow said that the US president had abandoned the idea of currency interventions. The market calmed down, but not for long. Until Donald Trump said that he could make that decision in two seconds. The yen is heavily dependent on developments in the United States and in the global economy. The growth of the USD/JPY pair is directly related to the S&P 500 rally, the strengthening of the US dollar and the reduction in the likelihood of a federal funds rate cut by 50 basis points at the July FOMC meeting. In this regard, the Fed meeting and the release of data on the US labor market for July make it possible for the yen to claim the role of the most interesting currency of the week by August 2. Moreover, the BoJ will also issue its verdict on monetary policy. According to 77% of 47 Bloomberg analysts, the next step of the Bank of Japan will be monetary expansion, not tightening (in the June survey - 62%). 38 of them believe that there will be no monetary policy adjustments in July, 9 are counting on a signal to reduce the overnight rate in the future. BoJ Monetary Policy Predictions The market is actively discussing the topic regarding the Bank of Japan's limited opportunities. It already buys less assets than its policy provides, and negative rates harm the country's banking system. In this regard, the passivity of the regulator at the next meeting will be the first step towards restoring the "bearish" trend in USD/JPY. The second may be a modest reduction in the Fed rate on federal funds, the third - a weak statistics on the US labor market. Technically, the return of quotations of the analyzed pair to the limits of the downward trading channel and the simultaneous breakthrough of support at 108.1 will indicate the return of the initiative into the hands of sellers. In contrast, a successful assault of resistance at 108.95 activates the reversal wedge pattern and will increase the risk of a pullback. The material has been provided by InstaForex Company - www.instaforex.com |
| BTC 07.29.2019 - Downward pressure and new momentum down Posted: 29 Jul 2019 07:32 AM PDT Industry news: San Francisco-based US Capital Global Securities is dipping its toes into the world of cryptocurrencies and blockchain. The FINRA-licensed broker-dealer company on Monday announced that it is committing $10 million to NYCQ Fund LP, a private digital venture capital fund launched by CityBlock Capital. The firm said it is seeking accredited investors to back the capital, believing the fund's growing portfolio in the blockchain and cryptocurrency sector would put them at the forefront of the digital market period. Trading recommendation:
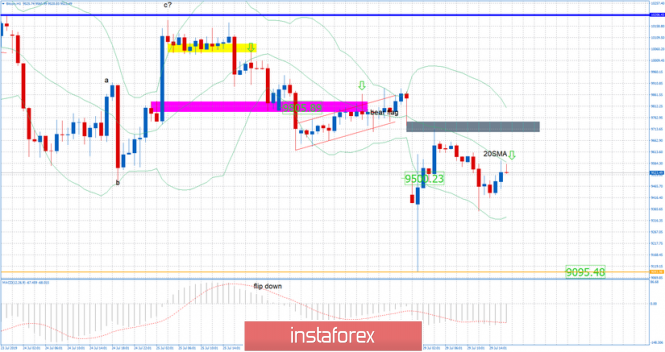
BTC did exactly what I expected last week. BTC did test our downward target at the price of $9.500 and it even went to $9.095. Buyers did try to react on the drop but maximum they got is to the middle of the Bollinger band. I still see more downside potential on the BTC. Watch for selling opportunities. The level of $9.564 looks like a solid sell zone. Green middle line – 20SMA Resistance Gray rectangle – Resitance ($9.713) Horizontal orange line – Support ($9.095) MACD oscillator is showing the new momentum low in the background and the BTC is trading in the negative territory, which confirms my bearish view. As long as the BTC is trading below $10.000, I would watch for selling opportunities on the rallies, level of $9.564 looks like a solid sell zone. Downward target is set at the price $9.095. The material has been provided by InstaForex Company - www.instaforex.com |
| EUR/USD for July 29,2019 - Bullish divergence on the MACD oscillator Posted: 29 Jul 2019 07:01 AM PDT Trading recommendation:
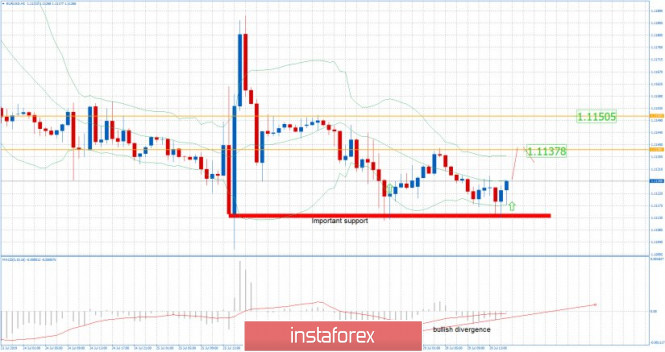
EUR did test very important support cluster at the price of 1.1112 but it found buyers, which is sign for me that there is a chance for the more upside. EUR is still trading within the range of the post ECB move from last week between the price of 1.1100 and 1.1186. Red rectangle – Important support (1.1112) Orange horizontal line – Resistance (1.1137) Orange rectangle – Resistance 2 (1.1150) MACD oscillator is showing the bullish divergence on the last 2 swing lows, which is sign for me that sellers got exhausted, which is good sign for the further upside. As long as the EUR is trading above the level of 1.1100, I would watch for buying opportunities. Upward targets are set at the price of 1.1137 and 1.1150. The material has been provided by InstaForex Company - www.instaforex.com |
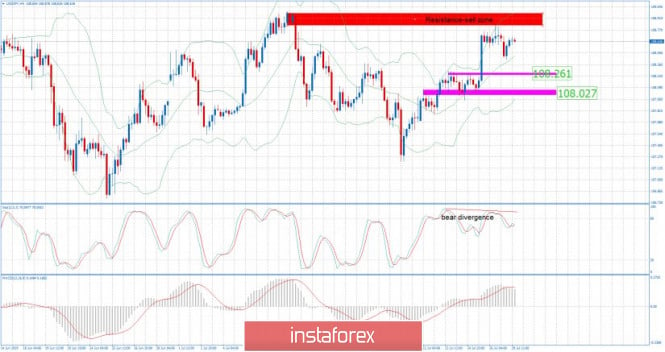
| USD/JPY analysis for July 29, 2019 - Selling opportunity near the strong resistance cluster Posted: 29 Jul 2019 06:47 AM PDT Trading recommendation:
USD/JPY is trading sideways at the price of 108.65 but near the very important resistance (sell zone) at the price of 108.82-108.95. My advice is to watch for potential selling opportunities as long as the JPY is trading below the 109.00. Red rectangle – Resistance 108.85 Pink rectangle – Support 1 (108.26) Pink rectangle – Support 2 (108.02) Stochastic oscillator is showing the bearish divergence on the most recent upward swings, which is sign that buyers became exhausted and that we might see downward movement in the future. On the MACD oscillator, I found decreasing on the upside momentum and that slow line did start to turn down, which is another sign of the potential downside. Watch for selling opportunities with the targets at 108.26 and 108.02.The material has been provided by InstaForex Company - www.instaforex.com |
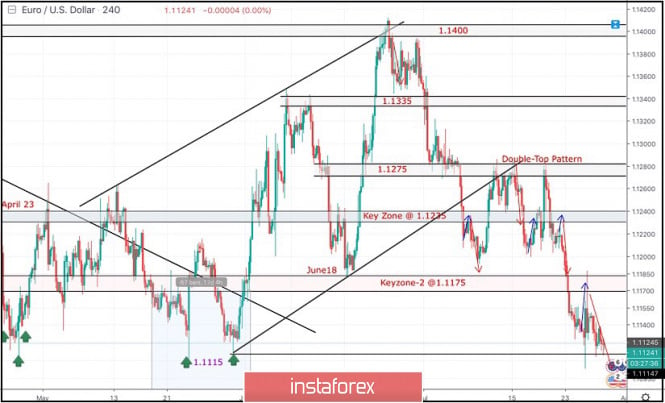
| July 29, 2019 : EUR/USD Intraday technical analysis and trade recommendations. Posted: 29 Jul 2019 06:46 AM PDT
Back in June 24, the EURUSD looked overbought around 1.1400 facing a confluence of supply levels. Thus, a bearish movement was initiated towards 1.1275 followed by a deeper bearish decline towards 1.1235 (the lower limit of the newly-established bullish channel) which failed to provide enough bullish support for the EUR/USD. In the period between 8 - 22 July, sideway consolidation range was established between 1.1200 - 1.1275 until a double-top reversal pattern was demonstrated around the upper limit. Recent Bearish breakdown of the pattern neckline confirmed the short-term trend reversal into bearish towards 1.1175. Fortunately, evident bearish momentum (bearish engulfing H4 candlestick) could bring the EURUSD back below 1.1235 which stands as an Intraday Supply zone to be watched for Intraday SELL entries upon any upcoming bullish pullback. HOWEVER, Early bearish breakdown below 1.1175 facilitated further bearish decline towards 1.1115 (Previous Weekly Low) where evident bullish rejection was recently demonstrated on July 25. That's why, Intraday bullish pullback was demonstrated towards 1.1175-1.1200 where a valid SELL entry was suggested in a previous article. It's already running in profits. Today, Bearish persistence below 1.1115 is mandatory to allow further bearish decline initially towards 1.1025. Otherwise, the EUR/USD remains trapped between the depicted zones (1.1115-1.1175 until breakout occurs in either direction). Trade recommendations : Intraday traders who missed the initial trade, another SELL entry can be taken upon bearish breakdown below 1.1115 with initial bearish target around 1.1075 & 1.1025. The material has been provided by InstaForex Company - www.instaforex.com |
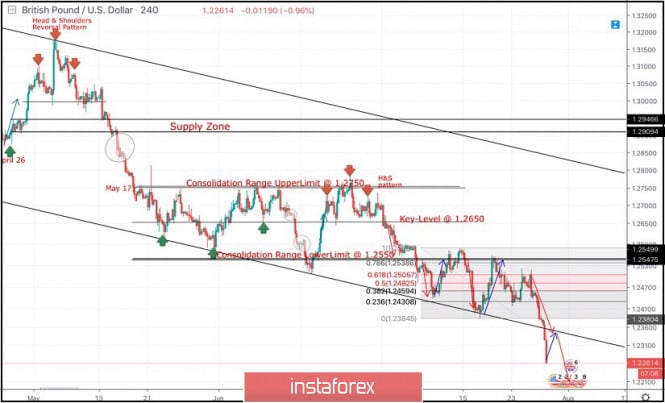
| Posted: 29 Jul 2019 06:20 AM PDT
Since May 17, the previous downside movement within the depicted bearish channel came to a pause allowing the recent sideway consolidation range to be established between 1.2750 - 1.2550 with a prominent key-level around 1.2650. On July 5, a bearish range breakout was demonstrated below 1.2550 (the lower limit of the depicted consolidation range). Hence, quick bearish decline was demonstrated towards the price zone of 1.2430-1.2385 (where the lower limit of the movement channel came to meet the GBPUSD pair). In July 18, a recent bullish movement was initiated towards the backside of the broken consolidation range (1.2550) where another valid SELL entry was offered two weeks ago. As anticipated, bearish persistence below 1.2460 (38.2% Fibonacci levels) and 1.2430 (38.2% Fibonacci Level) enhanced further bearish decline towards 1.2350. Moreover, Bearish breakdown below 1.2350 facilitated further bearish decline towards 1.2320 and 1.2270 which correspond to significant key-levels on the Weekly chart. The current price levels are quite risky/low for having new SELL entries. That's why, SELLERS should have their profits gathered around the current price levels. Currently, The price zone of 1.2350 - 1.2380 now stands as a prominent SUPPLY zone to be watched for new SELL positions if any bullish pullback occurs soon. Trade Recommendations: Intraday traders should look for early signs of bullish rejection around the current price levels for a counter-trend BUY entry Conservative traders should wait for a bullish pullback towards 1.2350 - 1.2380 for new SELL entries. S/L should be placed above 1.2430. Initial T/P level to be placed around 1.2279. The material has been provided by InstaForex Company - www.instaforex.com |
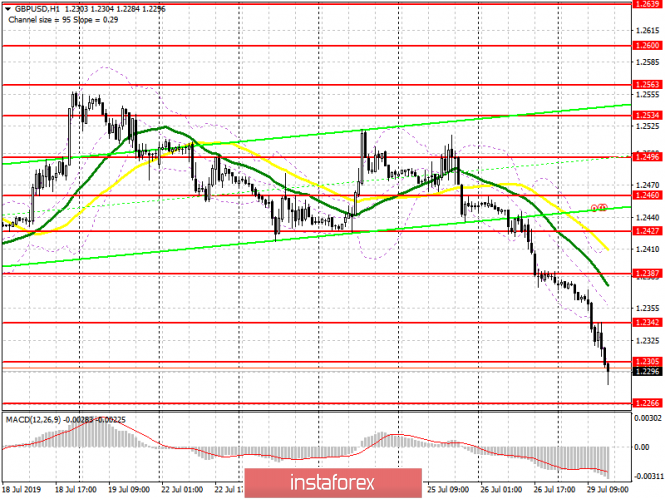
| Posted: 29 Jul 2019 05:24 AM PDT To open long positions on GBP/USD, you need: The British pound continued its fall, which was formed at the end of last week after it became known about the formed British Cabinet, in which the majority is supporters of the hard Brexit. Today's series of fundamental statistics on the UK economy has been completely ignored by the market. Buyers missed the level of 1.2342 and also risk to miss the support of 1.2305, the breakdown of which is now being formed. The main hope for a new minimum in the area of 1.2266, and it is not a fact that someone will try to buy another false bottom. If we talk about the correction scenario for the second half of the day, it is best to count on long positions after returning to the resistance of 1.2305, which will lead to larger profit-taking and an increase in GBP/USD to the level of 1.2342, where I recommend taking the profit. To open short positions on GBP/USD, you need: The bears confidently fixed below the level of 1.2342, which is clearly seen on the chart, and continue to sell the pound. The breakout of the support at 1.2305 and keeping this level in the second half of the day will allow forming another bearish wave to the lows at 1.2266 and 1.2206, where I recommend taking the profit. If an upward correction is formed in the market, which sooner or later should occur, then when returning to the resistance of 1.2305, it is best to return to short positions very cautiously from the level of 1.2342, or sell more boldly from the maximum of 1.2387, where even speculative buyers will leave the market. Indicator signals: Moving Averages Trading is below 30 and 50 moving averages, which indicates a further decline in the pair. Bollinger Bands In the case of an upward correction, the average border of the indicator in the area of 1.2355 will act as a resistance.
Description of indicators
|
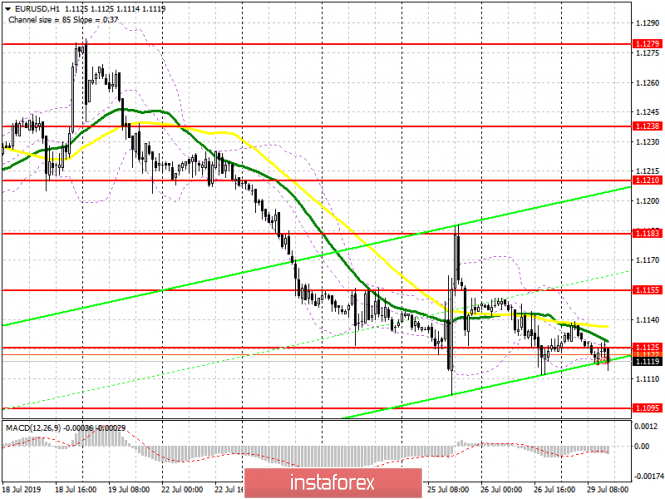
| Posted: 29 Jul 2019 05:24 AM PDT To open long positions on EURUSD, you need: The European Central Bank's decisions last week surprised the markets, and now the move is for the US Federal Reserve. While there is uncertainty in the market, volatility will continue to remain low with a small advantage on the side of euro sellers. At the moment, trading is below the level of 1.1125, which is the middle of the channel, and buyers need to return to this range. This will allow us to expect an upward correction to the resistance area of 1.1155 and to update the upper boundary of the side channel of 1.1183, where I recommend taking the profit. However, the lack of important fundamental statistics today will continue to put pressure on the euro. In this scenario, it is best to look at the purchases on the test of a new monthly minimum in the area of 1.1095. To open short positions on EURUSD, you need: Bears shifted the market to the level of 1.1125 and formed resistance there. While trading is below this range, we can expect the continuation of the downward trend, which will lead to the exit of EUR/USD to new local lows in the area of 1.1095 and 1.1068, where I recommend taking the profit. In the scenario of returning buyers to the resistance level of 1.125 to short positions, it is best to return to a false breakout from the resistance of 1.1155 or sell from a larger maximum of 1.1183. In the second half of the day, no important reports are planned, so in the absence of constant pressure on the pair and its decline at the beginning of the North American session, the bears can retreat from the market, which will lead to a small upward correction and maintain low volatility until tomorrow. Indicator signals: Moving Averages Trading is conducted in the area of 30 and 50 moving averages, which indicates the lateral nature of the market. Bollinger Bands Volatility is low, which does not give signals to enter the market.
Description of indicators
|
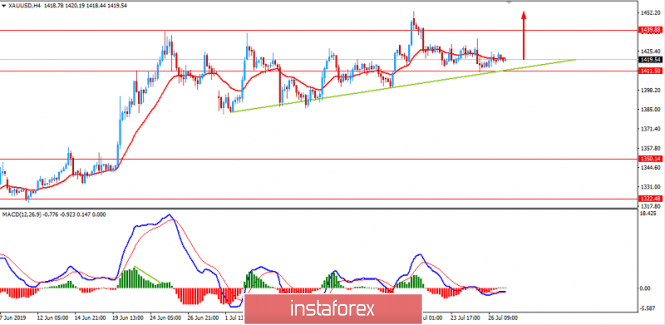
| Analysis of gold for July 29, 2019 Posted: 29 Jul 2019 04:40 AM PDT Gold continued its rally and surged above $1,410 but failed to surpass the $1,440 resistance level and head towards $1,500. Gold fell by 0.50% last week after suffering its sharpest one-day slide in three weeks when the ECB decided to hold on to the rates instead of expected rate cuts this year. The ECB addressed the shortcomings and challenges for the economy but decided to let the rate cut to be delayed till early 2020. Markets' attention this week will be on the highly-anticipated US Federal Reserve meeting on July 30-31, where traders expect the Fed to cut rates by at least 25 basis points. This scenario will provide support to the yellow metal. This way, gold may be able to break above the $1,440 strong resistance area and head towards $1,500. The safe-haven gold did not benefit from falling Asian stock markets despite concerns surrounding Hong Kong political crisis and uncertainty regarding the developments in the US-Sino trade talks. In spite of the recent flat movement of gold, central banks from different countries are showing interest in buying it as the global economic crisis is progressing. The global search of safe assets has currently touched the Crypto market. Therefore, gold is not likely to continue its growth. TECHNICAL OVERVIEW: Currently, the price is above $1,410 held by the trend line formed since July 1. The price is forming an Ascending Triangle pattern, while $1,440 is strong resistance. As the recent higher highs indicate, the price kept on climbing higher. Meanwhile, the fact that there is no Bearish Divergence points at the further rally. As far as the price remains above $1,400 with a daily close, the bullish bias is expected to continue and gold to move towards $1,500. TECHNICAL LEVELS: SUPPORT- 1,380 / 1,400 / 1,410 RESISTANCE- 1,440 / 1,450 / 1,500 BIAS- Bullish MOMENTUM- Volatile
|
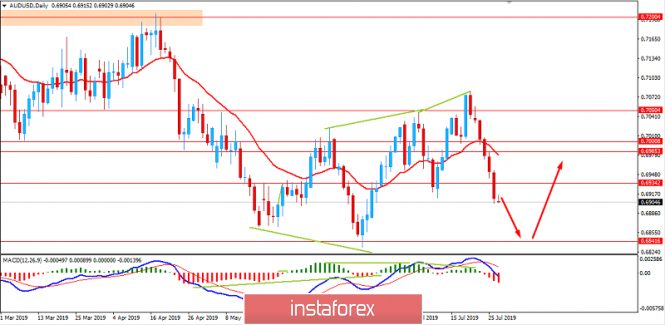
| Analysis of AUD/USD for July 29, 2019 Posted: 29 Jul 2019 04:39 AM PDT AUD/USD has been impulsive and non-volatile under recent bearish pressure which pushed the price below 0.70 with a daily close again. the pair is going through corrections amid extreme volatility as traders are betting on a rate cut of at least 25 basis points at the Fed's policy meeting slated for July 30-31. AUD fell last week versus its American rival mainly due to the greenback's advance in light of better-than-expected flash US GDP data. US economic growth expanded 2.1% in Q2 on a quarterly basis, stronger than the forecast of 1.8%. AUD is trading under higher volatility because of the quarterly CPI data released on Wednesday. Indicating the change in the price of goods and services purchased by consumers, the CPI accounts for most of the overall inflation. Retail sales figures are also due on Friday. The CPI is expected to increase from 0.0% to 0.5% while retail sales are expected to grow from 0.1% to 0.3%. These figures will indicate the change in the total value of sales, which accounts for most of the overall economic activity. Moreover, the slowdown in China's economy spooks investors away from the Australian economy which is heavily dependent on exports of raw materials to China. There is every reason to assume that the trade conflict between China and the United States will continue for a long time, so it will force the RBA to soften monetary policy to maintain the Australian economy under unfavorable conditions. On the other hand, the US economy is expected to slow down almost twice. Therefore, there is every reason to expect that this indicator corresponds to the real one. Earlier, data on the reduction in the number of applications for unemployment benefits and the growth of orders for durable goods contributed to USD strength. A decline in business activity in the manufacturing sector to 50 pips subdued growth. USD received a boost from stronger-than-expected US GDP for Q2. The Core Durable goods orders also beat the expectation of 0.2%, coming at 1.2%. The increase was higher than 0.7% in the consensus, but the decline in May also turned out to be deeper than initially reported. This week will be significant for USD as the Fed's policy meeting will determine its further trajectory. The FOMC Press Conference with a policy update will be highly interesting as the prediction is a rate cut of 0.25. The non-farm payrolls are expected to decrease from 224k to 160k while the unemployment rate is likely to be unchanged at 3.7%. TECHNICAL OVERVIEW: The price is heading towards 0.6850 support area following an impulsive bearish preceding trend. Analyzing the current price formation, the price is expected to push towards 0.6850 but certain bullish momentum is also expected as a bullish intervention is imminent after the rate cut by the Federal Reserve. So, the price could climb above 0.70 again and regain the bullish momentum in the coming days. This week is going to be crucial for understanding the upcoming definite price momentum of this pair. AUD is expected to have the upper hand if the US central bank lowers the official funds rate.
|
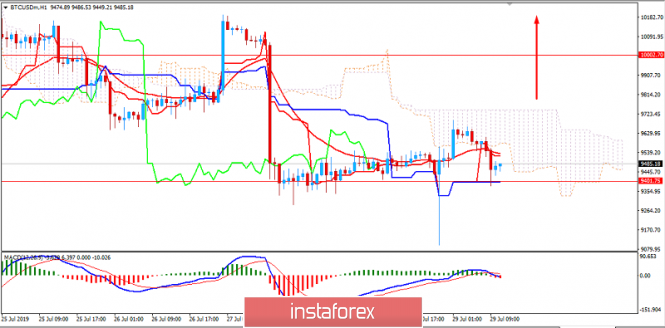
| Analysis for July 29, 2019: Bitcoin finds strong support at $9,400 Posted: 29 Jul 2019 04:38 AM PDT Bitcoin has managed to gain certain bullish momentum, rejecting off $9,400 area and sustaining the overall bullish bias in the market. It struggled to sustain the current price momentum, but the price above $9,000 indicates the bullish bias is intact and the price has a greater chance of pushing higher in the process. This recent price action has signaled that bears are currently in full control of the cryptocurrency market. Unless bulls gather strength, bitcoin may face an incredibly weak weekly close that spells trouble for the weeks and months ahead. Bitcoin's bearish price action as of late was first sparked by its parabolic ascent towards $11,000 that occurred last weekend. Over the past several weeks, bitcoin has been setting lower highs on a fairly consistent basis. This trend began in late June when the crypto finished its parabolic rise with a sharp movement towards $13,800 which remains the 2019 high. Recently, the popular cryptocurrency derivatives exchange was revealed to be under investigation by the U.S. Commodity Futures Trading Commission (CFTC). Besides, an equivalent authority in the UK, the Financial Conduct Authority (FCA), purportedly unveiled plans to restrict access to BitMEX's suite of products and similar vehicles. Due to this unfortunate set of news, the Bitcoin platform began to see less volume and capital flight, as investors using the exchange presumably weren't all too pleased with the encroaching regulatory presence. As of the current scenario, bitcoin is currently on the verge of indecision whereas the bears are the dominant party in the market participants. Though the bullish bias seems still intact as the price remains above $9,000 area, bears are still the stronger party in the market which could even push the price lower towards $8,500 again. A break above $10,000 is required for continuation of the bullish momentum as per the current market sentiment. TECHNICAL OVERVIEW: The price found strong support at $9,400 area from where there has been several strong bearish rejections signaling the presence of bulls in the process. Though the price is showing certain bullish intervention evidence, being below $10,000 also indicates the dominance of bears along the way. As the price remains above $9,000 area, the bullish bias is expected to be sustained but a break above $9,600 is required for a further rise towards $10,000 to resume the bullish trend. TECHNICAL LEVELS: SUPPORT- 8,500, 8,800, 9,000, 9,400 RESISTANCE- 9,800, 10,000, 10,500, 11,000 BIAS- Bearish MOMENTUM- Volatile
|
| Analysis of BITCOIN for July 29, 2019 Posted: 29 Jul 2019 04:38 AM PDT Bitcoin gained bullish pressure having rebounded from $9,400 recently. The price sustained the overall bullish bias in the market. The price settled up at the level above $9,000 that indicates that the bullish bias is intact and price has a greater chance to climb higher. This recent price action signals that bears are setting the tone in the market for a while. Bitcoin could face an incredibly weak weekly close that spells trouble for weeks and months ahead. The latest bearish price action was first sparked by its parabolic ascent towards $11,000 that occurred last weekend. Over the past several weeks, Bitcoin has been making lower highs on a fairly consistent basis. This trend began in late-June when the cryptocurrency finished its stellar climb with a sharp movement towards $13,800, which remains the 2019 high. Recently, the popular cryptocurrency derivatives exchange was reported to be under investigation by the US Commodity Futures Trading Commission (CFTC). Besides, an equivalent authority in the UK, the Financial Conduct Authority (FCA), unveiled plans to restrict access to BitMEX's suite of products and similar trading instruments. Due to this unfortunate set of news, the Bitcoin platform began to shrink in a volume and saw capital flight as investors using the exchange presumably weren't all too pleased with the encroaching regulatory presence. Meanwhile, market sentiment on Bitcoin is currently uncertain whereas the bears are the dominant party in the market. Though the bullish bias seems still intact as the price remains above $9,000, the bears are still the stronger party in the market which could even push the price lower towards $8,500 again. A break above $10,000 is required for further continuation of the bullish momentum as per current market sentiment. TECHNICAL OVERVIEW: The price found strong support at $9,400 from where there has been several strong bearish rejections signaling the presence of bulls in the market. Though the price is proving bullish intervention, trading below $10,000 also indicates the dominance of bears along the way. As the price remains above $9,000, the bullish bias is expected to sustain. However, a break above $9,600 is required as a springboard for a jump above $10,000 to resume the bullish run. TECHNICAL LEVELS: SUPPORT - 8,500, 8,800, 9,000, 9,400 RESISTANCE - 9,800, 10,000, 10,500, 11,000 BIAS - Bearish MOMENTUM - Volatile
|
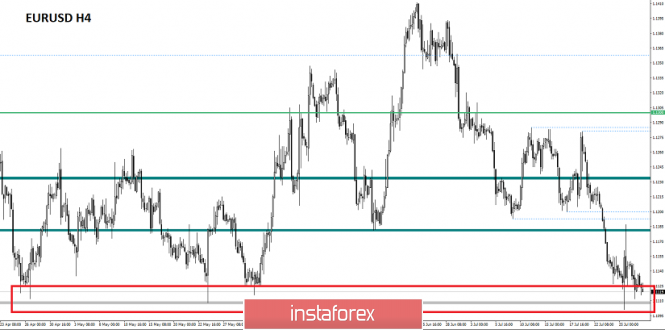
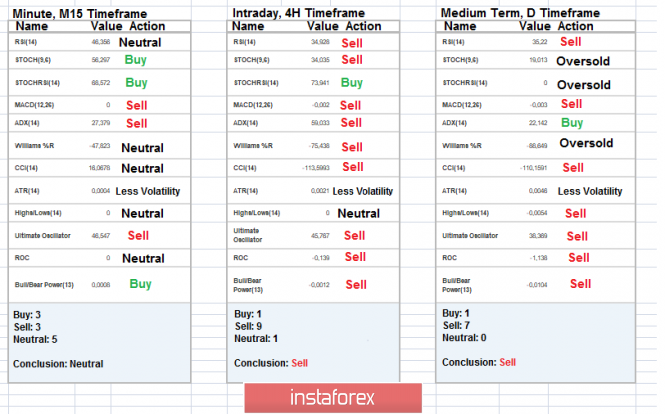
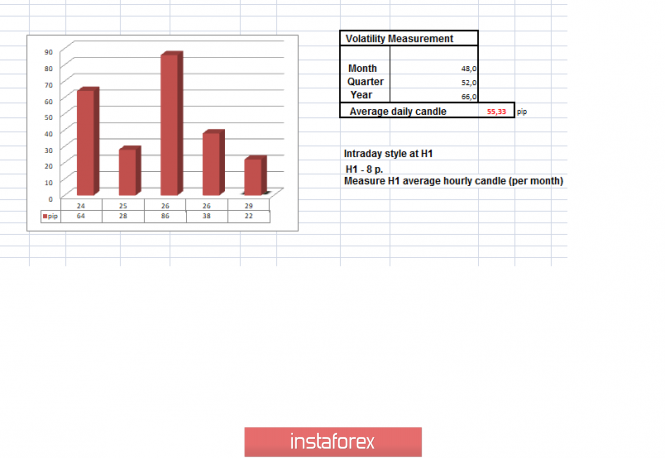
| Trading recommendations for the EURUSD currency pair - placement of trading orders (July 29) Posted: 29 Jul 2019 04:34 AM PDT The euro / dollar currency pair showed a low volatility of 38 pips by the end of the last trading week, but this was enough to keep the quote within the key value. From the point of view of technical analysis, we see a moderate fluctuation within the pivot point 1,1100, forming an accumulation in the market. As discussed in the previous review, traders took a waiting position, covering all previously opened deals. The reason for so many cardinal moves is simple, there are many nuances that could make adjustments to short positions, so it's better to close and wait a bit. Considering the trading chart in general terms (daily timeframe), we see that the quotation is at the level of 1.1100, which keeps the clock frequency in terms of restoring the global downward trend. The focus of the news background on Friday, of course, was the data on GDP (Q2) of the United States, where they expected a slowdown in economic growth from 3.1% to 1.8%. As a result, we received a slowdown, but not, as predicted, up to 1.8%, but up to 2.1%. Against this background, the US currency managed to resist heavy losses, and as a fact, the quote returned to the limits of the previously found point of support. The restraint of traders is certainly felt, and, most likely, the reason for this is the upcoming Fed meeting, where clarifications are waiting and, as an option, a possible reduction in the key rate. We return to the information background, but here, in principle, everything is quiet. Everyone is moving away from the hype associated with the ECB. According to Brexit, everything goes on as usual. Nothing has changed in the rhetoric of Boris Johnson, only plans to allocate £ 100 billion for an advertising campaign, Today, in terms of the economic calendar, we have an empty economic calendar, thereby all hope for the information background. Further development Analyzing the current trading chart, we see an amplitude fluctuation of 1.1110 / 1.1140, which reflects the indecision on the market. Traders, in turn, continue to be out of the market due to the emerging uncertainty. If we consider everything that happens in general terms, then, of course, there is a characteristic oversoldness, with the fear of the upcoming Fed meeting. For this reason, the only thing that can be done is to analyze the points of fixation and make a layout of possible development options. Based on the available information, it is possible to decompose a number of variations, let's consider: - We consider the positions for purchase in the case of price fixing higher than 1,1150. - We consider selling positions after clearly fixing the price lower than 1,1100. Indicator Analysis Analyzing a different sector of timeframes (TF), we see that indicators in the short term are changeable in themselves, signaling a neutral interest. To a greater extent, this is due to stagnation. Intraday and medium term retained a downward interest in the market due to the general background. Weekly volatility / Measurement of volatility: Month; Quarter; Year Measurement of volatility reflects the average daily fluctuation, based on monthly / quarterly / year. (July 29 was based on the time of publication of the article) The current time volatility is 22 points. It is likely to assume that in the case of continued bumpiness along the level of 1.1100, volatility will remain low. Key levels Zones of resistance: 1.1180 *; 1,1300 **; 1.1450; 1.1550; 1.1650 *; 1.1720 **; 1.1850 **; 1.2100 Support areas: 1,1100 **; 1.1000 ***; 1,0850 ** * Periodic level ** Range Level *** Psychological level **** The article is based on the principle of conducting a transaction, with daily adjustment The material has been provided by InstaForex Company - www.instaforex.com |
| You are subscribed to email updates from Forex analysis review. To stop receiving these emails, you may unsubscribe now. | Email delivery powered by Google |
| Google, 1600 Amphitheatre Parkway, Mountain View, CA 94043, United States | |





No comments:
Post a Comment