Forex analysis review |
- EURUSD under pressure challenges major support
- Gold price challenges important medium-term support
- July 5, 2019 : EUR/USD Intraday technical analysis and trade recommendations.
- July 5, 2019 : GBP/USD Intraday technical analysis and trade recommendations.
- EUR / USD plan for the US session on July 5. Data on US labor market will determine market direction
- EUR/USD for July 05,2019 - New momentum down on the euro
- Gold 07.05.2019 - Big domination of sellers
- Do not throw a dollar, it is still useful!
- BTC 07.05.2019 - Broken falling wedge, more downside yet to come
- Upgrade: Experts predict rise in Gold prices
- Dollar bulls and bears may be left with nothing
- Simplified wave analysis and forecast for USD / JPY and AUD / USD pairs on July 5
- BITCOIN struggle below $12,000 indicates downturn? July 5, 2019
- Analysis of GBP/CHF for July 5, 2019: Pound to gain ground ahead of GDP data
- Trading Plan 07/05/2019 EURUSD
- Gold to reach $1,380 again? July 5, 2019
- EUR/JPY: JPY to hold upper hand over EUR? July 5, 2019
- Technical analysis of USD/CHF for July 05, 2019
- Technical analysis of AUD/USD for July 05, 2019
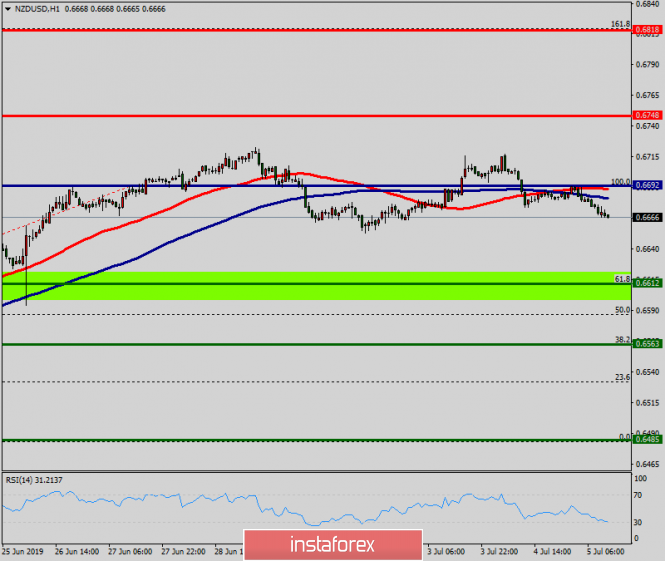
- Technical analysis of NZD/USD for July 05, 2019
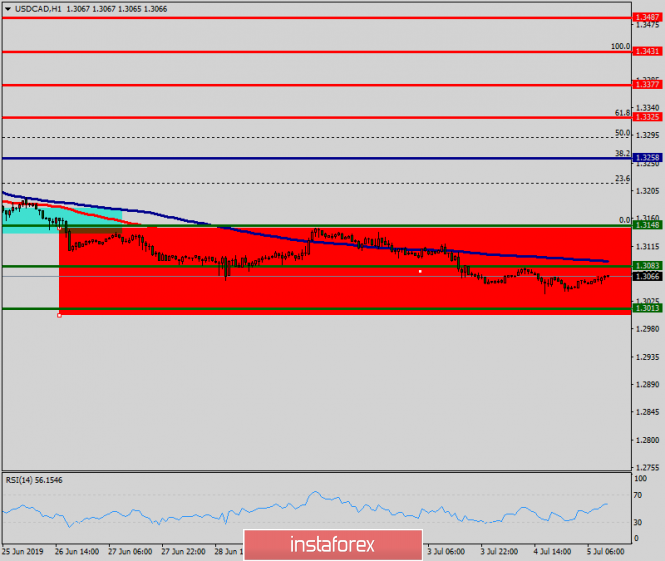
- Technical analysis of USD/CAD for July 05, 2019
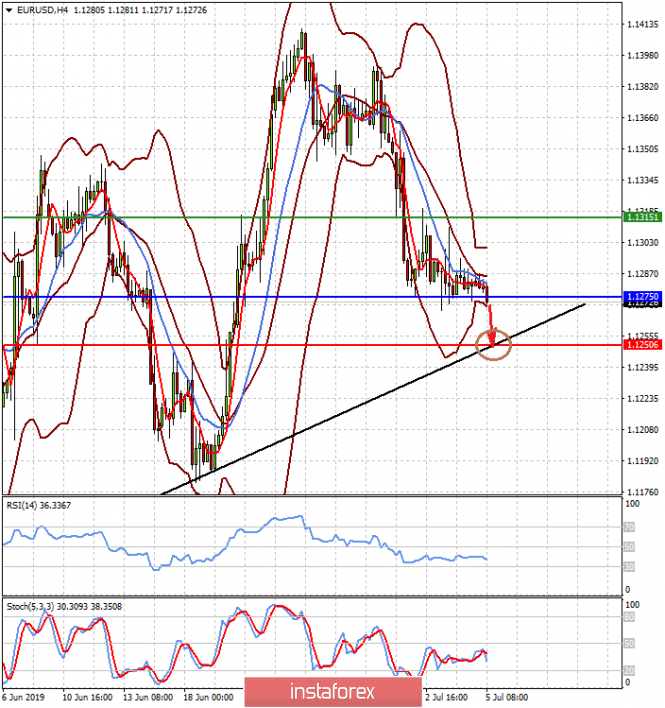
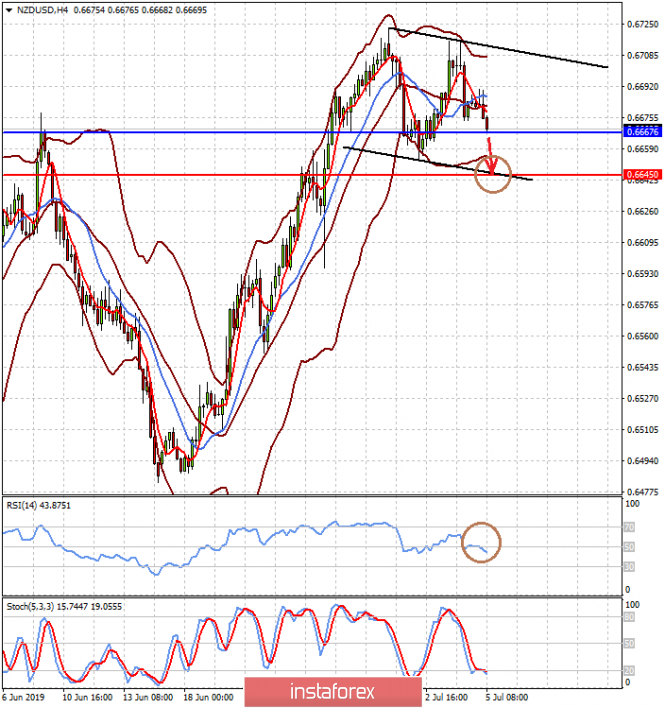
- Focus of the market will be on the US employment data today (We expect a local decline in EUR/USD and NZD/USD pairs)
- EUR/USD testing its intermediate support, potential drop if broken!
- USD/CAD bounced off support, potential further rise!
- USD/JPY approaching resistance, possible drop!
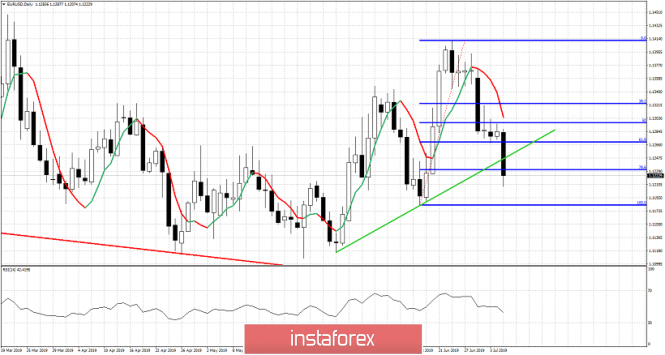
| EURUSD under pressure challenges major support Posted: 05 Jul 2019 09:29 AM PDT EURUSD is trading right above 1.12 and has broken critical trend line and Fibonacci levels. Bulls need to step in now in order to save the bullish scenario. Otherwise the bears regain medium-term trend control.
EURUSD has broken the 61.8% Fibonacci retracement. Price has broken also the upward sloping green trend line support connecting the last two important lows. These are bearish signs. Bulls need to recover price soon and bring it back above 1.13 if they want to keep their hopes alive for a move towards 1.14-1.15. Major support ahead at 1.1180. Breaking below it will put 1.11 in danger and will push price towards 1.10. Resistance remains at 1.13-1.1320. Breaking it will bring bulls back in control of the short-term trend. The material has been provided by InstaForex Company - www.instaforex.com |
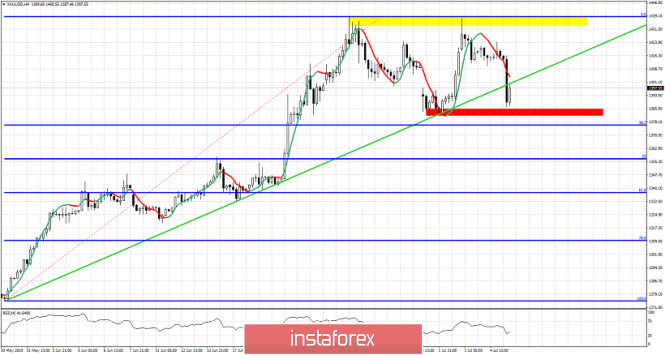
| Gold price challenges important medium-term support Posted: 05 Jul 2019 09:24 AM PDT Gold price has moved towards $1,390-$1,400 as expected and is challenging the recent lows at $1,393. Breaking below this level will open the way for a move towards $1,335-$1,300, as price has also broken below important trend line support. Bulls need to act now if they want to save the short-term trend.
Yellow rectangle - double top resistance Red rectangle - short-term support Gold price looks vulnerable. The first warning signs came with the double top and rejection. Price has broken the green trend line support. This is another bearish signal. If the red rectangle breaks also, we expect price to move towards $1,335-$1,300 area. Short-term trend is bearish. Bulls need to recover from current levels if they want to avoid a deeper pull back. The material has been provided by InstaForex Company - www.instaforex.com |
| July 5, 2019 : EUR/USD Intraday technical analysis and trade recommendations. Posted: 05 Jul 2019 08:05 AM PDT
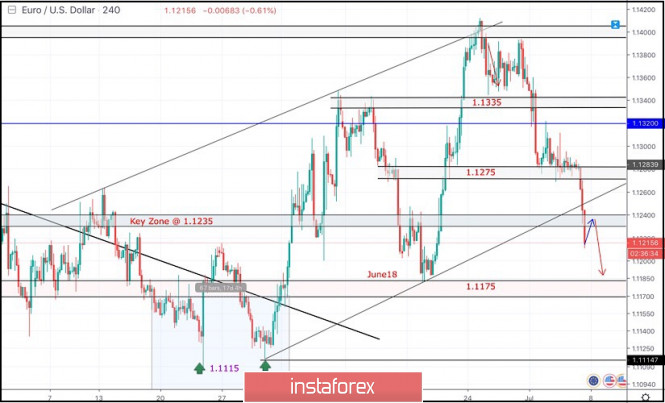
Since February 28, the EURUSD pair has been moving within the prvious downside channel with slight bearish tendency. Short-term outlook turned to become bearish towards 1.1175 (a previous weekly bottom which has been holding prices above for some time. On the highlighted period between (May 17th and June 5th), temporary bearish breakdown below 1.1175 was demonstrated on the chart. This allowed further bearish decline to occur towards 1.1115 where significant bullish recovery brought the EUR/USD pair back above 1.1175 which stands as a prominent DEMAND level until now. Initially, Temporary Bullish breakout above 1.1335 was demonstrated (suggesting a high probability bullish continuation pattern). However, the EURUSD pair has failed to maintain that bullish persistence above 1.1320 and 1.1275 (the depicted price levels/zones). This was followed by a deeper bearish pullback towards 1.1175 where significant bullish price action was demonstrated on June 18. The EURUSD looked overbought around 1.1400 facing a confluence of supply levels. Thus, a bearish pullback was initiated towards 1.1275 as expected in a previous article. Further Bearish decline below 1.1275 enhanced a deeper bearish decline towards 1.1235 (the lower limit of the newly-established bullish channel) which is failing to provide enough bullish support for the EURUSD. The current bearish breakdown below 1.1235 invites further bearish momentum to push towards 1.1175 where recent price action should be watched. Trade recommendations : For Intraday traders, a valid SELL entry can be considered anywhere at retesting of the broken key-zone near 1.1235. Initial Target levels to be located around 1.1200 and 1.1175. Bullish breakout above 1.1260 invalidates the mentioned SELL position. The material has been provided by InstaForex Company - www.instaforex.com |
| July 5, 2019 : GBP/USD Intraday technical analysis and trade recommendations. Posted: 05 Jul 2019 07:37 AM PDT
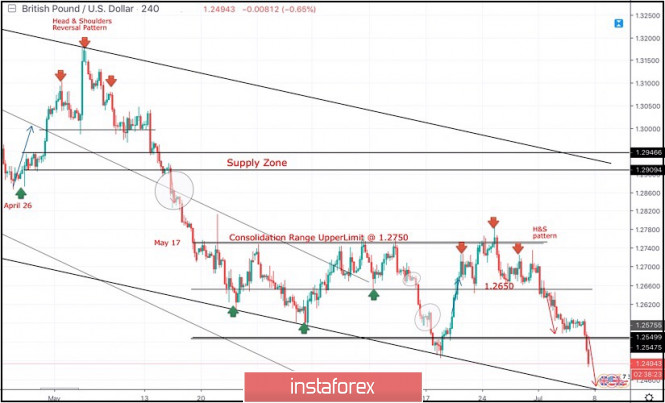
Since May 17, the previous downside movement within the depicted bearish channel came to a pause allowing the recent sideway consolidation range to be established between 1.2750 - 1.2550 with a prominent key-level around 1.2650. On June 4, temporary bullish consolidations above 1.2650 were demonstrated for a few trading sessions. However, the price level of 1.2750 (consolidation range upper limit) has prevented further bullish advancement. Moreover, early signs of bearish rejection have been manifested (Head & Shoulders reversal pattern with neckline located around 1.2650). A quick bearish pullback towards 1.2650 was expected shortly. Bearish breakdown below 1.2650 (reversal pattern neckline) confirmed the reversal pattern with bearish projection target located at 1.2550 and 1.2510. Short-term outlook remains under bearish pressure as long as the market keeps moving below 1.2650 (mid-range key-level and neckline of the reversal pattern). In general, the recent Bearish breakdown below 1.2570 - 1.2550 (the lower limit of the depicted consolidation range) confirms a trend reversal into bearish on the intermediate term. Immediate bearish decline was expected towards 1.2505 - 1.2490. Further bearish decline is expected to pursue towards 1.2444 (the lower limit of the current movement channel). On the other hand, any bullish pullback towards 1.2550-1.2570 should be considered as a valid SELL signal for Intraday traders. On the other hand, a bullish position can ONLY be considered if EARLY Bullish persistence above 1.2570 is re-achieved on the current H4 chart. Trade Recommendations: Intraday traders can have a valid SELL Entry anywhere around the lower limit of the broken consolidation range near (1.2550-1.2570). T/P levels to be located around 1.2490 and 1.2440. S/L should be placed above 1.2620. The material has been provided by InstaForex Company - www.instaforex.com |
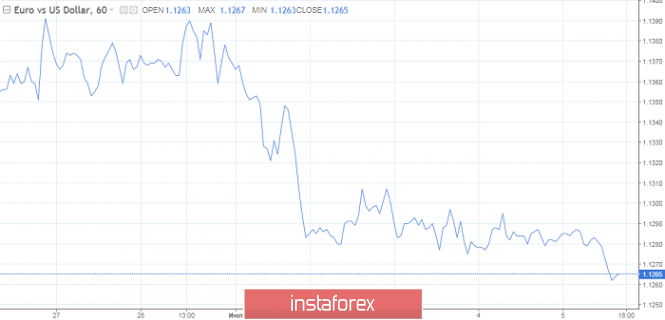
| EUR / USD plan for the US session on July 5. Data on US labor market will determine market direction Posted: 05 Jul 2019 07:09 AM PDT To open long positions on EUR/USD pair, you need: Buyers missed the level of 1.1275 and further upward movement of the pair will directly depend on it. Only a return to the second half of the day, together with a weak report on the American labor market, will allow the bulls to get to the maximum of 1.1307 in view of a further update of the resistance levels of 1.1338 and 1.1364, where I recommend taking profits. If the bears continue to push the pair down, it is best to look at long positions from a low of 1.1239. To open short positions on EUR/USD pair, you need: Sellers made their way to the level of 1.1275 but now, we need a strong report on the US labor market. This will keep the bearish mood of the pair and lead to the minima of 1.1239 and 1.1207, where I recommend taking profits. If the equilibrium returns to the market after the report and the bulls climb back to the resistance of 1.1275, it is best to return to short positions on a test of 1.1310 maximum or on a rebound from a larger area of 1.1338. Indicator signals: Moving averages Trade is conducted below 30 and 50 moving averages, which indicates a possible bear market persistence, but much will depend on US data. Bollinger bands The growth of EUR/USD pair is limited by the upper boundary of the indicator in the region of 1.1295. Description of indicators MA (moving average) 50 days - yellow MA (moving average) 30 days - green MACD: fast EMA 12, slow EMA 26, SMA 9 Bollinger Bands 20 The material has been provided by InstaForex Company - www.instaforex.com |
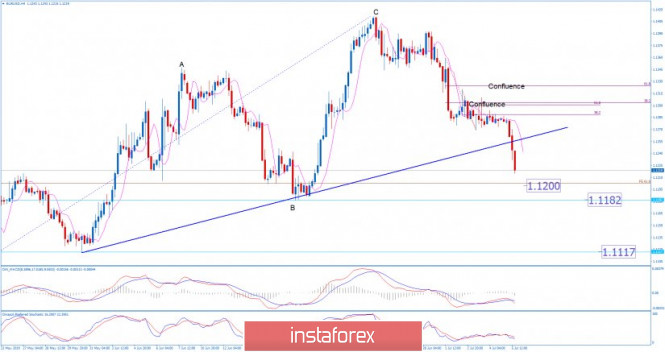
| EUR/USD for July 05,2019 - New momentum down on the euro Posted: 05 Jul 2019 07:08 AM PDT The EUR has been trading exactly what I expected yesterday after the growth rose in June well above expectation. The price is heading towards my first target at the price of 1.1200 and also the round number. Watch for levels 1.1200-1.1182 for potential retracement but in case of the down break, downward target will be set at 1.117.
On the 4H time-frame I found that there is bear cross on the Stochastic and MACD, which represents short-term downtrend. Fibonacci expansion target is set at $1.1200 (FIB 61.8%). Additionally, there is the breakout of the upward trendline (blue trendline), which is another clue that we got today that sellers are in big domination. As long as the EUR is trading below the 1.1320, I would watch for selling opportunities on the rallies with the targets at 1.1200, 1.1182 and 1.1117. The material has been provided by InstaForex Company - www.instaforex.com |
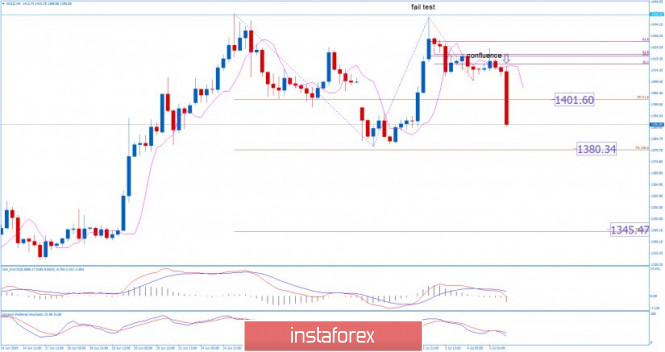
| Gold 07.05.2019 - Big domination of sellers Posted: 05 Jul 2019 06:55 AM PDT The Gold has been trading exactly what I expected yesterday after the growth rose in June well above expectation. The price filed my first downward target at $1.401 and it going towards second at $1.380. I see still more downside potential on the Gold.
On the 4H time-frame I found that there is bear cross on the Stochastic and MACD, which represents short-term downtrend. Fibonacci expansion target at $1.400 (FIB 61.8%) is broken and I do expect testing of second target at $1.380 (FIB 100%). Potential breakout of the $1.380 may lead us to the level of $1.345. Momentum is very strong on the downside and any decent upward correction on the lower frames 30M/1H may serve like a good selling opportunity. Botch stochastic and macd are heading downward and there is no indication of any reversal. The material has been provided by InstaForex Company - www.instaforex.com |
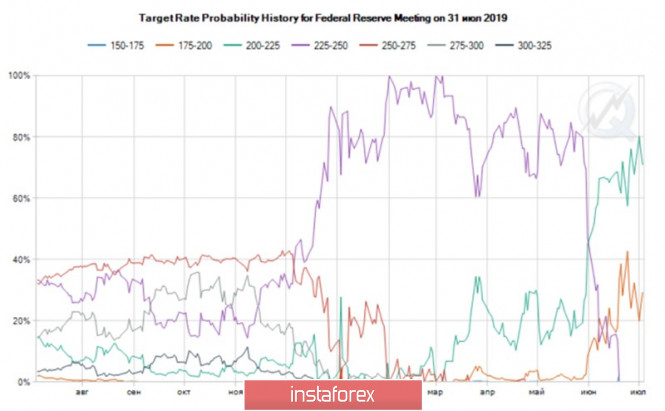
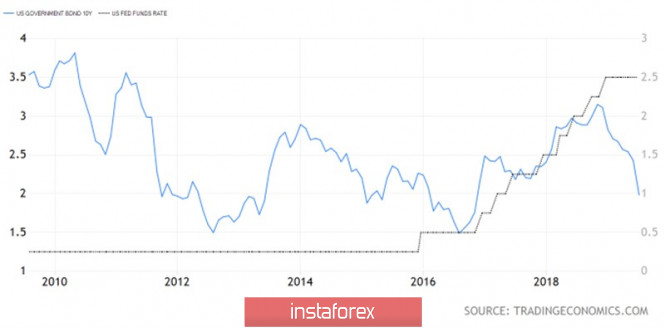
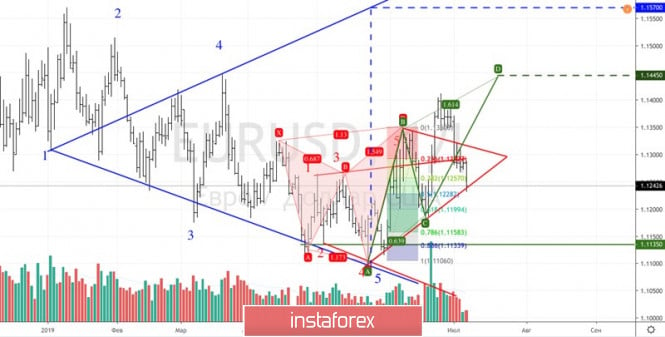
| Do not throw a dollar, it is still useful! Posted: 05 Jul 2019 06:49 AM PDT In determining currency exchange rates, the direction of movement of central bank rates is not the only thing important but also their potential to change. If back in 2015-2016, the ECB weakened monetary policy and the Fed tightened, the EUR/USD pair naturally fell. In 2017, Mario Draghi started talking about normalization and the market took this as a signal for euro purchases. Indeed, the growth potential of the refinancing rate seemed much greater than the federal funds rate. At the end of June, the single European currency strengthened against the US dollar on rumors that the ECB's potential for monetary expansion is far more limited than the Fed's arsenal. The US employment report should have answered the question of where we are going. The rise of non-farm payrolls in June to 224 thousand allowed the EUR/USD "bears" to launch an offensive, although a modest increase in average wages by 0.2% m / m and an increase in unemployment from 3.6% to 3.7% slightly cooled their ardor. The actual increase in employment convinces that modest figures in May were normal market noise. Given the inflation being close to a target of 2%, the US labor market is still strong, which reduces the likelihood of Fed monetary policy easing in July. However, before the report of the Ministry of Labor, the CME derivatives were 100% sure that the federal funds rate was reduced by 25 bp and gave a 30% chance of falling by 50 bp. Dynamics of the probability of the Fed rate change in July The debt market was no less categorical and the 10-year bonds yield collapsed to its lowest level since 2016. Its differential with the federal funds rate continued to expand in favor of the latter, indicating a high risk of monetary expansion. Dynamics of US bond yields and Fed rates Simply put, investors were set up to take profits on long positions in the US dollar. However, American employment in June dissuaded them from the expediency of these actions. The US economy still looks better than the European one, the Fed is unlikely to lower the rate at the next FOMC meeting, while the ECB is seriously thinking about the reanimation of QE. Here, we do not need to talk about the potential for easing monetary policy, but about its divergence instead. That is, recalling the situation, the EUR / USD pair fell in 2015-2016. What's next? I expect Donald Trump to increase his criticism of the Fed and sales of the pair on the rise, especially after the release of the minutes of the June meeting of the Open Market Committee. Then, let me remind you, there was the first dissident in the last few years, when they appeared to have an interest in lowering the rate, and Jerome Powell talked a lot about international risks. It's too early to get rid of the US dollar. Even if American and European GDP is slowing down, the United States still looks better than the Old World. Technically, much will depend on the ability of the bears to pull the EUR/USD quotes outside the red triangle and keep them below the support of 1.1225. It turns out that there will be a chance to go to the area of 1.11-1.115. On the contrary, "bulls" can recover after a short consolidation to play the "Diamond-shaped bottom" pattern. EUR / USD daily chart |
| BTC 07.05.2019 - Broken falling wedge, more downside yet to come Posted: 05 Jul 2019 06:43 AM PDT Industry news:
At the time the regulators around the world are coming into terms with the announced Facebook's cryptocurrency Libra, the deputy governor of the Bank of Japan (BoJ) Masayoshi Amamiya makes its stance towards the new project. According to the governor, all digital assets are required to comply with set regulations regarding money laundering and associated risk management. Trading recommendation:
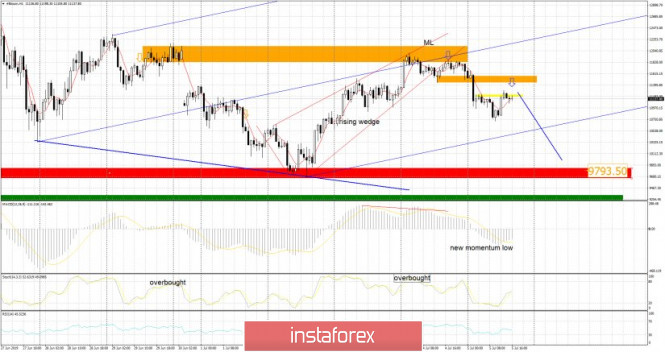
BTC did exactly what I expected yesterday. BTC confirmed the breakout of the rising wedge in the background and did test the level of $10.718. I still expect more downside and potential test of low from the rising wedge at the price of $9.793. Yellow rectangle – Resistance sell zone ($11.231) Orange rectangle – Resistance sell zone ($11.446) Red rectangle- Support ($9.793) MACD oscillator is showing the new momentum low in the background and the BTC is trading in the negative territory, which confirms my bearish view. RSI oscillator and Stochastic are showing the reading around 50 level, which is sign that there is possible new downward movement. As long as the BTC is trading below $12.000, I would watch for selling opportunities on the rallies, level of $11.446 looks like a solid sell zone. Downward target is set at the price of $9.793. The material has been provided by InstaForex Company - www.instaforex.com |
| Upgrade: Experts predict rise in Gold prices Posted: 05 Jul 2019 04:39 AM PDT According to some analysts, we can expect a rise in the price of the yellow metal in the near future. Experts believe that the value of gold, entrenched at around $ 1414, resembling a lucky ticket, will exceed this figure. Experts believe that global geopolitical instability and the beginning of a new cycle of monetary easing by central banks are preparing the ground for the so-called "ideal storm" in the gold market. In many ways, this is facilitated by a temporary lull in the US-Chinese trade war. The destabilization of international relations, affecting a number of countries, contributes to the global economic imbalance. According to analysts, there is a struggle in the world between various concepts of globalization - for example, the principle of free trade in the so-called "world without borders" conflicts with the growth of trade protectionism, etc., particularly gold as experts emphasized. According to some analysts, we can expect a rise in the price of the yellow metal in the near future. Experts believe that the value of gold, entrenched at around $ 1414, resembling a lucky ticket, will exceed this figure. Experts believe that global geopolitical instability and the beginning of a new cycle of monetary easing by central banks are preparing the ground for the so-called "ideal storm" in the gold market. In many ways, this is facilitated by a temporary lull in the US-Chinese trade war. The destabilization of international relations, affecting a number of countries, contributes to the global economic imbalance. According to analysts, there is a struggle in the world between various concepts of globalization - for example, the principle of free trade in the so-called "world without borders" conflicts with the growth of trade protectionism, etc., particularly gold as experts emphasized. The material has been provided by InstaForex Company - www.instaforex.com |
| Dollar bulls and bears may be left with nothing Posted: 05 Jul 2019 04:39 AM PDT Today, the US will publish the NFP employment report, which is important to the regulator before the new FOMC meeting this month. During its release, a surge in volatility is expected. If the data disappoints traders, the euro will go up but it is unlikely to move further than $1.1340. With upbeat statistics, the euro risks falling to $1.1212 as the dollar will strengthen its position across the entire spectrum of the market. Looking back, we can recall that the last time the output of strong statistics on employment outside the US agricultural sector on the following day after Independence Day, which led to an increase in the yield of treasuries to 2.74% from 2.5% in 2013. History can easily be repeated but other options are possible. The dollar paired with other major currencies changed slightly on Friday after yesterday's lull. Consolidation on the eve of an important release suggests that Friday will be hot. The Fed chief says that the regulator is not enough to make decisions about adjusting the policies of a single report on the labor market and I would like to see at least three more. Markets paid no attention to this and they are determined. Strong statistics will allow us to consider weak May data as market noise. It will also be evident that the American economy is still in shape and looks much better than its competitors. With such a development of events, the yield of Treasury securities may soar and the demand for the American currency will increase. The second consecutive closure of employment below the psychologically important level, plus 100,000, will return to the market concerns about the slowdown in the US economy. Traders will be carried away once again with the idea of reducing the rate by 50 bp in July. There is one interesting fact: officials of the American regulator are trying to calm the markets, which are alarmed by the inversion of the yield curve. Meanwhile, the model of the Federal Reserve Bank of New York points to the risk of economic decline by up to 30% over the next 12 months. Buyers and sellers of greenbacks can remain in their own interests with an increase in employment at the level of the Bloomberg consensus forecast with 165 thousand. Dollar "bears" will find that the Fed will nevertheless adjust the policy at the next meeting due to the continued uncertainty surrounding the US-China trade conflict. Bull traders tuned to the US currency will insist on saving rates. By the way, three-quarters of eighty Reuters respondents predict dollar success. According to experts, the "American" will be able not only to maintain the current position but also to grow by the end of this year. However, estimates for a more distant future are worse. The EUR/USD pair will rise to $1.17. Despite the fact that the forecast looks "bullish", this is the lowest value of the consensus assessment for the last couple of years. It is also worth noting that the optimistic report on the US labor market will make it possible to talk about the discrepancy in the monetary policy of the ECB and the Fed. In Europe, they will continue to talk about the need for QE while in America, they will be notified again of a pause in rate adjustment. The material has been provided by InstaForex Company - www.instaforex.com |
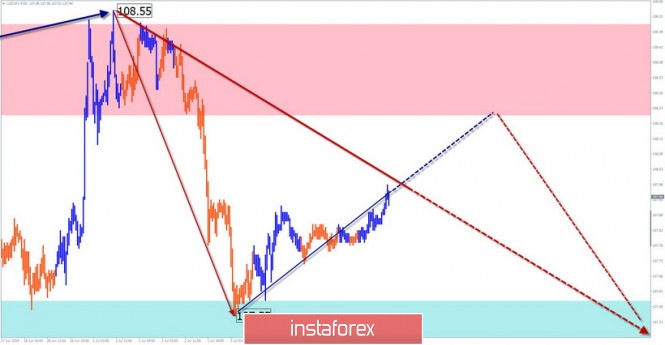
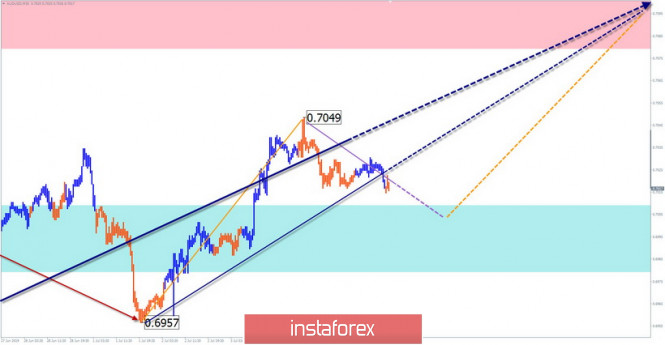
| Simplified wave analysis and forecast for USD / JPY and AUD / USD pairs on July 5 Posted: 05 Jul 2019 04:09 AM PDT USD / JPY pair In the main bearish wave of the trend on July 1, the bullish correction ended. From this time on, a reversal pattern is formed on the graph, preceding the beginning of a new section of the main trend. In recent days, the pair has been developing upward on the market. Forecast: The upward ascending mood is expected to continue today. In the afternoon, the likelihood of a reversal and price reduction has increased. Recommendations: The current price rise of the yen is more reasonable to ignore. Increased volatility and of course, a change are most likely during the release of news blocks from the United States. It is recommended to track the signals of your indicators to sell the instrument. Resistance zones: - 108.20 / 108.50 Support areas: - 107.60 / 107.30 AUD / USD pair The main direction in the short-term scale of the "Australian" is linked to the algorithm of the rising wave of May 21 at the end of the dominant bearish trend and so far does not go beyond its correction. There is a clear zigzag in the wave structure and it lacks the final section. Since yesterday, the price rolls back down. Forecast: Today, the decline of the pair beginning yesterday is expected to get completed. A breakthrough of the lower boundary of the support zone is unlikely but of course, a change is most likely at the American trading session. Before that, a sharp increase in volatility is possible. Recommendations: Aussie sales are unpromising today. It is recommended to focus on the emerging signals to purchase the instrument. The target area is the resistance zone. Resistance zones: - 0.7080 / 0.7110 Support areas: - 0.7010 / 0.6980 Explanations to the figures: The simplified wave analysis uses waves consisting of 3 parts (A – B – C). Each of these analyzes the last incomplete wave. Zones show calculated areas with the highest probability of reversal. The arrows indicate the wave marking by the method used by the author. The solid background shows the formed structure and the dotted exhibits the expected movement. Note: The wave algorithm does not take into account the duration of tool movements over time. The material has been provided by InstaForex Company - www.instaforex.com |
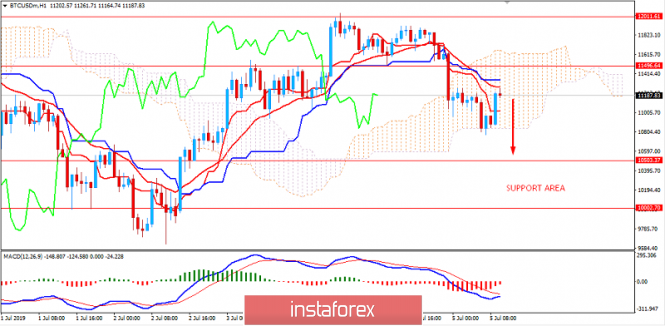
| BITCOIN struggle below $12,000 indicates downturn? July 5, 2019 Posted: 05 Jul 2019 03:55 AM PDT Bitcoin has been struggling to regain momentum above $12,000 after the recent dip. The bearish bias could extend further on the grounds of the current price action which signals a retest of $10,000. There is a direct correlation between the Bitcoin price rally and global economic turmoil. Different jurisdictions apply different monetary policies advocating for the stability of their economies and fiat currencies. In this context, President Trump is concerned about the US position when it comes to protecting the greenback. A conservative approach will suggest long positions once prices rally above $14,000. Besides, aggressive traders can buy the dips. Bitcoin currently has another two to three years left of the uptrend during the ongoing market cycle. During the next bullish phase following another lull, BTC will be able to surpass gold as the planet's primary store of value asset. Meanwhile, the price is expected to move lower as it is holding inside the Kumo Cloud resistance area despite the impulsive bullish pressures trying to push the price higher. Though the price is struggling to maintain the momentum as the dynamic levels like 20 EMA, Tenkan, Kijun and Kumo Cloud holding it as resistance. The price is expected to retest the $10,000-500 area again before a strong sustainable bullish trend is established. Analysts do not rule out a break above $14,000 and higher above $20,000 in the coming days. TECHNICAL LEVELS: SUPPORT: 10,000, 10,500, 11,000 RESISTANCE: 11,500, 12,000 BIAS: BULLISH MOMENTUM: VOLATILE
|
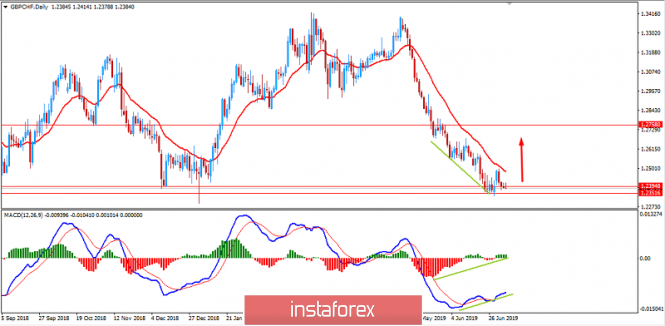
| Analysis of GBP/CHF for July 5, 2019: Pound to gain ground ahead of GDP data Posted: 05 Jul 2019 03:29 AM PDT GBP has been struggling to gain momentum against CHF, but the recent economic and BREXIT issues were holding it back. The Bank of England has been in a tightening bias towards a rate cut which is yet to be confirmed by the monthly GDP data. The monthly GDP growth in the UK was seen to be lower than the previous data, indicating weaker economic growth due to the global slowdown and the ongoing Brexit uncertainties. It is highly possible that the GDP volume decreased in Q2. The BOE is expecting a decline in economic growth due to Brexit issues. The business investment grew by 0.5% in 2019 Q1, although there was more-than-expected uncertainty around the environment. Further on, the household consumption advanced by 0.6% in 2019 Q1 while the Retail sales volumes was flat in April, following three consecutive months of growth. The annual headline and core CPI inflation inched down slightly in May, to 2.0% and 1.7% respectively. For Q3, the headline inflation was expected to fall to 2% due to the recent fall in energy prices. The employment growth slowed further to 0.1% but the labor market still remains strong. The current account balance showed a decline from -23.7B to -30.0B, beating the expectation of -32.0B. The manufacturing PMI weakened to 48.0 from the previous value of 49.4 while the construction PMI slid to 43.1 from 48.6. The M4 Money Supply index declined to -0.1% from 0.5% and the services PMI dropped to 50.2 from 51.0. The market will absorb the monthly GDP report on Wednesday along with the manufacturing production data. On the other hand, the main aim of the SNB is to fight against the economic slowdown. That makes the SNB to keep the interest rate unchanged at -0.75%. To support the economic growth, the SNB has shifted the target range for the three-month Libor rate used previously which currently stands at -0.75%. The GDP growth sped up in the first quarter, comparing to all large economies recording above-average expansion. The SNB projected the inflation rate to be 0.7% on a yearly basis which is 0.1% up from the projection of last quarter. The KOF economic barometer declined from 93.8 to 93.6 while the retail sales decreased to -1.7% from -0.8% on a yearly basis. The manufacturing PMI dropped to 47.7 from the previous value of 48.6 and the CPI declined to 0.0% from 0.3% on a monthly basis. The foreign currency reserves remained mostly unchanged at 759B. As of the current scenario, the GBPCHF pair might face some correction in coming days according to the market structure, technical & fundamental outlook. To remain bullish in this pair, a strong bullish daily close is needed from the current market price with support from the better-than-expected UK GDP data. Now let us look at the technical view. The price has recently formed the Bullish Regular Divergence which is expected to push the price higher despite the preceding non-volatile bearish trend in place. The price recently managed to bounce off the 1.2350 area but could not sustain the bullish pressure which indicates further correction before pushing higher towards 1.25 and later towards 1.2750 resistance area in the coming days.
|
| Trading Plan 07/05/2019 EURUSD Posted: 05 Jul 2019 03:16 AM PDT
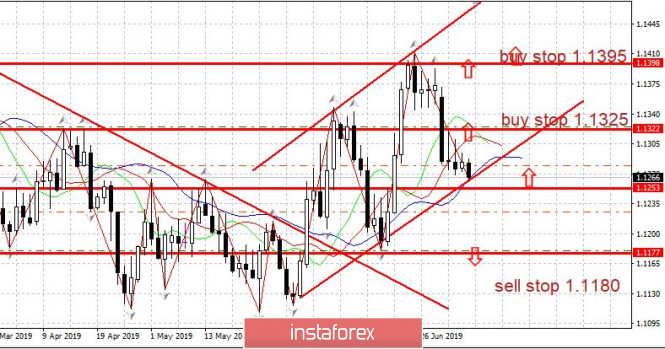
Recent data showed that the slowdown in the US economy continues. The employment report for June today at 12:30 (UTC+00) is likely to be quite weak - and this may push the dollar to a new wave of decline. EURUSD: The change of the head of the ECB becomes an important topic for the euro - the powers of Mario Draghi will expire in late October. There are information saying that, Christine Laggard, the head of the IMF and the representative of France, will become the head of the ECB. As head of the IMF, Laggard has always been an active supporter of super-soft monetary policy in a situation of recession in the economy. It can be expected that the ultra-soft policy of the ECB, has been carried out by Draghi for 9 years since the crisis of 2008-09, will be continued by the new head of the ECB. We are ready to buy the euro at the breakthrough of 1.1325. We are ready to sell the euro from 1.1180. The material has been provided by InstaForex Company - www.instaforex.com |
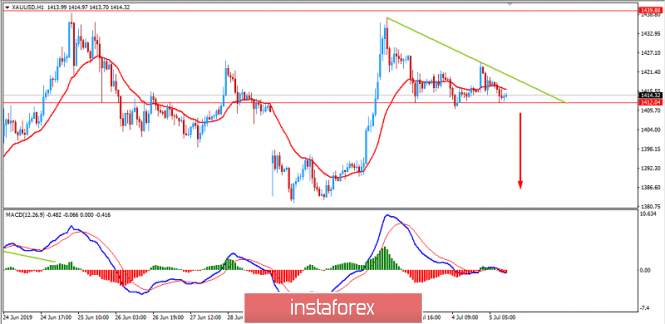
| Gold to reach $1,380 again? July 5, 2019 Posted: 05 Jul 2019 03:11 AM PDT Gold moved lower after reaching $1,438 recently. The price has given in to the downward pressure. However, if the price breaks below $1,412, it will trigger impulsive bearish momentum. Ahead of NFP today, the gold price is making a correction. All eyes are now on the US non-farm payrolls. Employment in the US public and private sectors is expected to have jumped by 160,000 in June, much stronger than 75,000 in May. A weaker-than-expected figure in the jobs report could raise expectations that the US Federal Reserve would cut interest rates at its nearest policy meeting on July 30 and 31. Despite a correctional decline, gold remained on track to log a seventh straight week of gains, bolstered by President Donald Trump's nomination of two dovish candidates to head the Federal Reserve and a surprise announcement that Christine Lagarde will be the head of the European Central Bank. In the environment of lower interest rates, investors' appetite for gold strengthens as the opportunity cost of holding the precious metal decreases relative to other interest-bearing assets such as bonds. To sum up, a correctional decline of the gold price could be quite shorter than expected. Then, the price will resume its rally. As the global economy is struggling to maintain momentum, the precious metal is still viewed as safe haven investment around the world. Though gold could make corrections and dips, any weakness in USD will encourage gold to gain further impulsive bullish momentum. On the other hand, upbeat US nonfarm payrolls will cause more corrections and retracements. TECHNICAL LEVELS: SUPPORT: 1,350, 1,380, 1,412 RESISTANCE: 1,438, 1,440, 1,450 BIAS: BEARISH MOMENTUM: VOLATILE
|
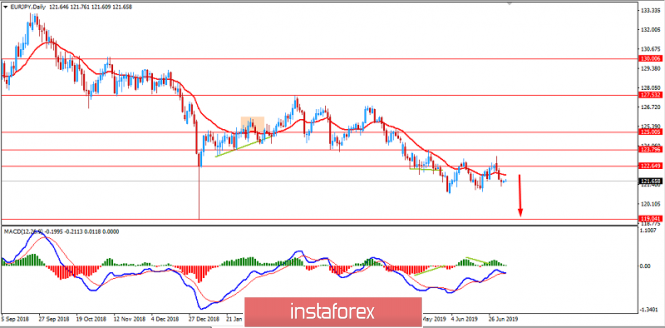
| EUR/JPY: JPY to hold upper hand over EUR? July 5, 2019 Posted: 05 Jul 2019 03:11 AM PDT EUR/JPY has gained bearish momentum which sustained quite well while the price was holding firmly below 122.50 with a daily close. Japan's household spending today hit a 4-year high that helped JPY to sustain further momentum over EUR. The percentage of Japanese households anticipating inflation to accelerate in the nearest 12 months surpassed expectations greatly. The Bank of Japan's survey on people's livelihood showed the percentage of households who expect prices to rise a year from now was 80.5% in July, the highest level since September 2015. Today, BOJ's Deputy Governor Amamiya stated that negative rates on digital currencies will result in holding cash instead to avoid being charged for holding digital currencies which can make an inverse effect on further economic development. He also stated that Japan's economy remains on track to achieve the central bank's 2% goal as robust capital expenditure offsets some of the weaknesses in exports and output. The trade dispute between the US and China has hurts global demand and clouded Japan's economic outlook. Experts predict that the BOJ could ease monetary policy as early as at this month's rate review. Despite certain challenges, the economy expanded by an annualized 2.1% in the first quarter. Nevertheless, experts warn that Japan's economic growth may skid in the coming months as the trade jitters between the US and China hurt exports. A scheduled sales tax hike in October may also undermine private consumption. On the other hand, the eurozone is facing economic troubles that has been confirmed by the latest mixed economic reports. It is the main reason for recent EUR weakness. The ECB is trying all measures to spur headline inflation as well as economic growth despite budget deficit and global trade tensions. The eurozone bank sector's profitability is expected to dip this year before recovering over the following two years. The combined return on equity for banks supervised by the ECB may dip to 5.4% this year from 6.7% a year and then rise to 7.3% and 7.9% in the subsequent years. As the euro area faces fundamental problems, its banks need more capital along with joint deposit insurance and dedicated government funds to prevent panic when the next crisis comes. Now let us look at the technical view. The price is currently going lower after a correctional climb. Bearish Divergence is expected to push the price lower to 119.00-120.00 in the coming days. If the price stays firmly below the dynamic level of 20 EMA amid impulsive bearish momentum, this will indicate a move lower.
|
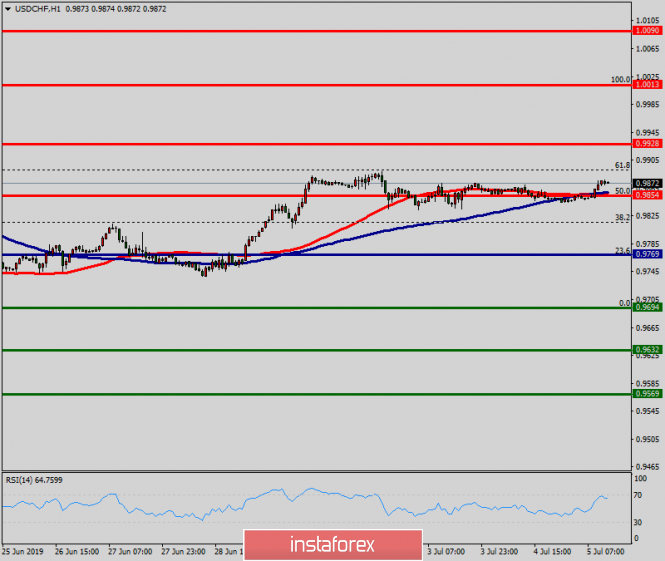
| Technical analysis of USD/CHF for July 05, 2019 Posted: 05 Jul 2019 03:05 AM PDT The USD/CHF pair fell sharply from the level of 0.9854 towards 0.9694. Now, the price is set at 0.9748. The resistance is seen at the level of 0.9854 and 0.9928. Moreover, the price area of 0.9854 and 0.9928 remains a significant resistance zone. Therefore, there is a possibility that the USD/CHF pair will move downside and the structure of a fall does not look corrective. The trend is still below the 100 EMA for that the bearish outlook remains the same as long as the 100 EMA is headed to the downside. Thus, amid the previous events, the price is still moving between the levels of 0.9770 and 0.9694. If the USD/CHF pair fails to break through the resistance level of 0.9770, the market will decline further to 0.9694 as as the first target. This would suggest a bearish market because the RSI indicator is still in a negative spot and does not show any trend-reversal signs. The pair is expected to drop lower towards at least 0.9632 so as to test the daily support 2. On the other hand, if a breakout takes place at the resistance level of 0.9854, then this scenario may become invalidated. The material has been provided by InstaForex Company - www.instaforex.com |
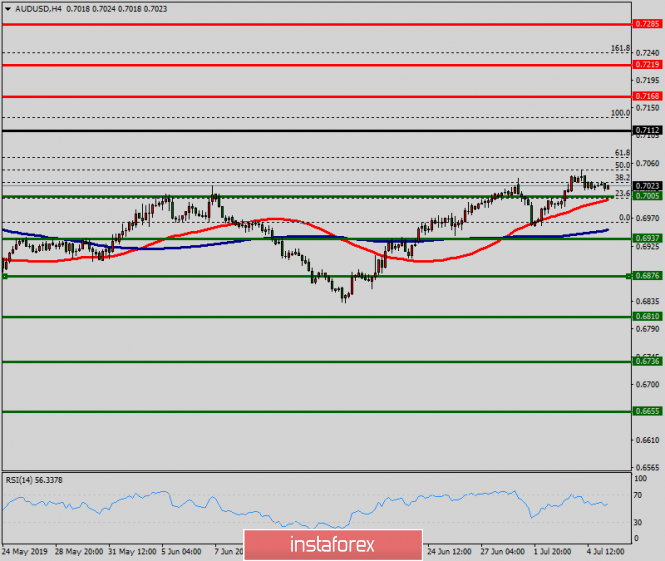
| Technical analysis of AUD/USD for July 05, 2019 Posted: 05 Jul 2019 03:02 AM PDT The AUD/USD pair is set above strong support at the levels of 0.6876 and 0.6810. This support has been rejected four times confirming the uptrend. The major support is seen at the level of 0.6810, because the trend is still showing strength above it. Accordingly, the pair is still in the uptrend in the area of 0.6810 and 0.6876. The AUD/USD pair is trading in the bullish trend from the last support line of 0.6876 towards thae first resistance level of 0.6937 in order to test it. This is confirmed by the RSI indicator signaling that we are still in the bullish trending market. Now, the pair is likely to begin an ascending movement to the point of 0.6937 and further to the level of 0.7005. The level of 0.7005 will act as the major resistance and the double top is already set at the point of 0.7005. At the same time, if there is a breakout at the support level 0.6810, this scenario may be invalidated. The material has been provided by InstaForex Company - www.instaforex.com |
| Technical analysis of NZD/USD for July 05, 2019 Posted: 05 Jul 2019 02:54 AM PDT The NZD/USD pair broke the resistance that turned into strong support at the level of 0.6612 this week. The level of 0.9966 coincides with a golden ratio (61.8% of Fibonacci), which is expected to act as a major support on the H1 chart today. Consequently, the first support is set at the level of 0.6612. Moreover, the RSI starts signaling an upward trend, and the trend is still showing strength above the moving average (100). Hence, the market is indicating a bullish opportunity above the area of 0.6612. So, the market is likely to show signs of a bullish trend around 0.6612 - 0.6650. In other words, buy orders are recommended above the ratio of 61.8% Fibonacci (0.6612) with the first target at the level of 0.6748 in order to test last bullish wave in the same time frame. If the pair succeeds to pass through the level of 0.6748, the market will probably continue towards the next objective at 0.6818 . The daily strong support is seen at 0.6612. Thus, if a breakout happens at the support level of 0.6612/0.6600, then this scenario may be invalidated. The material has been provided by InstaForex Company - www.instaforex.com |
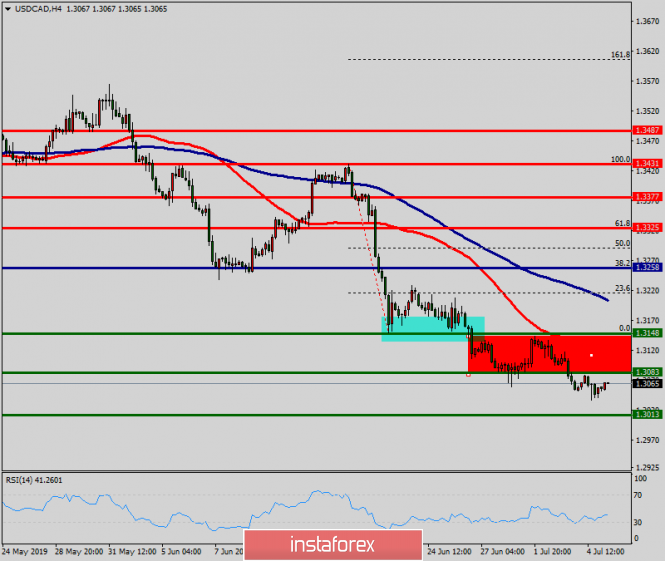
| Technical analysis of USD/CAD for July 05, 2019 Posted: 05 Jul 2019 02:49 AM PDT The USD/CAD pair continues to move downwards from the level of 1.3258. This week, the pair dropped from the level of 1.3258 (this level of 0.9965 coincides with the double top) to the bottom around 1.3148. Today, the first resistance level is seen at 1.3258 followed by 1.3325, while daily support 1 is found at 1.3148. Also, the level of 1.3258 represents a weekly pivot point for that it is acting as major resistance/support this week. Amid the previous events, the pair is still in a downtrend, because the USD/CAD pair is trading in a bearish trend from the new resistance line of 1.3258 towards the first support level at 1.3038 in order to test it. If the pair succeeds to pass through the level of 1.3038, the market will indicate a bearish opportunity below the level of 1.3038 in order to continue towards the point of 1.3013. However, if a breakout happens at the resistance level of 1.3325, then this scenario may be invalidated.
|
| Posted: 05 Jul 2019 02:32 AM PDT Today, the focus of markets will be the publication of data on employment in the United States, which may have a direct impact on the Fed's decision on rates at the July meeting of the regulator on the 31st. According to the consensus forecast, the US economy received 160,000 new jobs in June, while the May value of only 75,000 was noticeably lower. It is also assumed that the unemployment rate will remain at the same level of 3.6%. Now, let's consider the likely reaction of the market and the Fed to this data. It can be assumed that if the value of the number of new jobs turns out to be higher and significantly higher than the forecast, then this will lead to a local appreciation of the dollar and may restrain the Fed in the decision to lower. As markets currently assume, there is a probability of lowering interest rates at a regulator meeting at the end of the month. At the same time, a significantly lower number of new jobs will lead to a weakening of the US currency and will be a strong argument for doubting Fed members in their decision to lower the key interest rate by at least 0.25%. We also add that the output value in the expected area will still be viewed by the market as a signal for lowering rates. We draw your attention to the fact that from the beginning of this year, the American Central Bank took a wait-and-see attitude, watching the dynamics of the national economy and the situation in the global economy. Of course, its focus has since been on the picture of the negotiation process between Washington and Beijing trade. In the last two or three months, the US economy began to give steady signals of a slowdown, indicating that the economic growth based on lending is running out of steam. In our opinion, it should force the Central Bank to begin a cycle of lowering interest rates, regardless of the results of trade negotiations between US and China. Another important factor in favor of lowering rates this year is the start of the presidential election campaign. Donald Trump, who wants to be re-elected as president, explicitly calls on the Fed to begin lowering rates. For this, he is ready to introduce two new people to the Fed council who have dovish views on monetary policy. Forecast of the day: The EUR/USD pair crosses the level of 1.1275. It may continue to fall to the lower boundary of the short-term uptrend of 1.1250. The NZD/USD pair is trading above the level of 0.6665. The intersection of this mark can lead to a local price decrease to 0.6645. |
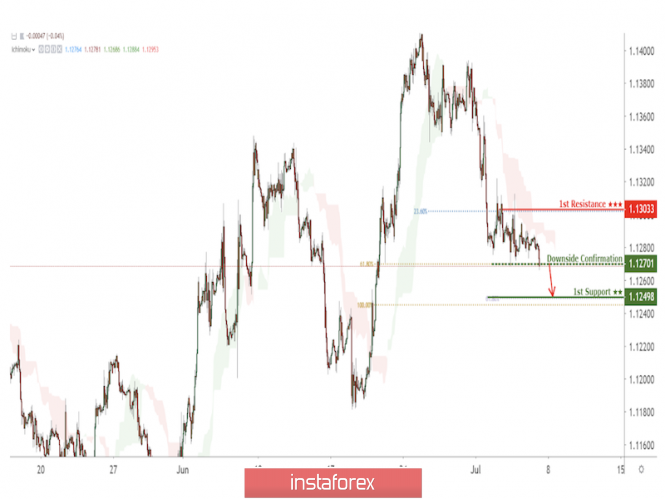
| EUR/USD testing its intermediate support, potential drop if broken! Posted: 05 Jul 2019 01:59 AM PDT
EURUSD is testing its intermediate support where if broken, gives us a confirmation of a further move down. Entry: 1.2701 Why it's good : 61.8% Fibonacci retracement Stop Loss : 1.1303 Why it's good : 23.6% Fibonacci retracement Take Profit : 1.1249 Why it's good: 61.8% & 100% Fibonacci extension
|
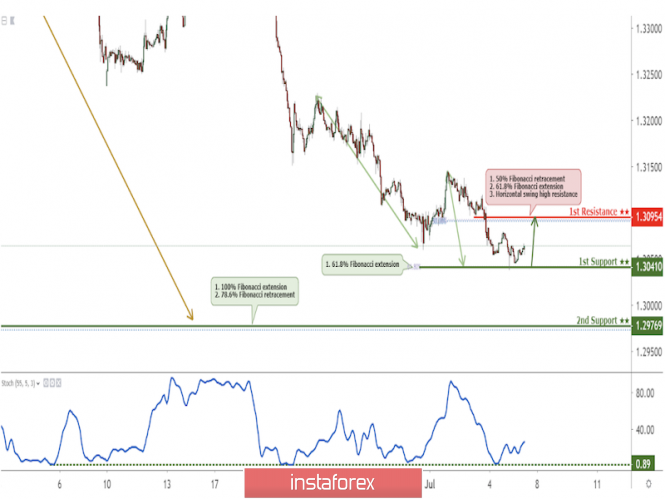
| USD/CAD bounced off support, potential further rise! Posted: 05 Jul 2019 01:50 AM PDT Price bounced off its support where we expect to see a further rise to its resistance. Entry : 1.3041 Why it's good : 61.8% Fibonacci extension Stop Loss : 1.2976 Why it's good : 78.6% Fibonacci retracement, 100% Fibonacci extension Take Profit : 1.3095 Why it's good : 50% Fibonacci retracement, 61.8% Fibonacci extension, horizontal overlap resistance
|
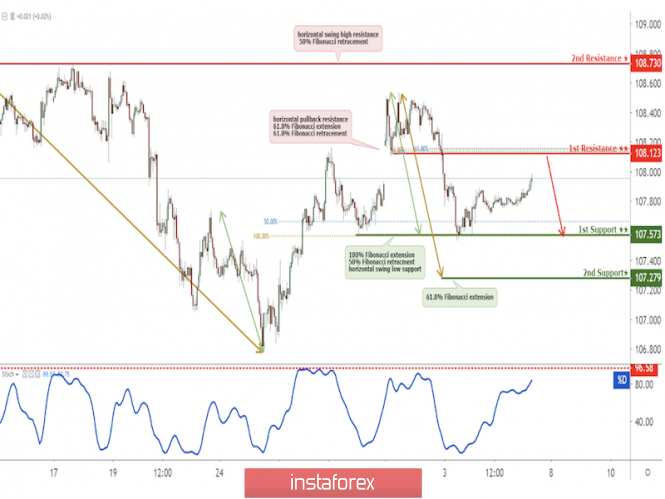
| USD/JPY approaching resistance, possible drop! Posted: 05 Jul 2019 01:29 AM PDT
Price is reaching resistance at 108.123, a drop could occur! Entry :108.123 Why it's good : horizontal pullback resistance 61.8% Fibonacci extension 61.8% Fibonacci retracement Take Profit : 107.573 Why it's good :100% Fibonacci extension 50% Fibonacci retracment horizontal swing low support
|
| You are subscribed to email updates from Forex analysis review. To stop receiving these emails, you may unsubscribe now. | Email delivery powered by Google |
| Google, 1600 Amphitheatre Parkway, Mountain View, CA 94043, United States | |





No comments:
Post a Comment