Forex analysis review |
- Fractal analysis of the main currency pairs on August 14
- EUR/USD. August 13th. Results of the day. US inflation is accelerating again
- GBP/USD. UK wages up, but the pound is indifferent to statistics
- Complex euro or why the euro does not want to fall
- Euro and dollar continue to play tug of war, awaits news from Europe and the United States
- AUDUSD turns higher respecting key Fibonacci support area
- Ichimoku cloud analysis for EURUSD
- Gold bulls were warned for possibility of fake break out
- August 13, 2019 : GBP/USD Intraday technical analysis and trade recommendations.
- August 13, 2019 : Expectations of a bearish breakout below 1.1175 for the EUR/USD pair.
- BTC 08.13.2019 - Down break of the 5-day consolidation
- Overview of GBP/USD on August 13th. The forecast on the "Regression Channels". The British population is afraid of Brexit
- GBP/USD 08.13.2019 -Strong resistance at the price of 1.2100 on the test again, more downside to come
- Gold sets ambitious goals
- USD/JPY analysis for August 13, 2019 - Support on the test, potential for rally
- Dollar unable to keep its gains on firm US CPI data
- Gold rally is just around the corner, experts say
- Markets run from risks in Hong Kong, Italy, Argentina
- Gone to the bottom: "Australian" and "New Zealander" may weaken
- Overview of EUR/USD on August 13th. The forecast on the "Regression Channels". Economic sentiment in the European Union fell
- Markets are waiting for data on US inflation (We expect data to be released from the US act on this basis by selling or buying
- EUR/GBP is losing ground and is testing the lows around 0.9270
- EUR/USD in a narrow range and the euro is more likely to break through the lower border than the upper one
- Technical analysis for GBP/USD currency pair for the week from August 12 to 17, 2019
- Control zones for EUR/USD pair on 08/13/19
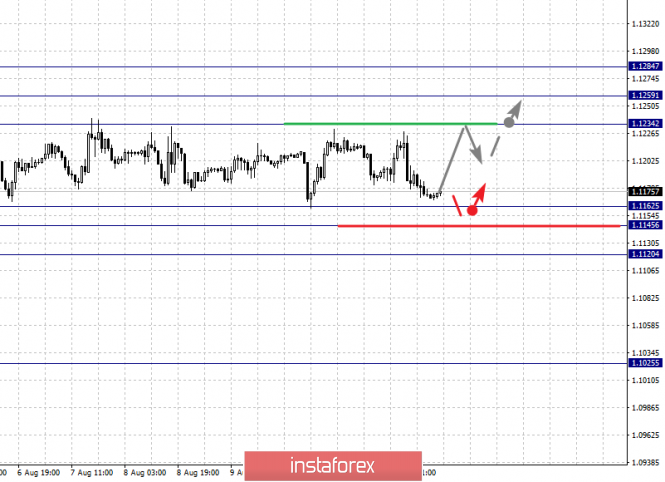
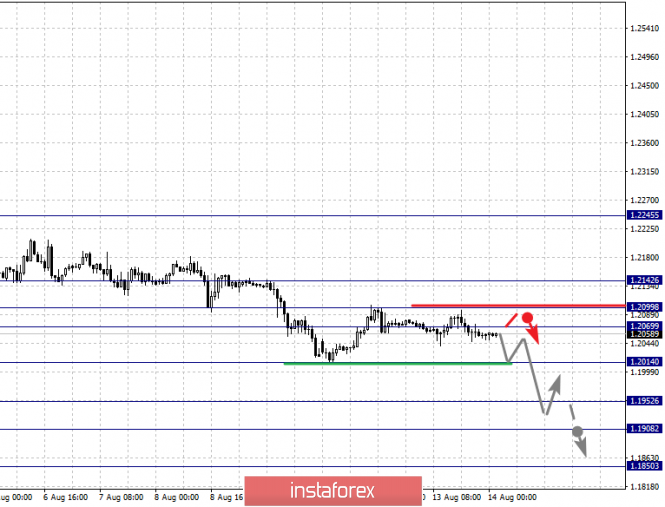
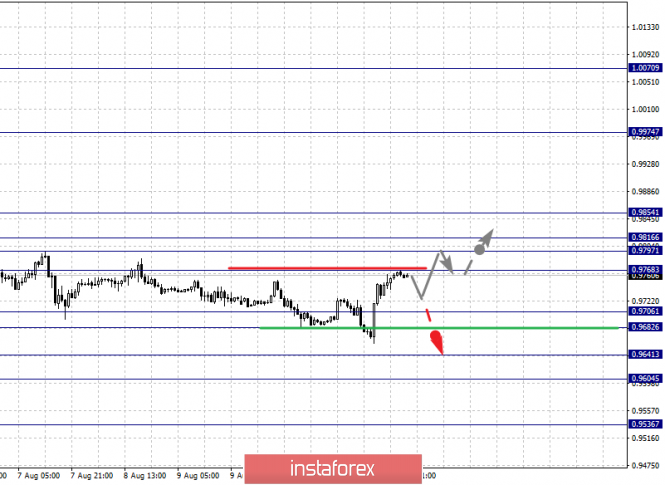
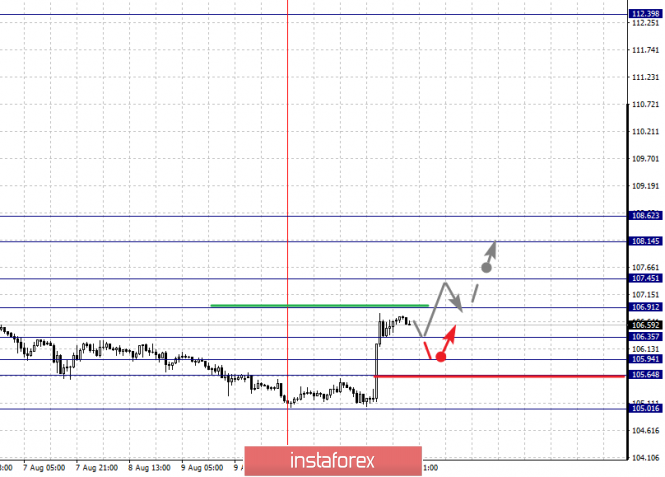
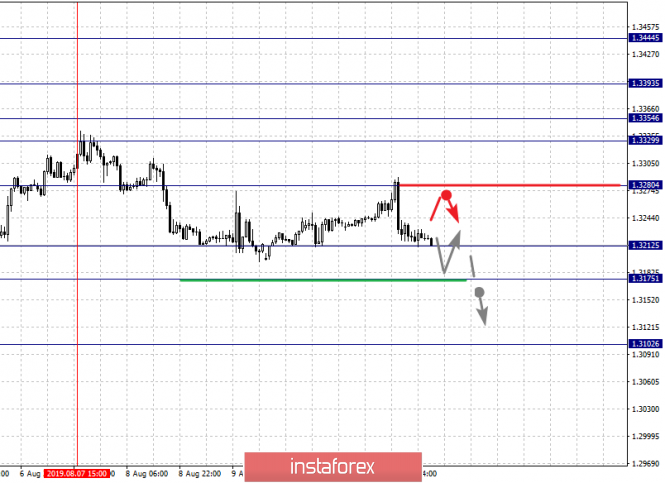
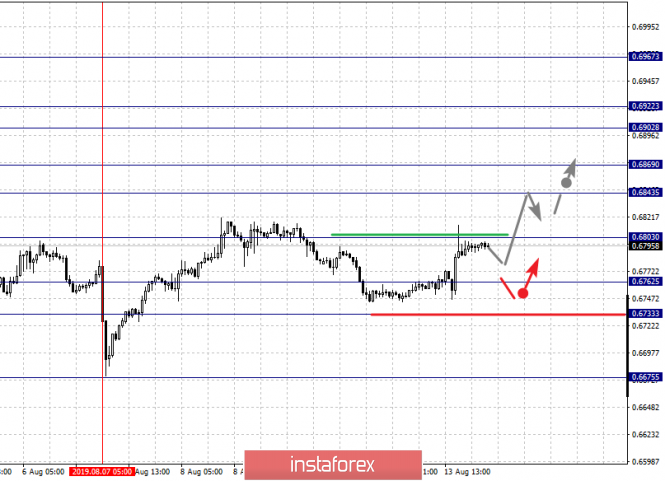
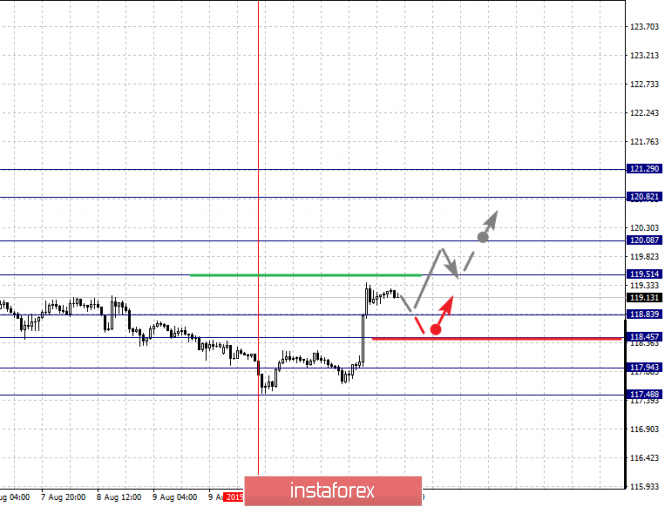
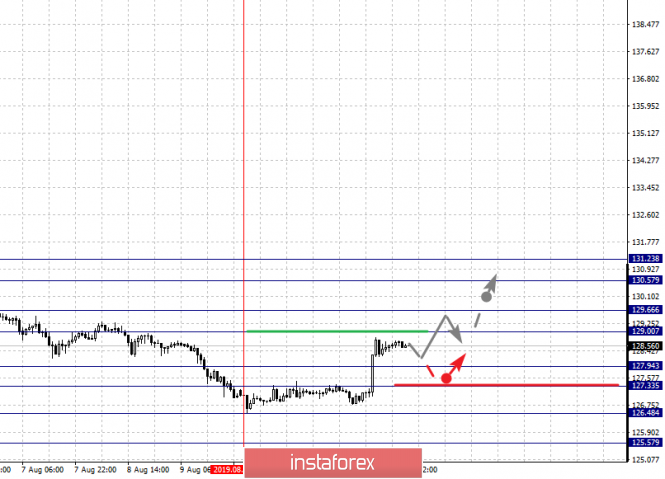
| Fractal analysis of the main currency pairs on August 14 Posted: 13 Aug 2019 05:39 PM PDT Forecast for August 14: Analytical review of currency pairs on the scale of H1: For the euro / dollar pair, the key levels on the H1 scale are: 1.1284, 1.1259, 1.1234, 1.1162, 1.1145 and 1.1120. Here, the price has entered an equilibrium state. For the continuation of the movement to the top, it is necessary to create a local structure. The continuation of the upward trend is possible after the breakdown of the level of 1.1234. In this case, the target is 1.1259. For the potential value for the top, we consider the level of 1.1284. Upon reaching which, we expect consolidation, as well as a pullback to the bottom. Short-term downward movement is possibly in the range of 1.1162 - 1.1145. The breakdown of the last value will lead to a long correction. Here, the goal is 1.1120. This level is a key support for the top. The main trend is the equilibrium state. Trading recommendations: Buy 1.1234 Take profit: 1.1258 Buy 1.1261 Take profit: 1.1284 Sell: 1.1162 Take profit: 1.1146 Sell: 1.1144 Take profit: 1.1122 For the pound / dollar pair, the key levels on the H1 scale are: 1.2142, 1.2099, 1.2069, 1.2014, 1.1952, 1.1908 and 1.1850. Here, we follow the downward cycle of July 31. The continuation of the movement to the bottom is expected after the breakdown of the level of 1.2014. In this case, the target is 1.1952. Meanwhile, there is a short-term downward movement, as well as consolidation in the range of 1.1952 - 1.1908. For the potential value for the bottom, we consider the level of 1.1850. Upon reaching this level, we expect a pullback to the top. Short-term upward movement is possibly in the range of 1.2069 - 1.2099. The breakdown of the last value will lead to a long correction. Here, the target is 1.2142. This level is a key support for the downward structure. The main trend is the downward cycle of July 31. Trading recommendations: Buy: 1.2069 Take profit: 1.2097 Buy: 1.2100 Take profit: 1.2140 Sell: 1.2012 Take profit: 1.1954 Sell: 1.1950 Take profit: 1.1910 For the dollar / franc pair, the key levels on the H1 scale are: 0.9854, 0.9816, 0.9797, 0.9768, 0.9706, 0.9682, 0.9641, 0.9604 and 0.9536. Here, we follow the medium-term downward structure from August 1. At the moment, the price is in the correction zone and forms the potential for the top. The continuation of movement to the bottom is expected after the price passes the noise range of 0.9706 - 0.9682. In this case, the target is 0.9641. Short-term downward movement, as well as consolidation is in the range of 0.9641 - 0.9604. The breakdown of the level of 0.9604 should be accompanied by a pronounced downward movement. Here, the potential target is 0.9536. Departure for correction is expected after the breakdown of the level of 0.9768. Here, the first goal is 0.9797. Short-term upward movement is possibly in the range of 0.9797 - 0.9816. The breakdown of the latter value will lead to the formation of initial conditions for the upward cycle. Here, the target is 0.9854. The main trend is the descending structure of August 1, the correction stage. Trading recommendations: Buy : 0.9768 Take profit: 0.9797 Buy : 0.9818 Take profit: 0.9852 Sell: 0.9680 Take profit: 0.9641 Sell: 0.9638 Take profit: 0.9605 For the dollar / yen pair, the key levels on the scale are : 108.62, 108.14, 107.45, 106.91, 106.35, 105.94, 105.64 and 105.01. Here, the price forms the potential for the upward cycle of August 12. The continuation of the movement to the top is expected after the breakdown of the level of 106.91. In this case, the target is 107.45, and consolidation is near this level. The breakdown of the level of 107.45 should be accompanied by a pronounced upward movement. Here, the goal is 108.14. For the potential value for the top, we consider the level of 108.62. Upon reaching which, we expect a pullback to the bottom. A short-term downward movement is possibly after the breakdown of the level of 106.35. In this case, the target is 105.94. The range of 105.94 - 105.64 is a key support for the upward structure. Its passage at the price will lead to the development of a downward trend. In this case, the target is 105.01. The main trend: building potential for the top of August 12. Trading recommendations: Buy: 106.91 Take profit: 107.43 Buy : 107.47 Take profit: 108.14 Sell: 106.35 Take profit: 105.95 Sell: 105.62 Take profit: 105.04 For the Canadian dollar / US dollar pair, the key levels on the H1 scale are: 1.3444, 1.3393, 1.3354, 1.3329, 1.3280, 1.3212, 1.3175 and 1.3102. Here, the price is in deep correction from the upward structure on July 31 and forms the potential for the downward movement from August 7. The breakdown of the level of 1.3212 will lead to the formation of expressed initial conditions for the downward cycle. In this case, the potential target is 1.3175. Price consolidation is near this level. The continuation of the movement to the top is possible after the breakdown of the level of 1.3280. In this case, the first target is 1.3329. Consolidation is in the range of 1.3329 - 1.3354. The breakdown of the level of 1.3355 should be accompanied by a pronounced upward movement. Here, the target is 1.3393. The main trend is the local ascending structure of July 31, the stage of deep correction. Trading recommendations: Buy: 1.3280 Take profit: 1.3329 Buy : 1.3355 Take profit: 1.3392 Sell: 1.3212 Take profit: 1.3178 Sell: 1.3173 Take profit: 1.3105 For the Australian dollar / US dollar pair, the key levels on the H1 scale are : 0.6967, 0.6922, 0.6902, 0.6869, 0.6843, 0.6803, 0.6762, 0.6733 and 0.6675. Here, we follow the development of the ascending structure of August 7. The continuation of the upward movement is expected after the breakdown of the level of 0.6803. In this case, the first target is 0.6843. Short-term upward movement, as well as consolidation is in the range of 0.6843 - 0.6869. The breakdown of the level of 0.6870 should be accompanied by a pronounced upward movement. Here, the target is 0.6902. Consolidation is in the range of 0.6902 - 0.6922. For the potential value for the top, we consider the level of 0.6967. Upon reaching which, we expect a pullback to the bottom. The level of 0.6762 is a key support for the top. Its breakdown will lead to a movement to the level of 0.6733. This level is a key resistance for the subsequent development of a downward trend. The main trend is the ascending structure of August 7 Trading recommendations: Buy: 0.6805 Take profit: 0.6840 Buy: 0.6844 Take profit: 0.6867 Sell : 0.6760 Take profit : 0.6735 Sell: 0.6730 Take profit: 0.6680 For the euro / yen pair, the key levels on the H1 scale are: 121.29, 120.82, 120.08, 119.51, 118.83, 118.45, 117.94 and 117.48. Here, the price forms the potential for the upward cycle of August 12. The continuation of the development of the ascending structure is expected after the breakdown of the level of 119.51. In this case, the goal is 120.08, and near this level is a price consolidation. The breakdown of the level of 120.10 should be accompanied by a pronounced upward movement. Here, the goal is 120.82. For the potential value for the top, we consider the level of 121.29. Upon reaching which, we expect consolidation, as well as a pullback to the bottom. Short-term downward movement is possibly in the range of 118.83 - 118.45. The breakdown of the last value will lead to an in-depth correction. The goal here is 117.94. This level is the key support for the ascending structure of August 12. The main trend is building potential for the top of August 12th. Trading recommendations: Buy: 119.51 Take profit: 120.05 Buy: 120.10 Take profit: 120.80 Sell: 118.81 Take profit: 118.45 Sell: 118.42 Take profit: 117.95 For the pound / yen pair, the key levels on the H1 scale are : 131.23, 130.57, 129.66, 127.94, 127.33, 126.48 and 125.57. Here, the price forms a pronounced potential for the development of the upward cycle of August 12. Short-term upward movement is expected in the range 129.00 - 129.66. The breakdown of the latter value will lead to a pronounced upward movement. Here, the target is 130.57. For the potential value for the top, we consider the level of 131.23. Upon reaching which, we expect consolidation, as well as a pullback to the bottom. Short-term downward movement is possibly in the range of 127.94 - 127.33. The breakdown of the latter value will favor the development of a downward structure. Here, the first goal is 126.48. As a potential value, we consider the level of 125.57. The main trend is building potential for the top of August 12th. Trading recommendations: Buy: 129.00 Take profit: 129.64 Buy: 129.67 Take profit: 130.55 Sell: 127.94 Take profit: 127.35 Sell: 127.30 Take profit: 126.50 The material has been provided by InstaForex Company - www.instaforex.com |
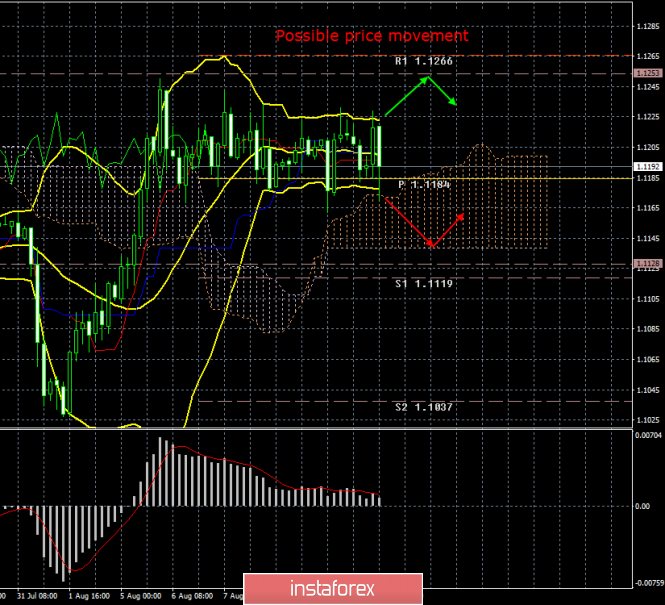
| EUR/USD. August 13th. Results of the day. US inflation is accelerating again Posted: 13 Aug 2019 03:50 PM PDT 4-hour timeframe Amplitude of the last 5 days (high-low): 82p - 63p - 59p - 44p - 69p. Average amplitude over the last 5 days: 63p (72p). The second trading day of the week ended just like the first - in a rather narrow side channel. The only important macroeconomic report on August 13 - the US Consumer Price Index for July - supported the US currency, but not enough for the pair to get out of an open flat. THe euro/dollar pair just fell to the lower Bollinger band, which signal a flat. Thus, nothing has changed, despite the fact that inflation accelerated to 1.8% y/y in July. This is a fairly good indicator, given the proximity of the Fed's target level of 2.0%. The better the performance is, the less likely it is for the Fed to lower its key rate again. Although, most likely, a new easing of monetary policy will happen anyway, Donald Trump, who does not find a common language with China, does his best to do this, but he does not get tired of criticizing Jerome Powell and the Fed. However, Powell himself has repeatedly stated that the regulator will respond to specific figures, and not to Trump's statements or passions in the US-China trade conflict. Thus, there is still hope that there won't be a new rate cut at the next Fed meeting. At the same time, hopes for a new growth of the US dollar. Meanwhile, most traders remain "on the fence" and can only wait for the arrival of new macroeconomic reports that will trigger the reaction of the foreign exchange market. Well, or the speeches of Donald Trump. Trading recommendations: EUR/USD continues to adjust inside the side channel. Thus, we recommend buying the euro/dollar pair only after the Bollinger Bands indicator turns up with targets of 1.1253 and 1.1266. Buying the US dollar is recommended in small lots with the aim of Senkou Span B, if the Bollinger bands turn down. In addition to the technical picture, fundamental data and the time of their release should also be taken into account. Explanation of the illustration: Ichimoku indicator: Tenkan-sen is the red line. Kijun-sen is the blue line. Senkou Span A - light brown dotted line. Senkou Span B - light purple dashed line. Chikou Span - green line. Bollinger Bands Indicator: 3 yellow lines. MACD indicator: Red line and bar graph with white bars in the indicator window. The material has been provided by InstaForex Company - www.instaforex.com |
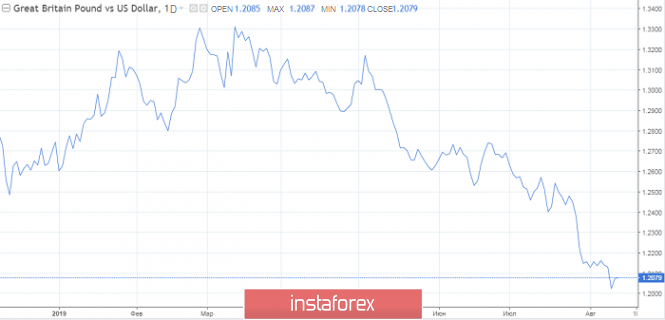
| GBP/USD. UK wages up, but the pound is indifferent to statistics Posted: 13 Aug 2019 03:50 PM PDT The British currency received little support from macroeconomic reports today. Although the published data on the UK labor market was controversial, traders focused on the positive aspects of the release. This made it possible for the GBP/USD pair to move away from today's lows and develop a minimal, but still a correction. But in general, the pair's situation has not changed: the pound is still under strong Brexit pressure, so any more or less large-scale price growth is perceived by the market as an occasion to open short positions. However, the lower limit of the range is very close - at the bottom of the 20th figure. To break through this level, traders need a more compelling reason, while the British are dominated by the usual market concern about the prospects of a "divorce proceedings". In other words, the pound/dollar is trapped in the grip of fundamental and technical factors. On the one hand, there is a strong support level of 1.2000, on the other hand, the lack of powerful information lines, against the background of general nervousness over the upcoming political battles in the House of Commons. That is why today's release did not cause much excitement among market participants. Although this is partly due to the fact that the published figures are controversial. Thus, the unemployment rate unexpectedly rose to 3.9%, although according to general expectations, it should have remained at the same level - 3.8%. The number of applications for unemployment benefits has also increased significantly - by 28 thousand. Although it is worth noting here that according to the consensus forecast, this indicator should have shown a more deplorable result: +42000. Therefore, the real numbers in the end turned out to be much better than expected. But the wage component showed the strongest result. This indicator (excluding bonuses) jumped to an 11-year high (3.9%), confirming the positive trend in recent months. Total pay, which includes bonuses, also pleased investors with a growth of up to 3.7% (a three-year high). It is worth recalling that the head of the Bank of England, Mark Carney, has repeatedly said that a possible increase in the rate will largely depend on the growth of wages, as this indicator spurs inflation. Of course, in the current environment, it all depends on Brexit's prospects, but if Parliament nevertheless blocks the "hard" scenario, then the likelihood of tightening monetary policy in the first half of next year cannot be ruled out. It is also worth noting that the pound paired with the dollar is now at its lowest values: the relative cheapness of the British currency will also play a role in accelerating inflation in the second half of the year. Thus, the correction of the GBP/USD pair allows traders to open short positions with a larger price gap in the future. The target of the downward movement is still the 1,2005 mark - this is a psychologically important level of support, to overcome which a powerful information occasion is necessary. Nevertheless, the pound-dollar pair continues to be in a downward trend, so it is advisable to use the pair's growth for a more profitable sale of the British currency. There is still no consensus among analysts whether the deputies of the House of Commons will be able to block the implementation of the hard Brexit scenario or not. Boris Johnson admitted yesterday that his main opponent, the leader of the Labour Party, Jeremy Corbyn, plans to drag out the country's exit from the European Union "for many years". Corbyn, in turn, does not hide the fact that he plans to initiate the issue of declaring a vote of no confidence in the prime minister. If the Conservatives cannot then form a government within 14 days, then the country will face early Parliamentary elections. True, Johnson may set the date for elections in November, that is, when the UK is already leaving the EU without any agreement. Anticipating such a scenario, Johnson's opponents can prevent its implementation. There is another option, which, however, was used only a few times in modern history - for example, during the Second World War and the global economic crisis of the early 30s of the last century (that is, during the Great Depression). It is about creating a "government of national unity", which is formed by members of the temporary inter-party majority. According to analysts, at the moment this is a very unlikely option, but nevertheless, it cannot be ruled out. A politically mottled Parliament can at a critical moment rally and prevent the hard Brexit. Thus, the outcome of the "Big Political Battle", as journalists have already dubbed the forthcoming confrontation between the prime minister and MPs, is far from a foregone conclusion. Therefore, the pair actually froze within the framework of the 20th figure, while maintaining a bearish potential. All this makes it possible for you to open short positions on the GBP/USD pair with corrective upward pullbacks while aiming for a downward goal in the price area of 1.2010. The material has been provided by InstaForex Company - www.instaforex.com |
| Complex euro or why the euro does not want to fall Posted: 13 Aug 2019 03:50 PM PDT The EU has published a series of data, from which it became clear that consumer prices in Germany unexpectedly rose in July. This slight acceleration, hopefully, will not affect market expectations regarding a reduction in the ECB deposit rate, as well as measures to further mitigate monetary policy. The European Central Bank made it clear in July that it was ready to lower short-term interest rates and restart a large-scale securities purchase program. In a statement following the meeting, financiers focused on the weakening economy of the region, and also expressed concern about global negative factors - trade conflicts and Brexit. The next meeting of the ECB will be held on September 12. An impressive package of measures is expected to be taken that day, including a 0.25% rate cut and a restart of the quantitative easing program. This puts pressure on both the single currency and the EUR/USD pair. At the same time, several diverse factors are currently operating on the financial markets. On the one hand, investors are worried about a new round of trade conflict between Beijing and Washington. The introduction of new import duties on Chinese goods and the "cross" put on Friday by D. Trump at the close of a trade deal increase the risks of a stronger slowdown in the global economy. On the other hand, the US economy looks quite stable when compared with other world giants, and continues to grow. Therefore, investments in US assets and the dollar continue to flow. The owner of the White House constantly criticizes the Fed for refusing to follow his lead in the matter of rate adjustment. However, easing monetary policy is unlikely to fulfill D. Trump's desire, significantly weakening the dollar's position. "Hard" Brexit will nevertheless take place in late October. Political and economic disagreements within the EU are growing: the Italian League is against the EU fiscal policy and demands an increase in the country's budget deficit, which contradicts EU rules. Do not discount the sluggish processes with regard to the EU in Greece and Spain, as well as the accelerating devaluation of national currencies in some states. Three central banks - India, Thailand, New Zealand - have cut rates. All these are underestimated risks, which only add a portion of negativity to the mood of the business. Given global geopolitical and economic problems, investors will prefer safe havens and the dollar. So, the shortest position on the EUR/USD pair will serve as the most profitable long-term strategy. |
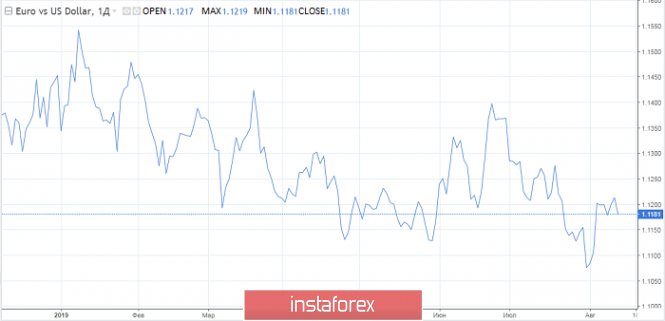
| Euro and dollar continue to play tug of war, awaits news from Europe and the United States Posted: 13 Aug 2019 03:50 PM PDT The first attempt of the EUR/USD pair to go beyond the range of short-term consolidation of 1.1165-1.1245 in the absence of important news was unsuccessful. Apparently, investors are now evaluating who is weaker: the dollar or the euro? The escalation of the Washington and Beijing trade war, the associated easing of the Fed's monetary policy and the increasing likelihood of a recession in the US are all against the greenback. The uncertainty around Brexit, the looming political crisis in Italy, the weakness of the German economy, and the expectation of a serious monetary stimulus with side of the ECB are all against the euro. "There is a risk that the United States will further increase tariffs on Chinese imports, and Beijing will respond accordingly. This increases the chances that economic growth in 2020 in China and the United States will be lower than the expected 6% and 1.7%," said experts at the international rating agency Moody's. It is assumed that the growing tension in trade relations between the United States and China, along with a sell-off on US stock markets, will not leave the Fed any choice but to lower the interest rate next month. Traders expect at least two acts of monetary expansion from the US central bank by the end of the year. However, the market is waiting for steps aimed at preventing an economic downturn not only from the Federal Reserve, but also from the ECB. Axa Investment Managers believe that only EUR 100-200 billion of monetary stimulus in the form of quantitative easing (QE) from the European regulator is taken into account in the EUR/USD rate. It is possible that this circumstance prevents the "bulls" on the euro from going on the offensive. According to the forecast of ABN Amro, the ECB will buy monthly assets worth €70 billion for three quarters. Morgan Stanley believes that it will be about €45-60 billion per month for one year. Goldman Sachs estimates the scale of the next quantitative easing program at €300 billion. If a decrease in the deposit rate by 0.1 basis points in September is most likely already taken into account in quotations, then the size of purchases of assets of the quantitative easing program is not yet fully implemented. Mario Draghi, who is set to leave the ECB presidency in the fall, can loudly slam the door and surprise the market participants with a tremendous monetary stimulus, then the bulls on the euro will have a hard time. Currently, pressure on the single European currency is being exerted by calls from Italian Deputy Prime Minister Matteo Salvini to hold early elections in the country, as well as expectations of weak data on German GDP and the eurozone. According to forecasts of the Bundesbank and Reuters analysts, in the second quarter the leading economy of the currency bloc slowed down by 0.1%. Recall that in January-March, an increase of 0.4% was recorded in quarterly terms. The departure of the indicator to negative territory can be a serious blow to the ambitions of the "European bears", and the principle "would not be worse" keeps them from taking active actions now. Meanwhile, the rating of Italian Deputy Prime Minister Matteo Salvini is only growing, despite the fact that the politician had earlier refused to fulfill Brussels' requirements (to reduce the budget deficit, increase the retirement age and increase VAT), as this would hit the welfare of Italians. It is possible that the "League of the North" led by M. Salvini will win the early elections if they do take place. However, this will lead Italy to an even greater confrontation with Brussels and, in general, to an unpredictable ending for the country. Thus, the EUR/USD pair still maintains a tendency to consolidate. However, the fragile balance, along with Brexit and the aggravation of the political situation in Italy, can disrupt the second quarter GDP report on the eurozone, as well as the July release on US retail sales, which will be released this week. |
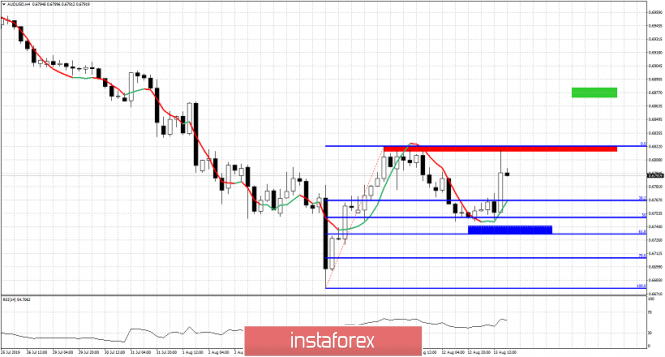
| AUDUSD turns higher respecting key Fibonacci support area Posted: 13 Aug 2019 03:12 PM PDT AUDUSD has held above the 61.8% Fibonacci retracement and has turned higher. In our last analysis we talked about the high probability of a short-term upward reversal as support at 0.6730 was very important.
Blue rectangle- support Green rectangle - target if red rectangle is broken AUDUSD confirmed today the importance of the 61.8% Fibonacci retracement level. Bouncing off that area confirmed our view from yesterday's post that this is a high probability turn around level. Resistance is the recent high at 0.6822 and a break above this level will open the way for another leg higher towards 0.6870. So far we have seen the formation of a higher low. Bulls need to defend recent lows. Failure to hold price above 0.6745 will increase the chances of new lows below 0.6677. The material has been provided by InstaForex Company - www.instaforex.com |
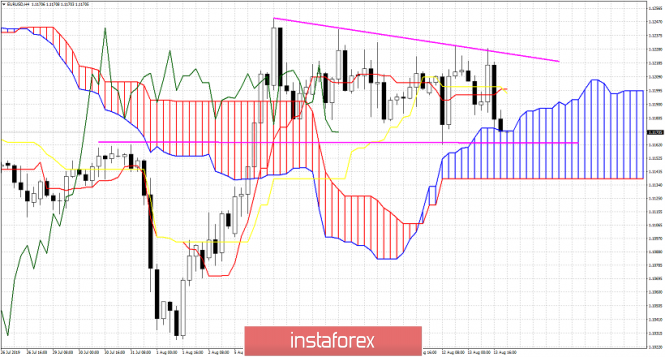
| Ichimoku cloud analysis for EURUSD Posted: 13 Aug 2019 03:05 PM PDT EURUSD remains trapped inside the short-term trading range between 1.1250 and 1.1165 while at the same time price is challenging 4 hour cloud support. There are many chances of bouncing from current levels but if price breaks above 1.1230 again, then we should expect more upside for this pair.
EURUSD is challenging support at 1.1165-1.1170. Price is at the edge of the upper Kumo (cloud) boundary. This is important support. Breaking inside the cloud will turn short-term trend neutral in cloud terms. Breaking below 1.1138 will turn it bearish. Resistance is found at 1.12 and at 1.1230. Breaking above these levels will push price towards 1.13. The current price form of the recent sideways move implies that we are in a corrective phase. The upward move from 1.1026 to 1.1249 looks impulsive. This tells me that at least one more leg higher should be expected. The material has been provided by InstaForex Company - www.instaforex.com |
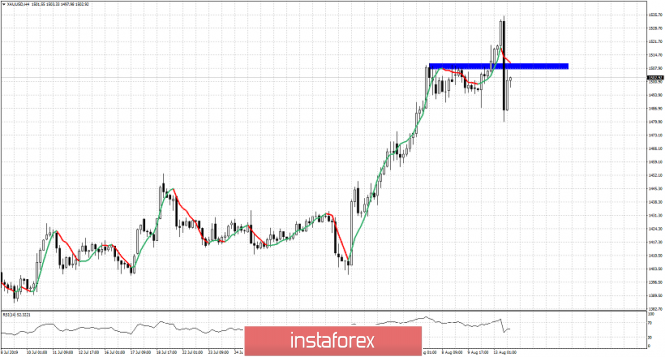
| Gold bulls were warned for possibility of fake break out Posted: 13 Aug 2019 02:58 PM PDT Gold price broke the bullish flag pattern but as we explained in our last analysis, there were many warning signs that made us expect a move to $1,535 to be enough and that a possibility of fake break out was high. This is exactly what we got.
Gold price reached our $1,535 target. Gold price sharply reversed and fell towards $1,480. Resistance is at $1,510. The break out above $1,510 was most probably a fake one and price is most probably going to move lower. As long as price is below $1,510-20 area I expect to see more selling pressures. Failure to hold above recent low at $1,480 will confirm our bearish view on Gold. Bulls were warned to be cautious. Recapturing $1,510 is important for bulls if they want to continue their up trend towards $1,550. The material has been provided by InstaForex Company - www.instaforex.com |
| August 13, 2019 : GBP/USD Intraday technical analysis and trade recommendations. Posted: 13 Aug 2019 09:00 AM PDT
Since May 17, the previous downside movement within the depicted bearish channel came to a pause allowing the recent sideway consolidation range to be established between 1.2750 - 1.2550. On July 5, a bearish range breakout was demonstrated below 1.2550 (the lower limit of the depicted consolidation range). Hence, quick bearish decline was demonstrated towards the price zone of 1.2430-1.2385 (the lower limit of the movement channel) which failed to provide consistent bullish demand for the GBP/USD. Moreover, Bearish breakdown below 1.2350 facilitated further bearish decline towards 1.2320, 1.2270 and 1.2100 which correspond to significant key-levels on the Weekly chart. The current price levels are quite risky/low for having new SELL entries. That's why, Previous SELLERS were advised to have their profits gathered. Last week, temporary signs of bullish recovery were being demonstrated around 1.2100 before Friday when another bearish movement could be demonstrated towards 1.2025. Recent bullish recovery was demonstrated off the recent bottom (1.2025) bringing the GBP/USD pair back towards 1.2100 (recently-established SUPPLY Level). This is supposed to enhance further bullish advancement towards 1.2230 then 1.2320 if sufficient bullish momentum is demonstrated above 1.2100. Trade Recommendations: Intraday traders are advised to look for early bullish breakout above 1.2100 then above 1.2230 for counter-trend BUY entries. Conservative traders should wait for bullish pullback to pursue towards 1.2320 - 1.2350 for new valid SELL entries. S/L should be placed above 1.2430. Initial T/P level to be placed around 1.2279 and 1.2130. The material has been provided by InstaForex Company - www.instaforex.com |
| August 13, 2019 : Expectations of a bearish breakout below 1.1175 for the EUR/USD pair. Posted: 13 Aug 2019 08:27 AM PDT
Back in June 24, the EURUSD looked overbought around 1.1400 facing a confluence of supply levels. Thus, a bearish movement was initiated towards 1.1275 followed by a deeper bearish decline towards 1.1235 (the lower limit of the previous bullish channel) which failed to provide enough bullish support for the EUR/USD pair. In the period between 8 - 22 July, sideway consolidation-range was established between 1.1200 - 1.1275 until a triple-top reversal pattern was demonstrated around the upper limit. Shortly after, evident bearish momentum (bearish engulfing H4 candlestick) could bring the EURUSD back below 1.1235. Early bearish breakdown below 1.1175 facilitated further bearish decline towards 1.1115 (Previous Weekly Low) where temporary bullish rejection was demonstrated before bearish breakdown could take place on July 31. On July 31, Temporary Bearish breakdown below 1.1115 allowed further bearish decline towards 1.1025 (lower limit of the depicted recent bearish channel) where significant signs of bullish recovery were demonstrated. Risky traders were advised to look for bullish persistence above 1.1050 as a bullish signal for Intraday BUY entry with bullish target projected towards 1.1115, 1.1175 and 1.1235. It's already running in profits. S/L should be advanced to 1.1160 to secure existing profits. During the past week, the depicted Key-Zone around 1.1235 has been standing as a prominent Supply Area where TWO Bearish Engulfing H4 candlesticks were demonstrated. Earlier Yesterday, another bullish visit was demonstrated towards 1.1235 where another episode of bearish rejection was anticipated. Thus, the EUR/USD remains trapped between 1.1235-1.1175 until breakout occurs in either directions (probably to the downside). Bearish breakdown below 1.1175 is mandatory to allow further bearish decline towards 1.1125-1.1115 where another intermediate-term bullish position can be offered (The right shoulder of the expected reversal pattern). Trade recommendations : Conservative traders should wait for a deeper bearish pullback towards 1.1125-1.1115 for a valid BUY entry (where the right shoulder of the reversal pattern is expected to be located). S/L should be placed just below 1.1080 while initial T/P levels should be located around 1.1160 and 1.1200. The material has been provided by InstaForex Company - www.instaforex.com |
| BTC 08.13.2019 - Down break of the 5-day consolidation Posted: 13 Aug 2019 07:06 AM PDT Industry news: Blockchain interoperability network Based on the daily time-frame, I found that there is a down breakout of the 5-day balance and rejection of the upper Bollinger band at the price of $12.400. Daily Stochastic is in overbought zone and there is a fresh down cross, which is good confirmation for further downside. Important levels to watch based on daily view: Resistance levels: $11.200 $12.100 Support levels: $10.620 $9.411 4H time-frame view:
Based on the 4H time-frame, I found new momentum on the MACD and Stochastic oscillator, which is sign of the underlying bearish pressure. I also found failed test of the resistance at the price of $12.350, which is good confirmation of the weak buying. Trading recommendation: According to current condition, my advice is to watch for selling opportunities with the downward targets at the price of $10.620 and $9.40, The material has been provided by InstaForex Company - www.instaforex.com |
| Posted: 13 Aug 2019 06:45 AM PDT 4-hour timeframe
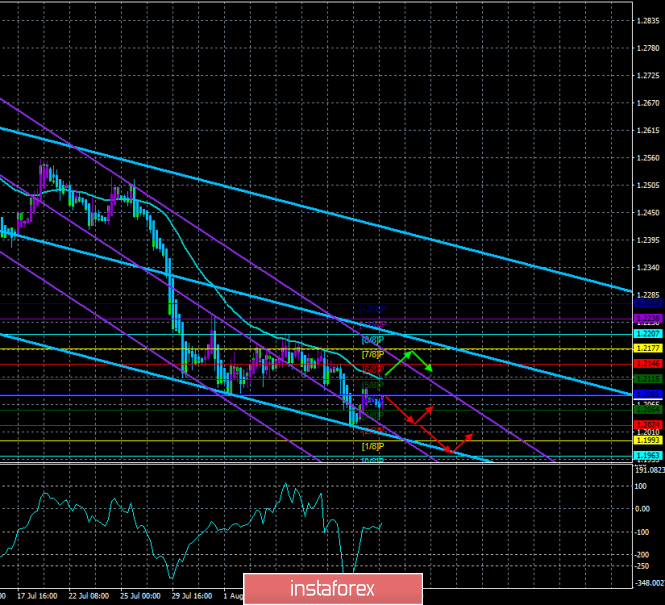
Technical data: The upper linear regression channel: direction – down. The lower linear regression channel: direction – down. The moving average (20; smoothed) – down. CCI: -60.9673 Earlier, we have repeatedly said that the initiatives of Boris Johnson about Brexit by all means, that is, the "hard" Brexit, are not supported by all. The Parliament, which out of 650 members has 200 Labor (ardent opponents of the "hard" Brexit) and 258 Conservatives, which theoretically can support Boris Johnson, is far from the fact that it will approve the "divorce" with the European Union without agreement. Mark Carney has long opposed the "hard" Brexit, warning that the consequences will be devastating. Now, it became known that the population of the UK is actively preparing for October 31, purchasing food and necessities. In total, each Briton spent an additional 380 pounds on these items. A little earlier, British Foreign Minister Dominique Raab said that Brussels will be responsible for the "chaotic" Brexit. Raab believes that since Brussels refuses to conduct new negotiations on the terms of the "divorce", Brussels is responsible for all the consequences. Very convenient logic. The fact that it was the British government (Theresa May) that reached an agreement with the EU, and then the same British government (Parliament, whose composition remained unchanged) rejected the agreement 3 times, does not matter for Boris Johnson and Dominic Raab. Well, let's see where Johnson's politics will lead Great Britain and whether only England and Wales will remain from the United Kingdom in a few years. Pound sterling today is minimally adjusted, however, it retains excellent chances for the resumption of the fall. The unemployment rate in the UK in June rose to 3.9%, and wages rose, but these reports are not particularly interested in currency traders. Nearest support levels: S1 – 1.2054 S2 – 1.2024 S3 – 1.1993 Nearest resistance levels: R1 – 1.2085 R2 – 1.2115 R3 – 1.2146 Trading recommendations: The GBP/USD pair is currently being adjusted. Therefore, after the reversal of the Heiken Ashi indicator down, it is recommended to resume buying the US dollar with the goals of 1.2024 and 1.1993. Buying the pound/dollar pair is still very risky. In addition to the technical picture, you should also take into account the fundamental data and the time of their release. Explanation of illustrations: The upper linear regression channel – the blue line of the unidirectional movement. The lower linear regression channel – the purple line of the unidirectional movement. CCI – the blue line in the indicator regression window. The moving average (20; smoothed) – blue line on the price chart. Murray levels – multi-colored horizontal stripes. Heiken Ashi is an indicator that colors bars in blue or purple. The material has been provided by InstaForex Company - www.instaforex.com |
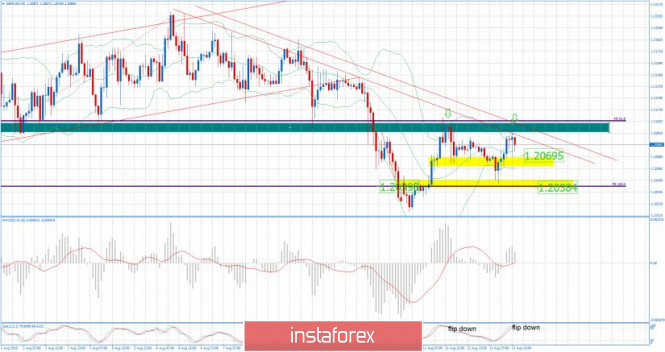
| Posted: 13 Aug 2019 06:38 AM PDT GBP/USd reached both our yesterday's target and after that it started to rally. GBP has been trading upwards in past 8 hours but I found good resistance at the price of 1.2100. Seems like that the level of 1.2100 is critical for this currency pair. As long as the level of 1.200 is holding, I would watch for selling opportunities.
Green rectangle – Major short-term resistance (1.2100) Yellow rectangle: - Support 1 (1.2070) Yellow rectangle Support 2 (1.2038) Red line – Resistance down slope line GBP/USD is trading near the important resistance, it is very risky to watch for any buying at this stage. Stochastic oscillator is showing the overbought condition and fresh down cross, which is good confirmation for the downward movement. The overall short-term trend is bearish and you should focus on downward opportunities Trading recommendation: Watch for selling opportunities with the targets at 1.2070 and 1.2038. The material has been provided by InstaForex Company - www.instaforex.com |
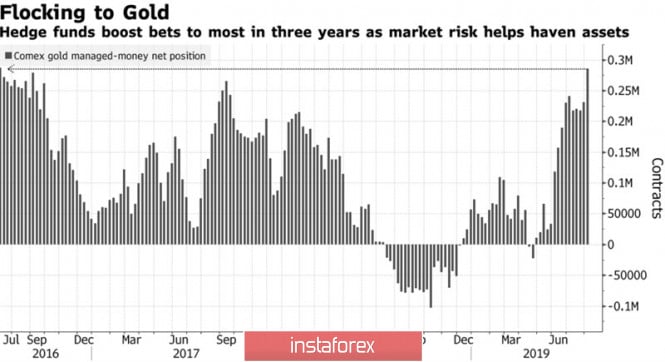
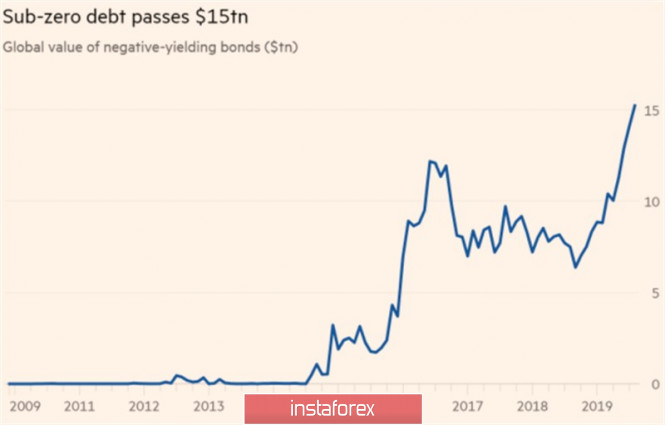
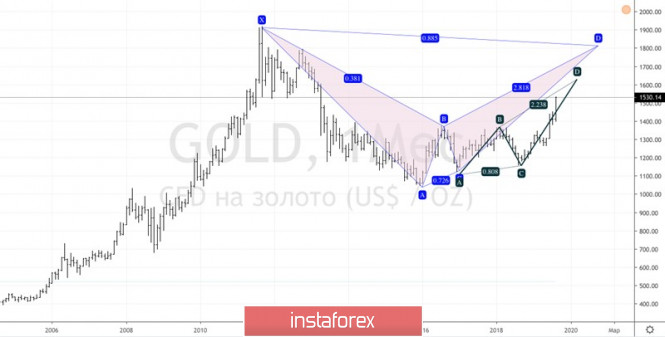
| Posted: 13 Aug 2019 06:35 AM PDT The higher the gold futures quotes rise, the more bulls become bolder. Goldman Sachs predicts that the precious metal will rise to $1,600 per ounce in 6 months. Citi is confident that he will conquer this mark within 6-12 months. BofA Merrill Lynch believes gold will rewrite a historic high of $1,921 and reach $2,000 an ounce in two years. However, few believed in the growth of XAU/USD above $1,500 at the beginning of the year. Then, it seemed that the Fed's passivity and de-escalation of the US-China trade conflict were creating a fair wind for the global economy. The reality turned out to be different. Precious metal comes on all fronts as hedge funds at the end of the week by August 6 increased net longs to the maximum levels for the last two years and the inflow of capital into the ETF does not stop for a moment. Also, Central banks bought 374 tons in the first half of the year and are ready to rewrite the record of 2018 and then they purchased 650 tons of gold for 12 months. The dynamics of speculative positions and gold The main drivers of the XAU/USD rally are the slowdown in global GDP and the inability of central banks to cope with it. The Fed lowers rates in response to increased international risks and the ECB in response to the growing likelihood of a recession in the German economy. However, the potential for monetary expansion of many of the world's leading regulators is limited. Their rates are already negative. At the same time, rumors of a slowdown in the global economy and a massive monetary stimulus are pushing bond yields down. Already $15 trillion in global debt market assets are being traded at negative rates. In fact, investors pay for placing their own money and the slower inflation rises, the more they are willing to pay. Dynamics of negative yield bonds Why bear the cost if you can buy gold? It does not bring interest income, but this is not necessary in the conditions of an approaching recession. Money needs to be saved, we always have time to earn. This principle guides investors and increase the share of precious metals in portfolios. Oil in the fire of the XAU/USD rally is adding to the aggravation of political risks in Britain, Argentina and Hong Kong, as well as talk that the most pessimistic options for the development of events, have not yet been taken into account in quotes of financial instruments. As US stock indices enter a full-blown correction due to the disruption of the next round of US-China trade negotiations in September, gold purchases will gain new momentum. In this regard, the forecasts that the analyzed asset will reach the level of $1600 per ounce do not look like a pipe dream. In favor of the XAU/USD "bulls" is the growing likelihood of a weakening monetary policy of the Fed. The derivatives market gives a 100% and a 25% probability of a federal funds rate cut of 25 and 50 bp at the September FOMC meeting. The chances of her falling from 2.25% to 1.5% before the end of 2019 are slightly less than 90%. Technically, precious metals moving beyond the long-term consolidation range of $1100-1400 per ounce, followed by activation of the AB = CD and Bat patterns, increase the risks of continuing the upward campaign to $1625 and $1815. Gold monthly chart |
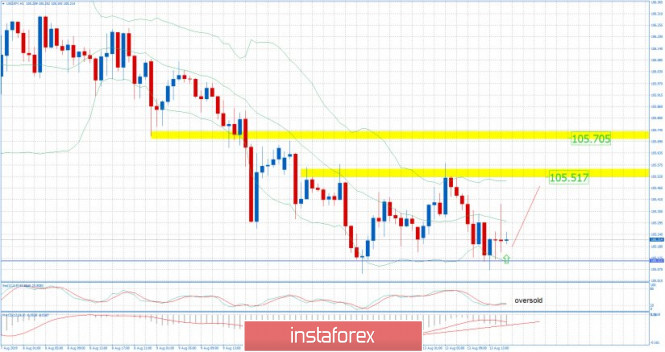
| USD/JPY analysis for August 13, 2019 - Support on the test, potential for rally Posted: 13 Aug 2019 06:25 AM PDT USD/JPY has been trading downwards in past 10 hours but I found good rejection of the important support at the price of 105.10, which is for me sign that sellers lost downside momentum and that rally is on the way.
Yellow rectangle: - Resistance 1 (105.51) Yellow rectangle – Resistance 2 (105.70) Blue horizontal line – Support (105.10) USD/JPY got strong rejection of the important support in the background at the price of 105.10, which is sign for further rally. Stochastic oscillator is in oversold condition, which is another good confirmation for my long bias. Additionally, there is the fresh flip up on Stochastic. MACD oscillator is showing the decreasing in the downside momentum, which adds more confirmation for our bullish view. Trading recommendation: According to current market conditions, my advice is to watch for buying opportunities as long as the JPY is trading above the 105.05. The material has been provided by InstaForex Company - www.instaforex.com |
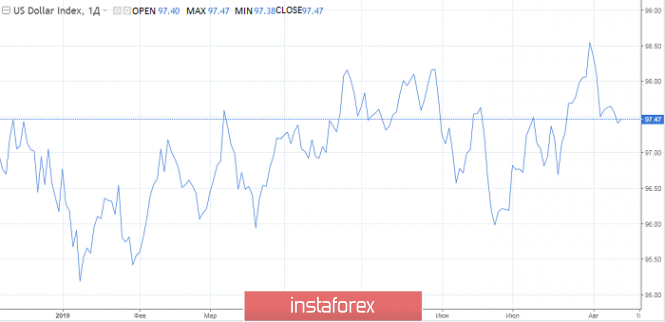
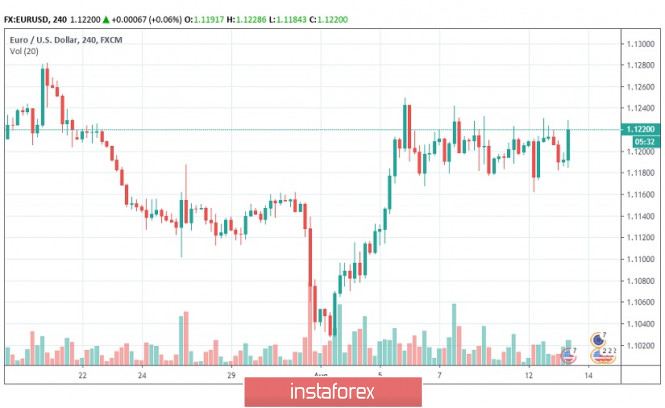
| Dollar unable to keep its gains on firm US CPI data Posted: 13 Aug 2019 05:58 AM PDT The US consumer prices (CPI) increased by 0.3% in July, in line with consensus forecasts, and the year-on-year reading was slightly higher than expected at 1.8% from the previous level of 1.6%. Core inflation was stronger than expected and rose by 0.3%, while the year-on-year index strengthened to 2.2% from 2.1%. The Fed targets 2.0%. Treasuries dipped lower following the rise of the 10-year yield to 1.65% from lows below 1.63% in early European trading. There was, however, a flattening of the yield curve which undermined sentiment, and treasuries quickly rallied. The data should slightly dampen expectations that the Federal Reserve will cut interest rates aggressively on the grounds of low inflation. In an immediate response, EUR/USD edged lower to 1.1210 from 1.1220, while USD/JPY inched up to 105.35 from 105.20, although dollar gains faded quickly. Ahead of the CPI release, futures markets were pricing in a 79% chance of a further 0.25% rate cut at the September FOMC meeting with a 21% chance of a 0.50% rate cut. The expectations of a September rate cut are still strong, but the likelihood of a 0.50% cut has diminished after the CPI data with futures. Now there is only a 7% chance of a 0.50% rate cut. This shift will provide support to the greenback. Nevertheless, trade and growth fears are likely to dominate in the short term, and confidence will be extremely fragile. Political fears surrounding Hong Kong will also be a significant factor boosting risks and leading to further demand for the yen. The short positions on the euro might start getting closed given the growing risk of a breakout from a very narrow range.
|
| Gold rally is just around the corner, experts say Posted: 13 Aug 2019 05:51 AM PDT Analysts say the high probability of another precious metal rally is currently high, despite massive purchases of gold by both the leading central banks of the world and by active market participants. This is facilitated by the unstable geo-political situation, which was "fueled" by the escalation of the trade conflict between the US and China and the deterioration of the prospects for the global economy. Gold is currently trading at its highest over the past six years. The increase in the cost of the yellow metal is facilitated by a massive reduction in rates by the largest central banks and the devaluation of the Chinese currency. In such a situation, gold becomes a reliable protective asset that is not subject to government control. Central banks provided an additional incentive to purchase precious metals due to the easing of monetary policies, experts emphasized. The Reserve Bank of New Zealand (RBNZ) surprised markets by cutting its interest rate by 50 basis points (bp) to 1%. Other regulators, such as the Central Bank of India and the Central Bank of Thailand, also cut rates - to 5.4% and 1.5%, respectively. On the Monday auction, August 12, gold actively held a leading position and held in the "green" zone. The number one precious metal was trading at $1,502 per 1 troy ounce. Last week, the price of the yellow metal updated its six-year high amid tensions in Sino-US relations, as well as in connection with a slowdown in global economic growth. Precious metal is currently trading at $1,536 per 1 troy ounce. When analyzing the dynamics of gold, experts pay attention to the specific alignment of the target level at $1,550. Experts are sure that if it exceeded, buyers will have a road to such indicators in $1600, $1700 and $1800. A similar increase is expected if demand for defensive assets increases. At the moment, a strong support level is located near the value of $1450. According to Whitney George, head of the hedge fund for precious metals, protracted trade conflicts will escalate into currency wars. The latter may lead to devaluation of national currencies. In the event of such a development of events, the value of gold will grow exponentially, convincing W. George. Currently, analysts at leading US investment banks predicts a rise in prices for the yellow metal. They believe that the price of gold will rise to $1,600 per 1 troy ounce at the beginning of 2020. After two years it will increase to $2,000 per 1 ounce. Most traders and experts, namely 69%, are optimistic about the future prospects of precious metals. The material has been provided by InstaForex Company - www.instaforex.com |
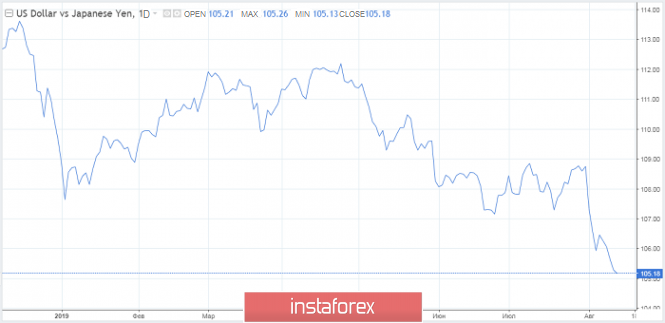
| Markets run from risks in Hong Kong, Italy, Argentina Posted: 13 Aug 2019 05:51 AM PDT Market participants abandon risk. The main trend is leaning towards craving of protective assets and currencies. The main currency is the Japanese yen, which has risen in price to 105.04 per dollar, hinting at breaking through another barrier in the form of the 104th figure. The Swiss franc shows protective functions, while gold rushed to new heights, having risen in price by 7.2%. Eurocurrency also received support, although to a lesser extent. Italian political problems again began to exert pressure on its value. The main reasons for the risk aversion are the growing tension around the riots in Hong Kong and the unexpected victory of the opposition at the preliminary stage of the elections in Argentina. The already negative picture is supplemented by fears of abandoning market reforms and the possible extension of default on the country's debts. Abyss According to Hong Kong's weary leader Carrie Lam, the Asian financial center is in danger of slipping into the abyss. Protests forced the authorities to close the airport and led to a fall in shares on Monday, then the decline continued on Tuesday. Market participants are trying to understand how seriously protests will affect the economy. It is worth noting that the extremely difficult situation in Hong Kong strengthens the US position in the upcoming trade negotiations in September, which, according to Donald Trump, may not take place. These statements are the main reason for the growth of the Japanese yen. The American leader fell in one swoop that crossed out the possibility of signing a deal in the foreseeable future. It will soon become clear how real are the threats of the US president. Perhaps, he just shakes the air with his comments. The 105 mark offers as the extreme value for the USD / JPY rate. In this area, the pair briefly failed in March last year with a strong weakening of the dollar as the reason. Now, it craves for defensive assets. The Bank of Japan was very dissatisfied with the growth of the national currency at that time. It is possible that this time, the rhetoric of the Central Bank or the government regarding the yen will change. On the other hand, the 105 mark is an intermediate stage. Japanese authorities are likely to demonstrate stiff resistance to the yen growth no earlier than on the way to 100. This is a psychologically important level, where the USD/JPY pair has been unfolding since 2014. Where will Italy lead Europe? Experts' fears are beginning to come true: a political crisis erupted in Italy. The fragile coalition government of the country seems ready to collapse. Two party leaders continue to attack each other and it was suggested on Monday that Matteo Salvini "betrayed" the Italian people. Now the question of a no confidence vote in the government is being decided. Meanwhile, the third-largest economy in the eurozone is going through hard times. Poverty levels are rising, public debt has reached tremendous proportions, and the authorities are busy building up social obligations instead of budget savings, as Brussels requires. Italy follows the scenario of potential default. The euro has so far been quite resilient to such fears, but this could change quickly if things get worse. Another European-British risk is Brexit. The British pound risks an uncontrolled fall below 1.20 in the case of new careless formulations of officials. From the point of view of technical analysis, the pound is oversold, which makes it attractive to long-term investors. Here you need to show dexterity -quickly connect to shopping on the realization that the worst case scenario is already in the quotes. |
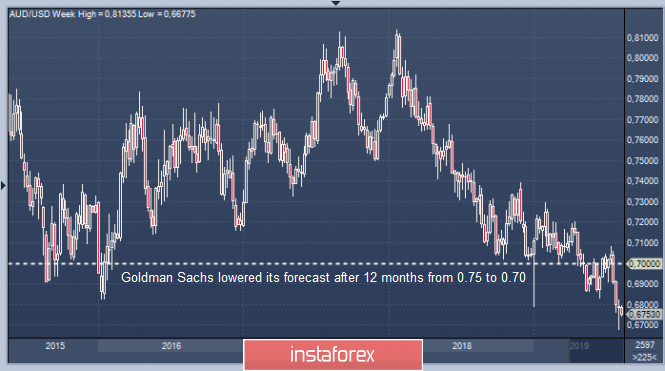
| Gone to the bottom: "Australian" and "New Zealander" may weaken Posted: 13 Aug 2019 05:09 AM PDT According to the forecast of analysts of the largest bank, Goldman Sachs, the Australian and New Zealand national currencies may be at the most disadvantageous position in the near future. The reason for this is that experts consider the protracted trade conflict between the United States and China. Goldman Sachs financial strategists significantly lowered their forecast for the AUD/USD and NZD/USD pairs for the next 12 months. Earlier, the indicator for AUD/USD pair was 0.75 but now it has been revised downward to 0.70. Bank experts also worsened the scenario for the "Australian" for the next six months to 0.69 from the previous 0.70. On Tuesday, August 13, the currency of the Green Continent is trading at 0.6767 per 1 US dollar. The forecast for the New Zealand dollar also leaves much to be desired. Analysts at Goldman Sachs also revised it downward to 0.66 in the next 6 months and 0.67 in 12 months. Previously, the NZD/USD indicator was 0.68 and 0.71, respectively. Currently, the "New Zealander" is trading in the range from 0.64 to 0.65 per 1 US dollar. Experts recommend investors not to invest in the Australian dollar in the near future but to observe the state of the market. Slowing growth in Australia, as well as lower interest rates by the Reserve Bank of New Zealand, prompted Goldman Sachs analysts to revise downward their forecasts for the Australian and New Zealand dollars. Last week, the AUD/USD pair reached a 10-year low. At the same time, analysts believe that the market underestimates the likelihood of a rate cut this year and its effect on the national currency. Experts are confident that the Reserve Bank of Australia (RBA) will begin the process of easing monetary policy in October 2019. The regulator has no reason to keep the rate unchanged, economists say. Earlier, the Reserve Bank of New Zealand (RBNZ) also reduced its key rate by 50 basis points to 1%. Experts believe that easing the policies of the Fed, the ECB, and the RBNZ could push the RBA to cut rates below 1%. The gradual deceleration of the global economy also has a negative impact on current processes. In this regard, the "Australian" will face further losses, especially in relation to the American and Japanese currencies, experts concluded. Goldman Sachs believes that the growth potential of the Australian and New Zealand dollars will be limited by the trade confrontation between the US and China, as well as weakening economic indicators. |
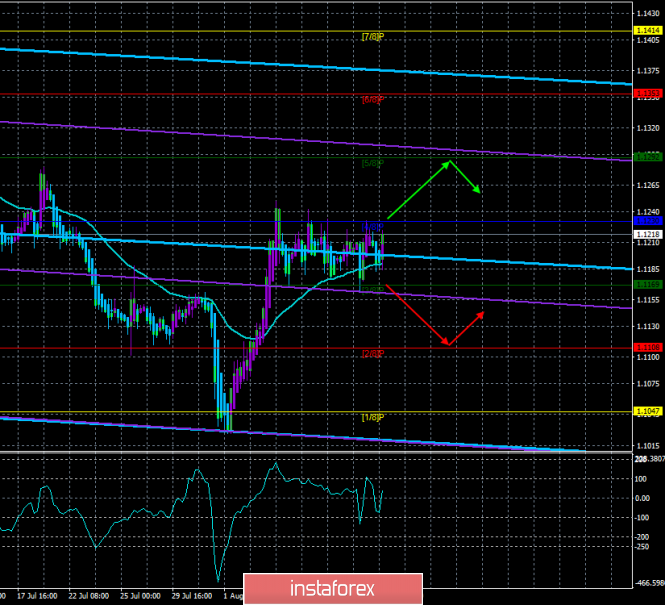
| Posted: 13 Aug 2019 05:04 AM PDT 4-hour timeframe
Technical data: The upper linear regression channel: direction – down. The lower linear regression channel: direction – down. The moving average (20; smoothed) – up. CCI: 40.0653 On August 13, the EUR/USD currency pair continues a frank flat. A couple of macroeconomic reports have been published so far, but none of them are really important. The economic sentiment index in the eurozone in August was at -43.6, according to research by the ZEW Institute. In Germany, the index of sentiment in the business environment also turned out to be absolutely a failure, -44.1. These reports did not have any impact on the movement of the currency pair, and should not have, but they clearly show what trends are currently prevailing in the European Union and indirectly answer the question of why the European currency is not growing, when it would seem that the situation for this is the most favorable. However, we continue to believe that despite the threat of a recession, thanks to the protectionist policy of Donald Trump, despite the fact that the Fed is ready to soften monetary policy, the US dollar yesterday still looks more attractive as a means of an investment than the euro. Although, of course, it is no longer as attractive as before. If the Fed reduces the total rate by 100 – 150 bps, as Trump wants, then the long-term downward trend for the euro/dollar pair may end. You cannot turn a blind eye to all the problems of the States, starting with the trade war with China, ending with the desire of Donald Trump to be re-elected for a second term. And these problems will affect the stock market, the foreign exchange market, the yield of securities, the monetary policy of the Fed, and the dollar. Nearest support levels: S1 – 1.1169 S2 – 1.1108 S3 – 1.1047 Nearest resistance levels: R1 – 1.1230 R2 – 1.1292 R3 – 1.1353 Trading recommendations: The euro/dollar pair continues to stay above the moving, being in a full flat. As before, we recommend buying the euro with a target of 1.1292, if traders manage to gain a foothold above the Murray level of "4/8" - 1.1230. It is recommended to sell the pair not earlier than fixing the price below the moving average line and completing the flat. In addition to the technical picture, you should also take into account the fundamental data and the time of their release. Explanation of illustrations: The upper linear regression channel – the blue line of the unidirectional movement. The lower linear regression channel – the purple line of the unidirectional movement. CCI – the blue line in the indicator window. The moving average (20; smoothed) - a blue line on the price chart. Murray levels – multi-colored horizontal stripes. Heiken Ashi is an indicator that colors bars in blue or purple. The material has been provided by InstaForex Company - www.instaforex.com |
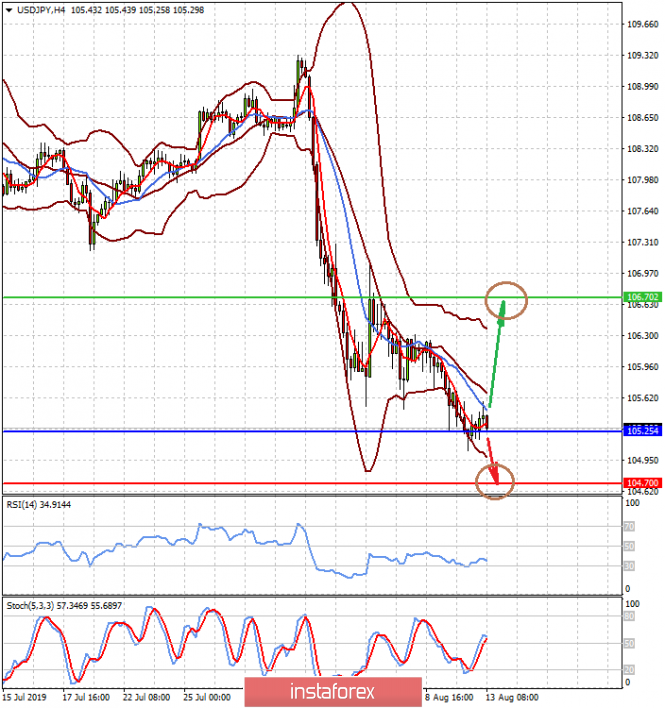
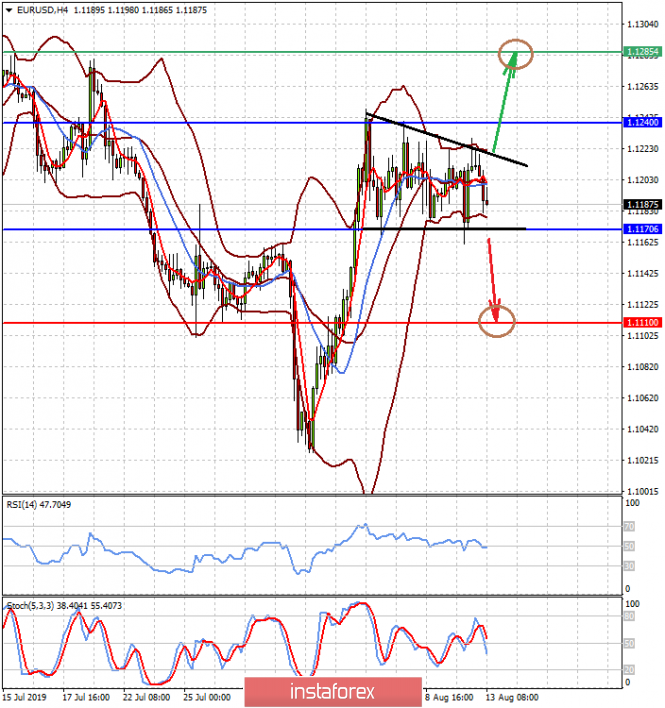
| Posted: 13 Aug 2019 04:12 AM PDT Today, the focus of the markets will be the publication of important data on consumer inflation in the States. They will have a direct impact on the likelihood of a possible continuation of the Fed rate cuts or not. According to the forecasts, the consumer price index should grow by 1.7% in annual terms against the increase a year earlier by 1.6%. On a monthly basis, it should grow by 0.3% in July against the June value of 0.1%. The basic value of the consumer price index for the year should maintain a growth rate of 2.1%, but its monthly rate will slightly reduce the increase to 0.2% in July from 0.3% a month earlier. It can be assumed that if these data turn out to be not worse than expected and even show an increase, then the correction in the US stock market will continue. The dollar will also receive significant support against major currencies, and commodity assets will also come under pressure. However, if the values of consumer inflation show at least a slight decrease, this will seriously support the market expectations of lowering the key interest rate by the Federal Reserve at the September meeting by 0.25%. While the dynamics of futures on rates on federal funds shows the probability of this is 76.5%. If a slight weakening of inflationary pressure is confirmed, it will lead to an increase in demand for risky assets, primarily stocks of American companies. Not only these currencies the Japanese yen and Swiss franc against the US dollar will weaken. It will also be possible to observe a corrective decline in the value of gold. Again, we emphasize that such dynamics should be expected only if the values of consumer inflation indicators are below forecasts. Forecast of the day: The USD/JPY pair found support at 105.25. If the values of consumer inflation in the United States show a decrease, we expect the pair to see promising growth to around 106.70. At the same time, an increase in the inflationary background will put pressure on the pair and it will continue to fall to 104.70. The EUR/USD pair moves in a narrow range amid expectations of data from the US and Germany, as well as the ECB meeting on monetary policy. We act in exactly the same way as in the case of the USD/JPY pair. With inflation rising, we are selling a pair with a probable target of 1.1100 and vice versa. On its decrease, we buy a pair with its possible growth to 1.1285. |
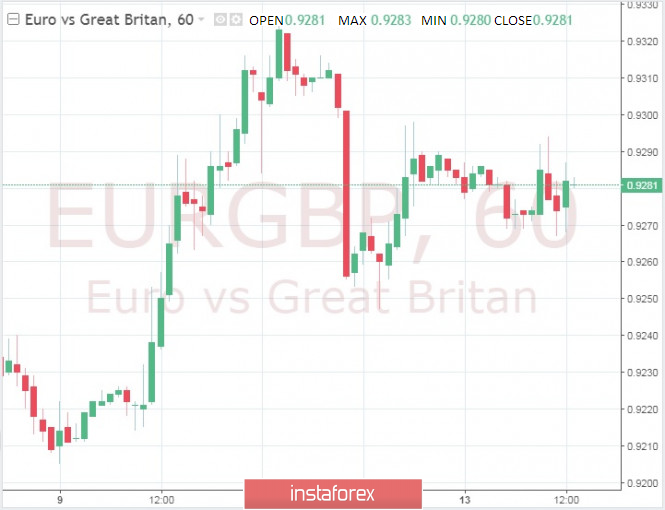
| EUR/GBP is losing ground and is testing the lows around 0.9270 Posted: 13 Aug 2019 03:15 AM PDT EUR/GBP falls and breaks through the lows around 0.9270. Now, the weaker tone around the single European currency encourages the pair to retreat. The pound managed to regain its composure after the indicators of the UK labor market surprised in a good sense of the word. The actual average income of the British rose in June by 3.7% year-on-year, while the unemployment rate was only 3.9%. The number of applications for state unemployment benefits in July increased by 28.0 thousand applications: this is below expectations and June figures. On the other hand, the British pound is still wary of news headlines about Brexit, where the probability of a "no-deal" is growing. There are also rumors surrounding Brexit about the possibility of early elections shortly before October 31 in case Prime Minister Boris Johnson will lose his former self-confidence. The forecast for the British pound is weak, especially given the growing chances of Brexit "without a deal" on October 31. Meanwhile, the closer the exit, the more acute the Irish question. The border between Northern Ireland and the Republic of Ireland will be the only land border between the UK and the EU, and the exit will mean the return of the physical border with the necessary infrastructure and customs control. In this regard, there are fears that such a rigid border could cause another surge of Irish separatism. Given the weak GDP data for the second quarter, the outlook for the economy and the currency is bleak. At the same time, the Bank of England left the policy unchanged and refuses to take into account the "no deal" scenario in its forecasts. The regulator is still preparing to raise the rate to achieve inflation. The material has been provided by InstaForex Company - www.instaforex.com |
| Posted: 13 Aug 2019 03:15 AM PDT
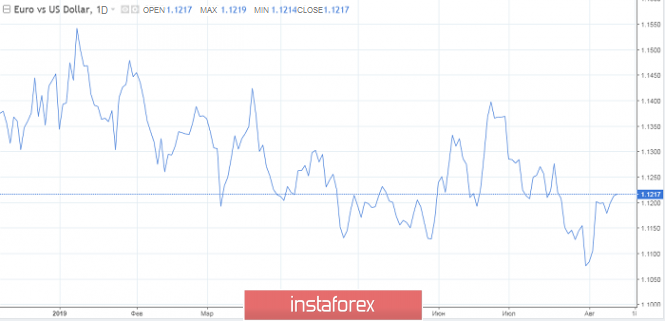
The EUR/USD pair is trading around 1.1200, which can already be called the usual level. The problems in the Italian Senate have added to the political uncertainty, and this puts pressure on the euro, but the dollar, on the contrary, is strengthening against the background of risk appetite. In general, the pair lacks a clear direction for the fifth day in a row. Last Tuesday, a Doji candle was formed on the chart– a sign of indecision and since then, EUR/USD remains trapped in a narrow range of 1.1250-1.1167. However, the fall of EUR/USD is limited around 1.1167 dollars. The stability of the euro at this level is due to rising tensions in the trade conflict between the US and China, the US and Iran, as well as protests in Hong Kong. Now, the European Central Bank is pursuing a policy of negative interest rates. Also, the yield curve of German government bonds for the first time shows negative indicators. Taking these factors into account, many market participants now define the euro as the currency for financing, which grows in the absence of risk sentiment, and during the rise of risk appetite is used to finance the purchase of relevant assets. The pair may continue to hold the 1.1167 line if the risk decreases. However, the single European currency can break through the lower limit of the recent trading range, if the data on the German economy does not meet expectations. The material has been provided by InstaForex Company - www.instaforex.com |
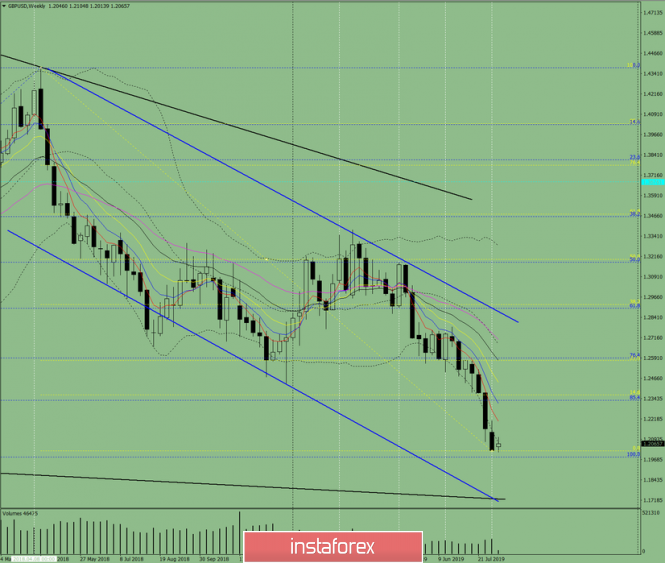
| Technical analysis for GBP/USD currency pair for the week from August 12 to 17, 2019 Posted: 13 Aug 2019 03:14 AM PDT Trend analysis. This week, the price will move up with the first target of 1.2363 – a pullback level of 14.6% (yellow dotted line).
Fig. 1 (weekly chart). Complex analysis: - Indicator analysis – down; - Fibonacci levels – up; - Volumes – up; - Candle analysis – up; - Trend analysis – down; - Bollinger Bands – up; - Monthly schedule – down. The conclusion from the complex analysis is the upward movement. The overall result of the calculation of the GBP/USD currency pair candle on the weekly chart: the price in the week is likely to have an upward trend with the absence of the first lower shadow of the weekly white candle (Monday – up) and the presence of the second upper shadow (Friday – down). This week, the price will move up with the first target of 1.2363 – a pullback level of 14.6% (yellow dotted line). The material has been provided by InstaForex Company - www.instaforex.com |
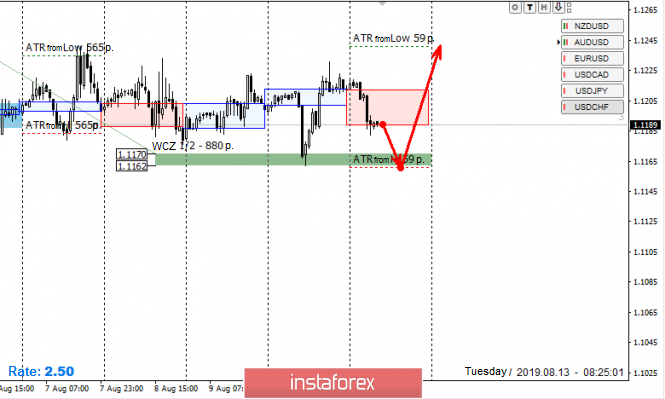
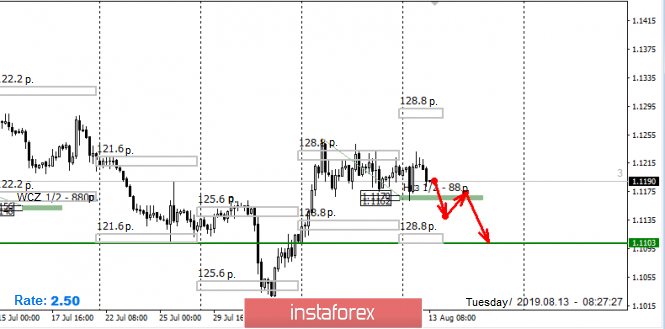
| Control zones for EUR/USD pair on 08/13/19 Posted: 13 Aug 2019 03:13 AM PDT Working within the medium-term flat implies the search for favorable prices for the purchase or sale from the boundaries of the accumulation zone. It is important to note that the main support is 1/2 WCZ of 1.1170-1.1162. While the pair is trading above the specified zone, the probability of updating the monthly maximum is 70%. Over the entire flat range, limit orders are being generated as new resources appear every day for growth and decrease at the same levels. To cancel the upward impulse, it will be necessary to close today's American session below the level of 1.1162. If this happens, the first goal of the decline will be the zone of the average weekly move located above the level of 1.1103. Daily CZ - daily control zone. The area formed by important data from the futures market, which changes several times a year. Weekly CZ - weekly control zone. The area formed by marks from the important futures market, which changes several times a year. Monthly CZ - monthly control zone. The area is a reflection of the average volatility over the past year. The material has been provided by InstaForex Company - www.instaforex.com |
| You are subscribed to email updates from Forex analysis review. To stop receiving these emails, you may unsubscribe now. | Email delivery powered by Google |
| Google, 1600 Amphitheatre Parkway, Mountain View, CA 94043, United States | |













No comments:
Post a Comment