
Forex analysis review |
- Forecast for EUR/USD on November 28, 2019
- Forecast for GBP/USD on November 28, 2019
- Forecast for AUD/USD on November 28, 2019
- Fractal analysis of the main currency pairs on November 28
- #USDX vs EUR/USD vs GBP/USD vs USD/JPY - H4. Comprehensive analysis of movement options from November 28, 2019 APLs &
- USD/JPY and its crosses - current situation
- Technical analysis recommendations for EUR/USD and GBP/USD on November 27
- EUR/USD. November 27. Results of the day. The US economy is showing signs of acceleration. Traders ignore all the news of
- EURUSD: the growth of the US economy and a drawback for dollar bulls
- Buying the Canadian currency looks attractive - Wells Fargo
- UK elections are just around the corner, or is the pound playing election solitaire
- Gold keep bulls in the pen
- Euro goes on thin ice
- Pound is not so simple: the current recession will be followed by growth
- Ichimoku cloud indicator analysis of EURUSD for November 27, 2019
- Ichimoku cloud indicator analysis of Gold for November 27, 2019
- BTC 11.27.2019 - Potential end of the upward ABC correction, watch for downside
- Gold 11.27.2019 -Daily analysis, downward potential is in play
- EUR/USD for November 27,2019 - First downwrad target on EUR at 1.0992 reached, potential for more downside and test of the
- Evening review EURUSD 11/27/2019. News came out
- November 27, 2019 : EUR/USD Intraday technical analysis and trade recommendations.
- November 27, 2019 : GBP/USD Intraday technical analysis and trade recommendations.
- Trading recommendations for the EURUSD currency pair - placement of trade orders (November 27)
- GBP/USD: plan for the American session on November 27. Buyers of the pound managed to implement a bullish scenario and are
- EUR/USD: plan for the American session on November 27. The euro shows no signs of life. Data on inflation in Germany was
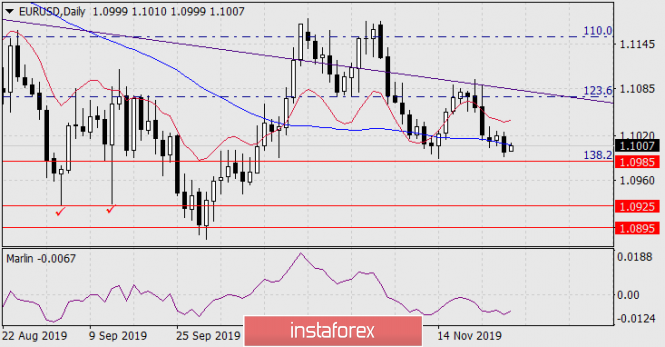
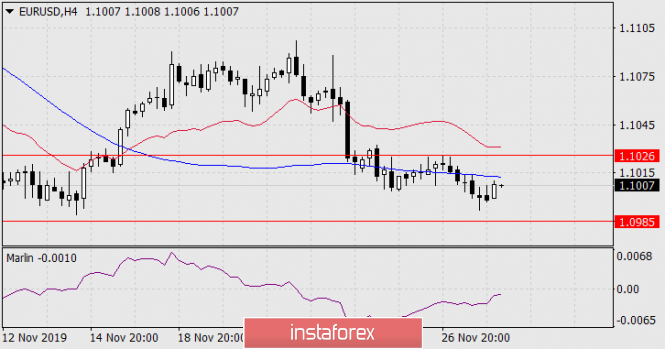
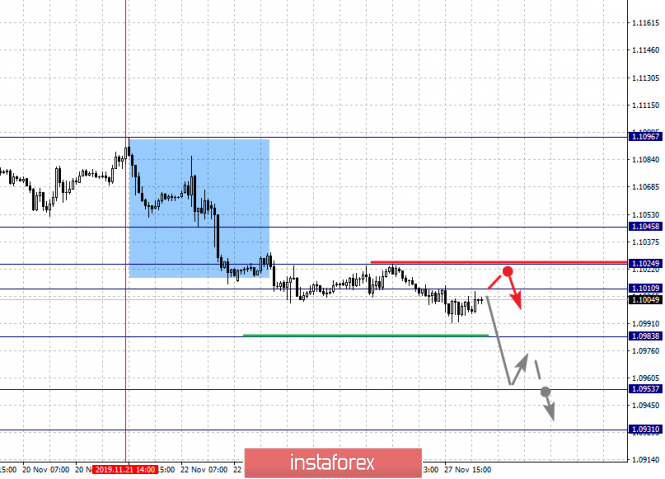
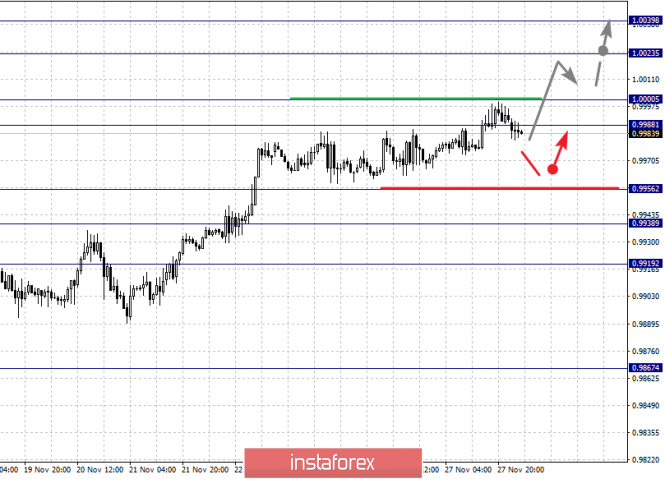
| Forecast for EUR/USD on November 28, 2019 Posted: 27 Nov 2019 07:10 PM PST EUR/USD On Wednesday, US statistics continued to delight investors and markets swayed towards the dollar. The euro lost 22 points. GDP for the third quarter amounted to 2.1% against the expectation of 1.9%, the volume of orders for durable goods increased by 0.6% in October against the forecast of -0.5%, personal expenses of consumers increased by 0.3 % in October. It is a public holiday today in the United States, On the daily chart, the price went below the MACD indicator line. If today closes with a black candle, then the price will consolidate below it with the prospect of a medium-term decline. The immediate goal of this movement at 1.0925 is the lowest level of September 3 and 12. In the four-week period, the price of 1.0720/30 can be reached - the lower line of the blue price channel (visible on a very tight chart). The Marlin oscillator lies in the horizon in the negative trend zone, volatility is likely to be low in the thin market today. On a four-hour chart, the price has consolidated under the blue line of MACD. The range between the levels of 1.0985-1.1026 is likely to be today (perhaps even tomorrow) a consolidation zone. The material has been provided by InstaForex Company - www.instaforex.com |
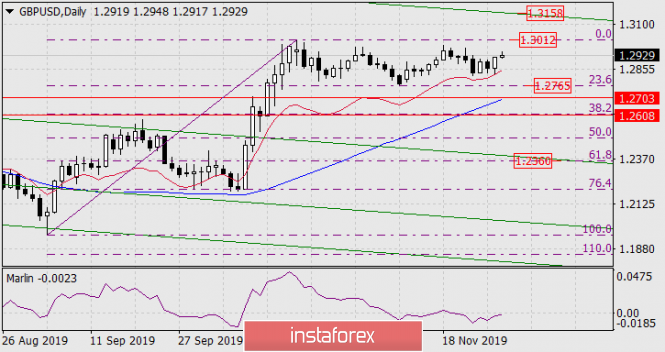
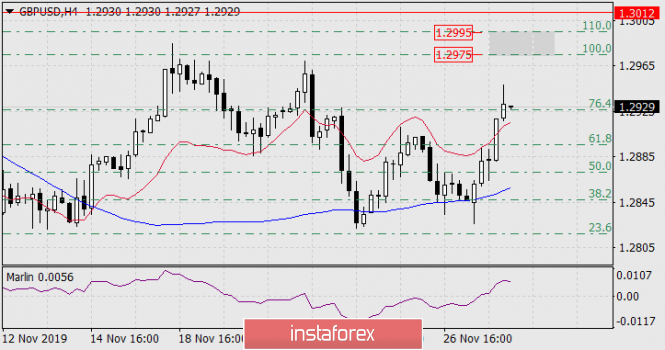
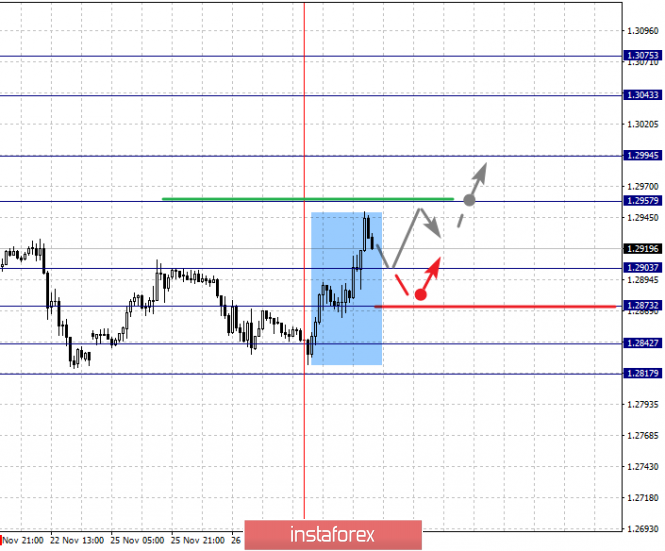
| Forecast for GBP/USD on November 28, 2019 Posted: 27 Nov 2019 06:44 PM PST GBP/USD The British pound grew by 56 points yesterday and continues to slightly grow today in the Asian session at new polls in the UK about the preferences of the electorate. The Conservative Party received 43%, while was at Labor 32%. Johnson's party can form a majority government. On the daily chart, the price pushed up from the red indicator line of balance. The price can reach the enclosed line of the falling green price channel in the region of 1.3158, but only if it can resolve several important nuances. The first of them is the exit of the Marlin oscillator signal line into the zone of positive numbers; it can happen if the price approaches close to the Fibonacci line of 0.0%. The second one is on a four-hour chart, the price is waiting for the resistance zone from the Fibonacci levels of 100.0% and 110.0% 1.2975-1.2995. On this chart (H4), the price has consolidated above the line of balance, the balance is shifted upward, the Marlin oscillator is growing, we are waiting for continued growth in the resistance range 1.2975-1.2995. If the price turns down from it, then this will be a rare case of the fourth peak on the daily chart, which was mentioned in the previous review. The scenario with local growth has now become the main one. The material has been provided by InstaForex Company - www.instaforex.com |
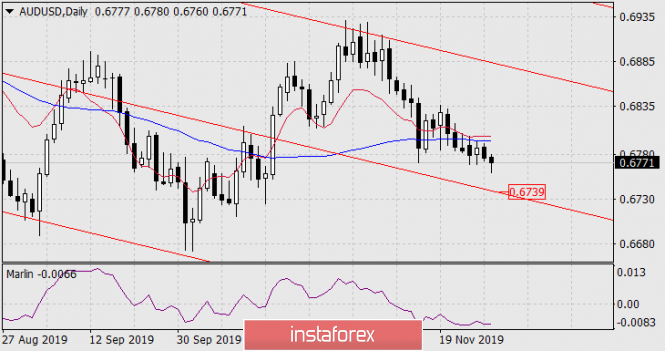
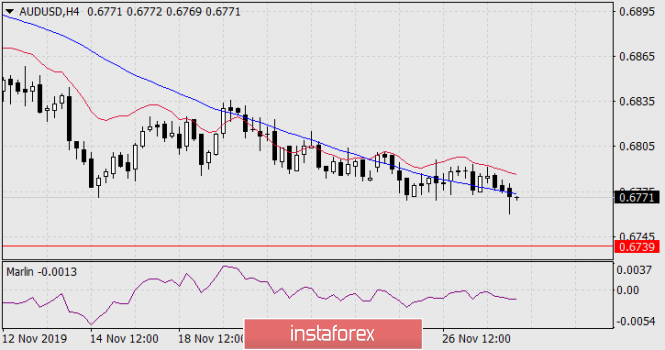
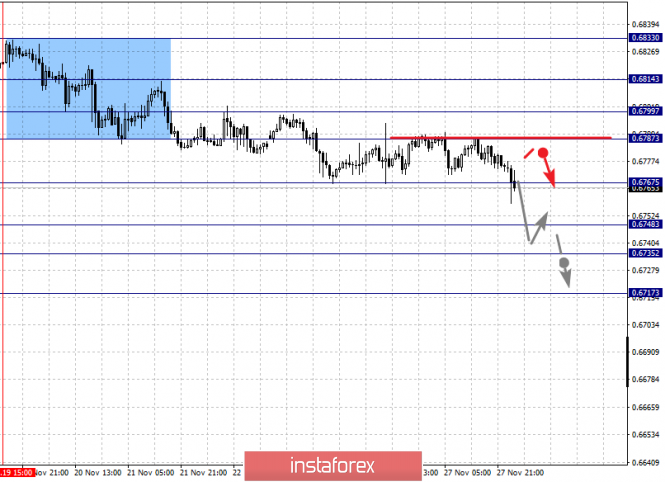
| Forecast for AUD/USD on November 28, 2019 Posted: 27 Nov 2019 06:44 PM PST AUD/USD The situation is developing in its own way for the Australian dollar - the price is falling to the target support of the price channel line, to the area of 0.6739. The signal line of the Marlin oscillator lies in the horizon, but this may not interfere with the price to work out this line, and only correct upwards from it. Investors believe that the RBA can lower the rate twice until the middle of next year, and it can also launch the traditional (in the terminology of current realities) QE, that is, the repurchase of assets on the balance sheet of the central bank. On a four-hour chart, the price is falling along the blue line of MACD and here, the Marlin is moving down from the boundary with the growth territory. |
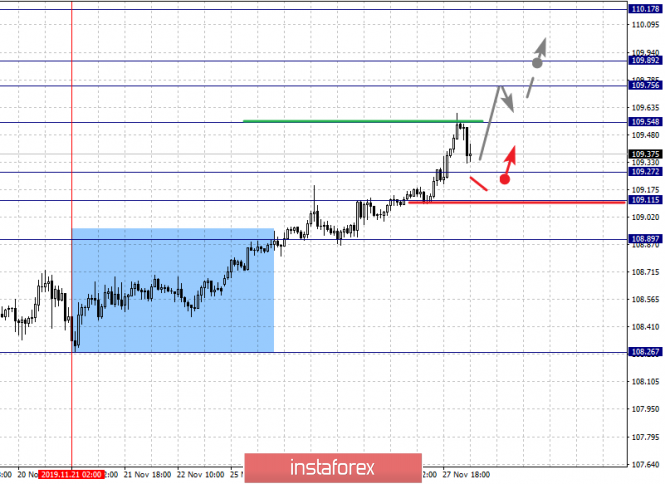
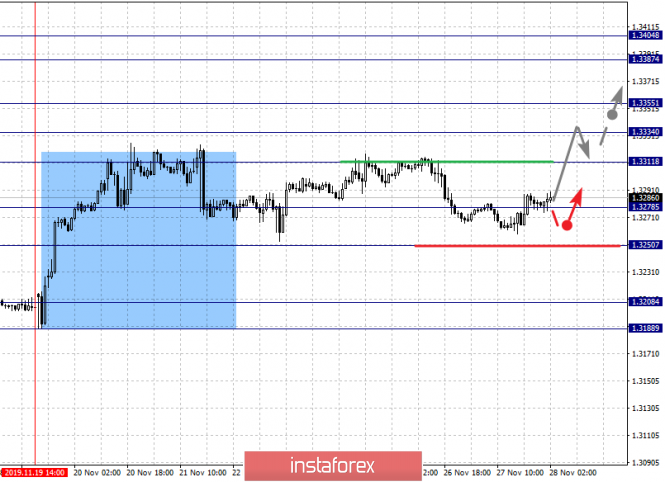
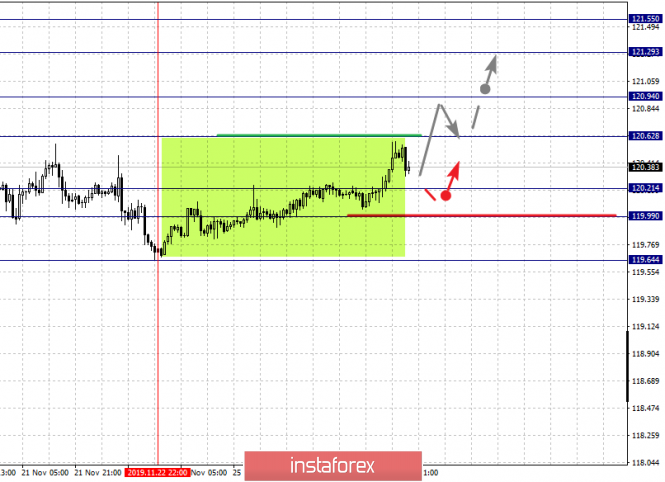
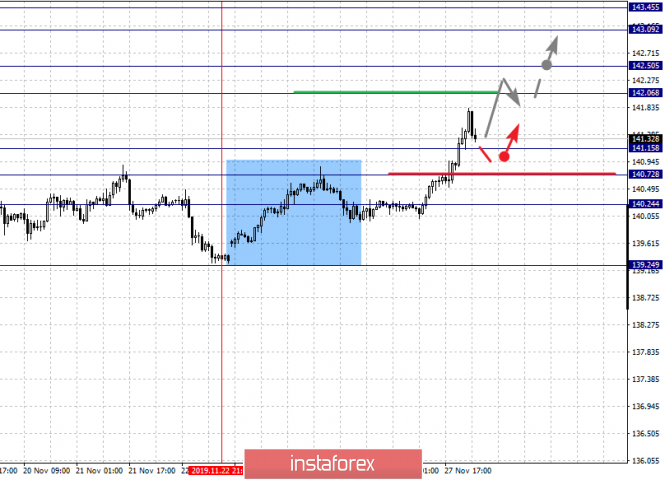
| Fractal analysis of the main currency pairs on November 28 Posted: 27 Nov 2019 05:32 PM PST Forecast for November 27: Analytical review of currency pairs on the scale of H1: For the euro / dollar pair, the key levels on the H1 scale are: 1.1045, 1.1024, 1.1010, 1.0983, 1.0953 and 1.0931. Here, we continue to monitor the development of the downward structure of November 21. The continuation of the movement to the bottom is expected after the breakdown of the level of 1.0983. In this case, the target is 1.0953. Price consolidation is near this level. For the potential value for the bottom, we consider the level of 1.0931. Upon reaching this value, we expect a rollback to the top. Short-term upward movement is expected in the range 1.1010 - 1.1024. The breakdown of the last value will lead to an in-depth correction. Here, the goal is 1.1045. This level is a key support for the downward structure. The main trend is the downward structure of November 21 Trading recommendations: Buy: 1.1010 Take profit: 1.1022 Buy: 1.1025 Take profit: 1.1045 Sell: 1.0983 Take profit: 1.0955 Sell: 1.0951 Take profit: 1.0931 For the pound / dollar pair, the key levels on the H1 scale are: 1.3075, 1.3043, 1.2994, 1.2957, 1.2903, 1.2873, 1.2842 and 1.2817. Here, we are following the formation of the initial conditions for the upward cycle of November 27. The continuation of the movement to the top is expected after the breakdown of the level of 1.2957. In this case, the target is 1.2994. Price consolidation is near this level. The breakdown of the level of 1.2995 should be accompanied by a pronounced upward movement. Here, the target is 1.3043. For the potential value for the top, we consider the level of 1.3075. Upon reaching this level, we expect consolidation, as well as a pullback to the bottom. Short-term downward movement is possibly in the range of 1.2903 - 1.2873. The breakdown of the latter value will lead to an in-depth correction. Here, the target is 1.2842. This level is a key support for the top. The main trend is the formation of the ascending structure of November 27 Trading recommendations: Buy: 1.2957 Take profit: 1.2992 Buy: 1.2996 Take profit: 1.3043 Sell: 1.2903 Take profit: 1.2875 Sell: 1.2870 Take profit: 1.2844 For the dollar / franc pair, the key levels on the H1 scale are: 1.0039, 1.0023, 1.0000, 0.9988, 0.9956, 0.9938 and 0.9919. Here, we are following the development of the ascending structure of November 18. Short-term upward movement is expected in the range 0.9988 - 1.0000. The breakdown of the last value will lead to a pronounced movement. Here, the target is 1.0023. We consider the level of 1.0039 to be a potential value for the top; upon reaching this level, we expect a pullback to the bottom. Short-term downward movement is possibly in the range of 0.9956 - 0.9938. The breakdown of the last value will lead to an in-depth correction. Here, the target is 0.9919. The main trend is the upward structure of November 18 Trading recommendations: Buy : 0.9988 Take profit: 1.0000 Buy : 1.0003 Take profit: 1.0023 Sell: 0.9956 Take profit: 0.9940 Sell: 0.9937 Take profit: 0.9920 For the dollar / yen pair, the key levels on the scale are : 110.17, 109.89, 109.75, 109.54, 109.27, 109.11 and 108.89. Here, we are following the development of the ascending structure of November 21. The continuation of the movement to the top is expected after the breakdown of the level of 109.54. In this case, the target is 109.75. Short-term upward movement, as well as consolidation is in the range of 109.75 - 109.89. We consider the level 110.17 to be the potential value for the top; we expect movement to this value after the breakdown of the level of 109.90. Short-term downward movement is expected in the range 109.27 - 109.11. The breakdown of the last value will lead to an in-depth correction. Here, the target is 108.89. This level is a key support for the top. The main trend: the development of the ascending structure of November 21 Trading recommendations: Buy: 109.55 Take profit: 109.75 Buy : 109.77 Take profit: 109.88 Sell: 109.25 Take profit: 109.13 Sell: 109.08 Take profit: 108.92 For the Canadian dollar / US dollar pair, the key levels on the H1 scale are: 1.3404, 1.3387, 1.3355, 1.3334, 1.3311, 1.3298, 1.3278 and 1.3250. Here, we are following the ascending structure of November 19. The continuation of the movement to the top is expected after the breakdown of the level of 1.3311. In this case, the first target 1.3334. We expect short-term upward movement in the range of 1.3334 - 1.3355. The breakdown of the last value should be accompanied by a pronounced upward movement. Here, the target is 1.3387. Price consolidation is in the range of 1.3387 - 1.3404 and from here, we expect a correction. Short-term downward movement, as well as consolidation are possible in the range of 1.3298 - 1.3278. The breakdown of the latter value will lead to an in-depth correction. Here, the target is 1.3250. This level is a key support for the upward structure. The main trend is the upward structure of November 19, the correction stage. Trading recommendations: Buy: 1.3311 Take profit: 1.3333 Buy : 1.3335 Take profit: 1.3355 Sell: 1.3276 Take profit: 1.3252 Sell: 1.3248 Take profit: 1.3220 For the Australian dollar / US dollar pair, the key levels on the H1 scale are : 0.6833, 0.6814, 0.6799, 0.6787, 0.6767, 0.6748, 0.6735 and 0.6717. Here, we are following the development of the downward structure of November 19. The continuation of the movement to the bottom is expected after the breakdown of the level of 0.6765. In this case, we expect a pronounced movement to the level of 0.6748. Price consolidation is in the range of 0.6748 - 0.6735. We consider the level of 0.6717 to be a potential value for the bottom; upon reaching this value, we expect a correction. Short-term upward movement is expected in the range of 0.6787 - 0.6799. The breakdown of the latter value will lead to an in-depth correction. Here, the target is 0.6814. This level is a key support for the downward trend. The main trend is a local descending structure of November 19 Trading recommendations: Buy: 0.6787 Take profit: 0.6797 Buy: 0.6800 Take profit: 0.6814 Sell : 0.6766 Take profit : 0.6750 Sell: 0.6746 Take profit: 0.6736 For the euro / yen pair, the key levels on the H1 scale are: 121.55, 121.29, 120.94, 120.62, 120.21, 119.99 and 119.64. Here, we determined the subsequent goals from the local ascending structure of November 22. The continuation of the movement to the top is expected after the breakdown of the level of 120.62. In this case, the target is 120.94. Price consolidation is near this level. The breakdown of the level of 120.95 should be accompanied by a pronounced upward movement. Here, the goal is 121.29. For the potential value for the top, we consider the level of 121.55. Upon reaching which, we expect consolidation, as well as a pullback to the bottom. Short-term downward movement is expected in the range of 120.21 - 119.99. The breakdown of the latter value will have the potential to form a downward movement. Here, the potential target is 119.64. The main trend is the local ascending structure of November 22 Trading recommendations: Buy: 120.62 Take profit: 120.92 Buy: 120.96 Take profit: 121.27 Sell: 120.21 Take profit: 120.00 Sell: 119.96 Take profit: 119.66 For the pound / yen pair, the key levels on the H1 scale are : 143.45, 143.09, 142.50. 142.06, 141.15, 140.72 and 140.24. Here, we are following the development of the upward cycle of November 22. Short-term upward movement is expected in the range of 142.06 - 142.50. The breakdown of the last value will lead to a pronounced movement. Here, the goal is 143.09. For the potential value for the top, we consider the level of 143.45. Upon reaching this level, we expect a departure in the correction. Short-term downward movement is possibly in the range of 141.15 - 140.72. The breakdown of the latter value will lead to an in-depth correction. Here, the goal is 140.24. This level is a key support for the top. The main trend is the upward structure of November 22. Trading recommendations: Buy: 142.06 Take profit: 142.50 Buy: 142.52 Take profit: 143.07 Sell: 141.15 Take profit: 140.74 Sell: 140.70 Take profit: 140.26 The material has been provided by InstaForex Company - www.instaforex.com |
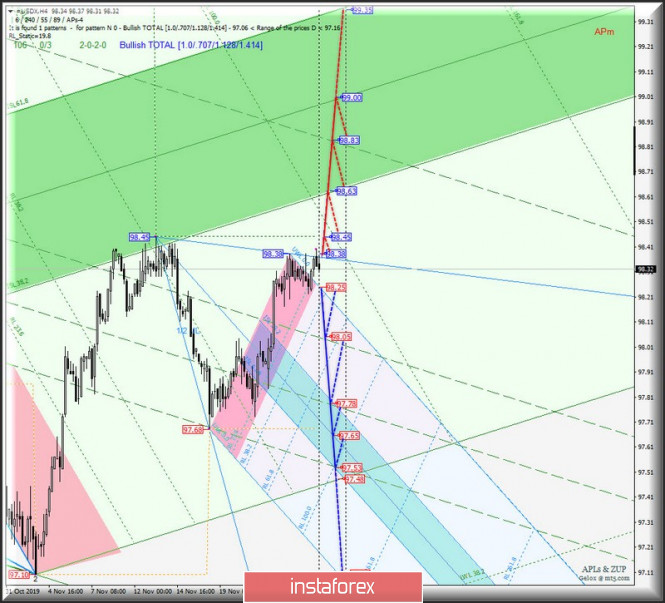
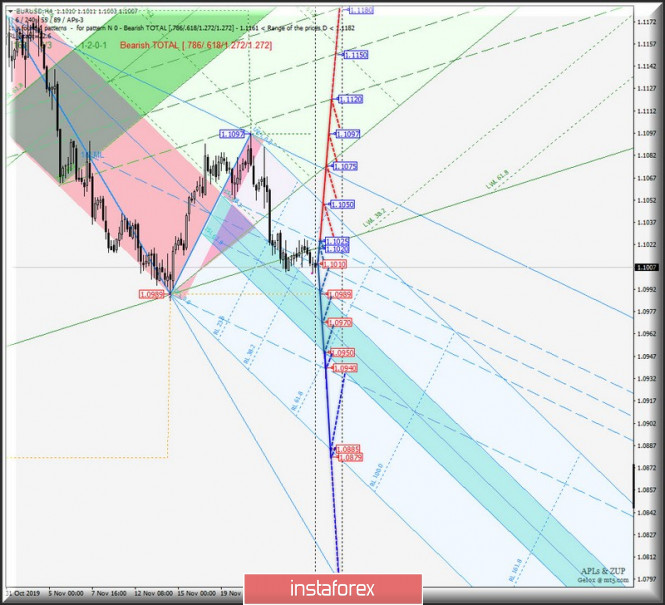
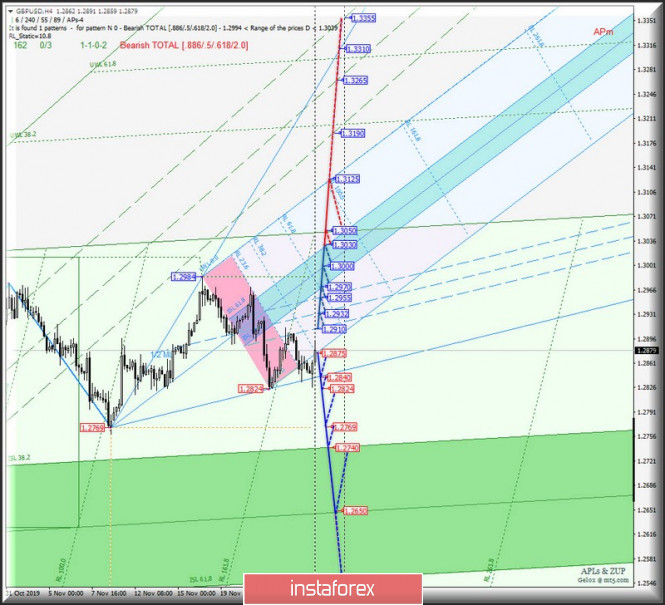
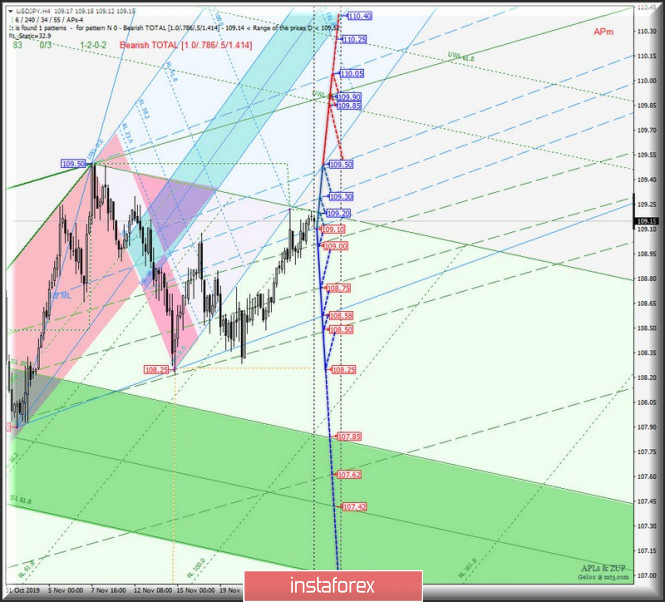
| Posted: 27 Nov 2019 04:57 PM PST What will happen to the "majors" on the eve of the first month of winter? Here's a comprehensive analysis of H4 movement options - #USDX, EUR/USD, GBP/USD and USD/JPY from November 28, 2019 of the Minuette operational scale forks. ____________________ Once again, the development of the movement of the dollar index #USDX from November 28, 2019 will be due to the development and direction of the breakdown of the range :
The breakdown of the resistance level of 98.38 on the control line UTL of the Minuette operational scale forks and the update of the local maximum 98.45 will determine the continuation of the development of the upward movement #USDX to the boundaries of the equilibrium zone (98.63 - 99.00 - 99.35) of the Minuette operational scale forks. On the contrary, the breakdown of the SSL Minuette start line (support level of 98.25) will direct the downward movement of the dollar index to the boundaries of the 1/2 Median Line (98.05 - 97.78 - 97.53) of the Minuette operational scale forks and equilibrium zones (97.78 - 97.65 - 97.53) of the Minuette operational scale. The details of the #USDX movement are presented on the animated chart. ____________________ Euro vs US dollar The development of the single European currency EUR / USD movement from November 28, 2019 will be due to the development and direction of the breakdown of the boundaries of the 1/2 Median Line channel (1.1025 - 1.1010 - 1.0989) of the Minuette operational scale forks. The details of the processing of the indicated levels are presented on the animated chart. The breakdown of the support level of 1.0989 on the lower boundary of the 1/2 Median Line Minuette channel will make it relevant to continue the movement of the single European currency in the equilibrium zones (1.0989 - 1.0970 - 1.0950) of the Minuette operational scale forks with the prospect of reaching the final Schiff Line Minuette (1.0940), the final line FSL Minuette (1.0885) and a local minimum of 1.0879 . Alternatively, the breakdown of the upper boundary of the 1/2 Median Line Minuette channel (1.1025) is a variant of the development of the upward movement of EUR / USD to the targets: the initial SSL line (1.1050) of the Minuette operational scale forks - local maximum 1.1075 - a Median Line channel (1.1120 - 1.1150 - 1.1180) of the Minuette operational scale forks. The details of the EUR / USD movement options are shown on the animated chart. ____________________ Great Britain pound vs US dollar Starting November 28, 2019, the development of Her Majesty's currency movement GBP / USD will be determined by the development and the direction of the breakdown of the range:
The breakdown of the support level of 1.2875 on the initial SSL line of the Minuette operational scale forks will make it possible to continue the downward movement of Her Majesty's currency to the goals: control line FSL Minuette (1.2840) - minimums (1.2824 - 1.2769) - equilibrium zones (1.2740 - 1.2650 - 1.2550) of the Minuette operational scale forks. However, in the event of a breakdown of the resistance level of 1.2910, the development of the GBP / USD movement will begin to occur within the boundaries of the 1/2 Median Line channel (1.2910 - 1.2932 - 1.2955) and the equilibrium zone (1.2970 - 1.3000 - 1.3030) of the Minuette operational scale forks with the prospect of reaching the SSL start line (1.3050) of the Minuette operational scale forks and final line FSL Minuette (1.3125). The details of the GBP / USD movement can be seen on the animated chart. ____________________ US dollar vs Japanese yen Starting November 28, 2019, the development of the USD / JPY currency movement of the "land of the rising sun" will depend on the development and direction of the breakdown of the boundaries of the 1/2 Median Line channel (109.10 - 109.30 - 109.50) of the Minuette operational scale forks. Look at the animation chart for the movement details. If the upper boundary of 1/2 Median Line channel of the Minuette operational scale forks (109.50) is broken, the upward movement of USD / JPY can continue to the resistance levels : - 109.85 - warning line UWL38.2 of the forks of the operational scale Minute; - 109.90 - control line UTL Minute; - 110.05 - the final Shiff Line Minuette. When the currency of the "country of the rising sun" returns below the lower boundary of the 1/2 Median Line Minuette channel (109.10), the downward movement of this currency instrument to the boundaries of the 1/2 Median Line channel (109.00 - 108.75 - 108.50) of the Minuette operational scale forks with the prospect of updating the local minimum 108.25. We look at the details of the USD / JPY movement on the animated chart. ____________________ The review is made without taking into account the news background. Thus, the opening of trading sessions of the main financial centers does not serve as a guide to action (placing orders "sell" or "buy"). The formula for calculating the dollar index : USDX = 50.14348112 * USDEUR0.576 * USDJPY0.136 * USDGBP0.119 * USDCAD0.091 * USDSEK0.042 * USDCHF0.036. where the power coefficients correspond to the weights of the currencies in the basket: Euro - 57.6% ; Yen - 13.6% ; Pound Sterling - 11.9% ; Canadian dollar - 9.1%; Swedish Krona - 4.2%; Swiss franc - 3.6%. The first coefficient in the formula leads the index to 100 at the start date of the countdown - March 1973, when the main currencies began to be freely quoted relative to each other. The material has been provided by InstaForex Company - www.instaforex.com |
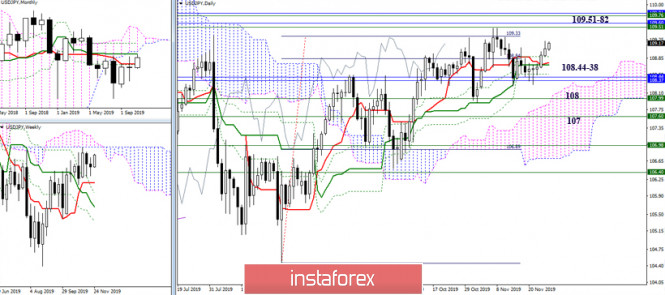
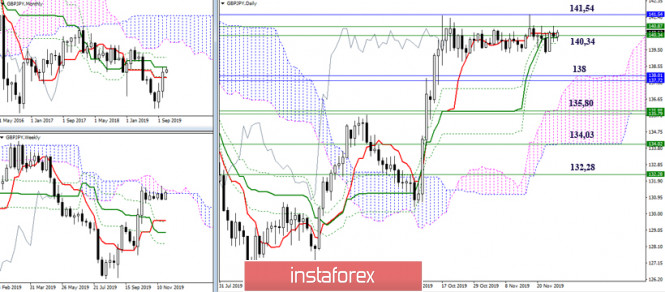
| USD/JPY and its crosses - current situation Posted: 27 Nov 2019 04:12 PM PST USD / JPY
Earlier, the yen has developed a 100% target for the breakdown of the daily cloud, which was strengthened by the accumulation of very strong and significant levels from different time intervals 109.51 - 109.82 (weekly cloud + monthly medium-term trend + lower border of the monthly cloud). Breaking through the encountered zone of resistance can open up great upward prospects, and thus, players on the upside should not abandon their hopes and desires. The closing of November is approaching, if the bulls manage to maintain and fix their optimism on the monthly candle in November, then attempts to fight for these resistance in December will most likely continue. Now, 108.70-75 (daily cross) and 108.44-38 (monthly Tenkan + Fibo Kijun) should be noted as the supports. Consolidation below will indicate the formation of rebound from the resistance encountered, led by a monthly medium-term trend (109.59), which may lead to a longer change in moods and priorities of the movement. In this case, a downward cloud and a downward correction to the weekly gold cross support (Tenkan 108.00 + Kijun 106.98) will appear in the players' field of interest. EUR/JPY
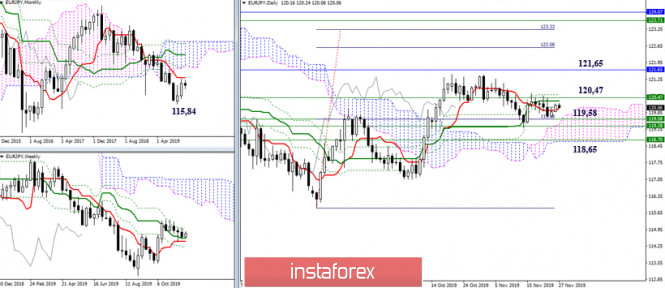
The development of the situation with the priority of bullish moods was postponed by the meeting with the zone of influence of the monthly short-term trend (121.65). As a result, all of November, relying on the support of the daily and weekly Ichimoku crosses, the pair is trying to maintain the status quo and hold on to the prevalence of bullish sentiments and priorities. In this case, 121.65 (monthly Tenkan), 122.58 - 123.33 (target for the breakdown of the daily cloud) and 123.71 - 124.10 (lower boundaries of the monthly and weekly clouds) remain the upward reference points. The supports now form a wide area, including the daily cloud and the weekly dead cross Ishimoku (119.58 - 118.65). Consolidation below will serve as a good start for the formation of rebound from the monthly short-term trend (121.65), and the successful implementation of rebound, through the exit from the correction zone (115.84), will help to restore the monthly downward trend. GBP/JPY
The October activity of the players on the upside supported the pair to break through many significant levels and reach the most important resistance of this area 140.34 - 141.54 (weekly cloud + monthly medium-term trend). The strength and significance of the resistance holds back the development of the current situation throughout November. Thus, the breakdown of the zone and reliable consolidating above promises players to increase good prospects. In this case, the closest reference points will be an increase to the final boundary of the monthly dead cross Ichimoku (145.10) and the formation of an ascending target for the breakdown of the weekly cloud. However, the failure of the bulls and the weakening of their positions can return to the market bearish sentiment very quickly. At first, the players on the downside will seek to take advantage of the monthly short-term thread (138.00), and then they may even be confused by the change in the current situation, for which they implement a downward correction to the support of the weekly cross, now it is 135,80 – 134,03 – 132,28, which will allow them to form a full retreat from the resistances encountered, with good future prospects. Ichimoku Kinko Hyo (9.26.52), Pivot Points (classic), Moving Average (120) The material has been provided by InstaForex Company - www.instaforex.com |
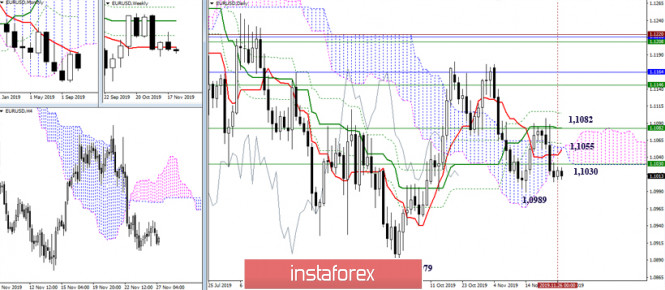
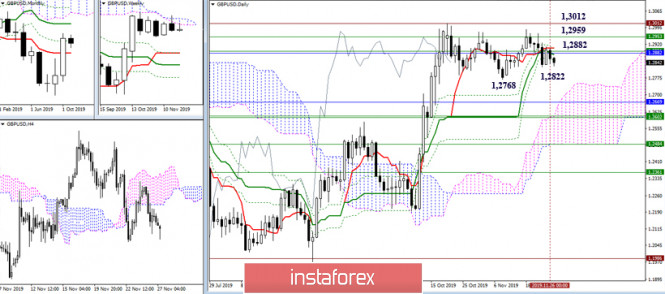
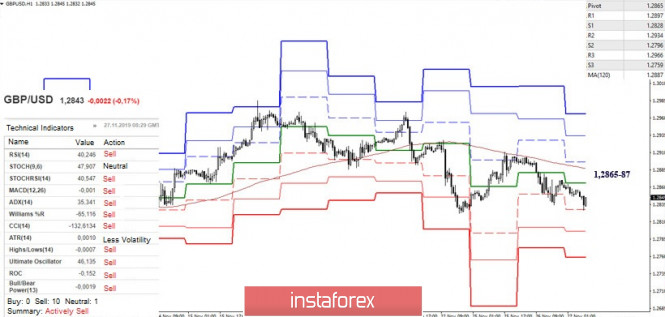
| Technical analysis recommendations for EUR/USD and GBP/USD on November 27 Posted: 27 Nov 2019 03:50 PM PST Economic calendar (Universal time) The economic calendar for the current day is quite filled with statistics of varying degrees of importance. Among the most significant are data from the USA. Today, you need to pay attention to the publication of the following indicators: 13:30 basic orders for durable goods; 13:30 GDP; 15:00 index of incomplete sales in the real estate market; 15:30 crude oil reserves. EUR / USD Over the past day, the movement had a narrow range as inhibition and reflection persist. The growth prospects of the players, in turn, still depend on the passage of the resistance zone 1.1030 (weekly short-term trend) - 1.1055 (daily cloud) - 1.1082 (daily Kijun + weekly Fibo Kijun). At the same time, the direction is open for players to decline, and new prospects will appear after passing the supports, which are formed by the minimum extreme of 1.0989 and 1.0879. At the moment, the players on the downside take advantage as they are supported by all the analyzed technical indicators. The classic pivot levels S1 (1.1010) - S2 (1.0999) - S3 (1.0991) can be intraday support. Moreover, consolidation above the central Pivot level (1.1018) will form the prerequisites for the development of an upward correction again, the key reference point of which will be the weekly long-term trend which is currently located at 1.1041. Breaking through this and its reversal will change the current balance of forces and require a new assessment of the situation. GBP / USD The pair cannot leave the zone of attraction and remains tied to the accumulation of levels in the region of 1.2882. Here (area of 1.2882), quite several strong levels have joined forces now - the daily cross, the lower border of the weekly cloud, the monthly Fibo Kijun. At the same time, consolidation above can not only delay the development of the situation and maintain uncertainty, but, given the current situation, serve as a good basis and the beginning for a new strengthening of bullish sentiments and positions. The following resistances are located at 1.2959 (weekly cloud) - 1.3012 (maximum extremum). Updating the lows of last week (1.2822) and the area of prevailing uncertainty (1.2768) is now the main task of players to decline. It can be analyzed that technical indicators currently support players for a decline. Thus, we are seeing continued decline. The pair is close to updating last week's low (1.2822), strengthened today by S1 (1.2828). Now, updating 1.2822 and consolidating below is the main task for today for players to decline. The following support for classic Pivot levels are located today at 1.2796 (S2) - 1.2759 (S3). The development of correction and the subjugation of the key resistance of the lower halves of 1.2865-87 will significantly change the current balance of forces, since the key resistance of the lower halves now coincides with the most important area of attraction and resistance of the higher time intervals (1.2882). Ichimoku Kinko Hyo (9.26.52), Pivot Points (classic), Moving Average (120) The material has been provided by InstaForex Company - www.instaforex.com |
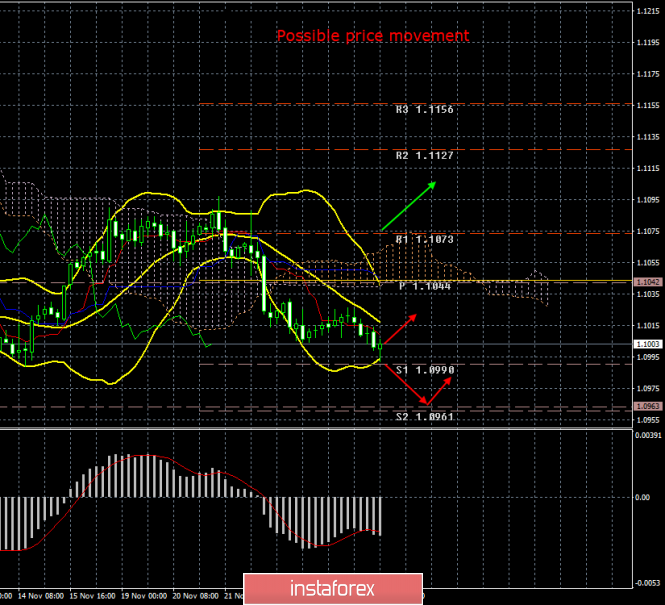
| Posted: 27 Nov 2019 03:00 PM PST 4-hour timeframe Amplitude of the last 5 days (high-low): 28p - 45p - 74p - 28p - 19p. Average volatility over the past 5 days: 39p (low). On the third trading day of the week, the EUR/USD currency pair resumed its downward movement after a low upward correction and continues to discourage its lethargy and apathy. If there was not any important macroeconomic information that was available to traders in the first two trading days of the week, which partially explained the low volatility of the pair, today there were important macroeconomic statistics, but all that the market participants were able to do was move down by "as much as 25 points" . How can one again not recall the paradoxical situation in which, from our point of view, the euro/dollar currency pair has recently been? We continue to believe that there are not enough statistical indicators for further strong and long-term sales of the European currency. The pair continues to be around 2-year lows. Thus, there are no reasons for buying the euro currency: data from overseas began to delight traders with their strength again, data from the European Union continue to disappoint; The Federal Reserve took a break in easing monetary policy. On the contrary, the ECB is preparing for various changes due to a change in the head of the regulator and, most likely, will lower its key rate again. Thus, we believe that it is precisely the new lowering of the ECB key rate that can help the bears perk up and start again large pairs in terms of volume of sales, which will lead to updating lows. All macroeconomic data have been published today in the United States. The most important and significant report - orders for durable goods - showed a positive trend. The main indicator added 0.6% MOM in October, while forecasts predicted another decline in volumes by 0.8%. Orders excluding defense increased by 0.1% with forecasts of -0.3%. Orders for goods excluding transport increased by 0.6% with expert forecasts +0.1%. Orders excluding defense and aviation showed an increase of as much as 1.2% against the expectations of the Forex market -0.3%. In addition, annual data on GDP for the third quarter were released, which also turned out to be better than expectations of market participants and amounted to +2.1%. This, of course, is not the final value, but the increase in this indicator in itself is great news for investors in the US dollar. Also, the number of applications for unemployment benefits turned out to be lower than experts expected, and only data on personal incomes of the US population turned out to be slightly disappointing, showing a zero increase in October. Personal expenses of Americans increased by 0.3%, according to the forecast value. Thus, in general, we can say that the package of macroeconomic information from across the ocean turned out to be positive and was completely ignored by traders, since we could have expected a 20-point move down without such a large amount of important data. In this situation, it remains only to ask when this pair's movement will end, with low volatility, which is very difficult to work out, and what will trigger the pair to return to the usual mode? We believe that this should be some extremely important event for traders of the euro/dollar currency pair. For example, lowering the ECB key rate. We currently don't see a reason as to why the pair will rise again. We also don't see why the European currency can begin to show growth against the US dollar if all macroeconomic statistics are in favor of the United States, and a trade war between China and the US, which could hypothetically cause a deterioration in US macroeconomic indicators, has no less negative impact on European ones. Thus, the euro's hope continues to be associated only with a serious deterioration in statistics in the United States or the resumption of the monetary policy easing in America on an equal footing, since the current state of the US economy clearly does not require such a regulatory step. From a technical point of view, the euro/dollar pair has almost worked out the support level of 1.0990 and can rebound from it by making a call to a new round of upward correction. However, given the current value of volatility, it does not even matter much in which direction the pair is moving. To work out the movement during the day of 20 points is an extremely difficult and inconvenient task. Trading recommendations: The EUR/USD pair may begin a new round of correction against the downward trend, and the volatility in trading remains extremely low on Wednesday. Thus, it is now recommended to wait until the correction begins and ends and sell the euro/dollar pair again with targets at 1.0990 and 1.0963, or stay in shorts with the same goals, hoping that there will be no correction. It is recommended to consider buying the euro not earlier than the reverse consolidation of traders above the critical Kijun-sen line and the level of 1.1073 with the first goal being the resistance level of 1.1127. Explanation of the illustration: Ichimoku indicator: Tenkan-sen is the red line. Kijun-sen is the blue line. Senkou Span A - light brown dotted line. Senkou Span B - light purple dashed line. Chikou Span - green line. Bollinger Bands Indicator: 3 yellow lines. MACD indicator: Red line and bar graph with white bars in the indicator window. Support / Resistance Classic Levels: Red and gray dotted lines with price symbols. Pivot Level: Yellow solid line. Volatility Support / Resistance Levels: Gray dotted lines without price designations. Possible price movements: Red and green arrows. The material has been provided by InstaForex Company - www.instaforex.com |
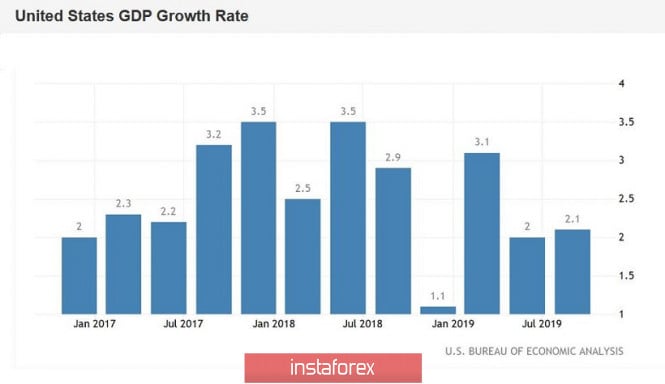
| EURUSD: the growth of the US economy and a drawback for dollar bulls Posted: 27 Nov 2019 03:00 PM PST The US dollar completes a three-day trading marathon before Thanksgiving on a major note: US GDP growth data were better than expected. This fact was a strong argument in favor of maintaining a wait-and-see attitude from the Fed. However, there was a drawback today - inflation indicators disappointed traders, thereby offsetting the positive effect of the central release of the environment. However, first things first. According to experts, the US economy should have slowed down to 1.8% in the third quarter. (with growth up to 3.1% in the first quarter and up to 2% in the second). In reality, the volume of GDP increased by 2.1%, and the component of personal consumption showed the highest growth from the second quarter of the year before last. The price index of GDP remained at the initial level of 1.7% (against the two percent forecast), while in the second quarter this indicator grew by 2.4%. Third quarter GDP was revised to show growth of 2.1% after more modest growth in the previous period. In general, the figures published today suggest that the US economy is experiencing the negative impact of the global trade conflict, but nevertheless is in fairly good shape. The current situation fully fits into the outline of the intentions of the US regulator: judging by the latest statements of their representatives, the Federal Reserve is ready to maintain a wait-and-see attitude unless the trade war breaks out with renewed vigor (or if inflation does not slow down to critical levels). In addition, the dollar was also supported by the data published today on the volume of orders for durable goods. This indicator (including transport equipment) left the negative area and reached 0.6%. The result is relatively modest, but the best since July. Without taking into account transport equipment, this indicator also reached the level of many-month highs, demonstrating positive dynamics. Strengthening investment intentions is an encouraging signal for both traders and Federal Reserve members - especially in terms of interest rate prospects next year. The mere fact of the growth of this indicator is not capable of giving decisiveness to the members of the regulator, however, if such dynamics will affect the country's GDP growth in the fourth quarter, then the likelihood of the Fed's expectation of a wait-and-see position throughout 2020 will increase. As I said above, there was a drawback. To the disappointment of dollar bulls, inflation indicators continue to exit in the red zone. Thus, the index of personal consumption expenditures, which measures the core level of expenses and indirectly affects the dynamics of inflation in the United States, came out worse than forecasts - in monthly terms, it fell to 0.1%, continuing the negative trend. On an annualized basis, the indicator also decreased (to 1.6%), although experts expected it to remain at the previous level (1.7%). The level of population spending showed a slight increase (0.3%), although a consensus forecast indicated an increase to 0.5%. In general, these data are consistent and consistent with the uncertain growth in the consumer price index, which was published earlier. It is believed that these inflation indicators are being monitored by members of the US regulator with particular care, so the optimism of dollar bulls seems to be premature. Let me remind you that the nonfarm inflation component also disappointed last month - on a monthly basis, salaries grew by only 0.2%, in annual terms - to 3.0%. A rather weak increase in the average hourly wage level again failed the dollar bulls, especially in light of the rest of the inflation releases. Here it is worth noting that Fed Chief Jerome Powell has recently unambiguously hinted that the further steps of the US regulator will largely depend on the dynamics of inflation growth. This is not only about reducing, but also raising the rate. Speaking in Congress, Powell emphasized that the regulator will not even think about tightening monetary policy until key inflation indicators return to sustainable growth. Although the strong US labor market has traditionally supported the dollar, inflation continues to be the weak link in the US economy for many years. The indicators published today served as an additional confirmation of this fact. Thus, despite the fact that the dollar today received support from key data on the growth of the American economy, the bulls of the EUR/USD pair are still fighting for the 10th figure. Weak inflation indicators did not allow the bears to develop a blitzkrieg, especially on the eve of tomorrow, when US trading floors will be closed. By and large, the pair remained at the same positions at the end of the day: traders were unable to pull the price below 1.0970 (the lower line of the Bollinger Bands indicator on the daily chart) to confirm the strength of the downward movement. Now EUR/USD traders are waiting for the next tests: data on the growth of German inflation will be published tomorrow, and pan-European consumer price index the day after tomorrow. In conditions of low liquidity, the pair may demonstrate impulsive movements, especially if the published figures do not coincide with the expectations of market participants. The material has been provided by InstaForex Company - www.instaforex.com |
| Buying the Canadian currency looks attractive - Wells Fargo Posted: 27 Nov 2019 03:00 PM PST A stable Canadian economy and recent comments by Bank of Canada management speak in favor of acquiring the loonie, Wells Fargo strategists say. They predict that the USD/CAD pair will drop to the level of 1.3200 by the end of this year, and it will fall to the level of 1.2800 by the end of the first quarter of 2020. BoC Chairman Stephen Poloz's comments last week turned out to be more hawkish. The head of the Canadian central bank said that monetary policy is in the right place. Therefore, Wells Fargo canceled its forecast for interest rate cuts by the BoC by 25 basis points. At the same time, investors still expect the BoC to lower its interest rate in December, and the Federal Reserve in January. The market lays such expectations in quotes. If the Canadian central bank leaves the interest rate at the current level, then expectations will change in favor of the Canadian dollar. "Economic imbalances in the Canadian economy are weakening. This is especially noticeable in the real estate market. Ratification of the new trade agreement between the US, Canada and Mexico should also help strengthen the Canadian currency," Wells Fargo believes. The material has been provided by InstaForex Company - www.instaforex.com |
| UK elections are just around the corner, or is the pound playing election solitaire Posted: 27 Nov 2019 03:00 PM PST The United Kingdom has been trying to leave the European Union for nearly three years now. The "divorce" process has dragged on, and Great Britain does not succeed in taking this step. Two weeks later, elections will be held in the country, the outcome of which will determine not only the composition of the next Parliament, but also the fate of Brexit. The range of possible scenarios is still wide - from Britain leaving the EU without a deal to holding a second referendum and maintaining the country's membership in the bloc. How can the situation develop? 1. Most Conservatives Opinion polls confirm that the Tories will receive more than 325 seats in Parliament. Under this scenario, Conservatives will win in areas where Labour positions have traditionally been strong, and Tory supporters in the south will decide that their opponents' leader, Jeremy Corbyn, does not like them more than Brexit. In this case, Boris Johnson will try to pass his version of the deal with the EU through Parliament until December 31. Given that all candidates for MPs from the Conservative Party have promised to support this agreement, the prime minister can quickly get the deal approved in the House of Commons, with the support of the majority. Thus, the United Kingdom will leave the EU by January 31, 2020. Will the Brexit process end there? Of course not. Johnson will have 11 months to conclude a trade agreement with the EU. MPs will carefully study this deal, and the assurances of loyalty made by the Tory candidates do not apply to it. If the prime minister does not have a majority with a margin of more than 40 votes, there is a risk that the Conservatives, who are in favor of a more decisive break with the EU, will try to force Johnson to support the more "hard" Brexit scenario. 2. The situation will change little Conservatives will be the largest party in Parliament, but they will not have a small number of votes to the majority. This can happen if the Tories fail to intercept votes in the Labour regions of support. Voters in these areas will decide they do not trust Johnson. Seats in the regions that vote for leaving the EU, which Conservatives can win, will be offset by losses in areas that prefer to remain in the bloc. In this case, uncertainty regarding Brexit will remain. Most likely, Johnson will refuse to resign, and the opposition parties will not be able to agree on what should happen next. A series of votes will be held in the House of Commons during the New Year season: a new postponement of Brexit, approval of a deal by Johnson, a second referendum, or even a new election. 3. Labour in government, but who is the leader? The Tories will receive less than 300 seats in Parliament, the Laborites will also lose ground, but will enter the government thanks to the support of smaller parties. Conservatives will receive votes in areas that have already been controlled, but will not gain enough seats in regions that should have been intercepted from other parties. The Tories will take seats from Labour in the center of the country, albeit to a lesser extent than expected, and lose to the Scottish National Party in Scotland. By receiving a series of votes that voters will give to the Liberal Democrats, this party will somewhat squeeze the Tories in the south. In this scenario, we should expect a new delay in Brexit, as Johnson's position is clearly shaken. However, who will replace him? It is assumed that the liberal democrats will refuse to bring Corbyn to power and will urge the Laborites to choose an alternative prime minister. That is, by Christmas, a struggle will unfold between the supporters of Corbyn and his opponents. When a new government is formed in January, the focus will shift to the request for another Brexit postponement from Brussels - this time for a second referendum. 4. Prime Minister Jeremy Corbyn Labour will be able to convince voters that the Tories are not trustworthy and are only interested in Brexit. At the same time, the promise of the Laborites to increase spending on public services will not only help maintain the existing share of the vote, but also win new supporters. As a result, the number of seats in Parliament at the Conservative Party will be reduced to 280, and the Labour Party will improve their positions to a similar level. They will enlist the support of the SNP by proposing a new referendum on independence. As a result, Corbyn will become the new prime minister. He will head to Brussels to secure a deal that will allow the United Kingdom to stay closer to a single market with the EU. It is possible that negotiators from the EU will propose an appropriate option, which Corbyn will submit for a second referendum along with the opportunity to remain in the EU. What to expect from the pound? In anticipation of the election, a decrease in the level of support for Conservatives in opinion polls will be a short-term bearish factor for the pound, while a wider separation of Tories from the Labour Party will lead to an increase in the British currency. If, following the election results, Conservatives get a majority in Parliament and lawmakers approve the Brexit plan proposed by Prime Minister Johnson, then this will probably be followed by a strengthening pound. If the Tories are defeated in the election, Johnson's position in Parliament will be weakened, the adoption of his version of the divorce agreement with the EU will also be in jeopardy, which will further increase uncertainty about Brexit and the prospects for the pound. "Pound investors should be better prepared for the risks associated with the December elections in the UK," warn BMO Capital Markets strategists. According to them, market participants are underestimating the likelihood of a "suspended" Parliament appearing after the election and the failure of negotiations on trade relations between the United Kingdom and the EU. "Even if Conservatives get a majority and Parliament approves a withdrawal agreement promoted by Prime Minister Johnson, the UK can still leave the EU without a deal," the experts said. The material has been provided by InstaForex Company - www.instaforex.com |
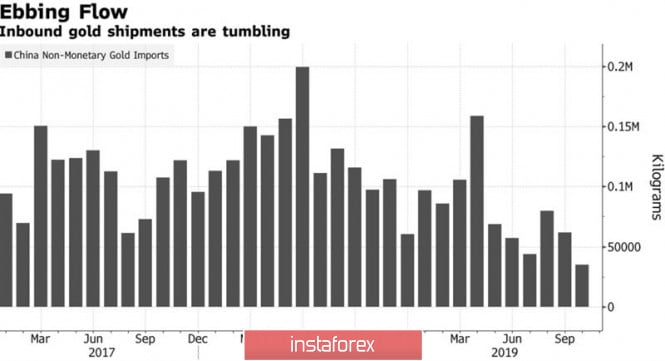
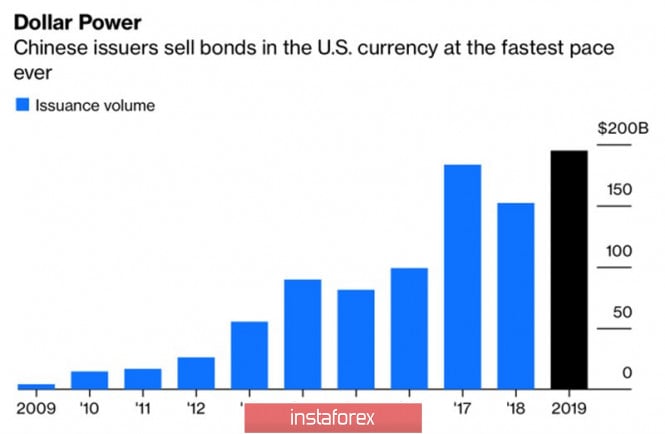
| Posted: 27 Nov 2019 03:00 PM PST Information that showed up on the market about the imminent end of the US-China trade war keeps the XAU/USD bulls in a depressed state. Low interest rates of central banks and world debt markets, along with the end of the conflict between Washington and Beijing, can push stock indices up. Improving global risk appetite is not good news for gold, so Donald Trump's statement that the parties are in the final stages of suffering before the birth of an important agreement has cooled the hot heads of precious metal buyers who want to launch a counterattack. Despite a warning from Reuters that the deal in 2019 will most likely not be concluded, the United States and China are moving towards one. China is easy to understand: its economy has been slowing for seven consecutive months and has shown the worst growth rates over the past three decades. It would seem that fears for its fate and the acceleration of consumer prices should have stimulated the local population's demand for gold. In fact, this does not happen: China's imports of precious metals have fallen to its lowest level since January 2017, and Metals Focus predicts that Chinese interest in jewelry will decrease this year by 4%, investment demand - by 20%. Dynamics of Chinese gold imports The fact that Beijing is burning with a desire to conclude a deal is evidenced by one of the largest ever issuance of government bonds denominated in US dollars. We are talking about $6 billion. At the same time, demand reached $20 billion. In fact, China does not need the US currency, as it holds US Treasury bonds worth $1.1 trillion. But accumulating dollars for the purpose of selling them in order to put a barrier on the path of the bulls in USD/CNY is a good idea. Let me remind you that the currency pact to prevent the devaluation of the renminbi can be part of the deal between the US and China. Dynamics of issue of dollar bonds by Chinese issuers Gold feels at ease despite being deprived of support from Asian demand and as it is under pressure from a high global risk appetite and a strong greenback. The Federal Reserve also creates pressure on precious metals, which intends to keep the federal funds rate at 1.75% for a long time. Judging by the speech of the FOMC Governor Lael Brainard, three acts of monetary expansion in 2019 put monetary policy in the place where it should be. Furthermore, it is necessary to observe the incoming data. In this regard, the reduction of the negative balance of trade in goods in October and the positive from consumer confidence from the University of Michigan in November support the dollar and keep the bulls at XAU/USD in the pen. Technically, updating the November low will increase the risks of pulling down gold quotes to $1435-1440 per ounce, where important levels of Pivot are located. On the contrary, a break of resistance at $1475 will allow us to talk about the formation of the Double Bottom reversal pattern, which will be good news for the bulls. The material has been provided by InstaForex Company - www.instaforex.com |
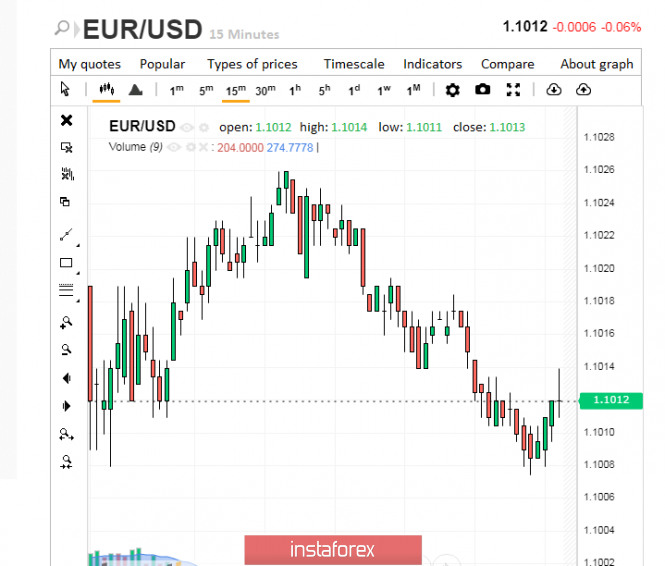
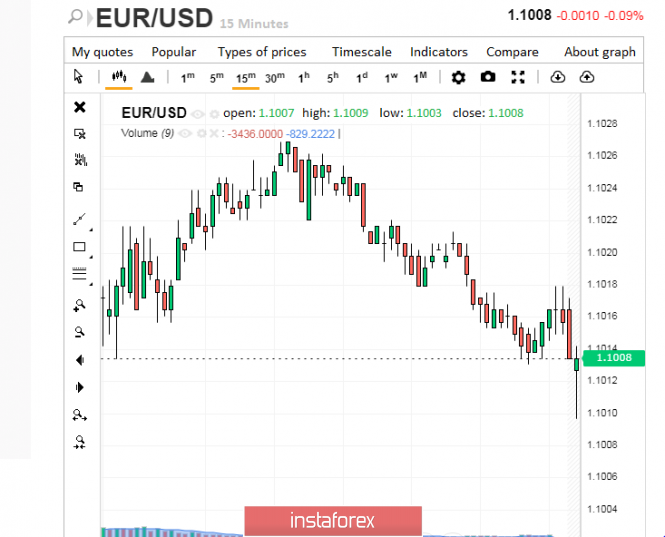
| Posted: 27 Nov 2019 02:59 PM PST The European currency balances between the strengthening of the US dollar and the economic problems that occasionally shake the eurozone. The current difficulties are being tested by the euro, as it periodically slumps, also seeks to maintain its position, although sometimes it requires tremendous effort. The current instability of the European economy negatively affects the dynamics of the euro. At the moment, the EUR/USD pair is in stagnation, and analysts are at a loss with further forecasts. Experts believe that the inaction of the Federal Reserve and the ECB contributes to the low volatility of the pair, driving the pair into narrow trading ranges. In this state, the EUR/USD pair may be stuck for a long time, experts said. Zero rates can provide a bearish service to the European currency if the ECB agrees to introduce them in the near future. This will play into the hands of the Fed, which decided to keep low but stable rates in the long run. If the European regulator introduces negative rates in the near future, this will cause a serious blow to the euro. Such a discrepancy in the monetary policy of leading central banks will greatly weaken the euro and strengthen the position of the greenback. According to analysts, a downward trend is currently prevailing in the EUR/USD pair. The euro began to fall on Tuesday, November 26, but did not go to the bottom. Yesterday, the EUR/USD pair fell to the level of 1,1012, and today this trend continued. The pair was trading in an extremely low range of 1,1007–1,008 on Wednesday morning, November 27. Experts fear that the EUR/USD pair will reach the bottom, and it will be difficult to stop this collapse. Commerzbank's currency strategists believe that the very low volatility of the euro against the dollar will continue until there is a breakthrough in US and Chinese trade negotiations. However, there is some lull in this field. Earlier in his speech, Fed Chief Jerome Powell reiterated market expectations for a long pause in the cycle of rate cuts. Note that this factor is bullish for the American currency. The duration of this stop will depend on the results of trade negotiations between Washington and Beijing, analysts recall. The European currency has embarked on a slippery path of economic turmoil, and it is becoming increasingly difficult to follow it. On the one hand, the euro is under pressure from the slowdown in the eurozone economy, and on the other - the strengthening of the dollar. However, experts are confident that the euro will gather strength and overcome the attraction of current stagnation in the EUR/USD pair. The material has been provided by InstaForex Company - www.instaforex.com |
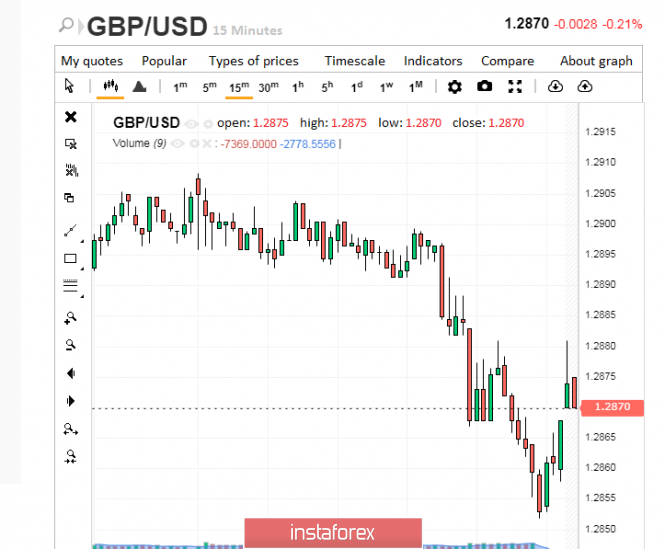
| Pound is not so simple: the current recession will be followed by growth Posted: 27 Nov 2019 02:59 PM PST The British currency's confident rise marked at the beginning of the week was interrupted by not too positive political news. The pound, nervously reacting to opinion polls in the UK, lost ground. However, experts are counting on its restoration in the near future. According to current polls, the chances of the Conservative party winning the upcoming elections could turn out to be low. The survey results were as follows: Conservatives gained 43% of the vote, and Labour - 32%. The current situation undermines the leading position of the national currency. The pound was weak on Tuesday, November 26. It began to plummet, barely reaching 1.2900. The British currency was trading in the range of 1.2870-1.2871 yesterday. Subsequently, the GBP/USD pair fell even lower, reaching 1.2853–1.2854. Experts have recorded a downward trend in the pair. Many analysts are confident that even after the general election in the UK, scheduled for December 12, the pound will remain in the range from 1.2800 to 1.3000. A similar scenario is possible if the so-called "suspended" (that is, temporary) Parliament is elected until clarity appears on the country's political horizon. At the same time, a number of economists believe that even if the Conservative Party and Prime Minister Boris Johnson win the election, the problems associated with Brexit will not be solved by themselves. Great Britain has to go through a winding path to conclude new trade agreements both with the European Union, the United States and other countries in order to bring trade to normal. Such shocks negatively affect the British currency. At the moment, the pound is stuck in the low price range. The GBP/USD pair is trading near 1.2846–1.2847 on Wednesday, November 27. Experts believe that before the general election, the pair is unlikely to go beyond the current price range, limited to 1.2800-1.2900. The British currency is currently experiencing serious volatility. Political fluctuations are not in vain for the pound, analysts emphasize. However, they are confident that in the medium term, sterling will perk up and conquer price peaks again, rushing to the cherished goal of 1.3000. The material has been provided by InstaForex Company - www.instaforex.com |
| Ichimoku cloud indicator analysis of EURUSD for November 27, 2019 Posted: 27 Nov 2019 09:59 AM PST EURUSD is in bearish short-term according to the Ichimoku cloud indicator as price is below the Kumo (cloud) and below both the tenkan- and kijun-sen indicators.
EURUSD is below the Kumo challenging again the important 61.8% Fibonacci retracement level. Breaking below 1.10-1.0990 area we should expect more downside towards 1.0950 at least. Resistance is found at 1.1030. A bounce towards that level should soon be expected. A rejection will confirm that we are heading towards 1.09. If bulls manage to recapture 1.1030 we could next see a bounce towards the next important resistance at 1.1075. The material has been provided by InstaForex Company - www.instaforex.com |
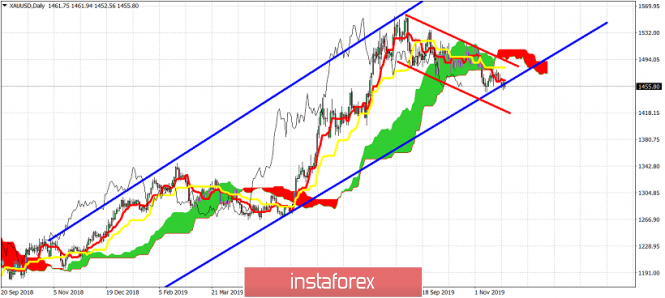
| Ichimoku cloud indicator analysis of Gold for November 27, 2019 Posted: 27 Nov 2019 09:56 AM PST Gold price is challenging important medium-term channel support while at the same time trading inside a short-term bearish channel. Critical support is where price is currently around $1,455-60.
Blue lines - intermediate term bullish channel Red lines - bearish channel Gold price is trading right at the lower bullish channel boundary. Price is below the Daily Kumo (cloud) and is making lower lows and lower highs. Price is below both the tenkan- and kijun-sen indicators confirming short-term bearish trend. Support is at $1,450-60 area and if it fails to hold we should expect a move towards $1,400 or lower. Resistance is key at $1,475 and next at $1,490-$1,500. The material has been provided by InstaForex Company - www.instaforex.com |
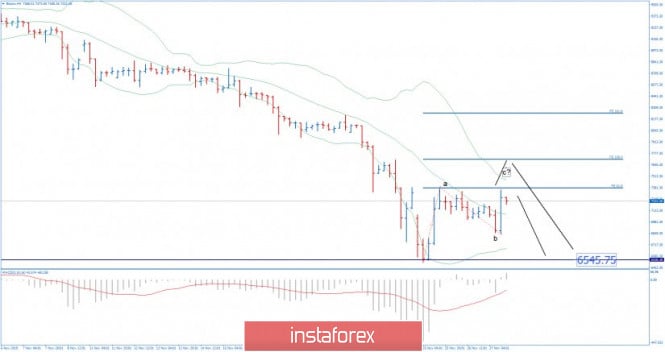
| BTC 11.27.2019 - Potential end of the upward ABC correction, watch for downside Posted: 27 Nov 2019 06:56 AM PST BTC has been trading upside in recent 24h but there is still chance for more downside. Important resistance pivots are set at $7.400 and $7.700. Watch for selling opportunities near resistance levels with the downward target at the price of $6.545.
MACD oscillator did have strong momentum in the background and that is why I still expect further downside after potential ABC upward correction. Support levels are set at the price of $6.870 and $6.545. The material has been provided by InstaForex Company - www.instaforex.com |
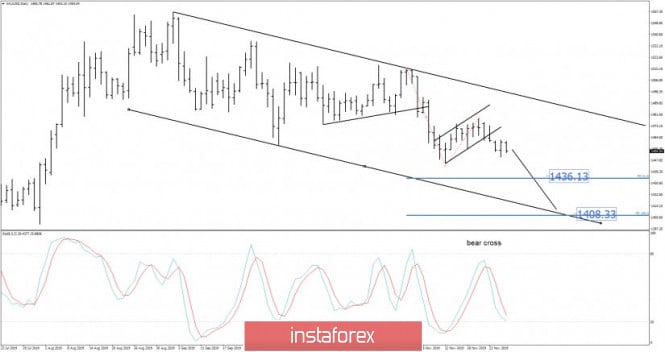
| Gold 11.27.2019 -Daily analysis, downward potential is in play Posted: 27 Nov 2019 06:47 AM PST Gold has been trading sideways at the price of $1.454 but I see potential for further downside due to active downward channel. My advice is to watch for selling opportunities with the downward targets at $1.436 (Fibonacci expansion 61.8%) and $1.408 (Fibonacci expansion 100%).
Stochastic oscillator is showing bear cross in the background and no signs of any bullish reversal yet, which is sign that sellers are in control. Resistance levels are seen at the price of $1.460 and at $1.4176. Support levels are seen at $1.446 and $1.436. The material has been provided by InstaForex Company - www.instaforex.com |
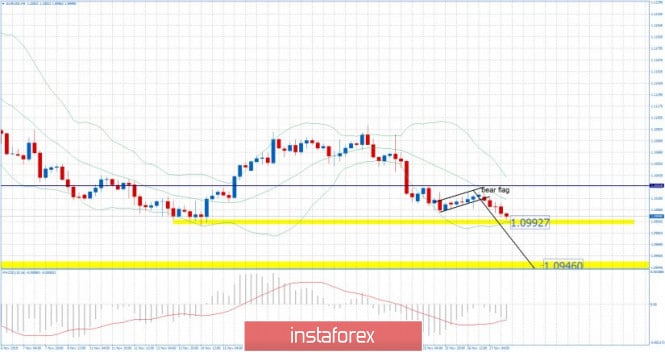
| Posted: 27 Nov 2019 06:38 AM PST Gold has been trading downwards as we expected. The price reached our first target from yesterday at the price of 1.0992. The selling pressure is still active and there is chance for the further downside in case of the down break of 1.0988. Second target is set at 1.0946.
MACD oscillator is showing negative reading below the zero and increased momentum. Support levels are seen at the price of 1.0990 and 1.0946. Resistance level is set at 1.1025. The material has been provided by InstaForex Company - www.instaforex.com |
| Evening review EURUSD 11/27/2019. News came out Posted: 27 Nov 2019 06:30 AM PST
So, the first part of the US data came out. GDP is better than forecast: +2.1% instead of +1.9%. Durable goods orders +0.6% - an expected decline. The US economy is in decent shape. EURUSD is slightly down. But we understand that up to about 1.0945, this can all unfold. We are ready to sell from 1.0985. However, if it turns up, we are ready to buy from 1.1035. We are waiting for the release of the Fed's Beige Book report at 20:00. And the inflation report at 16:00 London time. The material has been provided by InstaForex Company - www.instaforex.com |
| November 27, 2019 : EUR/USD Intraday technical analysis and trade recommendations. Posted: 27 Nov 2019 05:58 AM PST
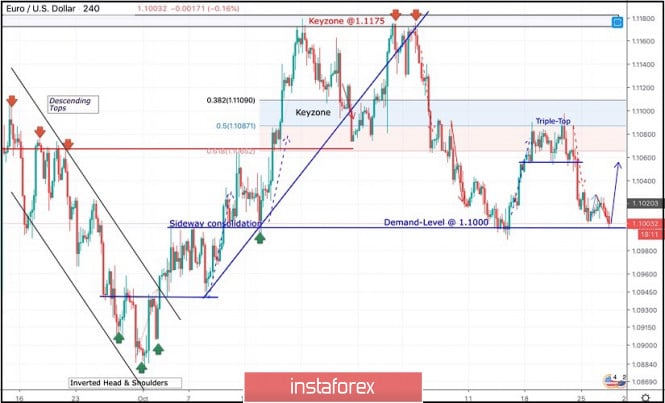
On October 2, an Inverted Head & Shoulders reversal Pattern was demonstrated around 1.0880. Few days later, bullish breakout above 1.0940 (neckline) confirmed the depicted pattern enabling further bullish advancement towards (1.1000 -1.1020). Since then, the EURUSD pair has trended-up until October 21 when the pair hit the price level of 1.1175. The price zone of (1.1175 - 1.1190) stood as a significant SUPPLY-Zone that demonstrated bearish rejection for two consecutive times in a short-period. Hence, a long-term Double-Top pattern was demonstrated with neckline located around 1.1075-1.1090 which offered valid bearish positions few weeks ago. That's why, initial bearish decline was executed towards 1.1025 and 1.0995 where another episode of bullish pullback was initiated. Recently, the mentioned bullish pullback was demonstrated towards 1.1065-1.1085 where a cluster of supply levels were located (61.8% Fibo - 50% Fibo levels). Supply-Levels around 1.1065-1.1085 demonstrated significant bearish rejection that brought the pair back towards 1.1000. The current price action suggests a high probability of bullish reversal around 1.1000-1.1020 that brings the EURUSD pair again towards 1.1065-1.1085. Thus the Pair remains trapped between the price levels of 1.1000 and 1.1085 until breakout occurs in either directions. Please note that any bullish breakout above 1.1110 invalidates the mentioned bearish scenario allowing further bullish advancement towards 1.1150. The material has been provided by InstaForex Company - www.instaforex.com |
| November 27, 2019 : GBP/USD Intraday technical analysis and trade recommendations. Posted: 27 Nov 2019 05:54 AM PST
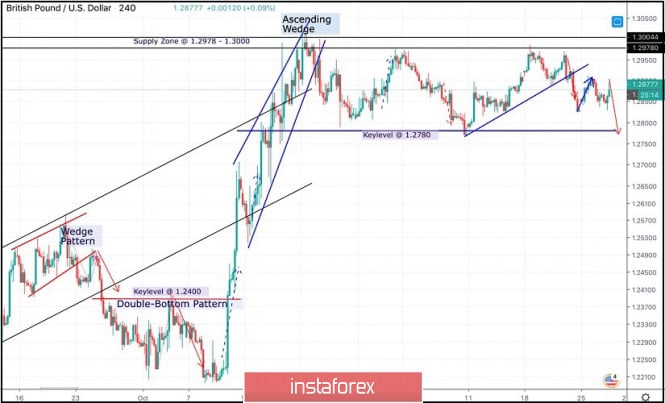
Since October 21, the GBP/USD pair has failed to achieve a persistent bullish breakout above the depicted SUPPLY-zone (1.2980-1.3000) which corresponds to a previous Prominent-TOP that goes back to May 2019. Moreover, an ascending wedge reversal pattern was confirmed on October 22. This indicated a high probability of bearish reversal around the mentioned price zone. Hence, a quick bearish movement was anticipated towards 1.2780 (Key-Level) where bullish recovery was recently demonstrated on two consecutive visits. Since then, the GBP/USD pair has been trapped between the mentioned price levels (1.2780-1.2980) until now. Technical outlook remains bearish as long as consolidations are maintained below 1.3000 on the H4 chart. Moreover, negative divergence was being demonstrated on the H4 chart. That's why, high probability of bearish rejection existed around the price levels of (1.2980-1.3000). A quick bearish breakout below 1.2875 (short-term uptrend) was needed to enable further bearish decline towards 1.2780. However, early bullish recovery was demonstrated around 1.2825. On the other hand, the current bullish pullback towards 1.2880-1.2915 (Recent Supply Levels) should be watched for early bearish rejection and another valid SELL entry. Please note that any bullish closure above 1.2950 invalidates the bearish scenario for the short-term. The material has been provided by InstaForex Company - www.instaforex.com |
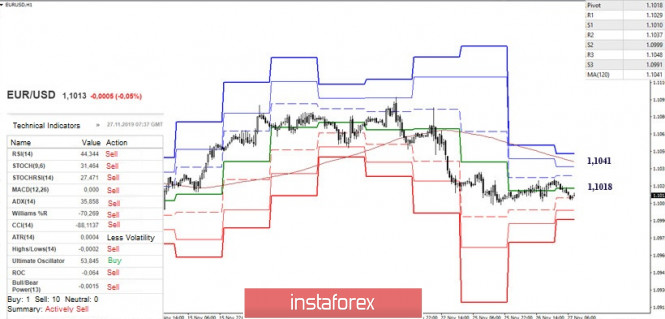
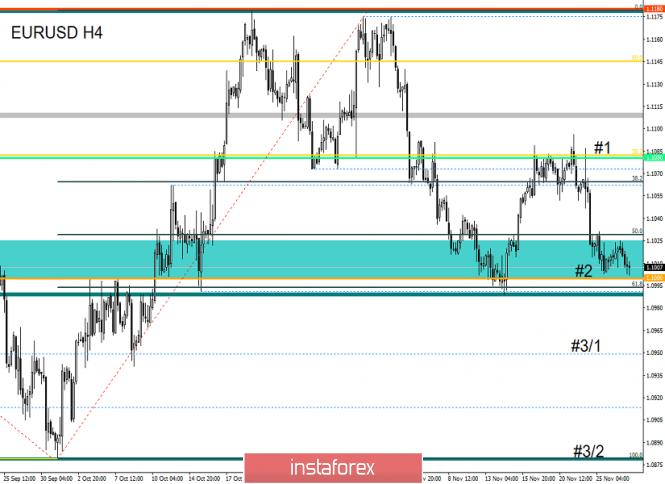
| Trading recommendations for the EURUSD currency pair - placement of trade orders (November 27) Posted: 27 Nov 2019 05:29 AM PST From technical analysis, we see a variable oscillation within the psychological level of 1.1000, where the quote shows extremely low activity. So, the convergence of the price with the control level of the second stage is expected to lead to a slowdown with the formation of variable boundaries 1.1000/1.1030. A re-approach to the level of 1.1000 is a good signal for an attempt to break it, but as we can see from the result, the fear of a rebound prevails in comparison with possible desires. Here we see a sluggish swag, where the volatility of the past day is only 19 points, and this is the lowest value since the summer. Whether it is necessary to be frightened by such sharp deceleration, I do not think, perhaps, it will play only on a hand. So, the repeated convergence with the key value of the recovery process, paired with a slowdown, signals the caution of market participants, at the same time, readiness, which can later be reflected in the momentum. There is only one thing left - to break through the framework and overcome the fear, then we will be able to see the finishing steps (#3/1 and #3/2), otherwise, history will repeat itself. Analyzing the past day hourly, we see such a sluggish pullback that a kind of preservation of the mood did not allow the quote to make at least some extra steps in the market. You just look at the structure of hourly candles, almost 80% of them reflect the characteristic ambiguity. As discussed in the previous review, traders successfully closed short positions as soon as the price approached the level of 1.1000. Subsequent actions were in the plan of waiting, tracking the values of 1.0990/1.1030 for fixing points, which did not happen in the market. Looking at the trading chart in general terms (daily period), we see that the quote froze within the second stage of recovery relative to the oblong correction. Let me remind you that the correction from the value of 1.0879 is in the structure of the main downward trend, which weights more than a year and a half. The news background of the past day had in itself data on sales of new homes in the United States, where previous data revised for the better from -0.7% to 4.5%, and the current figures came out worse than the forecast -0.7%. In quantitative terms, we have 733K against 738K in the previous period. In turn, the composite index of house prices confirmed expectations and came out with a figure of 2.1%. There was no market reaction to the statistics, as well as a considerable number of speeches that were present in the past day. Yesterday, several representatives of the Fed and ECB spoke, but apparently, everything went so quietly that no one even noticed their presence. For example, the head of the Fed Jerome Powell spoke for the first time after a meeting with Donald Trump with reproaches for too high rates. But even now we do not have something new in the words of Jerome Powell. In turn, the information background continues to discuss the recent bilateral telephone talks between the US and China regarding the long-term trade agreement, where there are no results, but in words, everything is there. So, US President Donald Trump gave his comments on the existing process, claiming that we are already in the last stages of work. "As you know, I have very good relations with President Xi Jinping. We are in the final stages of working on a very important agreement. Perhaps the most important trade agreement in history. Things are going very well, but at the same time, we want things to go well in Hong Kong," Donald Trump told reporters at the White House. We conclude the column of the information and news background with a major overhaul, this is how France and Germany characterized the further actions of the European Union. The EU project has been hit hard over the past decade by the debt crisis, the influx of migrants and refugees, the rise of eurosceptic populism and Brexit. This is all stated in the working paper prepared by the representatives of the two States, who intend to discuss in two stages the democratic function of the European Union, as well as problems in the field of digitalization, climate change, migration, equality, the principles of the rule of law and European values, as well as trade policy. Today, in terms of the economic calendar, we have a fairly significant package of statistics on the United States. The first thing that catches the eye is the preliminary GDP data, where the second estimate should coincide with the first, showing a slowdown from 2.3% to 2.0%. After that, we have data on durable goods orders, which are down for the second month in a row, where for the current period the decline is 0.8%. At the end of the working day, the "Beige Book" of the Fed will be published, which is a report on the current economic situation in each of the 12 federal districts of the United States. Further development Analyzing the current trading chart, we see that the extremely sluggish oscillation along the psychological level of 1.1000 continues its development, where volatility leaves much to be desired, but perhaps there is a trend. This is what we hope that the current accumulation of 1.1000/1.1030 will play into the hands of volatility and there will be an acceleration. Is it worth saying that the breakdown of the level of 1.1000 with the transition to stage #3/1 will be right now? It is very desirable to see it, but with a 100% probability, it will not be argued, since there are a considerable number of factors outside our theory, and therefore it is better to take both positions (Breakdown & Rebound) and earn on the accumulation. Detailing every minute the available portion of time, we see an extremely sluggish, but still decline from the beginning of the trading day, where the quote came close to the psychological mark of 1.1000. In turn, traders are on a low start, carefully analyzing the behavior of the quote relative to the values of 1.0990/1.1030, as the momentum can come at any time. It is likely to assume that the fluctuation with variable frames along the psychological mark will persist, where the trading method remains the same as it was before, "Break & Rebound". Thus, we continue to monitor the values of 1.0990/1.1030, where if the control level of 1.1000 falls, we will see the finishing stages 3/1 and 3/2. Based on the above information, we derive trading recommendations:
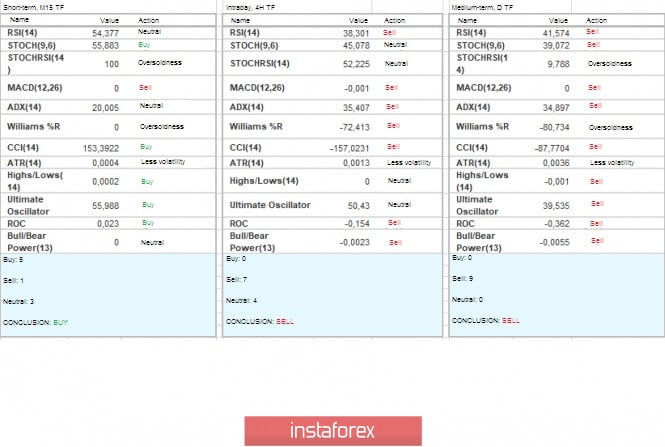
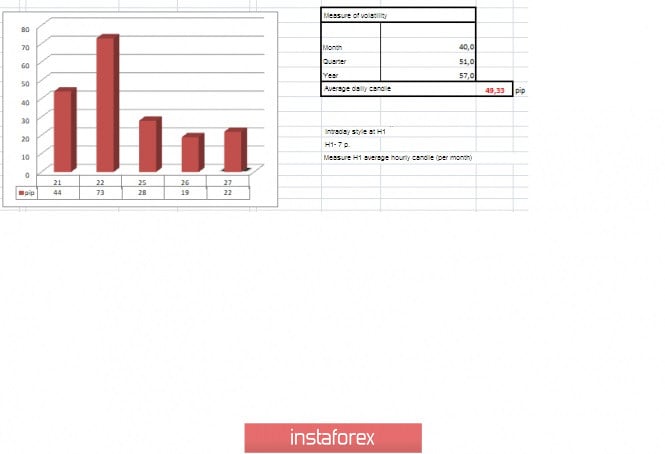
Indicator analysis Analyzing the different sectors of timeframes (TF), we see that the indicators mostly retain downward interest, which corresponds to the general mood of the market. At the same time, short-term portions of time variably slide on accumulation, thus having a multidirectional interest. The volatility for the week / Measurement of volatility: Month; Quarter; Year. Volatility measurement reflects the average daily fluctuation, with the calculation for the Month / Quarter / Year. (November 27 was built taking into account the time of publication of the article) The volatility of the current time is 22 points, which is still a low indicator for this period. It is likely to assume that once the accumulation within the benchmark level is broken through, there will be a local acceleration of volatility. Key level Resistance zones: 1.1080**; 1.1180* ; 1.1300**; 1.1450; 1.1550; 1.1650*; 1.1720**; 1.1850**; 1.2100. Support zones: 1.1000***; 1.0900/1.0950**;1.0850**; 1.0500***; 1.0350**; 1.0000***. * Periodic level ** Range level *** Psychological level ***** The article is based on the principle of conducting transactions, with daily adjustments. The material has been provided by InstaForex Company - www.instaforex.com |
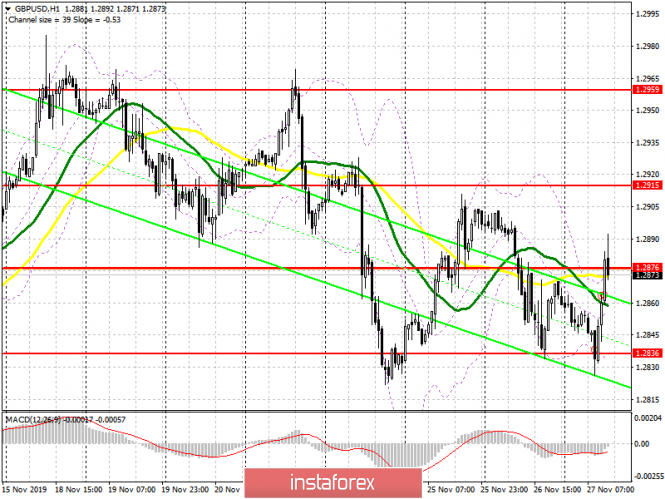
| Posted: 27 Nov 2019 04:01 AM PST To open long positions on GBPUSD, you need: In the first half of the day, I paid attention to the support level of 1.2836, from where I recommended opening long positions provided that a false breakdown was formed there, which happened. Buyers of the pound managed to implement a bullish scenario and are now trying to regain the resistance of 1.2876, a breakthrough and consolidation above which will provide GBP/USD with a new upward momentum that can lead to an update of the highs of 1.2915 and 1.2959, where I recommend taking the profits. However, without good news and confidence in the victory of the Conservative Party of Great Britain in the elections, we should not expect a more powerful bullish momentum. In case of unsuccessful consolidation above 1.2876, and this scenario can be implemented after good statistics on the US economy, you can count on new purchases at the same support level of 1.2836, and open long positions immediately on the rebound is best from the minimum of 1.2799. To open short positions on GBPUSD, you need: Sellers tried to break below the support of 1.2836, but failed to do so. The sharp reversal of the market allowed GBP/USD to bounce up to the resistance of 1.2876, for which there is now an active struggle. In the scenario of a return of the pound under this level in the afternoon, and this can happen only in the case of good economic indicators of the United States, the bears will act more actively, which will push the pair back to the support of 1.2836, where I recommend taking the profits, as only a breakthrough of this level will increase the pressure on the pound and will allow reaching the minimum of 1.2799. If the bulls continue their purchases, it is best to consider new short positions on the rebound from the resistance of 1.2915, or even higher, at the maximum of 1.2959. Indicator signals: Moving Averages Trading returned around the 30 and 50 daily averages, indicating that the market may remain in the side channel. Bollinger Bands Buyers are trying to cope with the upper limit of the indicator around 1.2876, a breakthrough of which will provide a new wave of growth of the pound. In the case of a decline, the support will be provided by the lower border, which coincides with the support of 1.2836.
Description of indicators
|
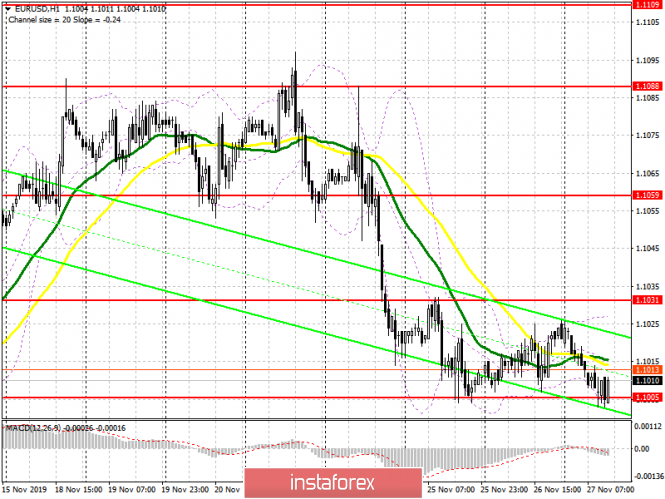
| Posted: 27 Nov 2019 03:43 AM PST To open long positions on EURUSD, you need: Released in the first half of the day, data on the German import price index put pressure on the euro, as though they were better than economists' forecasts, but confirmed the problems with growth. The report showed that import prices fell in October this year by 0.1% after rising by 0.6% in September. Buyers will again have to defend the support level of 1.1005, which I paid attention to in the morning review. It is best to open long positions from it only after the formation of a false breakdown, which the bulls are now trying to do. But you can buy EUR/USD immediately on the rebound from the larger support area of 1.0989. The main task of the bulls in the second half of the day will be a return to the resistance of 1.1031, where I recommend taking the profits. However, this can be done under the condition of weak fundamental statistics, the release of which is scheduled for the American economy in the second half of the day. Particular attention will be drawn to the report on US GDP for the 3rd quarter of this year, where growth is expected to be 1.9%. Weaker data will again test the resistance of 1.1031, a breakthrough of which will lead to an update of the maximum of 1.1059. To open short positions on EURUSD, you need: On the contrary, good indicators on the US economy will allow bears to increase their short positions in EUR/USD. The breakthrough of the support of 1.1005, which was not possible to do once again during the European session, will lead to another wave of sales of EUR/USD with the update of the lows in the area of 1.0989 and 1.0972, where I recommend taking the profits. In the absence of activity at the level of 1.1005, short positions can be returned only after the formation of a false breakdown in the resistance area of 1.1031 or sell the euro immediately on the rebound from the maximum of 1.1059. Indicator signals: Moving Averages Trading is below the 30 and 50 moving averages, which indicates a further probability of a decline in the euro. Bollinger Bands Breaking the lower border of the indicator around 1.1005 will lead to a larger sell-off of the euro. Growth will be limited to the upper level of the indicator around 1.1025.
Description of indicators
|


| You are subscribed to email updates from Forex analysis review. To stop receiving these emails, you may unsubscribe now. | Email delivery powered by Google |
| Google, 1600 Amphitheatre Parkway, Mountain View, CA 94043, United States | |
No comments:
Post a Comment