Forex analysis review |
- USDCAD remains in sideways tightening trading range since July
- EURUSD bounces off cloud support as expected
- Gold price implies bullish trend reversal
- December 23, 2019 : GBP/USD Intraday technical analysis and trade recommendations.
- December 23, 2019 : EUR/USD Intraday technical analysis and trade recommendations.
- EUR/USD for December 23,2019 - Broken resistance pivot at 1.1087, watch for buying opportunities
- Gold 12.23.2019 - Breakout of the supply trendline, buying opportunities preferable
- BTC 12.23.2019 - Bullish fag in creation on the 4h time-frame, watch for buying opportutniies
- Fractal analysis for major currency pairs as of December 23
- Evening review for EURUSD for 12/23/2019
- GBP/USD: plan for the US session on December 23. The pressure on the pound remains, and the level of 1.2985 is passed
- EUR/USD: plan for the US session on December 23. The euro has returned to its beloved occupation. Volatility at a minimum
- Technical analysis recommendations for EUR / USD and GBP / USD on December 23
- EUR/USD. December 23. Donald Trump continues to fight with Democrats
- GBP/USD. December 23. Paradoxical Prime Minister, paradoxical Brexit
- Analysis and trading recommendations for USD/JPY for December 23
- Analysis and forecast for EUR/USD for December 23, 2019
- Trading recommendations for the GBP/USD currency pair - placement of trading orders (December 23)
- Technical analysis of GBP/USD for December 23, 2019
- EUR/USD holiday mood: forward to slowdown
- Trader's Diary: EURUSD on 12/23/2019, Market condition
- Fist-waving tomato seller, EUR / USD and GBP / USD review on December 23
- Analysis of EUR / USD and GBP / USD for December 23
- The markets will remain moderately optimistic until the end of the year (we expect a local decline in the USD/JPY pair,
- Simplified wave analysis of EUR/USD, AUD/USD and GBP/JPY for December 23
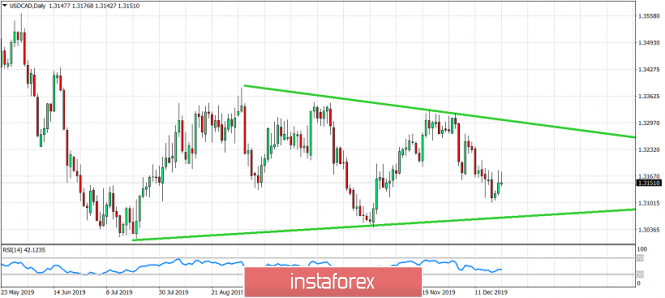
| USDCAD remains in sideways tightening trading range since July Posted: 23 Dec 2019 12:47 PM PST USDCAD has made no real progress since last July. Price bottomed around 1.30 and bounced towards 1.3380. Since then price is making lower highs and higher lows in a contracting triangle pattern.
Green lines- triangle pattern USDCAD is approaching again the lower triangle boundary. Support is at 1.3060 area. If price holds this support level then we could see a bounce towards 1.3250-1.33. Short-term trend remains bearish as price is making lower lows and lower highs. A daily close above 1.3181 would turn short-term trend bullish. The material has been provided by InstaForex Company - www.instaforex.com |
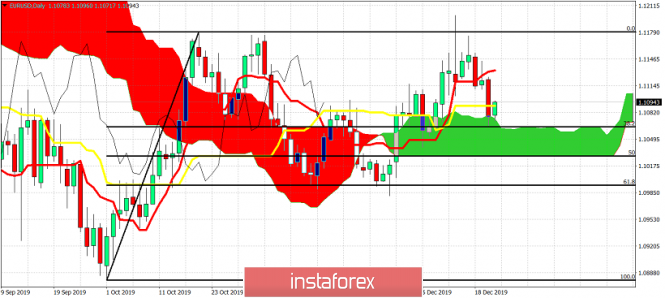
| EURUSD bounces off cloud support as expected Posted: 23 Dec 2019 12:27 PM PST EURUSD is bouncing off the Ichimoku cloud in the Daily chart as expected by our latest analysis. EURUSD bulls are trying to recapture 1.11. Bulls need to show more signs of strength in order to continue the bounce higher.
|
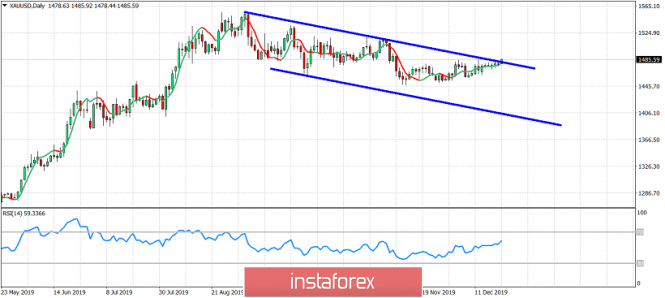
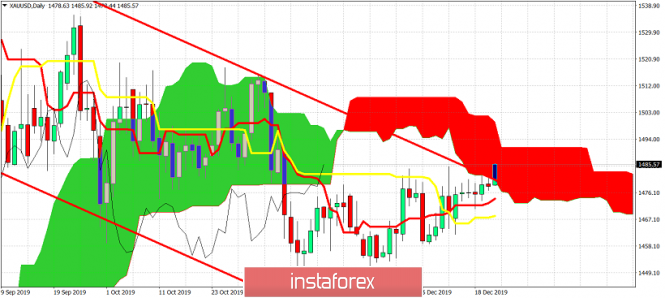
| Gold price implies bullish trend reversal Posted: 23 Dec 2019 12:18 PM PST Gold price is about to exit the downward sloping channel. Gold price is entering the Ichimoku cloud turning Daily trend to neutral from bearish. Gold has the potential to enter bullish trend if bulls recapture $1,490-$1,500.
Gold price is making higher highs and higher lows. Gold price is breaking above the upper channel boundary resistance. Gold price has support at $1,474-67. Resistance is at $1,494 by the upper cloud boundary.
Red lines- bearish channel Gold price has entered the Kumo turning trend to neutral. Price is above both the tenkan- and kijun-sen. Price must break above the Kumo in order for trend to change to bullish. If trend changes to bullish then we could even see $1,550-$1,600 over the coming weeks. Recapturing $1,500 is key. The material has been provided by InstaForex Company - www.instaforex.com |
| December 23, 2019 : GBP/USD Intraday technical analysis and trade recommendations. Posted: 23 Dec 2019 08:24 AM PST
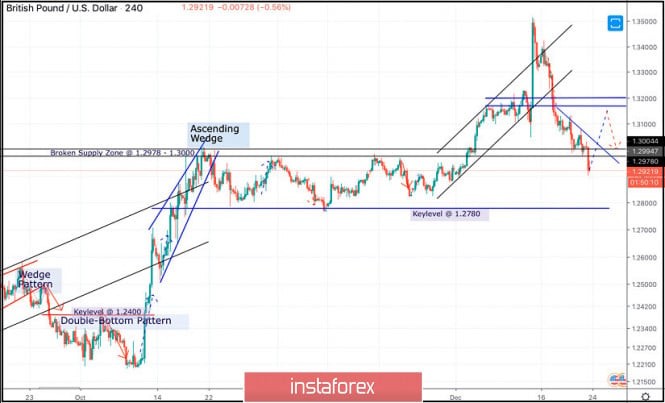
In the period between October 17 to December 4, the GBP/USD pair has been trapped between the price levels of 1.2780 and 1.3000 until December 4 when bullish breakout above 1.3000 was achieved. Moreover, a newly-established short-term bullish channel was initiated on the chart. The GBPUSD has recently exceeded the upper limit of the depicted bullish channel on its way towards 1.3500 where the pair looked quite overpriced. This was followed by successive bearish-engulfing H4 candlesticks which brought the pair back towards 1.3170 quickly. Further bearish decline was pursued towards 1.3000 which got broken to the downside as well. Short-term outlook remains bearish as long as bearish persistence below 1.3000 is maintained on the H4 chart. Further bearish decline is expected towards 1.2840 - 1.1800 provided that bearish persistence below the newly-established downtrend line is maintained. On the other hand, Intraday bullish pullback may be anticipated to occur towards 1.3170-1.3190 where bearish rejection and another bearish swing can be initiated. The material has been provided by InstaForex Company - www.instaforex.com |
| December 23, 2019 : EUR/USD Intraday technical analysis and trade recommendations. Posted: 23 Dec 2019 08:02 AM PST
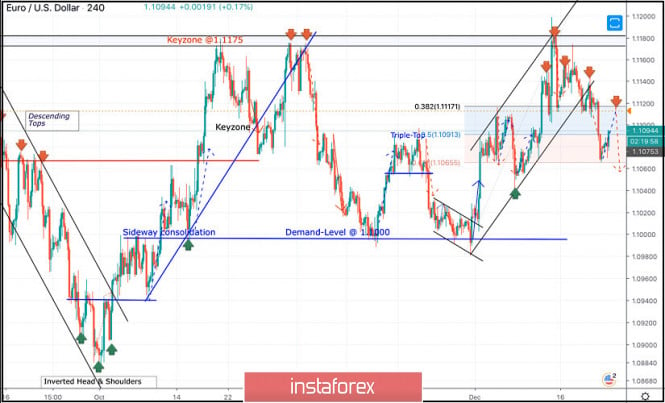
Since November 14, the price levels around 1.1000-1.0995 has been standing as a significant DEMAND zone which has been offering adequate bullish SUPPORT for the pair on two successive occasions. Shortly-after, the EUR/USD pair has been trapped within a narrower consolidation range between the price levels of 1.1000 and 1.1085-1.1100 (where a cluster of supply levels and a Triple-Top pattern were located) until December 11. On December 11, significant bullish swing was initiated around 1.1040 allowing recent bullish breakout above 1.1110 to pursue towards 1.1175 within the depicted newly-established bullish channel. Intraday bearish rejection was expected around the price levels of (1.1175). Hence, a quick bearish decline was demonstrated towards 1.1115 (38.2% Fibonacci level) which got broken to the downside as well. On Friday, further bearish decline was demonstrated towards 1.1065 where early signs of bullish recovery is currently manifested. Bearish breakout below 1.1065 probably indicates further bearish decline to be anticipated towards 1.1040 and 1.1010. On the other hand, any bullish pullback towards 1.1115 should be watched for bearish rejection and another SELL entry. If earlier bearish decline below 1.1065 is demonstrated, next bearish projection target would be located around 1.1010. Trade recommendations : Conservative traders should wait for a bullish pullback towards 1.1115 ( reversal pattern neckline ) as a valid SELL signal. Bearish projection target to be located around 1.1090, 1.1040 and 1.1010. The material has been provided by InstaForex Company - www.instaforex.com |
| EUR/USD for December 23,2019 - Broken resistance pivot at 1.1087, watch for buying opportunities Posted: 23 Dec 2019 07:17 AM PST Technical analysis:
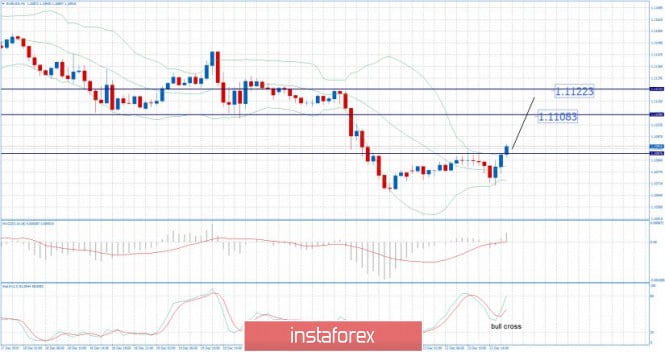
EUR has been trading upwards in the past 24-hours. I found the breakout of the key swing high at 1.1087.There is also a fake bear flag, which is good sign for the further upside. Watch for buying opportunities on the dips with the targets at 1.1108 and 1.1122. MACD oscillator is showing new momentum up on the last rally, which is good confirmation for our bullish view. Stochastic oscillator did fresh new bull cross Resistance level is seen at price of 1.1108 and 1.1122 Support levels are set at the price of 1.1087 and 1.1070 The material has been provided by InstaForex Company - www.instaforex.com |
| Gold 12.23.2019 - Breakout of the supply trendline, buying opportunities preferable Posted: 23 Dec 2019 07:10 AM PST Technical analysis:
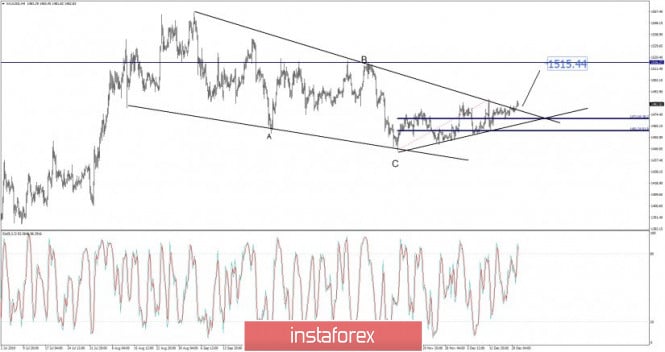
Gold has been trading upwards in the past 24-hours. I found the breakout of the key supply trend line and potential for further upside. There is also completion of the major ABC downward correction. Watch for buying opportutniies with the main target at $1.515. There is the up gap which is holding and the breakout of the supply trend line, which is sign that buyers are in control. MACD oscillator is showing new momentum up on the last rally, which is good confirmation for our bullish view. Resistance level is seen at price of $1.486 and at $1.515 Support levels are set at the price of $1.481 and $1.475 The material has been provided by InstaForex Company - www.instaforex.com |
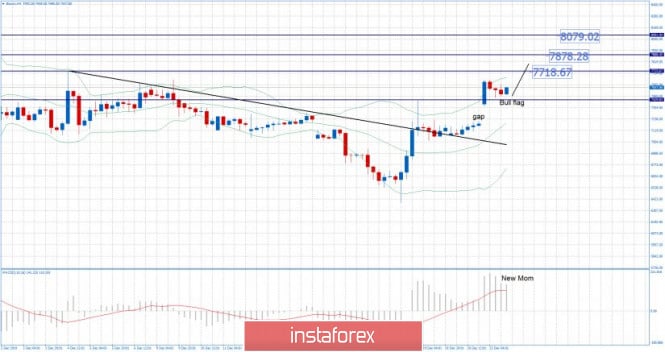
| BTC 12.23.2019 - Bullish fag in creation on the 4h time-frame, watch for buying opportutniies Posted: 23 Dec 2019 06:52 AM PST Industry news: Bitcoin behaved positively during the weekend and was able to grow above $7,600 after several weeks below that level. Traders are becoming very enthusiastic about what can happen in the future and whether Bitcoin will start moving in an upward trend. Other digital currencies were able to expand in the market, not only Bitcoin. Indeed, Ethereum (ETH), XRP, Litecoin (LTC) and Bitcoin Cash (BCH) were also growing and showing their strength. Despite that, the main question for many traders that remains to be answered is when will the industry experience a new alt season. Mr. Vays considers that Bitcoin dominance could continue growing before the real alt season starts having its effect in the market. Indeed, he remains sure that Bitcoin could eventually reach a market dominance of 98%. Technical analysis:
Bitcoin has been trading upwards as I expected last week. The price tested the level of $7.627.I do expect more upside movement and potential tests of $7.718, $7.878 and $8.079. There is the up gap which is holding and the breakout of the supply trendline, which is sign that buyers are in control. MACD oscillator is showing new momentum up on the last rally, which is good confirmation for our bullish view. Resistance level is seen at the price of $7.718, $7.878 and $8.079. Support zone is set $7.207-$7.447 The material has been provided by InstaForex Company - www.instaforex.com |
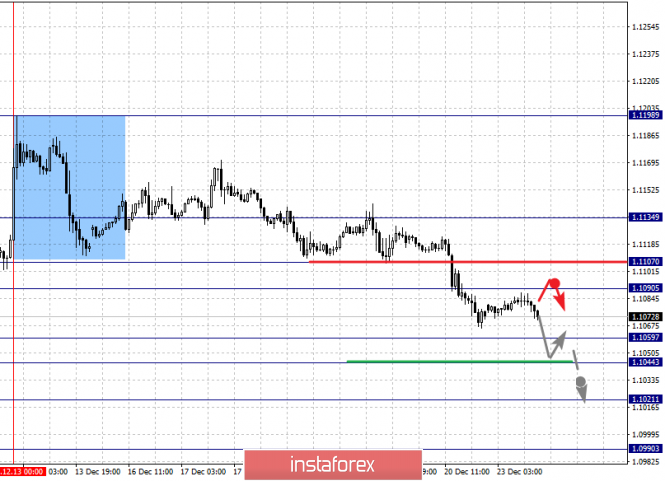
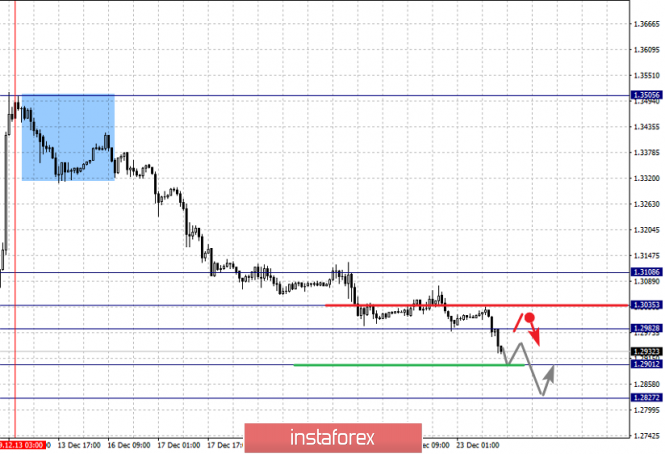
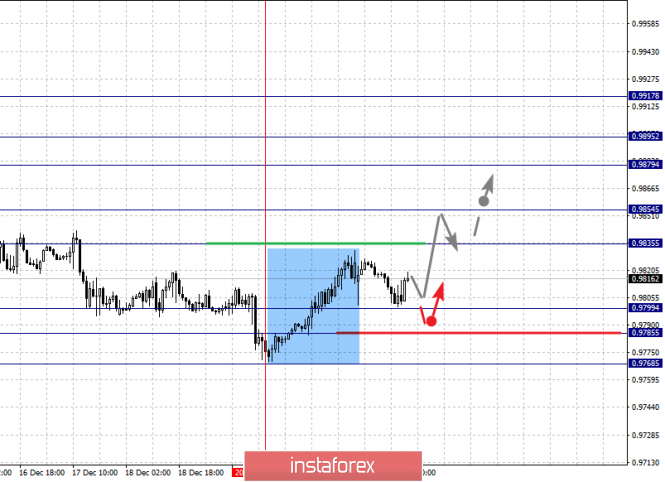
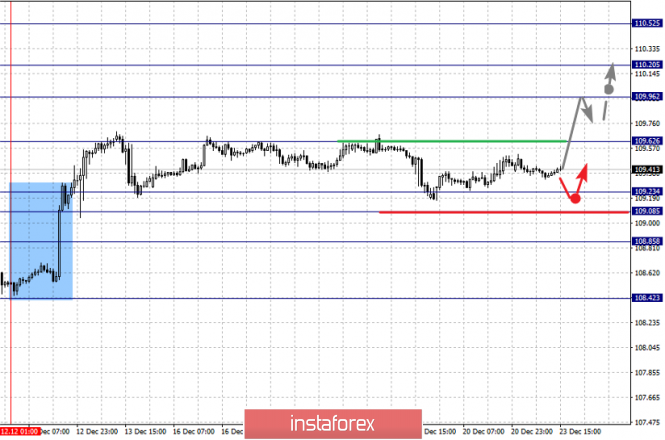
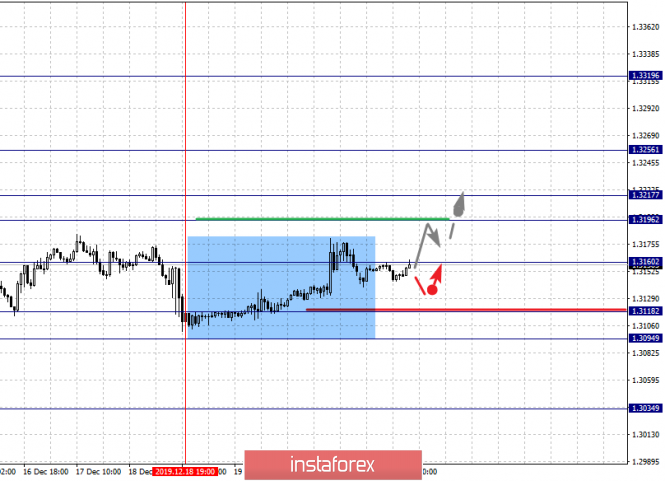
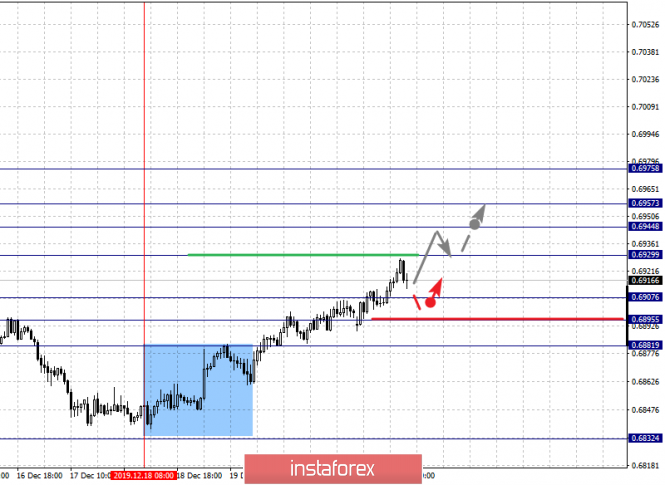
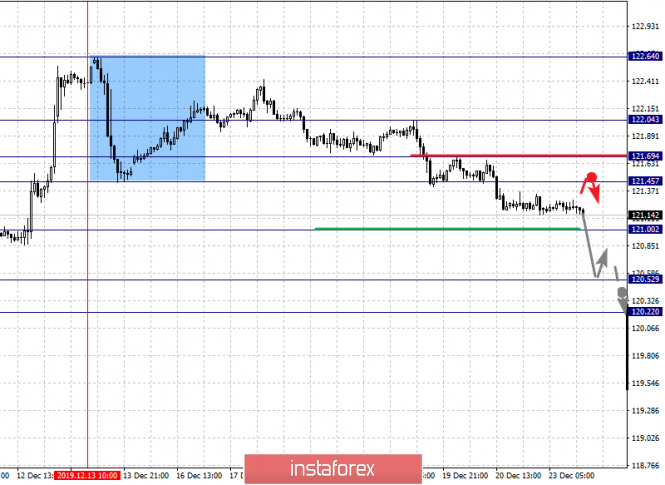
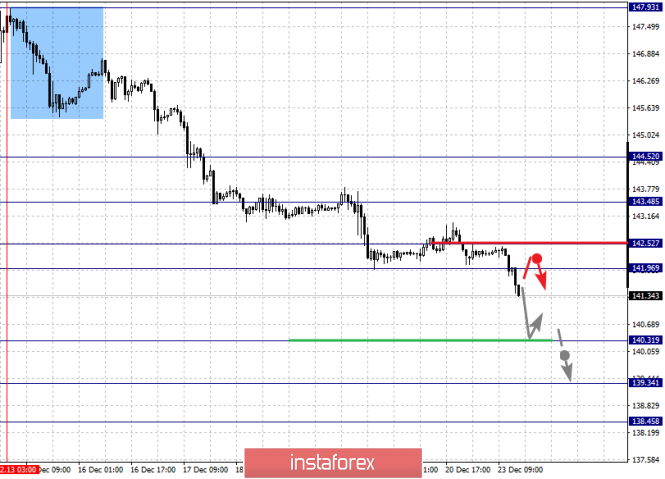
| Fractal analysis for major currency pairs as of December 23 Posted: 23 Dec 2019 06:43 AM PST Hello, dear colleagues. For the Euro/Dollar pair, we follow the development of the downward cycle from December 13 and the level of 1.1044 is the key resistance. For the Pound/Dollar pair, the continuation of the downward movement is expected after the breakdown of 1.2900 and the level of 1.3035 is the key support. For the Dollar/Franc pair, the price has issued expressed initial conditions for the top of December 19. For the Dollar/Yen pair, the price forms mid-term initial conditions for the high from December 12; the level of 109.62 is the key resistance and the level of 109.08 is the key support. For the Euro/Yen pair, we expect the continuation of the downward cycle from December 13 after the breakdown of 121.00 and the level of 121.69 is the key support. For the Pound/Yen pair, we expect to reach the level of 140.31 and the level of 141.96 is the key support. Forecast for December 23: Analytical review of currency pairs on the H1 scale:
For the Euro/Dollar pair, the key levels on the H1 scale are 1.1134, 1.1107, 1.1090, 1.1059, 1.1044, 1.1021, and 1.0990. We follow the development of the downward cycle of December 13. The short-term downward movement is expected in the range of 1.1059-1.1044. The breakdown of the last value will lead to a movement to the level of 1.1021, near this level is the consolidation and hence a high probability of a reversal into a correction. We consider the level of 1.0990 as a potential value for the bottom. The short-term upward movement is expected in the range of 1.1090-1.1107 and the breakdown of the last value will lead to an in-depth correction. The target is 1.1134. The main trend is the downward cycle from December 13. Trading recommendations: Buy: 1.1090 Take profit: 1.1107 Buy: 1.1109 Take profit: 1.1130 Sell: 1.1057 Take profit: 1.1045 Sell: 1.1043 Take profit: 1.1022
For the Pound/Dollar pair, the key levels on the H1 scale are 1.3108, 1.3035, 1.2982, 1.2901, and 1.2827. We follow the development of the downward cycle of December 13. The continuation of the downward movement is expected after the breakdown of 1.2901. The potential target is 1.2827, from this level, we expect a pullback to the correction. A short-term upward movement is possible in the area of 1.2982-1.3035 and the breakdown of the last value will lead to a protracted correction. The target is 1.3108 and this level is the key support for the downward structure. The main trend is the downward cycle from December 13 Trading recommendations: Buy: 1.2982 Take profit: 1.3033 Buy: 1.3037 Take profit: 1.3108 Sell: Take profit 1.2900: 1.2830 Sell: Take profit:
For the Dollar/Franc pair, the key levels on the H1 scale are 0.9917, 0.9895, 0.9879, 0.9854, 0.9835, 0.9799, 0.9785, and 0.9768. The price has issued the expressed initial conditions for the top of December 19. We expect the continuation of the upward movement after the breakout of 0.9835. In this case, the target is 0.9854 and near this level is the consolidation. The breakout of the level of 0.9855 will lead to a pronounced movement. The target is 0.9879 and in the area of 0.9879-0.9895 is the short-term upward movement, as well as consolidation. We consider the level of 0.9917 as a potential value for the top, from which we expect a pullback to the bottom. A short-term downward movement is possible in the area of 0.9799-0.9785 and the breakdown of the last value will lead to the cancellation of the upward structure from December 19. In this case, the first target is 0.9768. The main trend is the initial conditions for the top of December 19. Trading recommendations: Buy: 0.9835 Take profit: 0.9852 Buy: 0.9856 Take profit: 0.9877 Sell: 0.9799 Take profit: 0.9787 Sell: 0.9783 Take profit: 0.9768
For the Dollar/Yen pair, the key levels in the H1 scale are 110.52, 110.20, 109.96, 109.62, 109.23, 109.08, and 108.85. We follow the formation of the initial conditions for the top of December 12. The continuation of the upward movement is expected after the breakdown of 109.62. In this case, the target is 109.96 and in the area of 109.96-110.20 is the short-term upward movement, as well as consolidation. We consider the level of 110.52 as a potential value for the top, upon reaching which, we expect a pullback in the correction. The short-term downward movement is expected in the range of 109.23-109.08 and the breakdown of the last value will lead to an in-depth correction. The target is 108.85 and this level is the key support for the upward structure from December 12. The main trend is the initial conditions for the top of December 12. Trading recommendations: Buy: 109.63 Take profit: 109.96 Buy: 109.98 Take profit: 110.20 Sell: 109.23 Take profit: 109.08 Sell: 109.06 Take profit: 108.85
For the Canadian dollar/Dollar pair, the key levels on the H1 scale are 1.3256, 1.3217, 1.3196, 1.3146, 1.3118, 1.3094, and 1.3034. The price has issued a pronounced potential for the top of December 18. The continuation of the upward movement is expected after the breakdown of 1.3160. The target is 1.3196 and the range of 1.3196-1.3217 is the key support for the downward structure. Its passage at the price will favor the development of the upward movement. The potential target is 1.3256. A short-term downward movement is possible in the area of 1.3118-1.3094 and the breakdown of the last value should be accompanied by a pronounced movement. The potential target is 1.3034. The main trend is the expressed potential for the top of December 18. Trading recommendations: Buy: 1.3160 Take profit: 1.3196 Buy: 1.3218 Take profit: 1.3252 Sell: 1.3118 Take profit: 1.3096 Sell: 1.3092 Take profit: 1.3040
For the Australian dollar/Dollar pair, the key levels on the H1 scale are 0.6975, 0.6957, 0.6944, 0.6929, 0.6907, 0.6895, and 0.6881. We follow the development of the upward cycle of December 18. The continuation of the upward movement is expected after the breakdown of 0.6930. In this case, the target is 0.6944 and in the area of 0.6944-0.6957 is the short-term upward movement, as well as consolidation. We consider the level of 0.6975 as a potential value for the top, upon reaching which, we expect a pullback to the bottom. The short-term downward movement is expected in the range of 0.6907-0.6895 and the breakdown of the last value will lead to an in-depth correction. The target is 0.6881 and this level is the key support for the top. The main trend is the local upward cycle from December 18. Trading recommendations: Buy: 0.6930 Take profit: 0.6944 Buy: 0.6945 Take profit: 0.6956 Sell: 0.6907 Take profit: 0.6896 Sell: 0.6894 Take profit: 0.6881
For the Euro/Yen pair, the key levels on the H1 scale are 122.04, 121.69, 121.45, 121.00, 120.52, and 120.22. We follow the downward structure of December 13. The continuation of the downward movement is expected after the breakdown of 121.00. In this case, we expect a pronounced movement to the level of 120.52. We consider the level of 120.22 as a potential value for the bottom, near which we expect consolidation, as well as a pullback in the correction. A short-term upward movement is possible in the area of 121.45-121.69 and the breakdown of the last value will lead to an in-depth correction. The target is 122.04 and this level is the key support for the downward structure. The main trend is the downward cycle from December 13. Trading recommendations: Buy: 121.45 Take profit: 121.66 Buy: 121.72 Take profit: 122.04 Sell: 121.00 Take profit: 120.55 Sell: 120.50 Take profit: 120.22
For the Pound/Yen pair, the key levels on the H1 scale are 143.48, 142.52, 141.96, 140.31, 139.34, and 138.45. We follow the development of the downward cycle of December 13. At the moment, we expect to reach the level of 140.31, near which consolidation and hence, there is also a high probability of going into a correction. The breakdown of 140.20 will allow us to count on the movement to 139.34, from which we expect a pullback to the top. A short-term upward movement is possible in the area of 141.96-142.52 and the breakdown of the last value will lead to an in-depth correction. The target is 143.48 and this level is the key support for the downward cycle from December 13. The main trend is the downward cycle from December 13. Trading recommendations: Buy: 141.96 Take profit: 142.50 Buy: 142.55 Take profit: 143.45 Sell: 140.20 Take profit: 139.40 Sell: Take profit: The material has been provided by InstaForex Company - www.instaforex.com |
| Evening review for EURUSD for 12/23/2019 Posted: 23 Dec 2019 06:12 AM PST
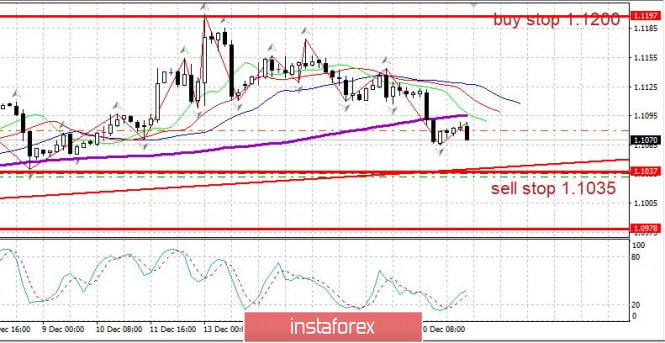
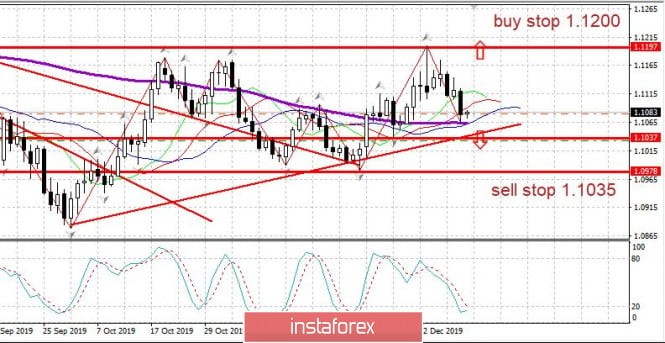
The EURUSD falls before markets leave for Christmas. There are two days of trading before Christmas in Western countries. There is no strong news. The euro is falling. The inability to overcome the 1.1200 upward is perceived by the market as a weakness of the euro and sellers increase the pressure. We sell from 1.1035 and further we sell from 1.0980. In the case of a reversal to the top, we buy at a breakthrough of 1.1200 to the top. The material has been provided by InstaForex Company - www.instaforex.com |
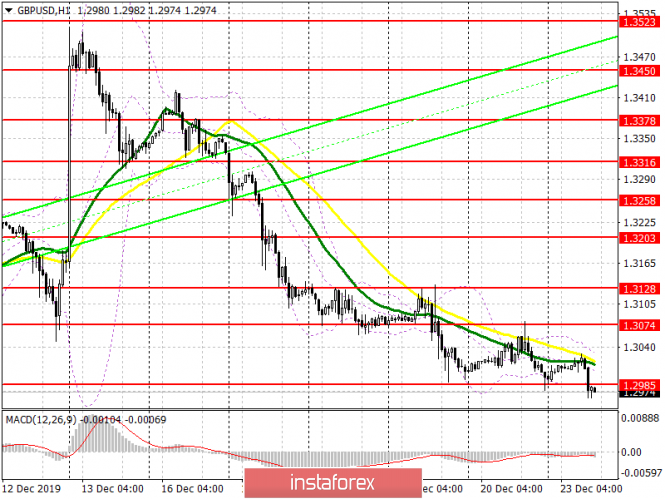
| Posted: 23 Dec 2019 06:11 AM PST To open long positions on GBPUSD, you need: Bulls cannot stop the pressure on the pound, which was formed the day after the victory of the Conservative Party of Great Britain. This time, the bears slowly but surely settled below the support of 1.2985, which I paid attention to in my morning forecast, which may lead to another sell-off of the pound. Buyers urgently, before the end of the day, need to return to 1.2985, and only then can we talk about attempts to correct in the resistance area of 1.3074 and then return to 1.3128, where I recommend fixing the profits. In case of further fall of GBP/USD, it is best to return to long positions after the support test of 1.2933 or a rebound from the December low of 1.2882. To open short positions on GBPUSD, you need: Sellers continue to push the pair down and this time took the support of 1.2985, which has now transformed into resistance. If the bulls soon will not be able to return to this level, we can expect the continuation of the sale of GBP/USD in the area of lows of 1.2933 and 1.2882, to which I drew my attention in the morning forecast and where I recommend taking the profits. If in the second half of the day, the demand for the pound will return, and this can happen only with weak fundamental statistics on the American economy, then short positions can be returned after updating the maximum of 1.3074 or sell immediately on a rebound from 1.3128. Indicator signals: Moving Averages Trading is below the 30 and 50 daily averages, indicating that the bearish nature of the market remains. Bollinger Bands If the pound rises in the second half of the day, the upper limit of the channel 1.3050 will act as a resistance, from which you can sell immediately for a rebound.
Description of indicators
|
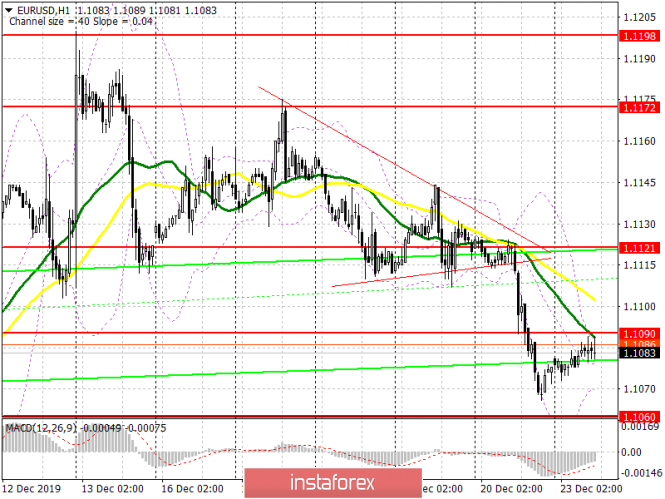
| Posted: 23 Dec 2019 03:55 AM PST To open long positions on EURUSD, you need: In the first half of the day, amid the absence of important fundamental statistics, the situation in the technical picture did not change, and the euro showed intraday volatility below 20 points. At the moment, all the focus remains on the level of 1.1090, which now acts as a resistance. Fixing above this range will lead to a larger upward correction in the area of the maximum of 1.121, above which it will be quite difficult to breakthrough. If the pressure on EUR/USD persists, it is best to return to long positions only on a rebound from the support of 1.1060, provided that divergence is formed on the MACD indicator, or from a larger minimum of 1.1041. To open short positions on EURUSD you need: Sellers will protect the resistance of 1.1090, and the formation of a false breakout there will be a direct signal to open short positions in the continuation of the downward trend to update the lows of 1.1060 and 1.1041, where a bullish divergence can be formed on the MACD indicator, so I recommend taking profits there. In the absence of pressure on the euro around 1.1090, it is best to postpone sales until the release of fundamental statistics on the American economy, namely the number of orders for long-term goods, and open short positions immediately on the rebound from the maximum of 1.121, as a breakthrough above this level will negate all Friday's efforts of euro sellers. Indicator signals: Moving Averages Trading is conducted below 30 and 50 moving averages, which now act as resistance. Bollinger Bands Low volatility does not give signals to enter the market.
Description of indicators
|
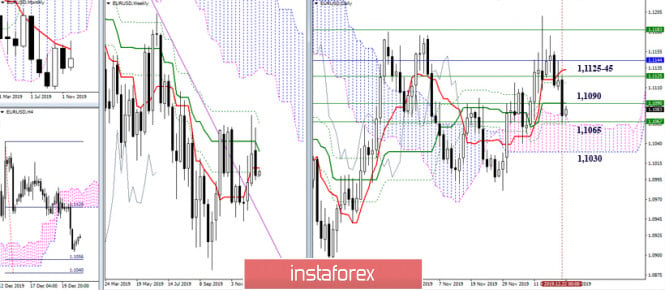
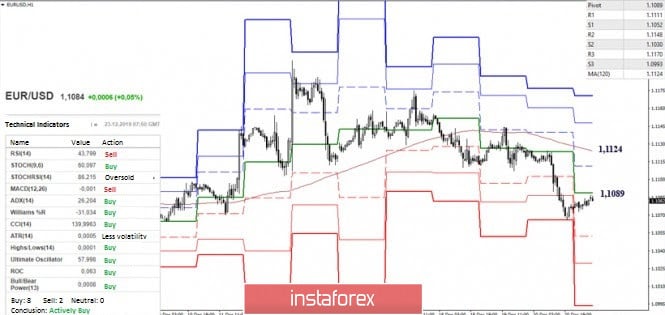
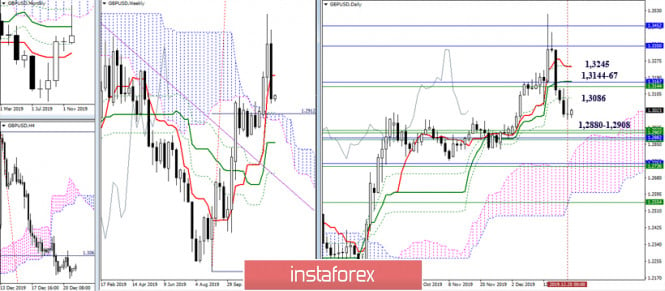
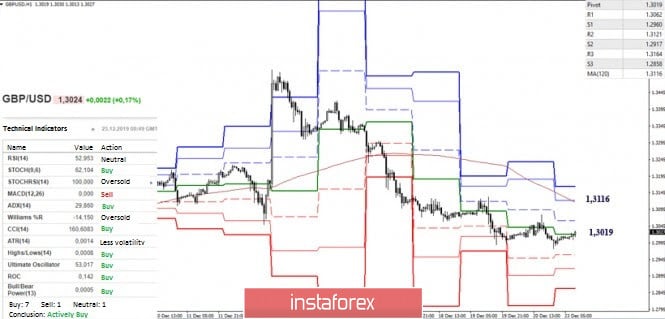
| Technical analysis recommendations for EUR / USD and GBP / USD on December 23 Posted: 23 Dec 2019 02:31 AM PST Technical analysis recommendations for EUR / USD and GBP / USD on December 23 Economic calendar (Universal time) The economic calendar today contains little information. We can only note data from the United States, which are about basic orders for durable goods (12:30) and sales of new housing (15:00). EUR / USD Towards the closing of last week, the lowering players still managed to show themselves and performed a reduction to the previously indicated support area of 1.1090-65. As a result, the last weekly candle went down in history with a pronounced bearish character. In the near future, the question of the mood of the monthly candle and the results of the year will be decided. The closest bearish reference now is the daily cloud 1.1065 (Senkou Span A + weekly Fibo Kijun + daily Fibo Kijun) - 1.1030 (Senkou Span B). After the cloud passes and consolidates in the bearish zone relative to it, there will come a time of minimum extremes of 1.0981 to 1.0879, the updating of which will help to restore the global downward trend. If we consider the plans and opportunities for players to increase, then the first resistance to the restoration of bull positions is now 1.1090 (daily Kijun + weekly Tenkan). Furthermore, attention will be focused on the resistance zone 1.1145 - 25 (daily short-term trend + weekly medium-term trend + monthly short-term trend), followed by the liquidation of the weekly dead cross and updating the maximum which is at 1.1200 . In the lower halves, the pair is in the correction zone, which the analyzed technical indicators have already set up to actively support. But at the same time, the increase players have not yet managed to overcome any of the key resistance, so now we can only talk about the origin of the correction. The most important resistances that can affect the distribution of forces are located at the central Pivot level which is 1.1089 to the weekly long-term trend of 1.1124. If you exit the correction zone and continue to decline, the support may be the intra-day classic Pivot levels at 1.1052 - 1.1030 - 1.0993. GBP / USD Last week was marked by the bears, however, on Friday the pair indicated some inhibition so now it is possible to develop a correctional upward turn, which can develop into a retest of levels at 1.3086 for the daily Fibo Kijun, passed on the eve at 1.3144 - 67 for the weekly Tenkan + monthly Kijun + daily Kijun and at 1.3245 for the daily Tenkan. Immediate support is still concentrated in the area of 1.2880 - 1.2908 (weekly cloud + monthly Fibo Kijun + weekly Fibo Kijun). Forming an upward correction, the upward players entered the fight for the central Pivot of the day which is at 1.3019. The next important reference will be the resistance of the weekly long-term trend concurrently located at 1.3116. If the players on the rise will fail again with the development of a corrective rise, then the couple is waiting for the support of the classic Pivot levels at 1.2960 - 1.2917 - 1.2858. Ichimoku Kinko Hyo (9.26.52), Pivot Points (classic), Moving Average (120) The material has been provided by InstaForex Company - www.instaforex.com |
| EUR/USD. December 23. Donald Trump continues to fight with Democrats Posted: 23 Dec 2019 02:29 AM PST EUR/USD - 4H.
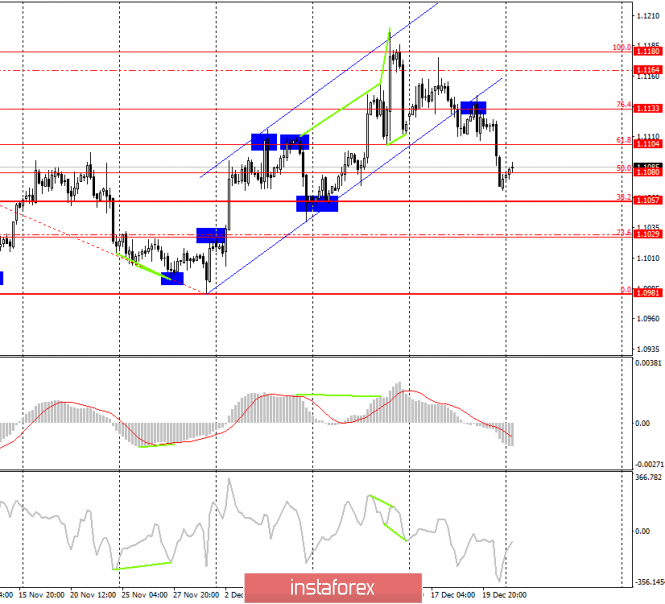
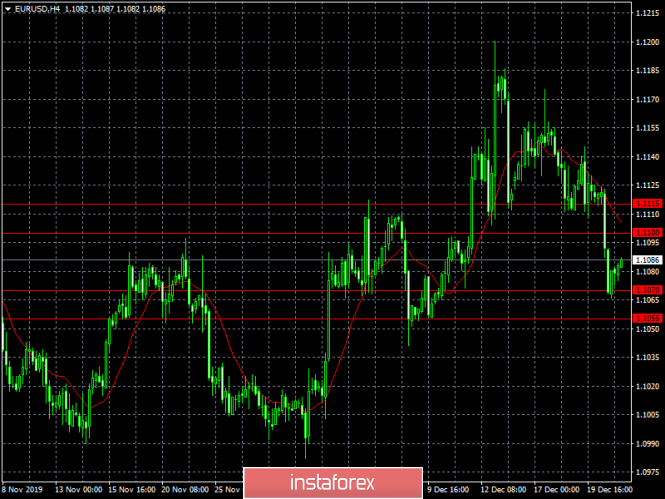
On December 20, the EUR/USD pair performed a fall under the correction level of 50.0% (1.1080), however, today it performed a reversal in favor of the European currency and began the process of growth in the direction of the correction level of 61.8% (1.1104). Emerging divergences are not observed today in any indicator, but I am still waiting for the resumption of the process of falling quotes of the pair. At the same time, now this will require a signal about the completion of the pullback up, for example, the rebound of the euro-dollar pair from the Fibo level of 61.8%. This week, there will be an extremely small number of economic reports. The holidays begin, so I expect a drop in traders' activity. Last Friday's economic reports showed once again that America is doing well. After the Fed cut rates three times, the US economy is again showing growth and acceleration. The latest data on GDP, personal income and spending of Americans, as well as indices of spending on personal consumption, showed that the US population continues to spend, spends in sufficient quantity, incomes are growing, and GDP is at a good level. Thus, the growth of the US dollar on Friday was expected, given the information background. Another thing is political news, which either fortunately or unfortunately does not particularly affect the movement of the pair. However, they can start to affect at any time. I have already talked about the whole situation around the impeachment of Donald Trump, as well as the very personality of the US President. Given his way of doing business, it is not surprising that charges are brought against him, constant conflicts and scandals are connected with his name, both with the political forces of his own country and with the governments of other countries. For example, the Speaker of the House of Representatives Nancy Pelosi, whom Trump has repeatedly openly called "crazy". Although Donald Trump considers himself innocent of everything he is accused of, his defiant behavior further incites opposition political forces in the United States against him. The Democratic Party, which initiated the whole procedure of impeachment, will now play this medium-sized trump card with great care and caution, realizing that there may not be a second chance. Democrats are well aware that it makes no sense to refer the case to the Senate, in which 53 senators are Republicans. At least in its current form and right now. Thus, the Democrats delay the process and formally have the right to delay it as much as necessary. It works against trump's time. Trump needs to resolve as quickly as possible all the political, foreign economic differences in which he embroiled the country during his presidency. Otherwise, he may be disappointed in the 2020 election. Democrats can now search as much as they want for new evidence of Trump's guilt, new witnesses, new information. The only chance to unseat Trump from his post is to find indisputable evidence of his guilt. If this is not possible, it is necessary to lower his political ratings and popularity among the population as low as possible so that he could not be re-elected for a second term. Forecast for EUR/USD and trading recommendations: On December 23, traders will try to continue the fall of the euro-dollar pair, although the latest events related to the American President are beginning to openly alarm. Too much negativity is associated with the name of Trump. Nevertheless, economic data in America remain at a high level, which supports the demand for the US currency. I recommend today to wait for the completion of the pullback up and resume selling the pair with the targes of 1.1057 and 1.1030. The Fibo grid is based on the extremes of October 21, 2019, and November 29, 2019. The material has been provided by InstaForex Company - www.instaforex.com |
| GBP/USD. December 23. Paradoxical Prime Minister, paradoxical Brexit Posted: 23 Dec 2019 02:29 AM PST GBP/USD - 4H.
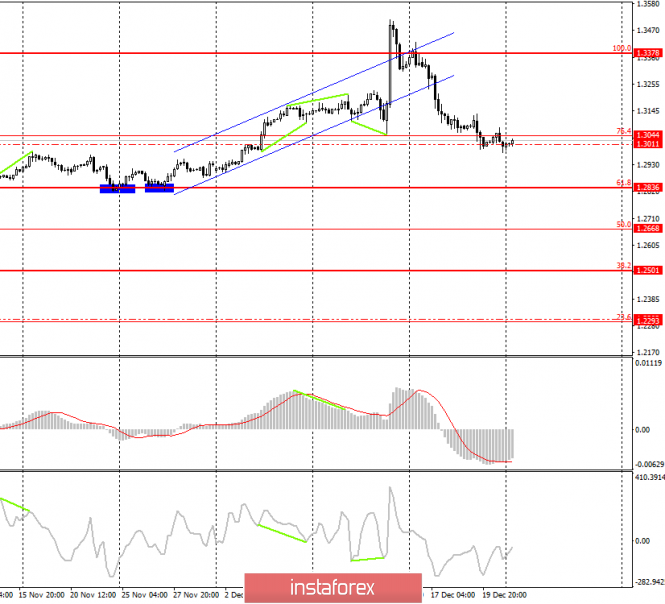
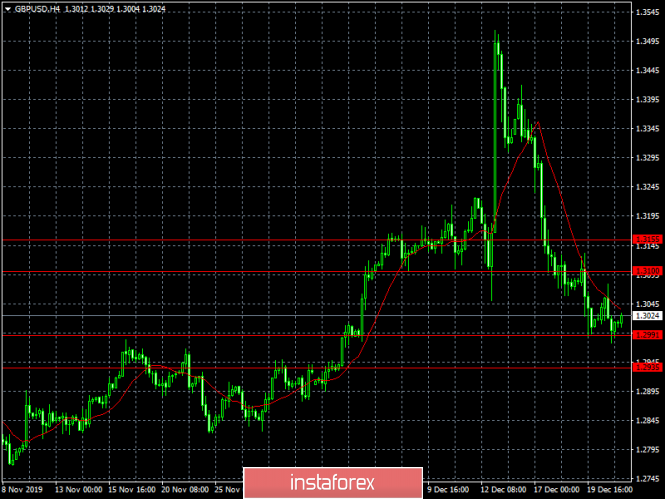
On December 23, the GBP/USD pair performed a consolidation under the Fibo level of 76.4% (1.3044) and continues to work in the range just below this level. Thus, the process of falling quotes of the pair can be resumed at any time, as traders failed to gain a foothold above the correction level. Thus, it is not recommended to count on the growth of the British pound before the closing of the pair above the Fibo level of 76.4%. There is no indicator of emerging divergences today, and the information background is now the main factor in the fall of the British currency. In the UK, third-quarter GDP was released on Friday, and for all the visible positives (higher gains than traders expected), I still can't say that the UK economy is "getting off its knees." The negative impact of the three-year series called "Brexit" will continue, as the UK since the 2016 referendum is the most paradoxical country with an equally paradoxical government, which, moreover, is also quite often changing. Let's go through the main points that only add uncertainty to the overall picture of things and that can cause a strong drop in demand for the pound in the future: In recent months, the government still wanted to complete Brexit (consider the period after Boris Johnson came to power). The new prime minister immediately indicated a desire to leave the EU without an agreement and immediately came under a barrage of criticism with parliament rejecting his no-deal Brexit proposal three times. Johnson made concessions, negotiated a deal with Brussels that many experts said was even worse than Theresa May's deal, which parliament also rejected three times. Boris Johnson's new agreement was also rejected by most deputies. As a result, new elections, a new parliament, which miraculously approves the deal of Boris Johnson, which had been rejected three times before, and Boris Johnson himself immediately declares that the transition period will not be extended, which means a very short time for any negotiations with the European Union just on those agreements that make it possible to call Boris Johnson's Brexit with deal. That is, if there are no agreements, then Brexit can be called no deal, and, accordingly, we have come to what Boris Johnson's rule began with. The Prime Minister, of course, said that he would make every effort to prevent a no-deal Brexit, but most traders and experts are already well aware that Boris Johnson does not always keep promises and at the same time he does not disdain from various not quite honest techniques to achieve goals. Many experts point out that in about a year, it is impossible to agree on such a huge agreement, which will determine the relationship between London and Brussels for many years and decades. Thus, now there is nothing to prevent Johnson from openly blackmailing the European Union with an exit without agreements. If the EU does not make concessions, then Brexit will be a no-deal, which Johnson does not fear and which will deal a crushing blow to the country's economy. Demand for the pound, in this case, will fall to the level of "below the plinth". Forecast for GBP/USD and trading recommendations: The pound-dollar pair is trying to continue the process of falling and only in the case of consolidation above the correction level of 76.4% can take a pause for a while and roll back up a little. However, I do not expect a strong upward pullback, and the current location of the price relative to the level of 76.4% allows selling the pound-dollar pair with a target of 1.2836. I do not recommend buying a "Briton" soon. The Fibo grid is based on the extremes of March 13, 2019, and September 3, 2019. The material has been provided by InstaForex Company - www.instaforex.com |
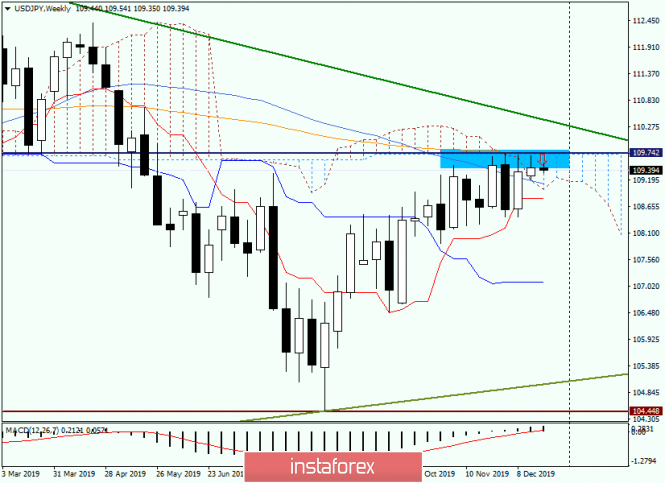
| Analysis and trading recommendations for USD/JPY for December 23 Posted: 23 Dec 2019 02:29 AM PST Hello! Last week was rather uncertain. Against some major currencies, the US dollar showed strengthening, while it weakened against others The Japanese yen was one of the three major currencies against which the US dollar rose at the trading on December 16-20. About what it gives in the future, and talk in today's review of USD/JPY. Weekly
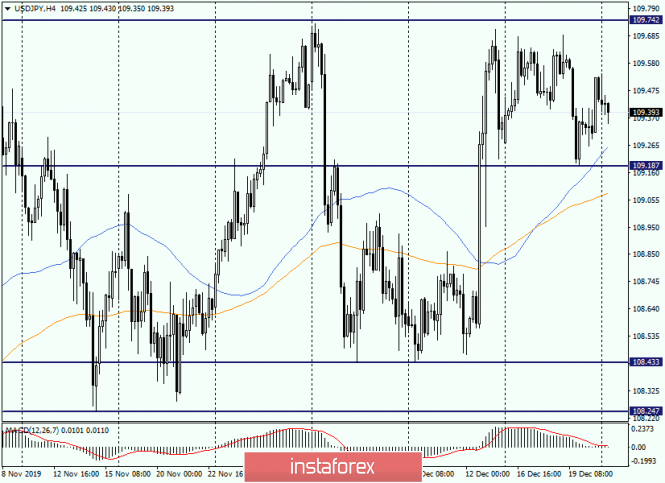
Although the dollar/yen pair has grown at the last five-day trading, there are big questions about its further ability to move up. And here's why. First, the highs of the previous trades (109.68) were lower than the previous ones, at 109.70. Secondly, the nondescript bullish body with the closing price within the Ichimoku indicator cloud indicates the bulls' problems on USD/JPY to continue the rate rise. And one more important point. The closing price of the previous week was within the Ichimoku cloud and under the 144 exponential moving average. In my opinion, this is an important point that shows the limitations of the potential growth and the high probability that the bears will have control over the pair in the starting week. If this assumption is correct and the market chooses a bearish scenario, the targets of the expected decline will be: 109.00 (50 MA), 108.90 (lower cloud boundary) and the Tenkan line at 108.81. In the case of a deeper version of the downward scenario, the dollar/yen will fall to the key support near 108.43, where the further fate of the asset will be decided. Daily
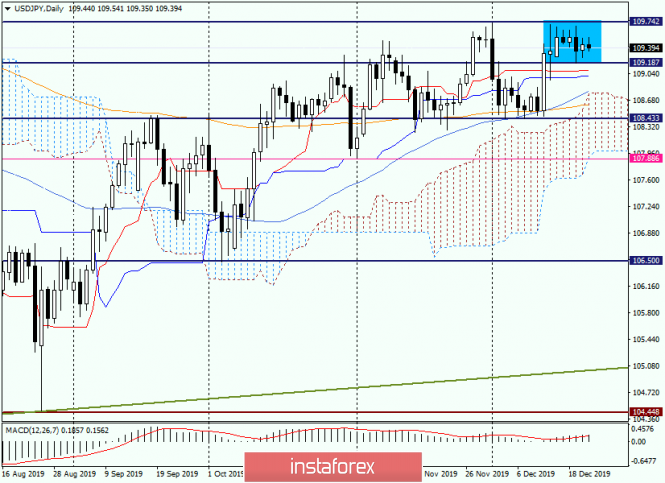
On the daily chart, consolidation, which is observed in the price zone of 109.74-109.20, leaves more questions than answers. In this case, after the consolidation is completed, there are options for moving in both directions. And yet, since the weekly timeframe is older, and the signals there are stronger, I expect a decline in the USD/JPY rate to the area of 109.09-109.00, where the Tenkan and Kijun lines of the Ichimoku indicator pass, respectively. The further target of the bears on the pair is the mark of 108.80, where the 55 simple moving average passes. If you consider that a little lower lies the upper boundary of the Ichimoku cloud and 144 EMA, the area of 108.80-108.65, anyone can consider opening long positions. I am more inclined to a bearish scenario and USD/JPY sales. Let's look at potential entry points for opening sales on a smaller time frame. H4
There is an uncertain situation. By and large, recently the pair has been trading in a rather narrow price range of 109.18-109.74. It can be assumed that the direction in which the price will leave the designated range will largely depend on its further direction. Now on trading ideas. As I wrote above, a candlestick signal on the weekly timeframe makes a bearish scenario more likely. But the bulls also didn't slurp their cabbage soup and would surely try to resume raising the course. If this happens and there will be a reversal (on the decline) of the candlestick analysis model in the area of 109.60-109.80, sell with the nearest goals in the area of 109.25-109.00. If bullish signals appear in this area, given that this is a support area, buy with targets in the area of 109.60-109.80. This is the current trading plan for the USD/JPY currency pair. However, I would like to note that the situation can change at any time, and, accordingly, the technical picture of this currency pair will look different. In this regard, I would like to emphasize that this week I will return to USD/JPY and, taking into account possible changes, I will correct trading ideas for this instrument. Good luck and profitable trades! The material has been provided by InstaForex Company - www.instaforex.com |
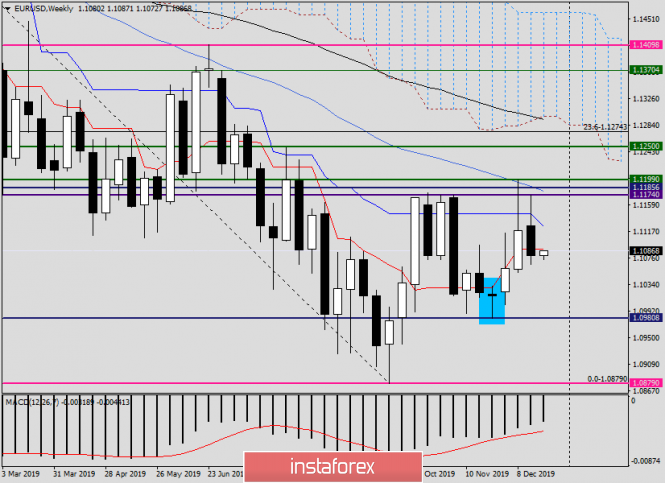
| Analysis and forecast for EUR/USD for December 23, 2019 Posted: 23 Dec 2019 02:29 AM PST Hello, dear colleagues! At the end of last week, the US dollar traded differently against its main competitors. In particular, the main currency pair EUR/USD ended trading on December 16-20 with losses, which is not surprising. If you remember, the euro/dollar review of a week ago, to a greater extent, assumed a downward scenario. That's exactly what happened. Weekly
The main reason for the decline of the pair was the previous white candle with a huge upper shadow. Usually, such large upper shadows, which are larger than the body itself, show the inability of the market to continue the upward movement and signal its completion. This is followed by a reversal of the correction or change of trend. The current moment was no exception. What's next? Perhaps this is the main question that interests everyone. Given that the last five-day trading ended under the Kijun and Tenkan lines of the Ichimoku indicator, it is quite possible to expect the continuation of the downward dynamics. Let me remind you that the closing prices of the week and the day say a lot, especially about the weekly closing price. As I shared my opinion earlier, the weekly timeframe, in my opinion, is the strongest in terms of signals, to which, of course, the closing price of the last candle also applies. It is characteristic that the week closed not only below the important mark of 1.1100 but also under the already well-known technical level of 1.1080. Let 1 point lower, but lower! And this is a factor to be reckoned with. So, on the "week", the resistance is represented by the Tenkan (1.1090) and Kijun (1.1125) lines of the Ichimoku indicator. A 50-simple moving average, which runs at 1.1180, is ready to provide resistance above. Immediate support is the last week's lows at 1.1066, if updated, the road will open to the levels of 1.1053, 1.1003 and, possibly, to the key support level of 1.0981. These are the immediate goals and benchmarks on the weekly chart. We are going further. We go further. Daily
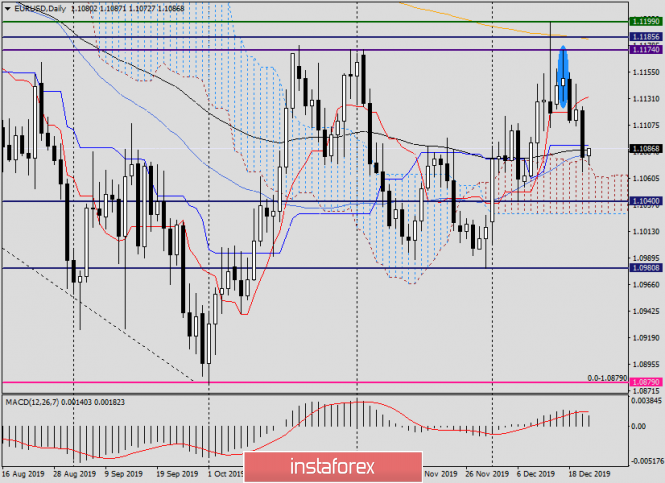
In this timeframe, the pair fell into a strong and extremely important support zone of 1.1090-1.1074. As you can see, the bears are trying to lower the quote within the Ichimoku cloud, but the bulls have other plans. At the time of writing, the pair has found support in the designated area and shows intentions to recover to the previous decline. Now, 89 EMA (black) and Kijun line (1.1090) can provide the nearest resistance to growth attempts. However, the current resistance is provided by the 50-simple moving average, which is located at 1.1082. In my personal opinion, only the passage of 50 MA, 89 EMA, and Kijun, with the closure of at least one candle (or better, three in a row) above 1.1090, will indicate the ability of the quote to further strengthen. If the rate falls within the Ichimoku cloud and it is fixed, we can expect a decline to its lower border, which passes near 1.1030. If we sum up the consideration of the daily chart, the situation is still uncertain. It is necessary to wait and see how the next few days will close relative to the designated landmarks. H4
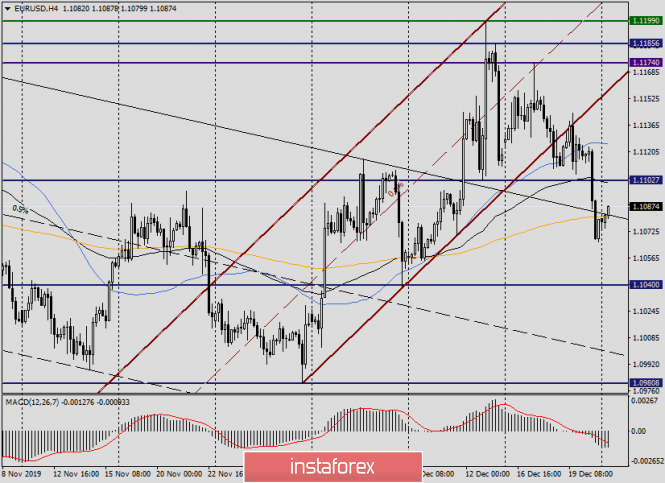
The price is trying to return above the strong 233 exponential moving average, which is right at the moment of completion of this review. If the current 4-hour candle closes above 233 EMAs, we can expect a continued rollback to the area of 1.1100-1.1125, where there are 89 EMAs, a strong technical level of 1.1100 and 50 MA. The most relevant trading idea at the moment is sales from the selected area. Those wishing to buy the euro, I recommend looking at the strong technical zone of 1.1045-1.1000 and, when bullish candlestick analysis patterns appear there, consider opening long positions. That's all for now, tomorrow we will continue to consider the main currency pair, and, perhaps, taking into account today's trading, the picture will take a clearer shape. At the moment, in the personal opinion of the author, the main trading idea is selling EUR/USD. Good luck! The material has been provided by InstaForex Company - www.instaforex.com |
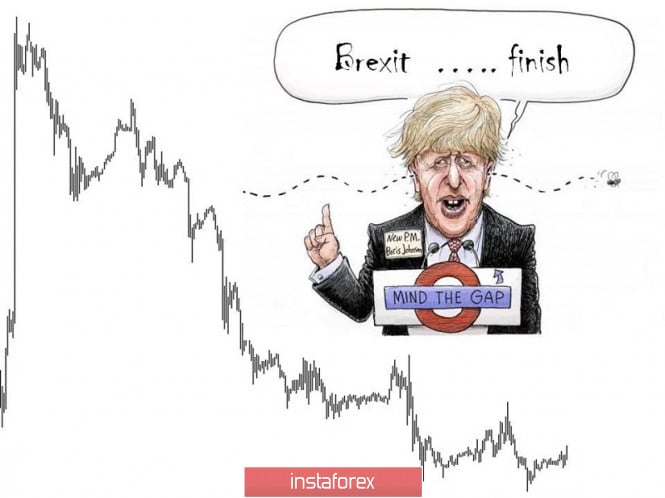
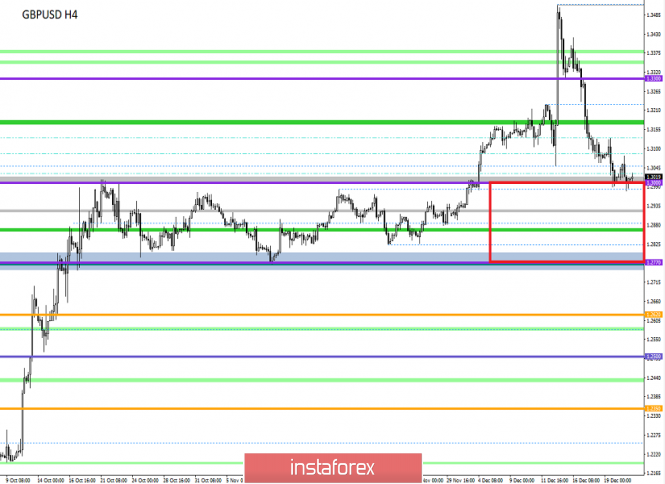
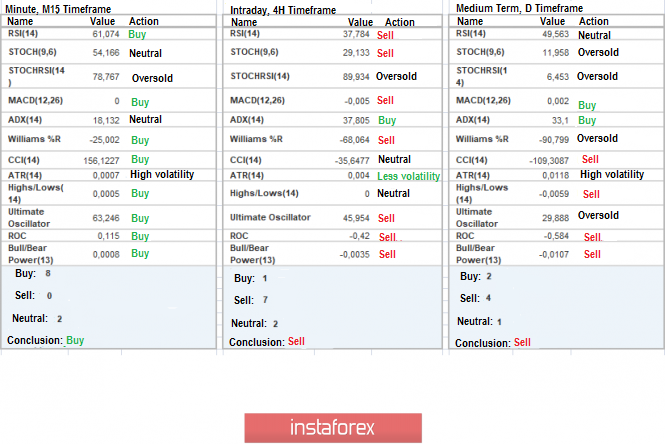
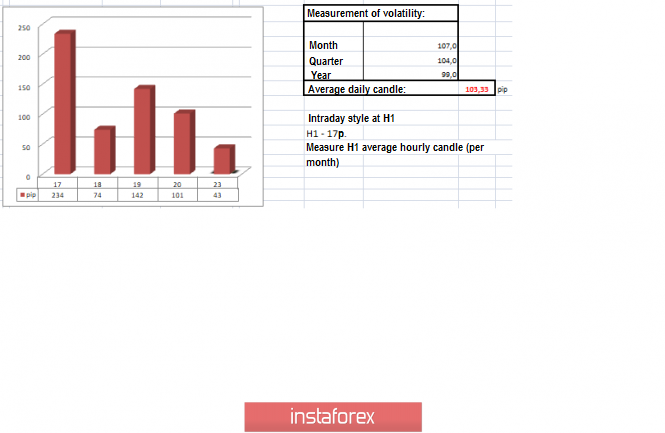
| Trading recommendations for the GBP/USD currency pair - placement of trading orders (December 23) Posted: 23 Dec 2019 02:02 AM PST From the point of view of comprehensive technical analysis, we see that after the quote reached the psychological level of 1.3000 on Thursday [December 4], there was a significant slowdown, forming a horizontal oscillation with an amendment of 50-90 points. Looking at the past week as a whole, we can see that the downward movement received more than 500 points, a complete development of all previously available upward momentum. It turns out that no matter how strong the emotional background is, the market still returned to the same limits where it all began, at the long-playing flat of 1.2770/1.3000, increasing the probability of a further decline of the quote more than ever. However, it is worth considering that the rapid downward movement, which we saw earlier, can in some way slow down its activity, which will directly affect the volatility. If we are talking about market activity [volatility], it is worth mentioning that since the beginning of December, we have an average of 120 points from low to high, a certainly high value, and a long hold that can lead to a decline in activity. In turn, the emotional component of the market can not escape from the speculative trap, and perhaps a return to the framework of 1.2770/1.3000 will change the mood of market participants. Analyzing the hourly chart on Friday, we see a kind of clock part correction -- > impulse, and only the support as it was in terms of the psychological level of 1.3000, remains. In turn, the dynamics of the market included a number of impulse candles in the time interval 17: 00-23: 00 [time on the trading terminal], which took over all the volatility of the day with 101 points. As discussed in the previous review, many traders fixed their short positions as soon as the quote got close to the psychological mark of 1.3000. The next steps were in terms of waiting for the price fixing lower than 1,2990-1,2980, which did not happen. Looking at the trading schedule generally [the day period], we can see that the incentive to resume the downward movement certainly exists in the market, however, it could not yet be on the scale. Meanwhile, the 2019 V-formation continues to develop at its peak. Friday's news contained the final data on the GDP of Britain, where the previous figures revised for the worse 1.3% - - - >1.2%. The current ones, on the contrary, came out better than the forecast 1.0% - - - >1.0%. The United States posted a similar GDP figure for the third quarter, which recorded a slowdown in economic growth from 2.3% to 2.1%. The market reaction to the statistics was initially in favor of the pound, however, the day ended with its decline. In terms of background information, we had the most welcome event for brexiteers. The UK Parliament still approved the bill on the country's withdrawal from the European Union, as 358 deputies voted in favor of the document, against 234. As Prime Minister Boris Johnson said- " WE did it!". Now, Britain has to finally adopt the law on withdrawal until January 31, and after that, there will be a transition period, however, it was reduced to a year, which did not suit very many. With this, the opposition fears that the tight deadlines will not allow to implement all the plans, and England might get an inappropriate deal. "Negotiations on trade agreements of the European Union with Canada, the United States, or with anyone lasted for 14-15 years. And Boris Johnson wants to sign a full-scale Treaty in 11 months," the opposition said. The market reaction to such a large-scale event was almost absent for the reason that even before the vote, everyone knew that the new Parliament under the auspices of Johnson would vote to approve the document. Today, in terms of the economic calendar, we only have orders for durable US goods, which, according to expectations, should grow by 1.1%, and can locally support the dollar. Further development Analyzing the current trading chart, we see that the psychological level of 1.3000 still plays a role as a fulcrum, putting pressure on the quote. In fact, the horizontal movement along the control level is still maintained, but the market activity is not so great. Detailing the minute-by-minute portion of time, we see that the day began with a consolidation of about 10 points of amplitude, followed by a small spike into the market of Europeans at the time of entry, followed by stagnation. Volatility at this time, as well as the potential of speculators, is small. In turn, traders are still hoping for a further descent, where they consider their positions as soon as the quote manages to fix below the area of 1,2990/1,2980. Speculators do not waste time and work on a local rebound from the level. All in all, we can assume that a kind of chatter within the level of 1.3000 will still remain in the market, where the main values will be 1.2980/1.3090. Based on the information above, we san derive these trading recommendations: -Consider buy positions in case of price fixing higher than 1.3090. - Sell positions in case of price fixing below 1.2980. Indicator analysis Analyzing the different sectors of the timeframes (TF), we can see that the indicators are mostly directed downward, which can not be said about short-term segments that produce multidirectional signals against the background of stagnation. Volatility for the week / Measurement of volatility: Month; Quarter; Year The measurement of volatility reflects the average daily fluctuation, calculated for the Month / Quarter / Year. (December 23 was built taking into account the time of publication of the article) The volatility of the current time is 43 points, which is still small. Acceleration is still likely possible but so far within the average, unless the quote will not be able to break through the psychological level. Key level Resistance zones: 1,3180**; 1,3300**; 1,3600; 1,3850; 1,4000***; 1,4350**. Support areas: 1,3000; 1,2885*; 1,2770**; 1,2700*; 1,2620; 1,2580*; 1,2500**; 1,2350**; 1,2205(+/- 10p.)*; 1,2150**; 1,2000***; 1,1700; 1,1475**. * Periodic level ** Range level ***Psychological level **** The article is based on the principle of conducting transactions, with daily adjustment The material has been provided by InstaForex Company - www.instaforex.com |
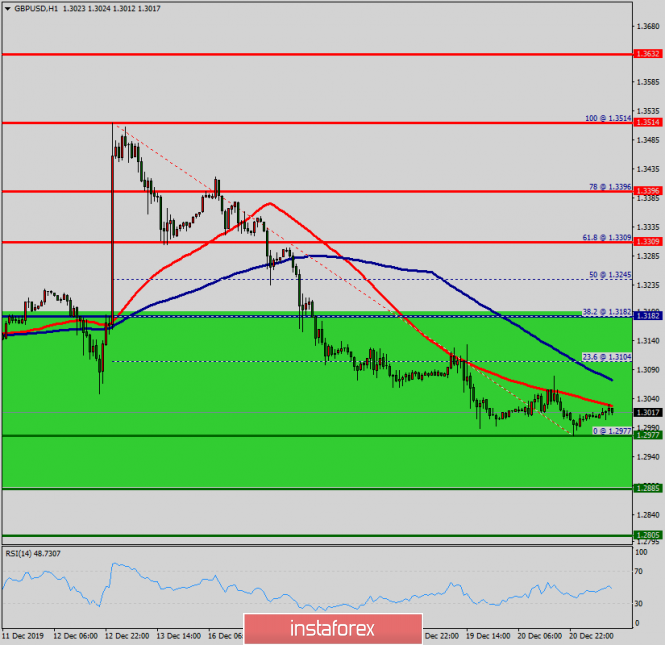
| Technical analysis of GBP/USD for December 23, 2019 Posted: 23 Dec 2019 01:48 AM PST Overview: Piar: GBP/USD. Due to the upcoming Christmas and New Year's holidays, the trading working hours of many major financial centers will have changed, which affected the trading of the GBP/USD pair notably, because the market was not stable and the trend was not clear. Consequently, the market will probably start showing the signs of tight sideway range on December 23, 2019. Thus, the GBP/USD pair will be restricted by the levels of 1.2885 and 1.3182. The trend of GBP/USD pair movement was controversial as it took place in a narrow sideways channel, the market showed signs of instability. Also, it should be noticed that yesterday, the market moved from its bottom at 1.2977 and continued to rise towards the top of 1.3014. Today, in the one-hour chart, the current rise will remain within a framework of correction. The Relative Strength Index (RSI) is considered overbought because it is above 30. The RSI is still signaling that the trend is upward as it is still strong if breaks the moving average (100). This suggests the pair will probably go up in coming hours. So it is of the foresight to pay attention to this area. Therefore, try to buy at a lower price around the weekly support level at the price of 1.2977 with a first target of 1.3100 and it willl climb towards 1.3182. Trading recommendations: According to the previous events of GBP/USD pair in the Forex market, the price has still been moving between the level of 1.2977 and the 1.3182 level. Therefore, it will be advantageous to buy above 1.2977 with a first target 1.3100. It may resume to 1.3182 iin order to test the weekly pivot point. On the other hand, stop loss should always be in account. For that, it will be of wholesome to set the stop loss below the support 2 at the price of 1.2805. The material has been provided by InstaForex Company - www.instaforex.com |
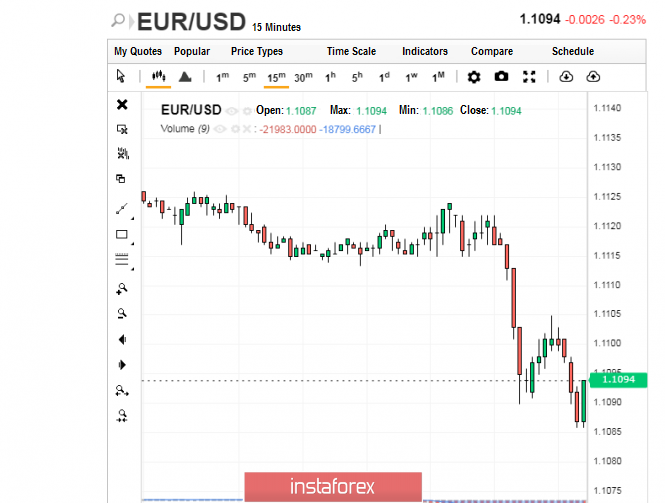
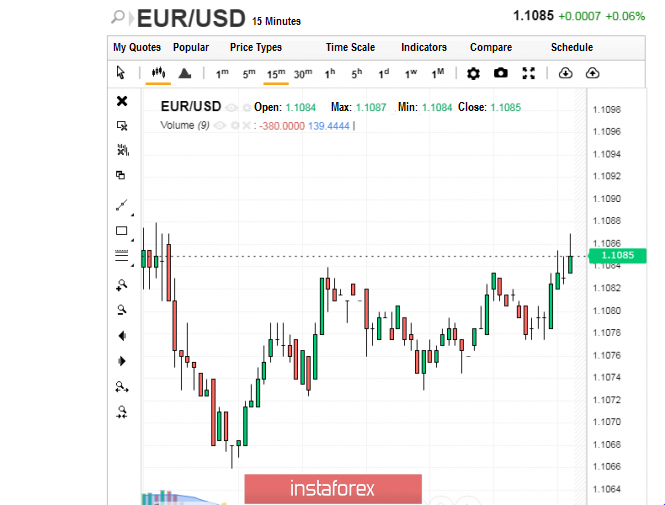
| EUR/USD holiday mood: forward to slowdown Posted: 23 Dec 2019 12:42 AM PST According to the observations of most analysts, the US and European currencies tend to slow down and even stagnate on New Year's Eve and Christmas holidays. Experts do not expect a rapid growth of trading, although a lull in the markets is also not expected. For the European currency, the end of last week was marked by a slowdown and subsequent decline. Supported by the absence of signs of recession in the US economy, the dollar increased and took charge, even though a few months ago, the inversion of the yield curve indicated the opposite. Analysts say that in the third quarter of 2019, GDP rose by 2.1%, and just last month, other key indicators also increased: consumer spending-by 0.4%, and income-by 0.5%. This month, experts recorded a rise in the consumer sentiment index from the previous 96.8 to 99.3 points. The dollar ignored other minor troubles. A positive factor for the dollar was the steady growth of the leading US index S&P 500. Note that it rises for the sixth session in a row, not tired to update historical highs. Experts believe that the reasons for this is the strong macro-statistical data in the United States, the expectation of signing an agreement between Washington and Beijing, and the reduction of duties on a number of food products by China. The recent rally of the pound played a significant role in the strengthening of the dollar and the growth of US indices. Thanks to this, the euro was able to strengthen its positions, which were slightly shaken. Experts have recorded a decrease in liquidity in the EUR / USD pair on the eve of the holidays. At the end of last week, the EUR / USD pair formed a sluggish upward movement, which continued at the beginning of the coming week. Last Friday, the tandem traded in the range of 1.1093–1.1094, seeking to go up, but the attempts were unsuccessful. On Monday morning, December 23, EUR/USD started at 1.1085, and tried to move further. However, these efforts did not lead to anything. The tandem "tramples" on the spot, trying to go beyond the current price range. According to analysts, the EUR/USD pair tried to confirm the upward trend at the end of last week, but attempts were unsuccessful. The pair was strongly distanced from the psychologically important level of 1.1200, which experts believe to be difficult to catch up now. Many experts believe that the dollar has become a risky currency recently. This was facilitated by a 30% rally in the US stock market, capital inflows, and a positive reaction to the good news regarding the US-China talks. At the same time, the euro is also undergoing radical changes, gradually turning into an asset-refuge. The reasons for this, analysts believe, are the reduction of volatility in the markets, the build-up of cheap liquidity from the ECB, and ultra-soft monetary policy of the European regulator. Experts believe that the euro will be supported by the uncertainty existing in the market next year. At the same time, the dollar will continue to occupy a leading position. In addition, according to experts, the current low-active state of the European and American currencies at any time can be replaced by a rapid jerk and cheer up the market. However, the pre-holiday mood is not conducive to such achievements, and although analysts do not expect surprises from the EUR / USD pair, the market is still wary. The material has been provided by InstaForex Company - www.instaforex.com |
| Trader's Diary: EURUSD on 12/23/2019, Market condition Posted: 23 Dec 2019 12:41 AM PST
Above is the EURUSD daily chart. So, the active part of the year is coming to an end as on Wednesday Christmas will come and active trading operations will end before the New Year which is on January 1-2. The market will be very thin and only then will the active trading begins. The main news is postponed to January and the issue with Brexit will probably be resolved by January 31 as the election results in Britain gave Prime Minister Johnson an opportunity. Furthermore, the Trump Trade Agreement with China has a chance of being signed. The remaining questions are already in the New Year. Thus, it remains to look at the technical picture: EURUSD: Market conditions. As you can see on the chart, the level of 1.1200 turned out to be an insurmountable obstacle on the way up and this fact is strengthened by the fact that the previous resistance on the way up for the euro was almost at the same level which is at 1.1180 by the second half of October. At the level of 1.1200, a full-fledged level will be formed not of the daily, but the weekly order during the closing of the current week. However, support from below 1.0980 is even stronger. And in addition, there is a daily order level below 1.1040. This creates a very tight range between the opposite upper and lower weekly as levels are only 200 points. This potentially leads to a very strong movement after the breakout. Let me remind you, we keep purchases from 1.1035 and stop at 1.1035. However, in case of a downward movement from 1.1035, we resort to sale (a coup). The material has been provided by InstaForex Company - www.instaforex.com |
| Fist-waving tomato seller, EUR / USD and GBP / USD review on December 23 Posted: 23 Dec 2019 12:41 AM PST Imagine that you went to the market to buy tomatoes, and you see a merchant offering just the most common tomatoes, which are good and fresh tomatoes. You start to take a closer look at them and then another trader runs up to you selling exactly the same tomatoes but are packed in vacuum packaging, and are two times more expensive than the first one. And then it begins to beat you, constantly shouting that you can't even look at the tomatoes of other sellers. That is what the United States does. Washington is not only ready to impose sanctions on European companies participating in the construction of Nord Stream 2, but even include this item in the Pentagon's budget. That is opposition to the construction of a gas pipeline, which will significantly reduce the cost of gas for Germany and German industry, transferred to the military plane. Moreover, the threats are so serious that they include the seizure of property of companies in the United States and the ban on transactions in dollars. And the threats had their effect, since the Swiss company Allseas, which is just engaged in laying the pipe, not only suspended the work, but even took its ships from the area where the construction work is being carried out. The German authorities have already expressed their protest against the actions of the United States, calling them gross interference in the internal affairs of Europe as well as damaging German business. Russia said that the actions of the United States are aimed at weakening European business, undermining its ability to compete with American companies. True, adding that it will be able to independently complete the construction of the gas pipeline, without fear of any sanctions, as already imposed by them. In any case, the growth of confrontation in this direction has seriously hit the positions of the single European currency, as investors are well aware that this is a blow to German business, which is the main beneficiary of Nord Stream 2. But still, a rather curious question arises, " What will the United States do if Russia really completes the gas pipeline on its own? and Will sanctions be imposed on companies buying gas supplied through Nord Stream 2? Nevertheless, so far we have just the panic weakening of the single European currency, which clearly demonstrates against whom all these sanctions are directed.
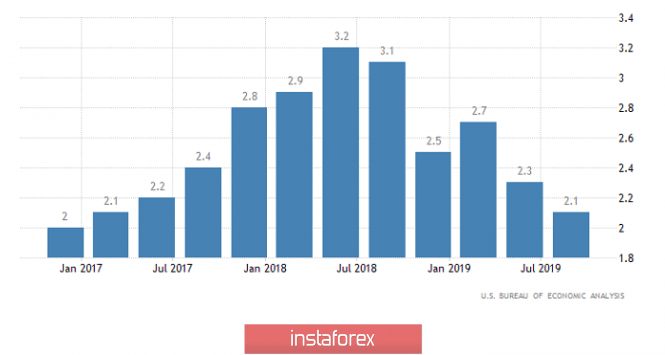
At the same time, there was no reason for the growth of the dollar, except for political hysteria, since the final data on the US GDP for the third quarter finally confirmed the fact of a slowdown in economic growth from 2.3% to 2.1%. So American statistics clearly do not give reasons for optimism. GDP growth rate (United States):
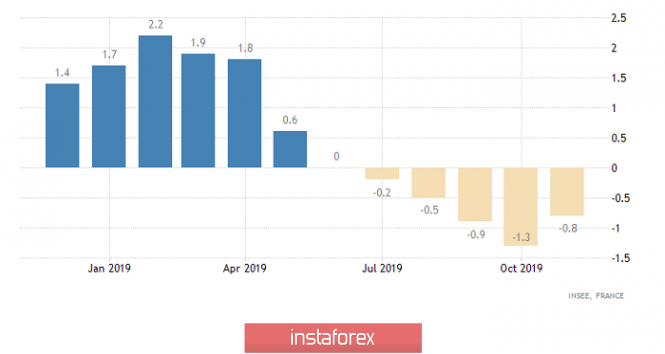
On the other hand, European statistics are not particularly encouraging. Thus, the decline in producer prices in France slowed down from -1.3% to -0.9%. Of course, there is a certain improvement in the situation, but this is still a decline in producer prices. In Italy, however, the decline in producer prices slowed down from -2.9% to -2.5%. So there is some positive dynamics, but the picture is not too joyful.
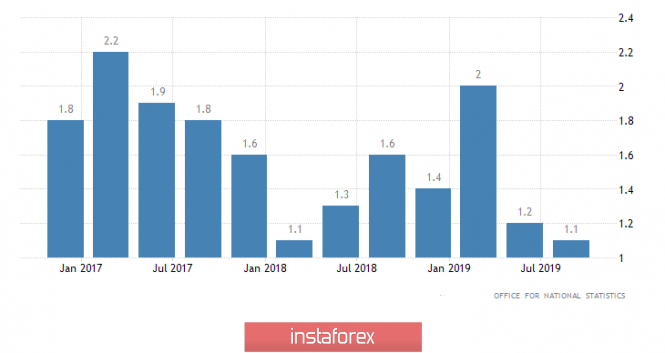
The situation is not the best in the UK, where the final GDP data turned out to be better than forecasts since they showed a slowdown in economic growth not to 1.0%, but to 1.1%. However, the previous results were reviewed for the worse, with 1.3% to 1.2%. So, in the United Kingdom, there is a clear slowdown in economic dynamics, which turned out to be enough for the pound to hold on to its positions. GDP growth rate (UK):
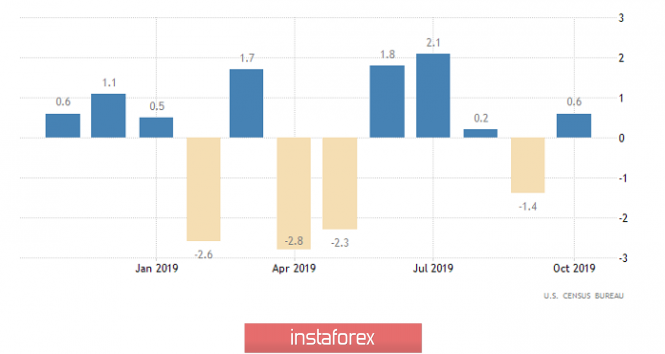
A lull begins on the market today, which apparently was happening the entire week and that is because Europe is resting. On the other hand, in the United States, there will be both weekends and shortened working days and no important macroeconomic data will be published. Only data on home sales in the primary market, as well as orders for durable goods, in particular, are published today. Of course, the data is interesting but in the current circumstances of universal preparation for the holidays, they will not produce such a serious effect. So, home sales in the primary should increase by 0.5%. Orders for durable goods may increase by 1.1%. So, in a good way, the dollar has a reason for slight growth. Durable Goods Orders (United States):
The single European currency, of course, is very impressed by the actions of the United States. However, Washington is unlikely able to completely stop the gas pipeline in which the German business and the German government are extremely interested. Another thing is that today's macroeconomic statistics from the United States rather favors the dollar. In other words, taking both of these factors into account will lead to the stabilization of the single European currency at the level of 1.1075.
Over the past few days, the pound has already fallen in price, so it needs to adjust slightly. Although there is no particular reason for this, so it will consolidate around 1.3000.
|
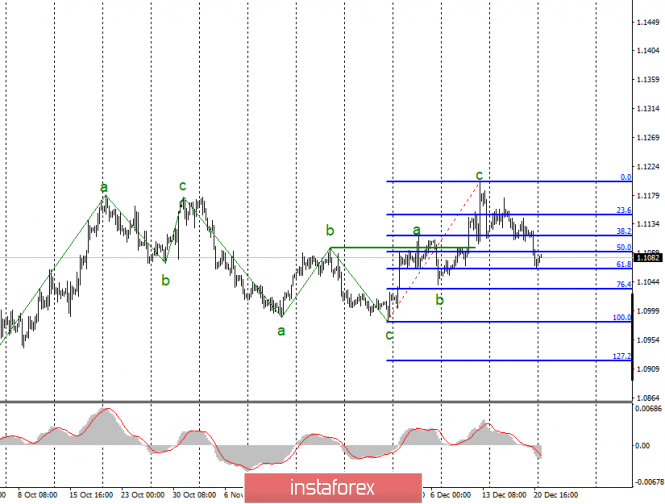
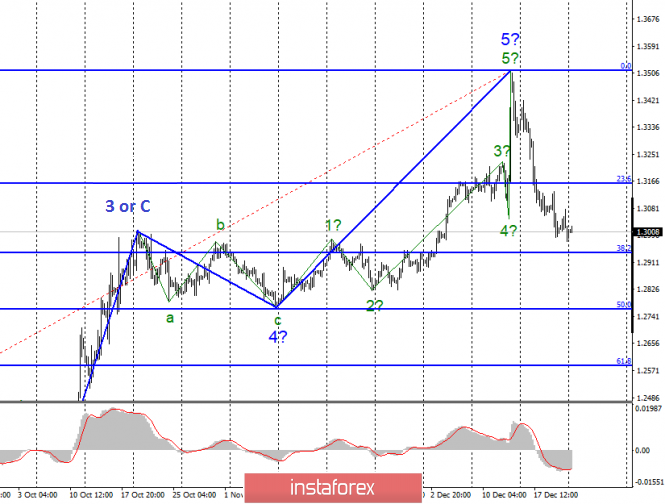
| Analysis of EUR / USD and GBP / USD for December 23 Posted: 23 Dec 2019 12:22 AM PST EUR / USD On December 20, the EUR / USD pair completed with a decrease of 45 basis points, thus, it continued to build a bearish wave presumably at 1 or a, as part of a new downtrend. If this is true, then the decline in the quotes will continue with targets located around 1.0981, which equates to 100.0% Fibonacci. At this stage, I expect to build another three-wave wave structure. If the news background is favorable to the dollar, then the entire wave markup can take on a more complex and extended look. Fundamental component: The news background for the Euro-Dollar instrument on Friday was very interesting. In America, a third-quarter GDP report was released, which indicated a 2.1% year-on-year increase in the main indicator. This is a very worthy value, which indicates the excellent condition of the economy at this time. Other, less important reports also supported the American currency. For example, the personal expenses of the American population in November grew by 0.4% mom, which is higher than a month earlier, and personal income grew immediately by 0.5%, although a month earlier the growth was 0%. In addition, the University of Michigan consumer confidence index was also higher than forecast at 99.3, reflecting increased consumer confidence in the economy and a desire to spend money rather than save it. Of course this has a positive effect on the general state of the US economy. Thus, the dollar's rise on Friday was due to positive statistics. There will be much less news this week, which in principle is not surprising, since Christmas week has begun, and then immediately after which the New Year will follow. Thus, a small amount of news and falling activity of the currency market are absolutely normal aspects for this period of the year. Today in America there will be a report on orders for durable goods, which are distinguished by their high cost, and therefore have a strong impact on the country economy. Markets expect the main indicator to grow by 1.9% in November and if the forecast comes true, this will contribute to a further increase in the US currency as Christmas week begins and immediately after which New Year's will follow. Thus General conclusions and recommendations: The Euro-Dollar pair allegedly completed the construction of the upward trend section. Thus, I would recommend selling the instrument with targets located near the levels of 1.1034 and 1.0982, which corresponds to 76.4% and 100.0% Fibonacci. An unsuccessful attempt to break through the 61.8% level may lead to quotes moving away from the lows reached, after which I still expect a new fall of the instrument. GBP / USD The GBP / USD pair did not lose or gain a single base point on December 20. During the day, quotes of the pair went up 80 points, but by the end of the day returned to their original positions. Thus, the alleged first wave of a new bearish trend continues its construction. An unsuccessful attempt to break the 1.2940 mark, which corresponds to 38.2% Fibonacci, will indicate the completion of this wave and the market's readiness to build wave 2 or b . Based on the current wave markings, the prospects for the pound are only bearish. Fundamental component: The news background for the GBP / USD instrument on Friday was extremely important. By and large, only one event of the day attracted all the attention of the traders and this is a vote in the British Parliament on a deal between Boris Johnson and the European Union. Earlier, on its previous composition, the Parliament rejected various versions of the agreement with the EU at least 6 times. In order to successfully carry out his own version of the agreement, Boris Johnson held early parliamentary elections and won a resounding victory, which allowed him to gain the required number of votes on December 20. Parliament approved the deal with the EU, however by January 31, Britain will leave the EU while formally remaining for almost a year in the bloc. After January 31, a transitional period will begin, designed to reduce the negative impact on the economies of the EU and Britain from an immediate and instant gap. General conclusions and recommendations: The Pound / Dollar tool continues to build a new downtrend. I recommend continuing to sell the instrument with targets near 1.2943, which roughly corresponds to the 38.2% Fibonacci level. An unsuccessful attempt to break through the 38.2% level will lead to the construction of a correctional upward wave. The material has been provided by InstaForex Company - www.instaforex.com |
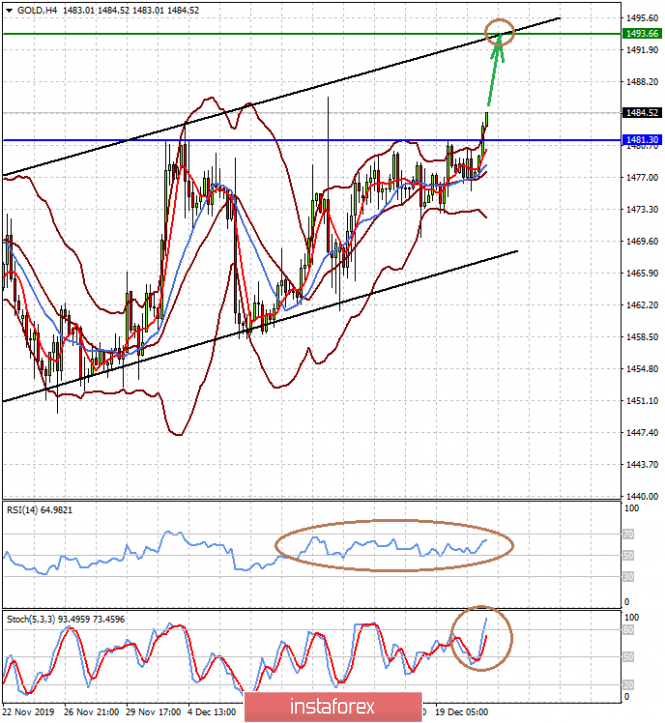
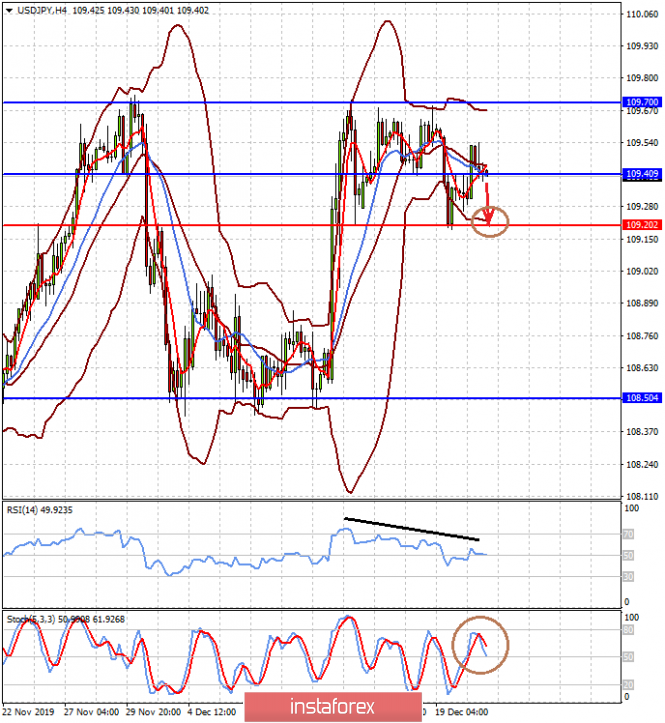
| Posted: 23 Dec 2019 12:04 AM PST The Christmas week begins with the decline of Chinese stock indexes, an increased demand for protective assets, and weakening crude oil prices. At the same time, the US dollar remains under pressure, in the wake of extremely low activity in the currency markets. All this is accompanied by the traditional low volumes for the end of December, which allows short-term speculators to accelerate the value of assets in the right direction for them. With regards to the dynamics of the value of protective assets, we note that the continuing interest, despite the announcement of the signing of the first part of the new trade agreement between Washington and Beijing, is due on one hand, to the lack of details on this transaction as they remain secret, and on the other, the time they still have before its signing, as D. Trump stated that it will be released next month. In our opinion, there is another reason for this behavior. There is a high risk of the deal being canceled if the American President thinks that something is going wrong again. Taught by the bitter experience, investors are clearly in no hurry to reconsider their view of the situation in the markets. In addition, the apparent weakness of the US currency is monitored, and the reason for which was the December meeting of the fed, which stated that there are no prospects for both raising rates and lowering them in the United States next year. The regulator made it clear that it will not change rates either way, however, it became clear that the Bank will resort to adding liquidity to America's financial system. Although the Fed doesn't call it a quantitative easing program, it has all its signs. In this case, the growth of the dollar supply affects its rate, but at the same time, there is a stimulation of purchases of shares on the local stock market, extremely necessary for Trump during the active election campaign for the presidency that begins next year . We expect that today, the general trends that developed in the markets by the end of last week will continue. Forecast of the day: Gold prices are rising in the wake of low volumes due to the advent of Christmas week and the lack of details on the trade deal between America and China. The price is above the level of 1481.30, allowing it to make an attempt to grow to 1493.65, the upper limit of the short-term upward trend. The price of the asset is pushed up by the expected expiration of "gold" futures contracts on December 25. The USD / JPY pair is also declining in the wake of uncertainty about the content of the trade deal between Washington and Beijing. Overcoming the price mark of 109.40 may be the basis for its fall to 109.20.
|
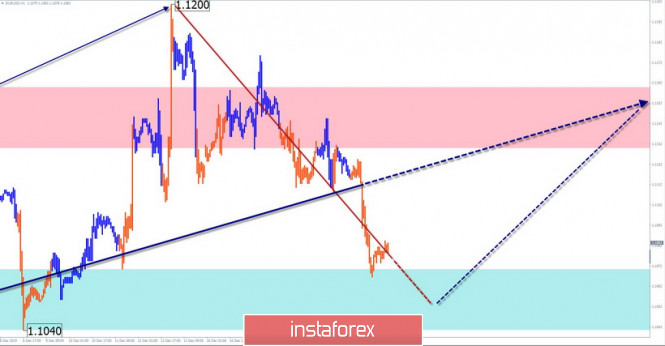
| Simplified wave analysis of EUR/USD, AUD/USD and GBP/JPY for December 23 Posted: 22 Dec 2019 11:58 PM PST EUR/USD Analysis: All movements of the European currency chart in recent months do not go beyond the upward wave of September 3. The depreciation of December 13 forms an internal correction in the last section (C). The price reached the lower limit of the next support. Forecast: The current support zone has a high chance to become a reversal level for the price chart. In the first half of the day, there may be pressure on the zone, with a puncture of the lower border. The beginning of price growth is more likely at the end of the day. Potential reversal zones Resistance: - 1.1130/1.1160 Support: - 1.1070/1.1040 Recommendations: In the euro market today, trading is possible only within the day. Sales can be risky. It is recommended that the main attention be paid to the pair's purchases.
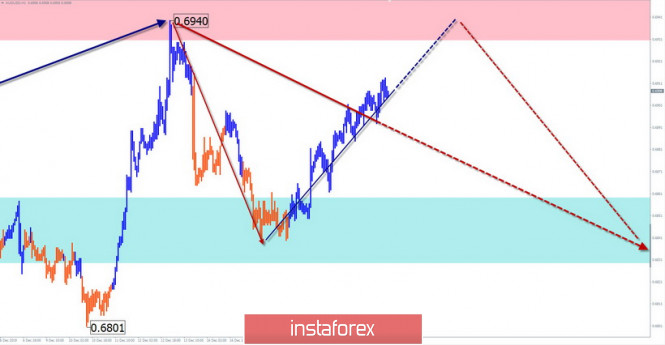
AUD/USD Analysis: A downward wave has been forming on the Australian dollar chart since September 12. Its structure looks like a rising pennant, but it lacks the final part. The small-scale bearish wave that began on December 13 has a reversal potential. Forecast: In the structure of the wave, conditions were full for a final dash down. In the coming day, it is expected to complete the rise of the last days, the formation of a reversal and the beginning of the course of the price down. As it develops, the downward phase can take the form of an impulse. Potential reversal zones Resistance: - 0.6230/0.6260 Support: - 0.6860/0.6830 Recommendations: Purchases of "Aussie" are possible today, but it is necessary to take into account the small expected scope of the move up. It is recommended that the main attention be given to the search for instrument selling signals.
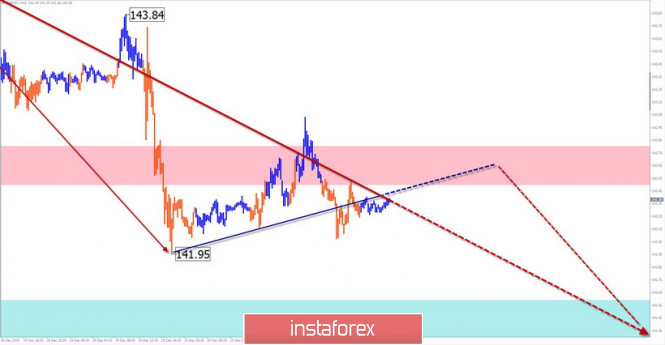
GBP/JPY Analysis: The direction of the short-term trend of the cross since August is set by an upward wave. On the daily scale of the chart, this section completes the larger model, which allows you to wait for further growth of the course. Since December 13, the price is reduced. Forecast: The bearish movement has a reversal potential. This indicates a high probability of complications of the current correction. Today, we can expect the continuation of the downward mood of the movement, with a preliminary attempt to pressure the resistance zone at the turn. Potential reversal zones Resistance: - 142.50/142.80 Support: - 141.60/141.30 Recommendations: Pair's purchases are premature, it is necessary to wait for the completion of the current decline. In the coming day, the main focus of trade should be paid to the pair's sales.
Explanations: In the simplified wave analysis (UVA), waves consist of 3 parts (A-B-C). The last incomplete wave is analyzed. The solid background of the arrows shows the formed structure for determining the expected movement. Attention: The wave algorithm does not take into account the duration of the tool movements in time! The material has been provided by InstaForex Company - www.instaforex.com |
| You are subscribed to email updates from Forex analysis review. To stop receiving these emails, you may unsubscribe now. | Email delivery powered by Google |
| Google, 1600 Amphitheatre Parkway, Mountain View, CA 94043, United States | |


No comments:
Post a Comment