Forex analysis review |
- BTC 12.27.2019 - Downward target reached at $7.075, watch for downside opportunities at $7.270
- EUR/USD for December 27,2019 - Major multi pivot resistance on the test at 1.1175
- USD Index analysis for 12.27.2019 - Strong downside pressure, downward target set at the price of $96.34
- December 27, 2019 : GBP/USD Intraday technical analysis and trade recommendations.
- December 27, 2019 : EUR/USD Intraday technical analysis and trade recommendations.
- EUR/USD. December 27. Trading idea for a breakout/rebound from the level of 1.1148
- GBP/USD. December 27. The pound shows growth potential at 1.3137, 1.3209 and 1.3281
- Evening review for EURUSD for 12/27/2019
- CAD - contender to update the lows of the year
- New Year's Eve fall of the US dollar
- Analysis and forecast for NZD/USD as of December 27, 2019
- Ichimoku cloud indicator short-term analysis of Gold for December 27, 2019
- The bounce in EURUSD comes at no surprise
- Short-term Elliott wave analysis on GBPUSD
- Analysis and forecast for USD/CHF as of December 27, 2019
- Analysis of EUR/USD and GBP/USD for December 27. Euro and pound unexpectedly rushed up, while maintaining the potential for
- New year's Eve USD rally
- Trading recommendations for GBP/USD on December 27
- Technical analysis of USD/CHF for December 27, 2019
- Trader's Diary: EURUSD on 12/27/2019, The main problem of trading
- Technical analysis recommendations for EUR/USD and GBP/USD on December 27
- Technical analysis of ETH/USD for 27/12/2019:
- Technical analysis of BTC/USD for 27/12/2019:
- Overview of the GBP/USD pair as of December 27. The pound is adjusted and is waiting for New Year's indices of business activity
- Technical analysis of GBP/USD for 27/12/2019:
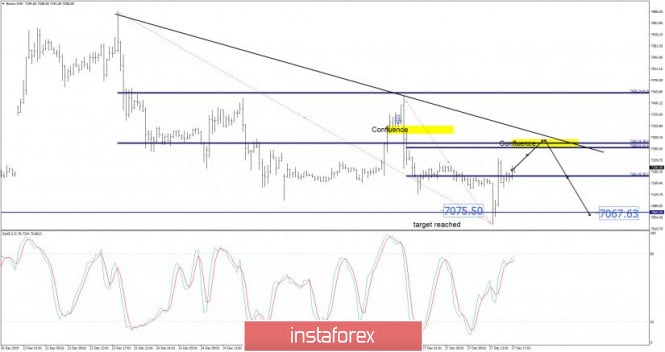
| BTC 12.27.2019 - Downward target reached at $7.075, watch for downside opportunities at $7.270 Posted: 27 Dec 2019 07:48 AM PST Bitcoin has been trading downward and reached my yesterday's target at the price of $7.075. I still expect more downside on the BTC but is good to wait for potential test of multi Fibonacci resistance at $7.270 to place sell order.
The target is set again at $7.067... Stochastic oscillator is looking overbought but you should watch for fresh new bear cross before the next sell position. Yellow rectangle – Important Fibonacci confluence and supply trendline Watch for selling opportunities on the rallies... The material has been provided by InstaForex Company - www.instaforex.com |
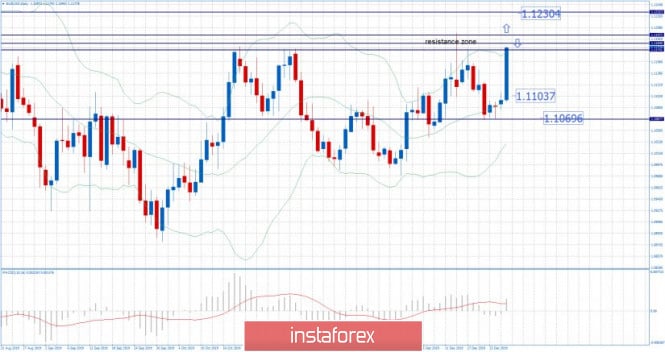
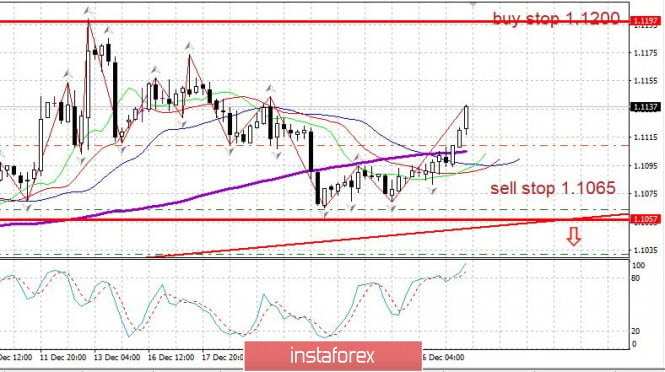
| EUR/USD for December 27,2019 - Major multi pivot resistance on the test at 1.1175 Posted: 27 Dec 2019 07:42 AM PST EUR/USD got the strong upside momentum today and clean upward trend. Due to strong trend today I do expect next few days potential consolidation and lower volatility.
EUR is on the decision level around 1.1175 and you should watch for potential price action around this very important resistance zone To open long position you will need the price to break the level of 1.1200 for the potential test of 1.1230-1.1275 To open short position you will need any reversal pattern near the resistance at 1.1175, which may confirm further rotation to the downside and eventual test of 1.1100-1.1070. The material has been provided by InstaForex Company - www.instaforex.com |
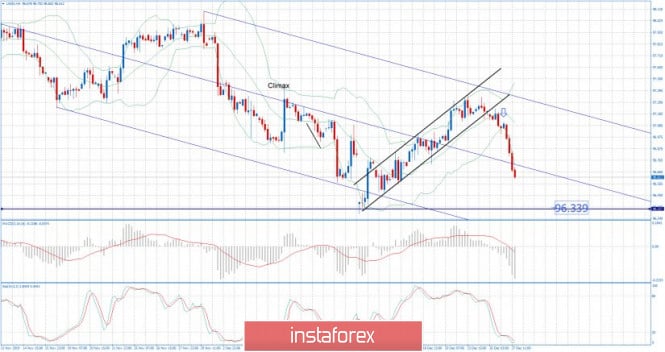
| Posted: 27 Dec 2019 07:31 AM PST USD index traded downside, exactly what I forecasted yesterday. The USD index reached the level of $96.60. After the clean downside breakout of the upward channel, the sellers took control over the buyers. Our main target is still set at the price of $96.30.
MACD oscillator is showing new momentum down and the slow line is sloping to the downside. Resistance level is seen at the price of $97.00 Intraday support is seen at $96.33 The material has been provided by InstaForex Company - www.instaforex.com |
| December 27, 2019 : GBP/USD Intraday technical analysis and trade recommendations. Posted: 27 Dec 2019 07:17 AM PST
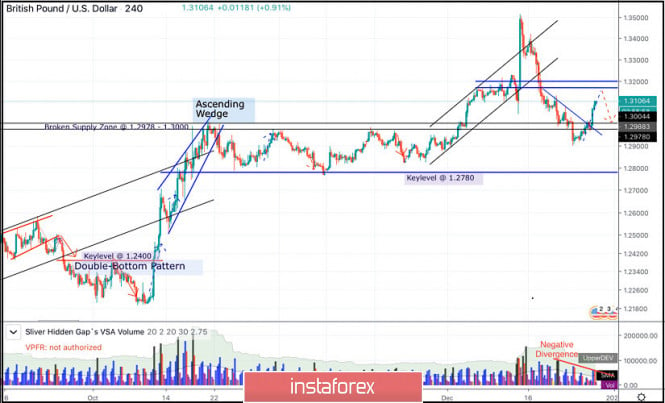
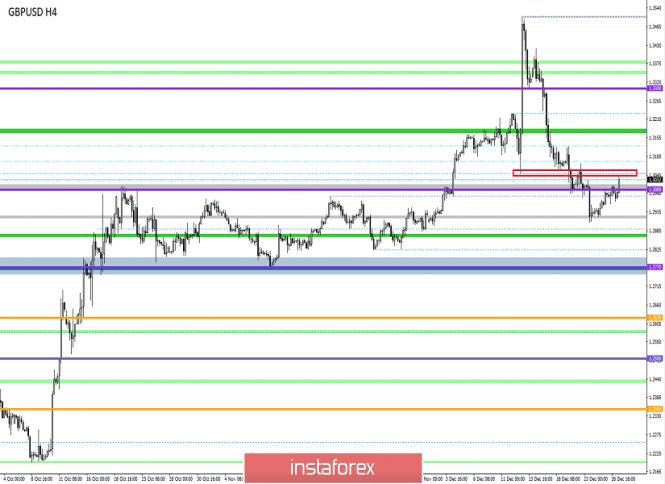
In the period between October 17 to December 4, the GBP/USD pair has been trapped between the price levels of 1.2780 and 1.3000 until December 4 when bullish breakout above 1.3000 was achieved. Moreover, a newly-established short-term bullish channel was initiated on the chart. The GBPUSD has recently exceeded the upper limit of the depicted bullish channel on its way towards 1.3500 where the pair looked quite overpriced. This was followed by successive bearish-engulfing H4 candlesticks which brought the pair back towards 1.3170 quickly. Further bearish decline was pursued towards 1.3000 which got broken to the downside as well. Technical short-term outlook turned into bearish since bearish persistence below 1.3000 was established on the H4 chart. Hence, further bearish decline was expected towards 1.2840 - 1.2800. However, earlier signs of bullish recovery manifested around 1.2900 denoted high probability of bullish breakout to be expected. Intraday technical outlook turned into bullish after the GBP/USD has failed to maintain bearish persistence below the newly-established downtrend line. That's why, bullish breakout above 1.3000 was anticipated. Thus, allowing the current Intraday bullish pullback to pursue towards 1.3190-1.3200 where bearish rejection and another bearish swing can be watched by conservative traders. Bearish reversal scenario around 1.3200 is supported by the recent negative divergence as depicted on the chart. The material has been provided by InstaForex Company - www.instaforex.com |
| December 27, 2019 : EUR/USD Intraday technical analysis and trade recommendations. Posted: 27 Dec 2019 06:35 AM PST
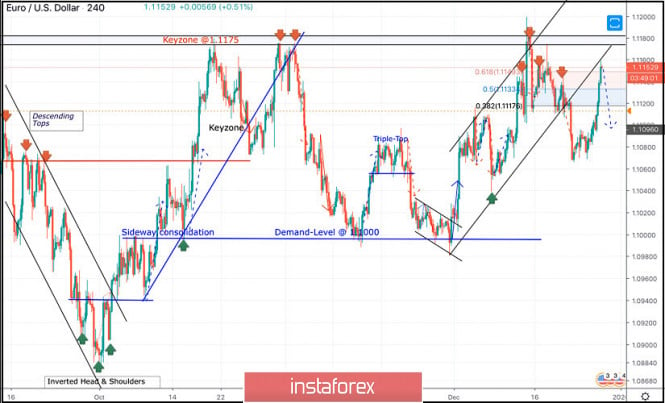
Since November 14, the price levels around 1.1000 has been standing as a significant DEMAND-Level which has been offering adequate bullish SUPPORT for the pair on two successive occasions. Shortly-after, the EUR/USD pair has been trapped within a narrower consolidation range between the price levels of 1.1000 and 1.1085-1.1100 (where a cluster of supply levels and a Triple-Top pattern were located) until December 11. On December 11, another bullish swing was initiated around 1.1040 allowing recent bullish breakout above 1.1110 to pursue towards 1.1175 within the depicted newly-established bullish channel. Intraday bearish rejection was expected around the price levels of (1.1175). Quick bearish decline was demonstrated towards 1.1115 (Intraday Key-level) which got broken to the downside as well. On December 20, bearish breakout of the depicted short-term channel was executed. Thus, further bearish decline was demonstrated towards 1.1065 where significant bullish recovery has originated. The current bullish pullback towards 1.1150 (Backside of the broken channel) should be watched for bearish rejection and another valid SELL entry. On the other hand, bearish breakout below 1.1115 is mandatory to allow next bearish target to be reached around 1.1010. Trade recommendations : Conservative traders should wait for bearish rejection signs around the current price levels (1.1150) as a valid SELL signal. Bearish projection target to be located around 1.1115, 1.1090 and 1.1060. S/L should be placed above 1.1175. The material has been provided by InstaForex Company - www.instaforex.com |
| EUR/USD. December 27. Trading idea for a breakout/rebound from the level of 1.1148 Posted: 27 Dec 2019 06:07 AM PST EUR/USD - 4H.
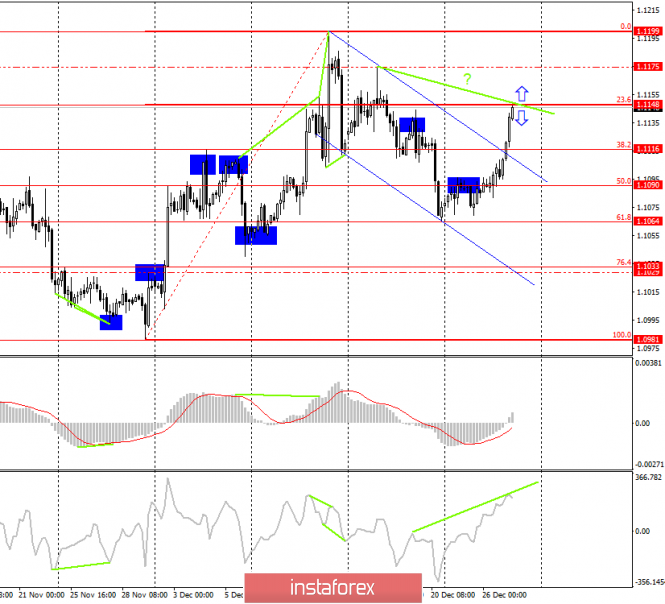
On December 26, the EUR/USD pair resumed the growth process in the direction of the correction level of 23.6% (1.1148) after fixing the quotes above the downward trend corridor and the correction level of 38.2% (1.1116). At the moment, the pair's rate has reached 1.1148, and now two options are possible. The rebound of quotes from this level will work in favor of the US currency and resume the process of falling. Closing above the Fibo level of 23.6% will increase the probability of further growth towards the next correction level of 0.0% (1.1199) and the intermediate level - the peak of 1.1175. At the same time, a bearish divergence is brewing for the CCI indicator, which is visible from the current chart. Bearish divergence significantly increases the probability of rebound from the Fibo level of 23.6%. Thus, given the empty information background, today and early next week, when trading the EUR/USD pair, you can rely on the level of 23.6%. Forecast EUR/USD and trading recommendations: The trading idea is to sell the pair at the rebound of quotes on the current or next candle with the targets of 1.1116 and 1.1090. The downside is buying when closing above 1.1148 with targets of 1.1175 and 1.1199. On December 27, traders will try to resume selling the pair, as near the level of 1.1200 with a high probability of the upward trend is completed. At the same time, the breakout of the level of 1.1148 will allow traders to earn another 25-50 points. The Fibo grid is based on the extremes of November 29, 2019, and December 13, 2019. The material has been provided by InstaForex Company - www.instaforex.com |
| GBP/USD. December 27. The pound shows growth potential at 1.3137, 1.3209 and 1.3281 Posted: 27 Dec 2019 06:07 AM PST GBP/USD - 4H.
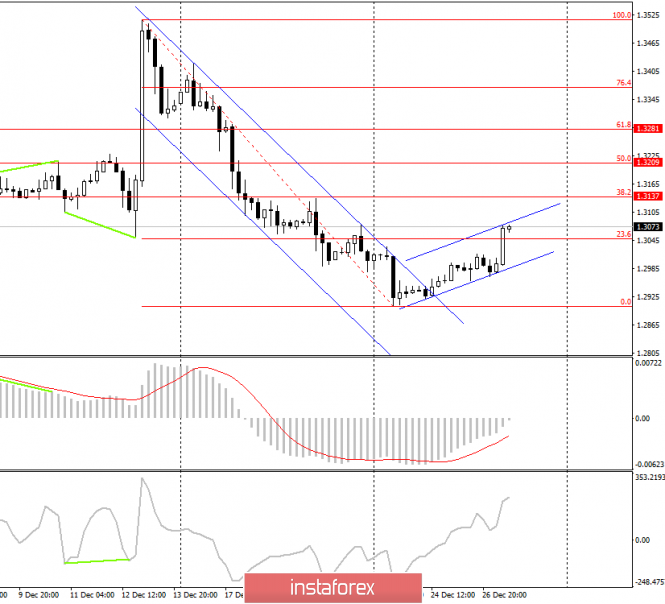
On December 26, the GBP/USD pair performed a consolidation over the downward trend corridor, within which the quotes performed a drop of more than 500 points. Now we have a new corridor - an upward one, which predicts corrective growth with the most popular corrective targets - 38.2% and 50.0% and 61.8%. Thus, I consider the possibility of growth of quotes with the targets of 1.3137, 1.3209, and 1.3281. Today, the divergence is not observed in any indicator. Closing over the ascending corridor will only strengthen the "bullish" mood of traders. The current trading plan will be canceled if the quotes are closed under the upward trend corridor. It may take several days for traders to reach the area of 1.3209-1.3281. Forecast GBP/USD and trading recommendations: Thus, the trading idea is to buy the British currency with the above goals. You can place Take Profit orders near each level. But I would not recommend selling a pair yet since there is still an upward corridor. Therefore, I recommend that you wait for the pair to exit through its lower border before getting rid of the British currency. The pound-dollar pair will continue the growth process on December 27. At least this is what the graphic picture of the pair says. Traders tuned in to buy after a week and a half of non-stop falling. I recommend buying the pound with the targets of 1.3137 and 1.3209 (next) and do not recommend selling the pair yet. The Fibo grid is based on the extremes of March 13, 2019, and September 3, 2019. The material has been provided by InstaForex Company - www.instaforex.com |
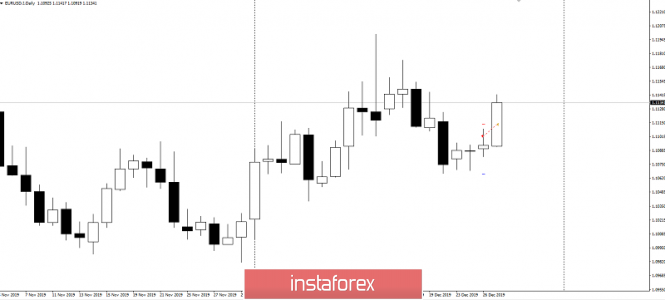
| Evening review for EURUSD for 12/27/2019 Posted: 27 Dec 2019 06:07 AM PST
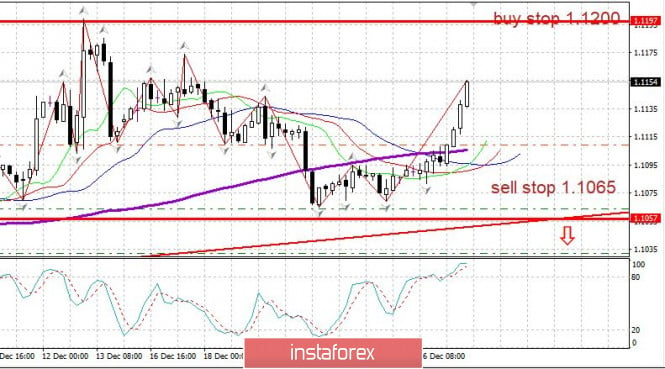
The euro shows strong growth on the first full trading day after Christmas. Such a growth of the euro last showed almost a month ago, on December 2. The value of today increases as it is the closing of the week. The next important point is the level of 1.1200. If the euro manages to gain a foothold above 1.1200 - this will be a signal for the upward trend. We keep purchases from 1.1035 - purchases from 1.1100 also make sense to keep. We look at the closing of the day. The material has been provided by InstaForex Company - www.instaforex.com |
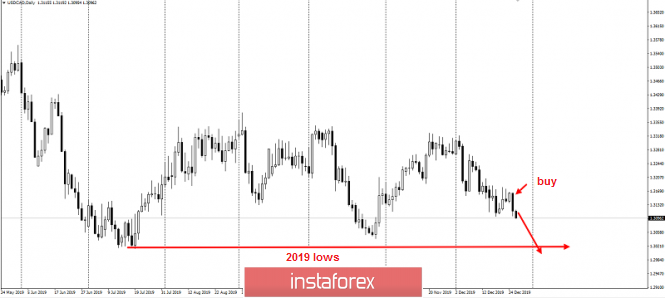
| CAD - contender to update the lows of the year Posted: 27 Dec 2019 02:52 AM PST Good day, dear traders! The weakening of the US dollar occurs in all currencies almost simultaneously. It looks especially bright through gold which goes up without any pullbacks. To ride this trend, you have to choose other tools. Fore me, I chose those that have clearer goals from the point of view of the "hunt for footsteps" system. My attention is drawn today to the USD/CAD pair, which has recently shown a good downward trend. Many of you will say that the latest data from Canada were not very impressive, but it should be noted that the US dollar is weakening much stronger than the Canadian dollar, swallowing all the Canadian negative: The USD/CAD pair has a very good and round goal at the level of 1.3, which is also the minimum of the year. The good thing is: we are in close proximity to it! Only 1000p for 5 digits is remaining, and then it will be broken! Can you imagine how much long-term buyers' stops are worth? I propose to work on a decline, target 1.3, and close the profit at the breakdown of this level with a daily candle. The potential movement from the current prices is 1000p for 5 digits. With a rollback, the prices will be more profitable. Good luck in trading and control the risks! The material has been provided by InstaForex Company - www.instaforex.com |
| New Year's Eve fall of the US dollar Posted: 27 Dec 2019 02:51 AM PST EUR/USD - neutral USD/JPY - neutral USD/CAD - on the slide to an update to 1.3 AUD/CAD - for an increase of 0.92 AUD/NZD - set purchase grid GOLD - to increase at the breakdown of 1519 The material has been provided by InstaForex Company - www.instaforex.com |
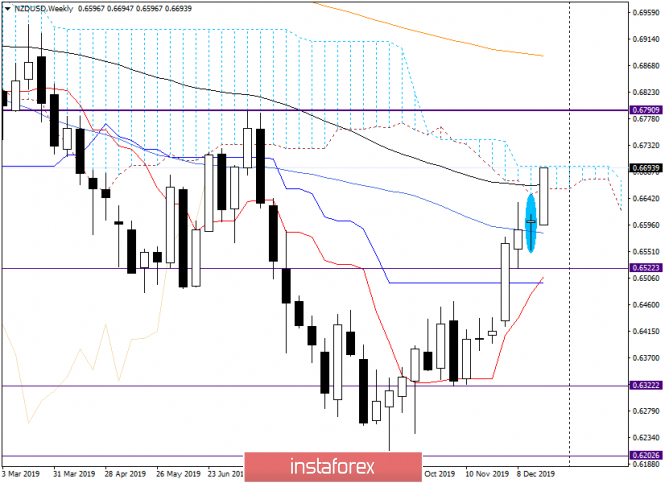
| Analysis and forecast for NZD/USD as of December 27, 2019 Posted: 27 Dec 2019 02:49 AM PST Once again, welcome dear traders! Well, Friday and the thin Christmas market give reason to consider tools that don't often come into view. One of these, in my opinion, is the currency pair NZD/USD, where events are developing very interesting. As has been repeatedly noted, the imminent conclusion of the first phase of the trade deal between the US and China gives reason for optimism to market participants. In this regard, there is a growing appetite for risky assets, one of which is the New Zealand dollar. In general, it should be noted that all commodity currencies show a serious strengthening against the US dollar, but in this article, we will consider the New Zealand currency and its prospects. Weekly
So, after the appearance of the Doji candle with a longer lower shadow last week, the further prospects for the price movement of the NZD/USD pair could be characterized as uncertain. I would not be at all surprised if the current five-day trading would see a drop in the rate. However, the market decided otherwise, and we see a very strong upward momentum. The pair not only entered the limits of the Ichimoku indicator cloud and broke through the 89 exponential moving average, but also shows its readiness to go up from the cloud with all its attitude. If this happens and the trading closes higher, the prospects for further strengthening will only increase. In this case, we can expect the growth towards the important and strong price zone of 0.6790-0.6800. In my opinion, this is where the further fate of the asset will be decided. At the moment, we expect the final closing price of weekly trading and the ability of the pair to go up from the Ichimoku cloud. Daily
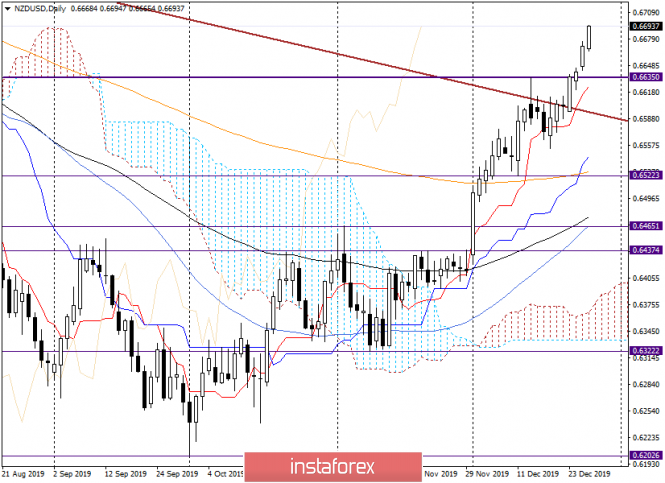
In this timeframe, the growth of the "New Zealander" is observed even more clearly. However, I would like to note right away that purchasing on highs is not the best solution. Corrective rollbacks have not been canceled, and after such rapid growth, the chances of them only increase. However, the corresponding signals of the Japanese candlesticks for a decrease have not yet been observed. It seems that the best option for opening positions is to wait for a corrective pullback to the price zone of 0.6635-0.6620 and buy "kiwi" from there. But the appearance of a reversal candle can signal such a rollback. In this case, those who wish can try to sell the pair, but so far only in the hope of correction. At this point, bullish sentiment is extremely strong, and this needs to be taken into account. H4
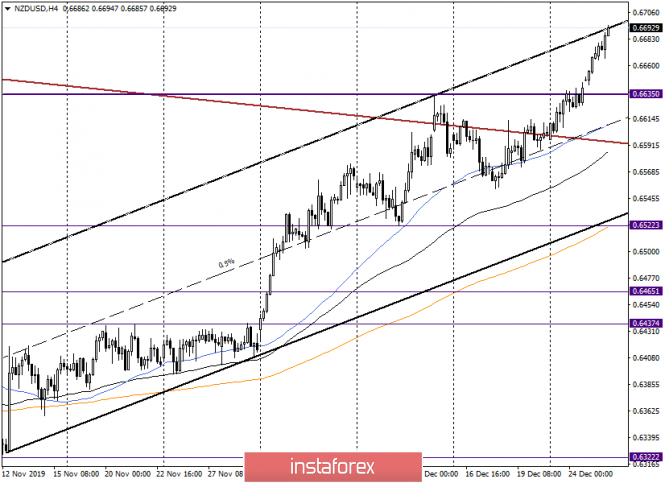
The pair continues to move in the ascending channel of 0.6326-0.6409 and 0.6635. At the same time, it should be noted that the quote came to the upper border of this channel, where a little higher is a strong and important level for market participants - 0.6700. At the moment of completion of the review, the channel's resistance line is already being tested for a breakdown, but for the success of the mission, the NZD/USD bulls will have to pass the mark of 0.6700. Given this fact, it is quite possible that a reversal bearish candle, or several candles, will appear in the price area of 0.6690-0.6700, after which the rate will fall to the area of 0.6650-0.6635, where it will again find support and turn towards the main upward trend. If this assumption turns out to be true and signals to decline to appear in the zone 0.6690-0.6670, those who wish can try to sell with targets in the area of 0.6650-0.6635. From here it is already worth considering purchases. It is also necessary to understand that the reversal and rollback of the pair may occur (if at all) not necessarily today. I would like to draw your attention to the fact that in the current situation, sales are exclusively corrective, and therefore riskier. For those who do not want to take risks, it is better to skip the rollback and prepare to open long positions from the designated zone. Successful completion of weekly trading! The material has been provided by InstaForex Company - www.instaforex.com |
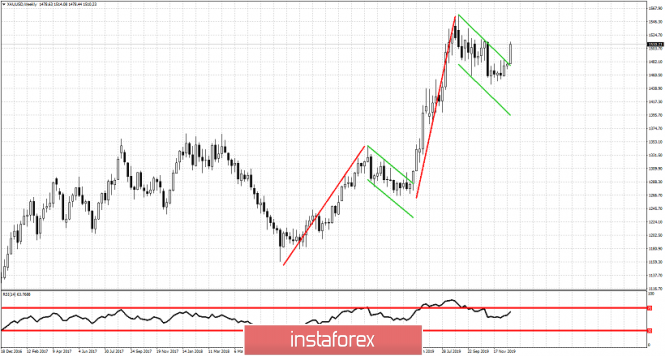
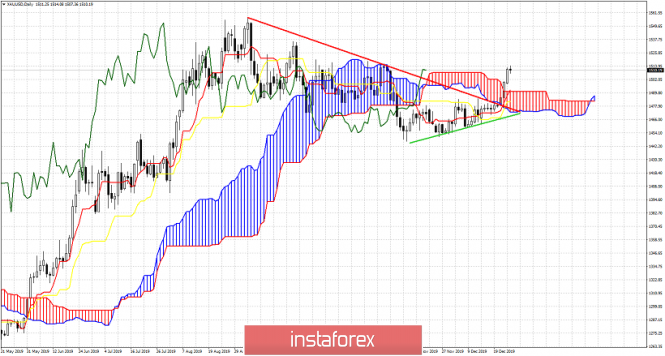
| Ichimoku cloud indicator short-term analysis of Gold for December 27, 2019 Posted: 27 Dec 2019 02:10 AM PST Gold price has shown several bullish signs over the past few sessions as we explained in our previous posts. Breaking above and out of the bearish short-term channel was the first step to start a new upward move that is expected to push price towards 2019 highs and why not higher.
Green line - support According to the Ichimoku cloud indicator, Daily trend had turned to neutral when price entered the Kumo and broke above the red trend line resistance. As we said many times before, bulls will keep their hopes alive as long as price respects the green support trend line. Price not only respected support, but also broke above the Kumo. This is an additional bullish signal. We could see a back test of the cloud at $1,491 but price should then bounce strongly back up again. Bulls do not want to see price enter the Kumo and break below it. This would be a very bearish sign. The material has been provided by InstaForex Company - www.instaforex.com |
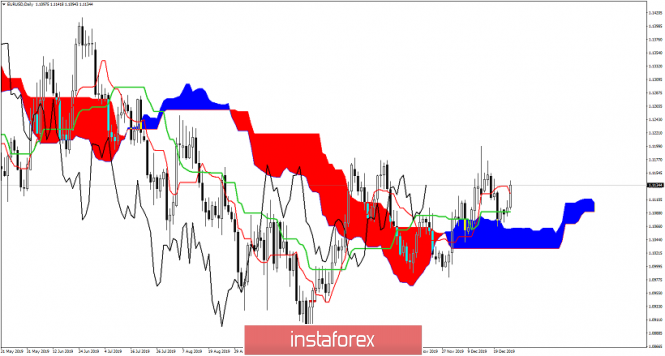
| The bounce in EURUSD comes at no surprise Posted: 27 Dec 2019 02:03 AM PST EURUSD is bouncing off the 1.1075 area as expected by our previous analysis. Why did we expect price to bounce? Because we saw that in this area there is important support indicated by the Ichimoku cloud.
|
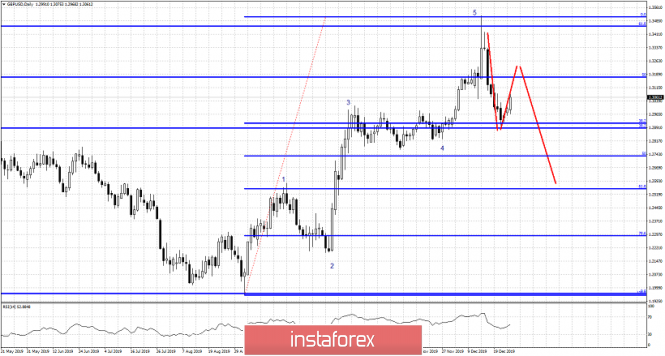
| Short-term Elliott wave analysis on GBPUSD Posted: 27 Dec 2019 01:57 AM PST GBPUSD has reached our minimum pull back target of 1.29 and is now bouncing as per our expectations. The most probable wave scenario implies that we are still in a corrective phase and another leg lower should follow.
GBPUSD has pulled back towards the 38% Fibonacci retracement level as we expected from our analysis back on December 17th. 1.29 was our minimum pull back target area and GBPUSD reached as low as 1.2904. As shown by the chart above, our expectation was to see price bounce from 1.29 area towards 1.31-1.32. The most probable wave scenario is that so far price has completed wave A of the corrective pull back and is now in wave B. A wave C lower towards the 61.8% Fibonacci retracement should follow. But markets are not perfect as to follow the theory according to textbooks, so take this scenario under serious consideration but we are also open to other possibilities. It is important to see the short-term wave structure of this upward move in order to define how much more upside this current move has to give. The material has been provided by InstaForex Company - www.instaforex.com |
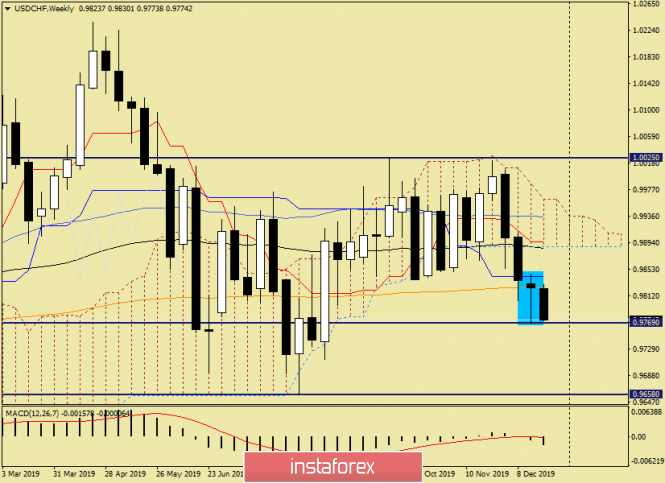
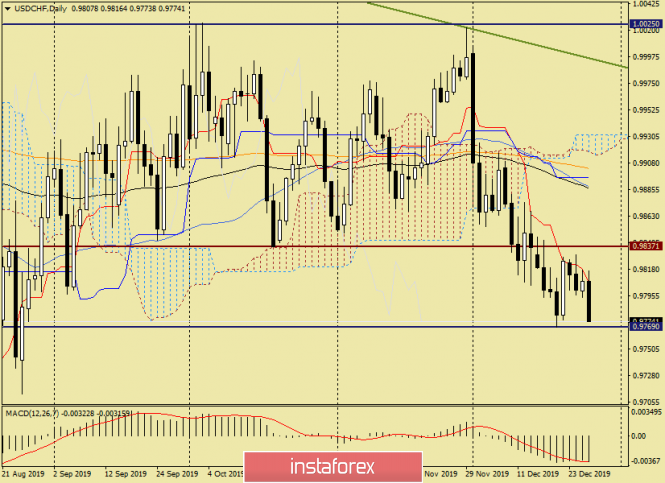
| Analysis and forecast for USD/CHF as of December 27, 2019 Posted: 27 Dec 2019 01:37 AM PST Hello, dear colleagues! Due to the virtually empty economic calendar, the main driver for the market can be considered the ongoing trade epic between the US and China. In recent days, there have been growing voices that the signing of the first phase of the trade agreement is not far off. Although how many similar statements have already been made, followed by almost refutations. However, confidence in the implementation of the deal is expressed not only in the United States but also in China. If you go to the technical picture for USD/CHF, it is frankly frustrating. In the last article on this instrument, I expressed confidence in a good signal for growth, which means purchases. However, look what happens. Weekly
Previously shared his personal view on the dollar/franc pair, which is largely bearish. However, after the appearance of such an obvious bullish model of candlestick analysis last week, personal preferences should have been left aside and based on technical factors, which was done. I assumed the growth of the quote and recommended buying, calling this bullish candlestick signal quite strong. But the reality is completely different. I think that not the least role in this situation was played by the 200 exponential moving average, which had a strong resistance and did not let the rate go up. Yes, the lows of the last candle have not yet been rewritten, and only if the current trading closes below 0.9769, we can talk about breaking the bullish model of Japanese candles. However, judging by such strong bearish sentiment, which is observed on USD/CHF, a breakout of the support of 0.9769 can be expected. Until this happens, the chances of growth remain. We are waiting for the closing price of the current weekly candle, after which we can make more specific conclusions. Daily
If on the weekly chart a strong resistance is represented by 200 EMA, then on the daily timeframe this function is performed by the Tenkan line of the Ichimoku indicator. As you can see, the Tenkan actively turns down after the price, which only emphasizes the strength of bearish sentiment. I believe that the inability to pass the Tenkan up and led to such an accentuated decline, which is observed in USD/CHF at the time of writing this article. Most likely, we will see repeated testing for a breakdown of the support level at 0.9769. If it succeeds and the quote is fixed below, on the rollback to the broken level, it is worth trying to open short positions. If 0.9769 stands, we can expect a pullback to the landmark level of 0.9800, where a little higher, at 0.9807, the Tenkan line passes. In my opinion, only a true Tenkan breakout will indicate a change in sentiment for USD/CHF and open the way to strong technical levels of 0.9820, 0.9840, 0.9860 and possibly to 0.9900. At the moment, I am more inclined to continue the downward scenario, but a more accurate assessment can be given only after the closing of weekly and daily trading. If you offer trading ideas for USD/CHF, the best, perhaps, is to stay out of the market. First, the market itself is quite thin. Second, the completion of weekly trading and profit-taking before the weekend can provoke sharp movements in each of the parties. Decide for yourself whether to go to such a market. Have a nice day! The material has been provided by InstaForex Company - www.instaforex.com |
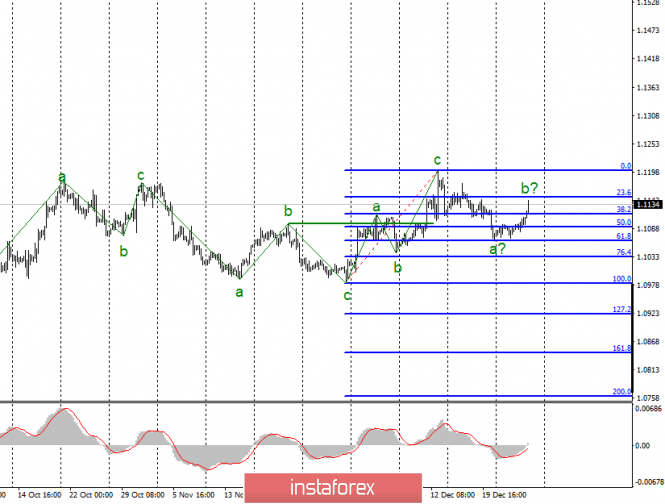
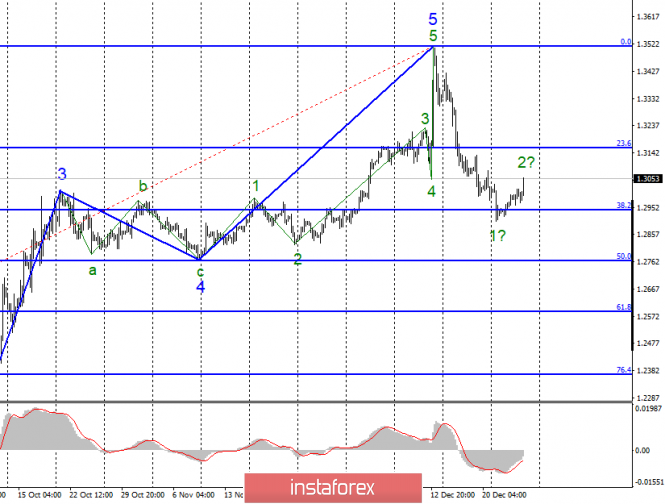
| Posted: 27 Dec 2019 01:33 AM PST EUR / USD On December 26, the EUR / USD pair increased by 10 basis points, but then already gained almost 40 on Friday night and morning. Are the markets recovering their previous holiday activity? One way or another, the current wave counting at the moment involves the construction of a correctional wave b. Now, I expect the completion of the quotations departure from the lows reached in the coming days and the resumption of decline within the framework of the expected wave c since the upward trend section is considered completed at the moment. Thus, I do not recommend selling a pair before receiving a signal about the completion of wave b. On the other hand, a successful attempt to break the maximum of December 13 will suggest the readiness of the instrument to complicate the upward trend section. Fundamental component: A news background for the euro-dollar instrument is missing. Not surprising for the holidays. All economic reports are postponed to 2020. Markets can expect to receive new information of a fundamental nature not earlier than the end of the New Year holidays, respectively. Strangely enough, the Euro currency found a reason on December 27 to begin to rise in a more energetic manner than it was in the previous two or three days. Given the fact that there were no interesting messages from America or the European Union, I am inclined to believe that the so-called "New Year's trading" has begun. Trading, when the market is too sensitive to every new player and/or to every new open transaction. Thus, I recommend that you conduct very accurate trading these days, since it is extremely difficult to predict where the market will unfold and at what point. General conclusions and recommendations: The euro-dollar pair presumably completed the construction of the upward trend section. Thus, I would recommend selling the instrument with targets located near the levels of 1.1034 and 1.0982, which corresponds to 76.4% and 100.0% Fibonacci. The signal from the MACD "down" will indicate the readiness of the instrument for a new decrease. At the same time, the decline may resume after the New Year given the festive mood of the market. GBP / USD On December 26, the pair GBP / USD increased by 30 basis points, and added another 70 points in the morning of December 27. Thus, it can be officially announced that the first wave as part of a new bearish trend section has completed its construction and the instrument has moved to building wave 2 or b. If this is true, then the increase in quotations will continue with targets located near the level of 1.3160, which is equivalent to 23.6% Fibonacci. On the contrary, an unsuccessful attempt to break through this level will lead to the completion of the construction of the correctional wave and with a high degree of probability of the resumption of the decline in the pound. Fundamental component: There is no news background for the GBP / USD instrument. The British government went on vacation, so the key topic for the British pound - Brexit and everything related to it - it has no news feed right at the moment. If you add to this the complete absence of economic reports, as well as the festive mood of the market, it becomes clear that you can now rely only on the wave picture or technical indicators. In addition, pound sterling is perfecting the current wave marking, and thus, are waiting for the completion of the construction of wave 2 or b . General conclusions and recommendations: The pound / dollar instrument continues to build a new downward trend. I recommend resuming the sale of the instrument with targets located near the level of 1.2764, which corresponds to the Fibonacci level of 50.0%, after completing the construction of wave 2 or b by the MACD signal "down". The material has been provided by InstaForex Company - www.instaforex.com |
| Posted: 27 Dec 2019 01:21 AM PST Good day, dear traders! As usual, on New Year's Eve, for many years in a row, the market gives surprises - some pleasant, some not. Every end of December, the dollar unexpectedly has strong movements across many currency pairs. This year, Asians were the driver, taking advantage of low liquidity in the market, stretched the most popular instrument EUR/USD by 500p – this is almost the limit for the Asian session. Yesterday, we gave a recommendation to work on lowering the euro at the close of the day: https://www.instaforex.org/ru/forex_analysis/24246... There were good chances with a ratio of 1 to 2, however, the Asians worked out the weakening of dollar on all fronts, updating the quote of yesterday's top in particular, thereby canceling the short scenario for this instrument. It should be noted that dollar is losing ground on all instruments - against yen, franc, and the Canadian dollar. All this can be attributed to the "New Year's Rally" of USD, regularly met at this time. The clearest example of a weakening dollar is gold. As you know, global gold mining is stable, so we can say that there is nothing other than the dollar in this tool. Hence, if the dollar weakens, gold goes up sharply. For the last 3 days, the price of gold soared from 1470 to 1510, stopping at the October "platform" of $ 1519. We do not envy those sellers who hide their feet behind this level: Good luck in trading and control the risks! The material has been provided by InstaForex Company - www.instaforex.com |
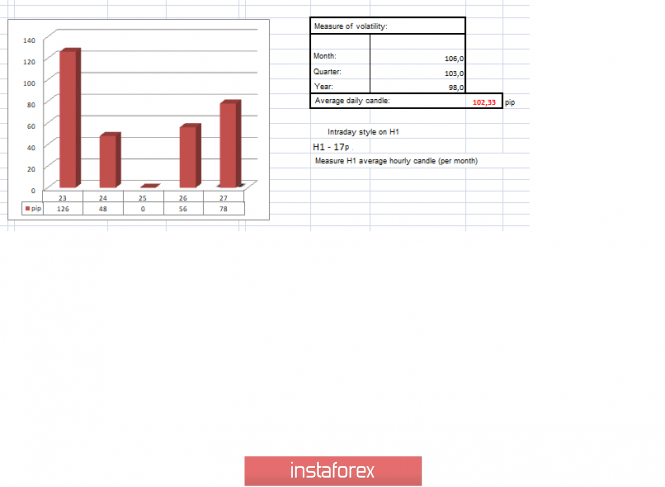
| Trading recommendations for GBP/USD on December 27 Posted: 27 Dec 2019 01:05 AM PST From the point of view of a comprehensive technical analysis, we see that the quote continues to move within the psychological level of 1.3000, conditionally having lateral movement. In fact, the quote found support in the region of 1.2904 after December 23, where there was a stop with correction in terms of local tact. However, the quote was not able to draw something cardinal for us on small trading volumes, so we got a kind of chatter within the control level. At the same time, the absence of major players and the closed exchanges in Europe and America led to the formation of subtle exchange volumes that speculators have not yet taken advantage of. Let me remind you that in the previous review, we discuss the topic of the thin market, as well as systematic volatility in the last days of the outgoing year, and so, the topic has not yet been disclosed. Market dynamics in theory may arise, but if it is built solely on speculative interest, the clock component, as well as the main course of the market for a time will lose meaning, and we will see a kind of local spikes quotes without any fundamental component. At this time, the average volatility is 56 points since the beginning of the week, which is certainly a low indicator for such an active pair as the pound / dollar, but if you adjust for the holidays, then everything is within normal limits. In terms of the emotional mood of market participants, we see that large participants have already gone for the holidays, and speculative interest has not yet been fully disclosed. Analyzing the past minute by minute, we see that impulse surges were still present on the market all day, but their value was approximately 30-45 points. A noteworthy point is that the sign of the jumps was systematic stagnation / micro-pullbacks, which need to be adopted for further work. As discussed in the previous review, many traders relax and return to the market next year. Now, mainly speculators who earn on local races are working. Considering the trading chart in general terms [the daily period], we see that we have a small pullback regarding the decline on December 16-23. In terms of a larger scale, we see that the quote returned to the scope of 1.2770 / 1.3000, that is, in the same flat that lasted more than six weeks. The news background of the past day contained data on applications for unemployment benefits in the United States, where they expected a reduction in applications by 41 thousand, but as a result, received a reduction of 19 thousand: Primary -13 thousand; Repeated - 6 thousand. Thus, the reaction of the market to the orders was not in favor of the dollar, where we saw an almost synchronous reflection together with the missing news and volumes. In terms of informational background, we have a conditional lull in connection with the holidays, but there is also something interesting in this silence. Thus, the new head of the European Commission [EC] expressed concern about Britain's intention to shorten the transition period. According to Ursula von der Leyen, the transition period of 11 months is extremely short and there may not be enough time to resolve all issues. "I am very worried about how little time we have left for negotiations. It is not only about the conclusion of a trade agreement, but also about many other topics. It seems to me that both parties should seriously ask themselves whether all these negotiations are possible in such a short time. I think it would be reasonable to take stock in the middle of the year and, if necessary, agree on an extension of the transition period," said the head of the EC. In fact, we received a kind of risk preconditions for the transaction once again, as previously discussed by Brexit negotiator Michel Barnier. It can be recalled that in order to access the European market, Britain must comply with EU rules and guarantee comparable conditions for the production of goods and services. In case of non-compliance with the rules will have to agree on duties and restrictive measures. Today, in terms of the economic calendar, we do not have statistics, and the background continues to be quiet. The upcoming trading week in terms of the economic calendar does not favor events and statistics, which is understandable because of New Year's week. Markets do not work on January 1, and Europe is inactive from 31 to 1, thereby the dynamics of trading can be scarce. Monday, December 30 USA 15:00 Universal time - The index of incomplete sales in the real estate market (m / m) (November): Prev -1.7% ---> Forecast 1.5% Thursday, January 2 Great Britain 9:30 Universal time - Manufacturing PMI (Dec): Prev 47.4 ---> Forecast 47.6 Friday January 3 Great Britain 9:30 Universal time - Index of business activity in the construction sector (Dec): Prev 45.3 ---> Forecast 45.7 USA 15:00 Universal time - Manufacturing PMI (ISI) from December (Dec): Prev 48.1 ---> Forecast 49.0 Further development Analyzing the current trading chart, we see that there was a surge at the start of the European trading session, locally tossing the quote to the area of 1.3045. In fact, we received a local influx of trading volumes after a three-day absence of Europeans and British in the market. This is exactly where the hand of speculators is clearly visible, where a jump is literally visible from scratch. So, you can focus on not the best statistics for the States, which was yesterday, but this seems to be far-fetched. By detailing the time segment that we have every minute, we see that the price jump occurred in the period 05:30-7:00 [UTC+00 time on the trading terminal]. The structure of the candles displays impulses, which is characteristic of speculative operations. We can already confirm our theory on the next candle, which tries to quickly restore the quote, reflecting the fixation of previously received profit. In turn, large traders are still out of the market, and speculators work at minute intervals, tracking stagnation / pullbacks to identify future impulses. Having a general picture of actions, it is possible to say that if you are not ready to trade in a thin market, then it is better to return to trade next year. If you are a speculator and know how to control risks, then now is the right moment to jump in impulses. The task is to identify small stagnation and pullback. After that, we analyze the impulse with respect to them and work in a small inertial stroke towards the impulse. Indicator analysis Analyzing a different sector of timeframes (TF), we see that the indicators on the minute and hour intervals jump after speculative positions, having a share of ambiguity. Meanwhile, medium-term segments still maintain a downward interest, reflecting an earlier decline. Volatility per week / Measurement of volatility: Month; Quarter; Year Measurement of volatility reflects the average daily fluctuation, calculated for the Month / Quarter / Year. (December 27 was built taking into account the time of publication of the article) The current time volatility is 78 points, which is a high indicator for this time section. It is likely to assume that if speculators manage to maintain their current mood, then the volatility may still grow a little, but still remain below the average. Key levels Resistance Zones: 1.3000; 1.3180 **; 1.3300 **; 1.3600; 1.3850; 1.4000 ***; 1.4350 **. Support Areas: 1.2885 *; 1.2770 **; 1.2700 *; 1.2620; 1.2580 *; 1.2500 **; 1.2350 **; 1.2205 (+/- 10p.) *; 1.2150 **; 1,2000 ***; 1.1700; 1.1475 **. * Periodic level ** Range Level *** Psychological level **** The article is built on the principle of conducting a transaction, with daily adjustment The material has been provided by InstaForex Company - www.instaforex.com |
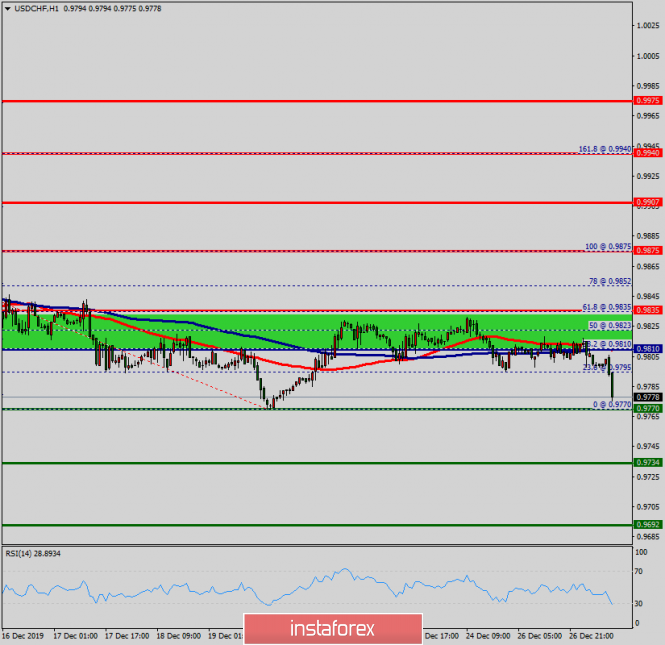
| Technical analysis of USD/CHF for December 27, 2019 Posted: 27 Dec 2019 01:01 AM PST Overview: The USD/CHF pair fell from the level of 0.9830 to bottom at 0.9780 yesterday. Today, the USD/CHF pair has faced strong support at the level of 0.9770. The strong support has been already facing at the level of 0.9770, the pair is likely to try to approach it in order to test it again and form a double bottom. The USD/CHF pair is continuing to trade in a bullish trend from the new support level of 0.9770 so as to form a bullish channel. According to the previous events, we expect the pair to move between 0.9770 and 0.9835. Also, it should be noted major resistance is seen at 0.9875, while immediate resistance is found at 0.9835. Then, we may anticipate potential testing of 0.9810 to take place soon at the daily pivot point. Moreover, if the pair succeeds in passing through the level of 1.9810, the market will indicate a bullish opportunity above the level of 1.9810. A breakout of that target will move the pair further upwards to the levels of 0.9835 and 0.9875. Buy orders are recommended above the area of 0.97700 with the first target at the level of 1.9810; and continue towards 0.9835 and 0.9875. On the other hand, if the USD/CHF pair fails to break out through the resistance level of 1.9810; the market will decline further to the level of 0.9734 (daily support 2). The material has been provided by InstaForex Company - www.instaforex.com |
| Trader's Diary: EURUSD on 12/27/2019, The main problem of trading Posted: 27 Dec 2019 12:53 AM PST
EURUSD As you can see, the euro pushed off the support of 1.1100 and is trying to start a new wave of growth. The first target is 1.1200, which is a break above and closing of the day above this level. This is a strong signal to start the trend upward for the euro. We still keep purchases from 1.1035 and stop in the profit zone of 1.1065. In case of a downward sell, we sell from 1.1065. The main problem of trading There are many theories of technical analysis. This is a huge number of tactics and strategies for trading in the financial markets. Therefore, there is a logical question - "Why are there so many unsuccessful traders and why is it sometimes difficult to make money in the market?" The answer is simple: price behavior is poorly predicted, very unpredictable. If someone does not know, there is a theory of an effective market (FER). This theory claims that at any moment in time the probability of a price moving up or down is absolutely equally probable. Information about a traded instrument, asset, and previous price behavior does not add to your chances of winning since the market takes into account all available information and includes it in the price instantly. Of course, many traders and investors would argue with the FER, and I am no exception. However, the FER has received Nobel Prizes in economics and the theory of optimal portfolio, the theory of calculating option prices (Black-Scholes formula) are based on FER. These things are considered very effective in practice. The truth is that, despite its rapid development, the modern economic science has not created such a theory of calculating the price of goods and assets that could at least roughly predict quantitative data on prices for the medium term. A famous example is that of in the summer of 2008 where the most famous analyst, Goldman Sachs, forecasted oil at about $200 per barrel for the summer of 2009 and has, in fact, received $40. Furthermore, the question "Why is there no correct price model?" is reasonable. The answer is psychology. The modern economy is largely dependent on the psychology of participants in the economy and the market which are businessmen, consumers, and investors, respectively. But mass psychology is still very poorly predicted quantitatively. Therefore, there is no theory of price. As a result, the price is highly susceptible to random fluctuations. FER says that it is 100% random and this, of course, is an exaggeration and an ultimate assumption. Because, actually, the price behavior is randomly 80-90%. Such a high degree of randomness makes any trading system/strategy work probabilistically, in some periods it is better, in others worse, and in some periods it makes the TS deeply unprofitable at a given time interval. The material has been provided by InstaForex Company - www.instaforex.com |
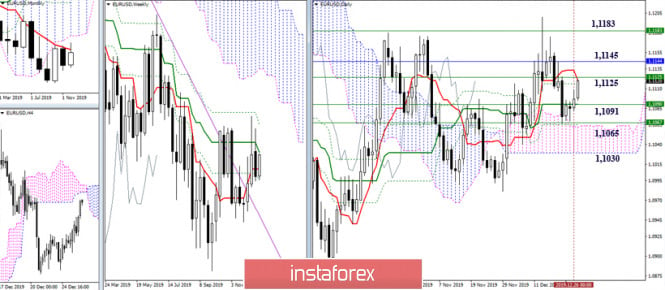
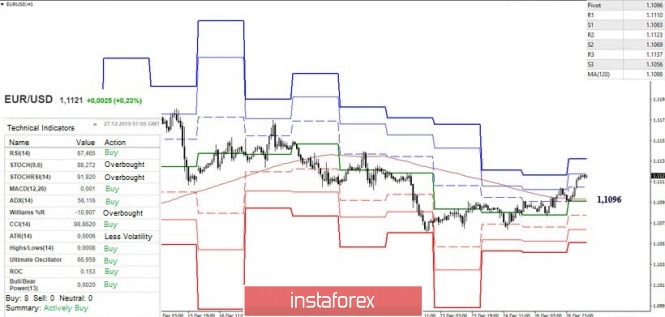
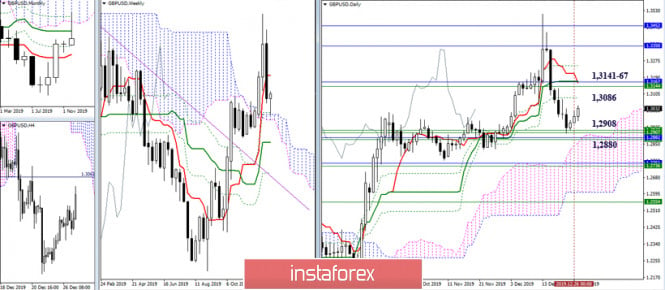
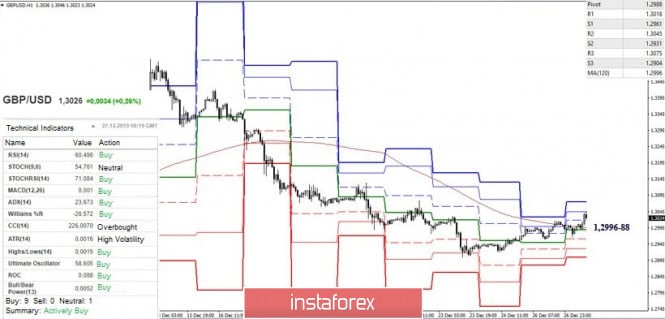
| Technical analysis recommendations for EUR/USD and GBP/USD on December 27 Posted: 27 Dec 2019 12:51 AM PST EUR / USD The players have been able to improve their positions by increasing over the past time of the current working week. Now, the result of closing not only the week, but also the month is interesting. At the same time, consolidating above the monthly short-term trend (1.1145) will be in this case, a good potential for continuing to strengthen the bullish positions in January next year. On the other hand, the formation of rebound from the encountered resistance and the loss in the coming days before the close of December of the daily medium-term (1.1091) and weekly short-term (1.1091) trends can significantly affect the nature of the monthly results and future prospects. In the lower halves, the advantage belongs entirely to the players on the upside. Resistance within the day can be identified at 1.1123 (R2) and 1.1137 (R3). This resistance zone is amplified from the main resistance of the older time intervals - weekly Kijun 1.1125 and monthly Tenkan 1.1145. Therefore, its testing and the result of interaction are the main task of players to increase in the near future. Today, key support combined in the area of 1.1096 (central Pivot level + weekly long-term trend). Now, consolidating below will change the current balance of power. GBP / USD In addition, the result of not only closing the current week, but also the subsequent closing of the month is now important for the pound, as well as for the euro. The formation of the rebound from the weekly cloud, as well as the realization of the rise and consolidation above the weekly short-term (1.3141) and monthly medium-term (1.3167) trends can be a good guarantee of strengthening bullish positions and moods at the beginning of next year. However, in case of its failure, a return to support (1.2880 - 1.2908 weekly cloud + monthly Fibo Kijun + weekly Fibo Kijun) and even more so their loss will return prospects for players on the downside. Players on the upside found in the lower halves were able to reach an advantage in strength and advantages. If they maintain their positions now and deploy moving, then they can count on new upward prospects. Today, resistance within the day are the classic pivot levels 1.3045 (R2) - 1.3075 (R3). At the same time, key support for H1 has now joined forces in the area of 1.2988-96 (central Pivot level + weekly long-term trend). Consolidating below levels out all the achievements of the players on the upside and returns the initial advantages to the side of the bears. The main task of which will be to restore the downward trend and consolidate below the minimum extremum (1.2904). Ichimoku Kinko Hyo (9.26.52), Pivot Points (classic ), Moving Average (120) The material has been provided by InstaForex Company - www.instaforex.com |
| Technical analysis of ETH/USD for 27/12/2019: Posted: 27 Dec 2019 12:14 AM PST Crypto Industry News: Mike Blandina, a former PayPal and Google veteran, has become the new CEO of Bakkt's largest cryptocurrency trading platform. After the departure of president of the founder Kelly Loeffler, who was appointed to the US Senate in early December, Blandina was promoted to the position of CEO when he joined Bakkt as Product Director in April 2019. According to the announcement of the parent company Bakkt, Intercontinental Exchange, nomination entered into force on December 20. Together with the new CEO, Bakkt also appointed Adam White, former director of the US Coinbase Cryptographic Exchange, as the company's new president. White has worked at Bakkt as Chief Operating Officer since joining the company in November 2018. He is also known to have started his career testing experimental aircraft as a US aviation officer, as announced in the announcement. While Blandina will continue to direct Bakkt's strategic direction, payment products and markets, as well as regulatory issues, as Bakkt's new CEO, White will focus on digital asset markets, trust and trade, Jeffrey Sprecher, founder and CEO of ICE said in a statement. Technical Market Overview: The ETH/USD pair has made a local high at the level of $131.03, but bears have taken this opportunity to sell more Ethereum and pushed the prices lower towards the level of $123. Currently, the price is about to test the technical support located at the level of $122.13 and if broken, then the next target for bears is seen at the level of $118.65 and $116.15. The bears are still in control of the market, but for now, the swing low at the level of $115.05 is safe. Nevertheless, any violation of this low will invalidate the current Elliott wave scenario and will likely make the move down to extend towards the level of $114.00. Weekly Pivot Points: WR3 - $170.20 WR2 - $155.54 WR1 - $143.98 Weekly Pivot - $129.41 WS1 - $117.21 WS2 - $102.45 WS3 - $89.76 Trading Recommendations: The best strategy in the current market conditions is to trade with the larger timeframe trend, which is down. All the shorter timeframe moves are still being treated as a counter-trend correction inside of the downtrend. When the wave 2 corrective cycles are completed, the market might will ready for another wave up.
|
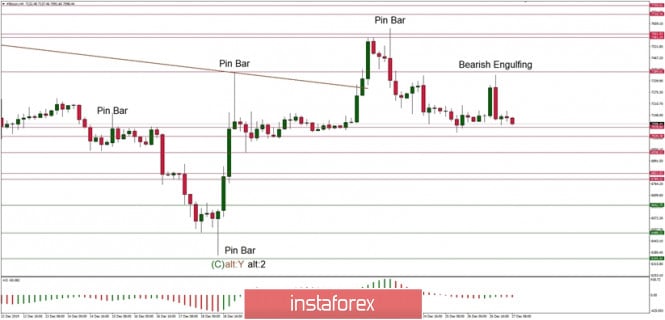
| Technical analysis of BTC/USD for 27/12/2019: Posted: 27 Dec 2019 12:07 AM PST Crypto Industry News: The self-appointed Bitcoin creator, Craig Wright, showed, he claims a document that explains the origin of the nickname Satoshi Nakamoto. In a press interview, Wright showed a document presenting an article from the JSTOR digital academic journal database of January 5, 2008. The article is about a person named Tominaga Nakamoto who lived in Japan between 1715 and 1746. The document also contained the following handwritten notes: "Nakamoto is the Japanese Adam Smith. Honest Ledger + Micro Cash. Satoshi is Intelligent History. Not too much." According to Wright, he chose the name Nakamoto in honor of Tominagi Nakamoto. A handwritten note compares him to Adam Smith, who is considered by many to be the father of modern economics. Asked if Nakamoto's economic ideas were the reason he chose his name, he replied: "In part, yes. He wrote about money and fair money, and about the rational nature of things. The shogun [feudal ruler] was in financial crisis and economic hardship at the time. [...] I like his description and I found his brother, Toka. "Nakamoto was upright and calm but impatient," and I thought, "Sounds like me." As for the nickname's first word, Satoshi, Wright says it means "intelligent learning." He explains that he refers to a person who has access to the knowledge acquired by his ancestors. While Wright claims to be Satoshi Nakamoto, he also announced in November that he could not finance a settlement of 500,000 Bitcoins ($ 3.7 billion) in a case that had initiated Kleiman's assets against him. Dave Kleiman was an expert in cybersecurity, whom many consider being one of the first creators of Bitcoin and Blockchain technology. He died in April 2013. Kleiman's property, run by David's brother Ira Kleinman, initiated the case last February, accusing Wright of stealing hundreds of thousands of Bitcoins - worth over $ 5 billion - after the death of the developer. It is known that Satoshi Nakamoto extracted the origin blocks on Bitcoin Blockchain, the so-called Satoshi blocks, and therefore should have a significant number of coins on his address. Technical Market Overview: The BTC/USD pair is still being controlled by the bears and every attempt to rally is quickly being used to sell more Bitcoins. The global investors have seen this kind of market behavior through all the holidays, as the local high was made at the level of $7,371 and then the price was pushed down and is currently trading close to the technical support located at the level of $7,078. Any violation of this level will lead to another wave down targeting the level of $7,028 or even $6,938. Weekly Pivot Points: WR3 - $8,907 WR2 - $8,106 WR1 - $7,862 Weekly Pivot - $7,117 WS1 - $6,770 WS2 - $6,071 WS3 - $5,771 Trading Recommendations: The best strategy in the current market conditions is to trade with the larger timeframe trend, which is still down. All the shorter timeframe moves are still being treated as a counter-trend correction inside of the uptrend. When the wave 2 corrective cycles are completed, the market might will ready for another impulsive wave up of a higher degree and uptrend continuation.
|
| Posted: 27 Dec 2019 12:06 AM PST 4-hour timeframe
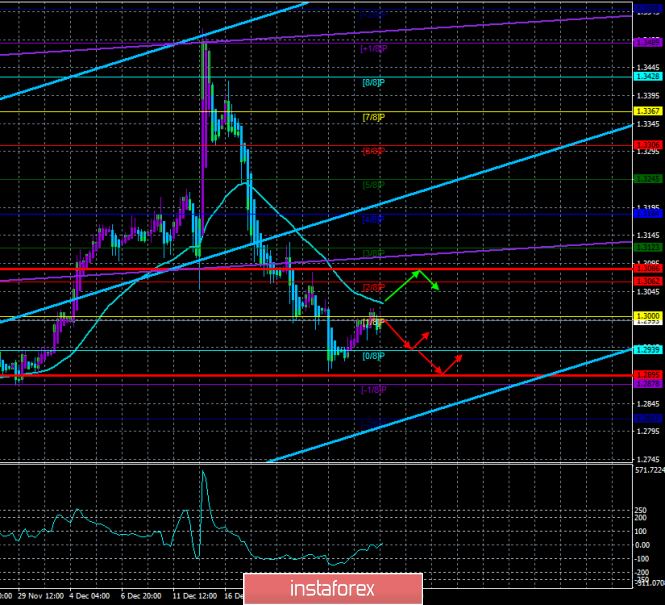
Technical data: The upper channel of linear regression: direction - up. The lower channel of linear regression: direction - up. The moving average (20; smoothed) - down. CCI: 35.6101 We have repeatedly said that we do not see any other scenario for the British pound, except for a further fall. It remains only to find out when it will resume because during the New Year and Christmas holidays, the pair still began an upward correction, which from a technical point of view has been brewing for a long time, but from a fundamental point of view - it might not be at all. We still believe that the British pound, with its rise to 1.35, has simply exhausted the limit of luck for the next few years. Thus, the main issue for the pound/dollar pair is the resumption of the downward trend after the correction is completed. The first factor that will help us determine the possible end of the corrective movement is moving. The price came close to this line, so it is very likely to rebound from it with the resumption of downward movement. If the price overcomes the moving average line, the trend will change to an upward one and we can expect a stronger upward correction. The second factor is the fundamental background. It speaks unequivocally in favor of the US dollar, it is strengthening, and the fall of the British currency as low as possible. In short, this factor contains such theses as the failed macroeconomic statistics in the UK over the past 2 and a half month, good statistics in the United States in the last month and a half, the strong monetary policy of the Fed compared to the Bank of England, the high probability of lowering the key rate by the British Regulator, Brexit, uncertainty in trade relations between the EU and the UK after January 31, 2020, Boris Johnson's tough position on negotiations with the European Union and mutual concessions. All this, from our point of view, works and will work against the pound. The third factor is the local macroeconomic reports. As we have already said, no important macroeconomic publications are planned for either the United States or the United Kingdom until January 2, 2020. But on January 2, in the UK, in the European Union, and the United States, indices of business activity in the areas of production, which, we recall, have a very high value in recent months will be published. For example, according to experts' forecasts, business activity in the UK manufacturing sector will remain unchanged - 47.4, in the European Union - 45.9, in Germany - 43.4. If these figures are confirmed, what can be expected on this day from the pound and the euro? Let's say that traders will ignore these reports, but these indicators will harm the volume of industrial production, and on other indicators of the state of the economy since it is one of the main industries. By the way, in the case of the United Kingdom, not only business activity in the industry is deep in the "recession zone". Business activity in the service sector, in the construction sector - is also below the level of 50.0, that is, they also recorded a decline. The fourth factor is the geopolitical problems of the UK after the Brexit. Recall that the talk about the Scottish independence referendum has been going on for a long time. Nicola Sturgeon has repeatedly said that her country wants to stay in the EU, rather than follow the "absurd" ideas of Boris Johnson and depend on the will of London. Until a week ago, the UK Parliament approved Johnson's deal to leave the EU, there were still faint hopes that Brexit would be canceled or postponed, but now there is no hope. Thus, Edinburgh intends to put the question of the referendum edge. Of course, London will oppose such a process, but Edinburgh can hold a referendum without London's approval. This, of course, will divide the States for many years, and it may even come to a military conflict. And all of these are potential problems for the UK and the pound. How much will Britain's GDP fall if Scotland leaves?
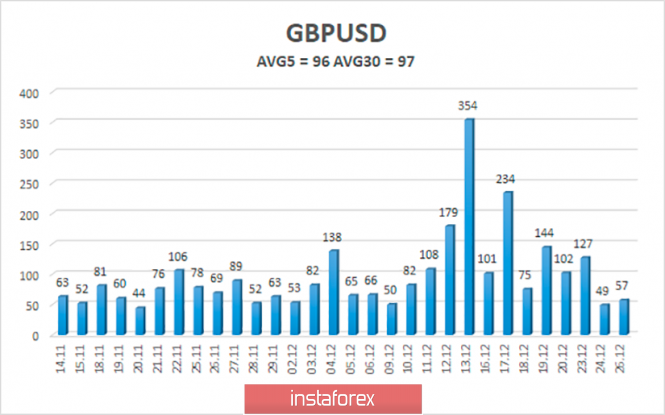
The average volatility of the pound/dollar pair over the past 5 days is 96 points, remaining at a fairly high level, but the downward trend is visible to the naked eye. According to the current level of volatility, the working channel on December 27 is limited to the levels of 1.2895 and 1.3086. Volatility may continue to decline during the Christmas and New Year weeks. Nearest support levels: S1 - 1.2939 S2 - 1.2878 S3 - 1.2817 Nearest resistance levels: R1 - 1.3000 R2 - 1.3062 R3 - 1.3123 Trading recommendations: The GBP/USD pair continues its upward correction. Thus, traders are advised to sell the British currency with the nearest targets of 1.2939 and 1.2895 after the reversal of the Heiken Ashi indicator back down or in the case of a price rebound from the moving average. It is recommended to return to the purchases of the pound/dollar pair not earlier than the reverse consolidation above the moving average line with the first target of 1.3086. It is recommended to open any positions very carefully. In addition to the technical picture, you should also take into account the fundamental data and the time of their release. Explanation of the illustrations: The upper channel of linear regression - the blue lines of the unidirectional movement. The lower channel of linear regression - the purple lines of the unidirectional movement. CCI - the blue line in the indicator regression window. The moving average (20; smoothed) - the blue line on the price chart. Murray levels - multi-colored horizontal stripes. Heiken Ashi - an indicator that colors bars in blue or purple. Possible variants of the price movement: Red and green arrows. The material has been provided by InstaForex Company - www.instaforex.com |
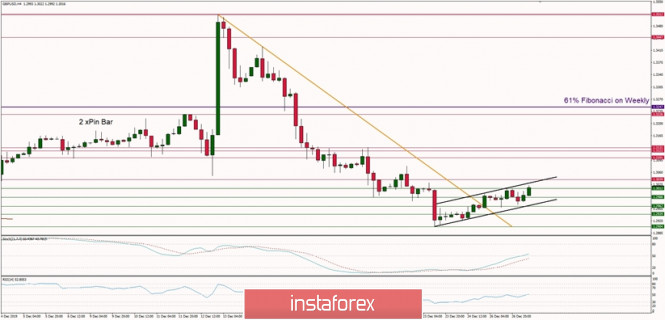
| Technical analysis of GBP/USD for 27/12/2019: Posted: 26 Dec 2019 11:59 PM PST Technical Market Overview: The GBP/USD pair rally bounced from the technical support located at the level of 1.2904 but is still trading inside of a narrow channel. The bulls have managed to break through the short-term descending trendline resistance around the level of 1.2970 and clearly want to continue the move up. Moreover, the market is bounced from the oversold conditions and the momentum just broke through the fifty levels, which means the move up might get some steam. The next target for bulls is seen at the level of 1.3039 and 1.3101. The immediate support is seen at the level of 1.3012, 1.2988 and 1.2962. Weekly Pivot Points: WR3 - 1.3654 WR2 - 1.3526 WR1 - 1.3206 Weekly Pivot - 1.3091 WS1 - 1.2763 WS2 - 1.2640 WS3 - 1.2325 Trading Recommendations: The best strategy for current market conditions is to trade with the larger timeframe trend, which is up. All downward moves will be treated as local corrections in the uptrend. In order to reverse the trend from up to down, the key level for bulls is seen at 1.2756 and it must be clearly violated. The key long-term technical support is seen at the level of 1.2231 - 1.2224 and the key long-term technical resistance is located at the level of 1.3509.
|
| You are subscribed to email updates from Forex analysis review. To stop receiving these emails, you may unsubscribe now. | Email delivery powered by Google |
| Google, 1600 Amphitheatre Parkway, Mountain View, CA 94043, United States | |


No comments:
Post a Comment