Forex analysis review |
- Technical analysis of EUR/USD for December 31, 2019
- December 31, 2019 : GBP/USD showing negative divergence while approaching the current Supply Levels.
- Elliott wave analysis of GBP/JPY for December 31 -2019
- Elliott wave analysis of EUR/JPY for December 31st - 2019
- December 31, 2019 : EUR/USD Intraday technical analysis and trade recommendations.
- Technical analysis of ETH/USD for 31/12/2019:
- Technical analysis of BTC/USD for 31/12/2019:
- Technical analysis of GBP/USD for 31/12/2019:
- Technical analysis of EUR/USD for 31/12/2019:
- EUR/JPY approaching resistance, potential drop!
- GBP/USD approaching resistance, potential drop!
- EUR/USD approaching resistance, potential drop!
- Technical analysis: Important intraday level for EUR/USD, December 31st, 2019
- Technical analysis: Important intraday level for USD/JPY, December 31st, 2019
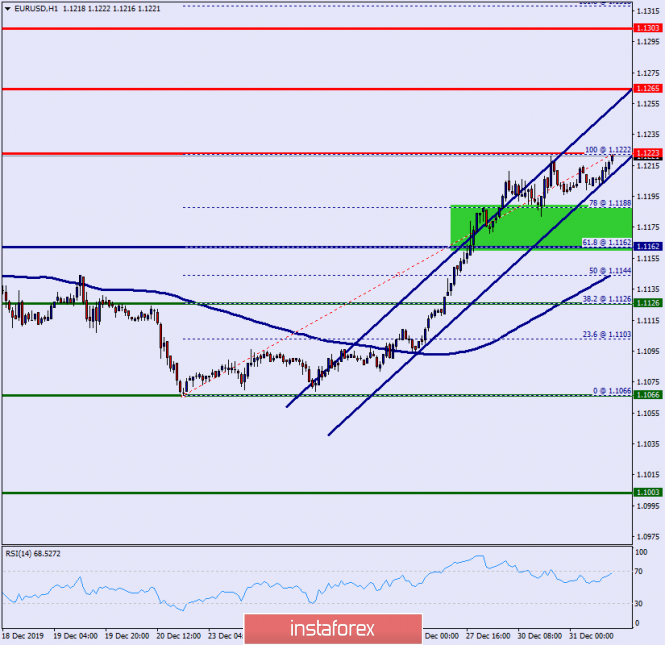
| Technical analysis of EUR/USD for December 31, 2019 Posted: 31 Dec 2019 03:39 AM PST Overview: Pivot point: 1.1162. The EUR/USD pair was continuing to trade upwards from the level of 1.1162. Yesterday, the pair rose from the level of 1.1162 (daily pivot point) to the top around 1.1223. Today, the first resistance level is seen at 1.1265 followed by 1.1303, while daily support is seen at 1.1162. According to the previous events, the EUR/USD pair is still moving between the levels of 1.1162 and 1.1303. Consequently, we expect a range of 141 pips in coming hours. This would suggest a bullish market because the RSI indicator is still in a positive area and does not show any trend-reversal signs. Subsequently, if the trend is able to break out through the first resistance level of 1.1265, we should see the pair climbing towards the new double top (1.1303) to test it. On the contrary, if a breakout takes place at the support level of 1.1162, then this scenario may become invalidated. Remember to place a stop loss; it should be set below the second support of 1.1126. The material has been provided by InstaForex Company - www.instaforex.com |
| December 31, 2019 : GBP/USD showing negative divergence while approaching the current Supply Levels. Posted: 31 Dec 2019 01:35 AM PST
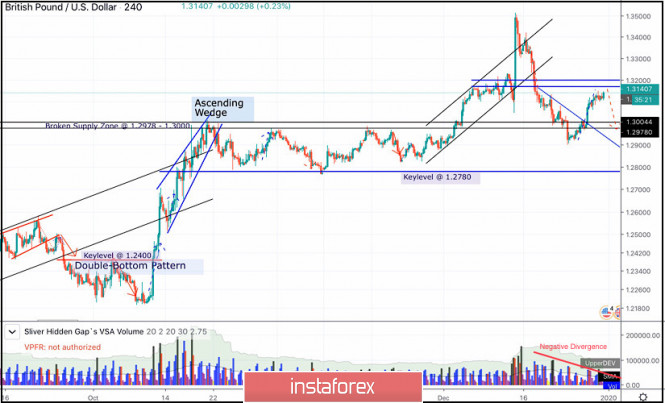
In the period between October 17 to December 4, the GBP/USD pair has been trapped between the price levels of 1.2780 and 1.3000 until December 4 when bullish breakout above 1.3000 was achieved. Moreover, a newly-established short-term bullish channel was initiated on the chart. The GBPUSD has recently exceeded the upper limit of the depicted bullish channel on its way towards 1.3500 where the pair looked quite overpriced. This was followed by successive bearish-engulfing H4 candlesticks which brought the pair back towards 1.3170 quickly. Further bearish decline was pursued towards 1.3000 which got broken to the downside as well. Technical short-term outlook turned into bearish since bearish persistence below 1.3000 was established on the H4 chart. Hence, further bearish decline was expected towards 1.2840 - 1.2800. However, earlier signs of bullish recovery manifested around 1.2900 denoted high probability of bullish breakout to be expected. Intraday technical outlook turned into bullish after the GBP/USD has failed to maintain bearish persistence below the newly-established downtrend line. That's why, bullish breakout above 1.3000 was anticipated. Thus allowing the current Intraday bullish pullback to pursue towards 1.3190-1.3200 where bearish rejection and another bearish swing can be watched by conservative traders. Bearish reversal scenario around 1.3200 is supported by the recent negative divergence as depicted on the chart. If so, Intraday bearish target would be projected towards 1.3000. The material has been provided by InstaForex Company - www.instaforex.com |
| Elliott wave analysis of GBP/JPY for December 31 -2019 Posted: 31 Dec 2019 01:24 AM PST
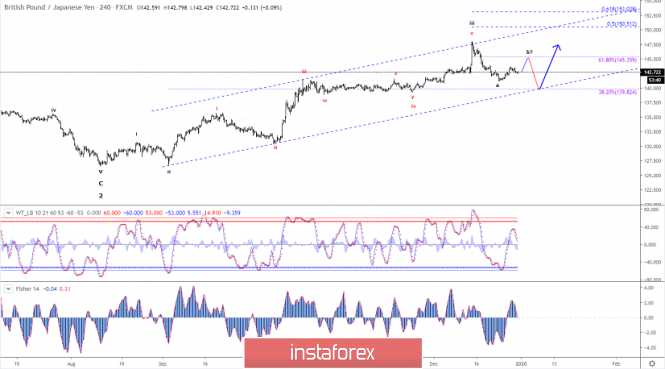
We have already seen the expected corrective decline to 142.39. GBP/JPY should be ready to challenge the upside again. We expect a rally above 143.43 that will confirm a continuation of the upside movement to 145.36 in order to complete wave b on the ongoing a-b-c correction. The correction is expected to be completed near 139.82. In a short-term perspective, a break above minor resistance at 142.89 will indicate that the minor correction is completed and the final leg of wave b towards 145.36 is unfolding. R3. 143.64 R2: 143.39 R1: 143.19 Pivot: 142.89 S1: 142.58 S2: 142.39 S3: 142.09 Trading recommendation: We are long 50% GBP from 141.50 with our stop set at break-even. We will place take profit while opening a sell position on GBP at 145.20. The material has been provided by InstaForex Company - www.instaforex.com |
| Elliott wave analysis of EUR/JPY for December 31st - 2019 Posted: 31 Dec 2019 01:17 AM PST
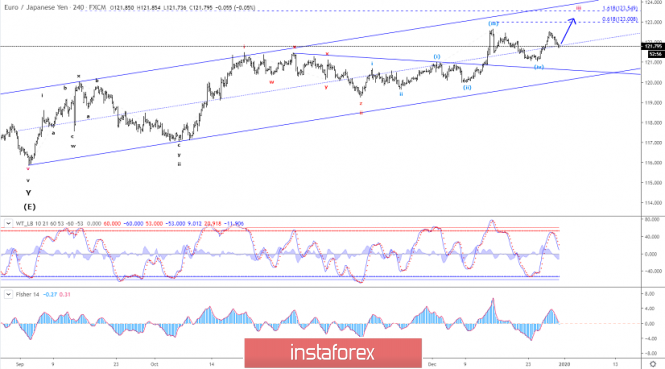
After a minor correction EUR/JPY should be ready to challenge the upside again. There will be a rally towards 123.55. This rally will complete red wave iii and set the stage for a more prolonged correction in red wave iv. In a short-term perspective, a break above minor resistance at 122.02 will indicate next upside attempt to start a rally to 122.50 on the way to a higher level of 123.55. Only an unexpected break below the support level at 121.52 will indicate a development of a more complex correction in blue wave (iv). This will also call for another dip below 121.03. R3: 122.50 R2: 122.20 R1: 122.00 Pivot: 121.85 S1: 121.69 S2: 121.52 S3: 121.29 Trading recommendation: We are long EUR from 120.25 with our stop placed at 121.40. The material has been provided by InstaForex Company - www.instaforex.com |
| December 31, 2019 : EUR/USD Intraday technical analysis and trade recommendations. Posted: 31 Dec 2019 01:17 AM PST
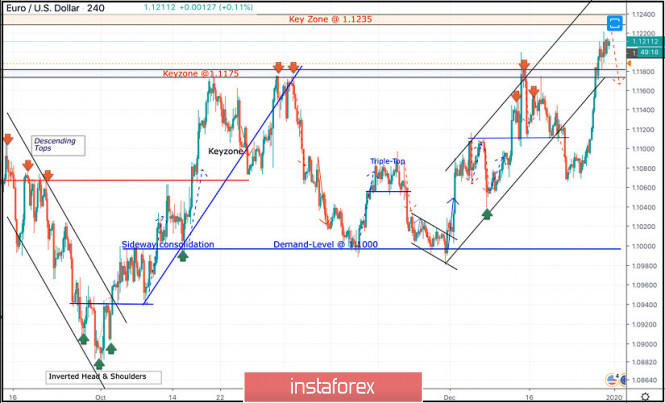
Since November 14, the price levels around 1.1000 has been standing as a significant DEMAND-Level which has been offering adequate bullish SUPPORT for the pair on two successive occasions. Shortly-after, the EUR/USD pair has been trapped within a narrower consolidation range between the price levels of 1.1000 and 1.1085-1.1100 (where a cluster of supply levels and a Triple-Top pattern were located) until December 11. On December 11, another bullish swing was initiated around 1.1040 allowing recent bullish breakout above 1.1110 to pursue towards 1.1175 within the depicted newly-established bullish channel. Initial Intraday bearish rejection was expected around the price levels of (1.1175). Quick bearish decline was demonstrated towards 1.1115 (Intraday Key-level) which got broken to the downside as well. On December 20, bearish breakout of the depicted short-term channel was executed. Thus, further bearish decline was demonstrated towards 1.1065 where significant bullish recovery has originated. The current bullish pullback towards 1.1235 (Previous Key-zone) should be watched for bearish rejection and another valid SELL entry. On the other hand, bullish persistence above the price zone of 1.1175 favors the bullish side of the market. That's why, bearish breakout below 1.1175 is mandatory to allow next bearish target to be reached around 1.1120. Trade recommendations : Conservative traders should wait for evident bearish rejection signs around the price levels of (1.1235) as a valid SELL signal. Bearish projection target to be located around 1.1175 and 1.1120. Any Bullish breakout above 1.1250 invalidates the mentioned bearish scenario The material has been provided by InstaForex Company - www.instaforex.com |
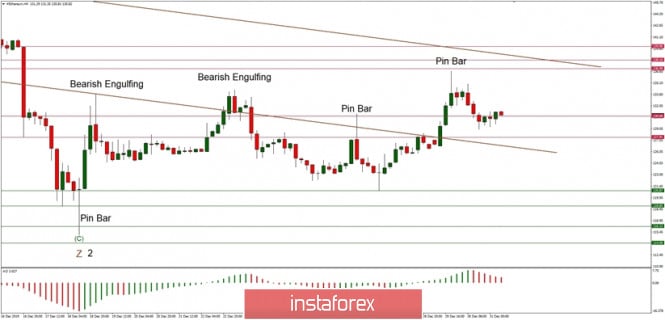
| Technical analysis of ETH/USD for 31/12/2019: Posted: 30 Dec 2019 11:50 PM PST Crypto Industry News: Leading cryptocurrency exchange Binance will suspend ETH deposits and withdrawals to support the recently announced Ethereum Muir Glacier update, according to information published on the exchange's official blog. Deposits and withdrawals on the platform will be suspended before the block amount of 9,200,000. While the upgrade will not affect Ethereum trading, deposits and withdrawals will be reopened when Binance decides that the improved network is stable. The Exchange emphasizes that it will not issue a separate message about the resumption of deposits and withdrawals, and recommends making deposits in full before upgrading. "Leave sufficient time for full processing of deposits before the above ETH network block height. We will deal with all technical requirements for all users who have ETH on their Binance accounts," reads the announcement. Described in the November 22 proposal by Ethereum developer James Hancock, the Muir Glacier update will be launched on the main network on January 1, 2020, at block 9 200,000. The exact date may change due to variable times and time zones of blocks, and block statistics in real-time are available on the website. Technical Market Overview: The ETH/USD pair has made the local high at the level of $136.64 and the candle that was used to make this high looks like a Pin Bar candlestick pattern. The bulls have temporary control of the market, but it might not last for long as the price is getting closer to the key technical resistance area. Nevertheless, it is worth to keep an eye on the current developments of the Ethereum market, despite the fact, that the market is currently trading aimlessly inside of a range. A breakout higher or lower can happen anytime now. Weekly Pivot Points: WR3 - $156.40 WR2 - $145.89 WR1 - $141.32 Weekly Pivot Point - $130.81 WS1 - $125.47 WS2 - $114.97 WS3 - $109.88 Trading Recommendations: The best strategy in the current market conditions is to trade with the larger timeframe trend, which is down. All the shorter timeframe moves are still being treated as a counter-trend correction inside of the downtrend. When the wave 2 corrective cycles are completed, the market might will ready for another wave up.
|
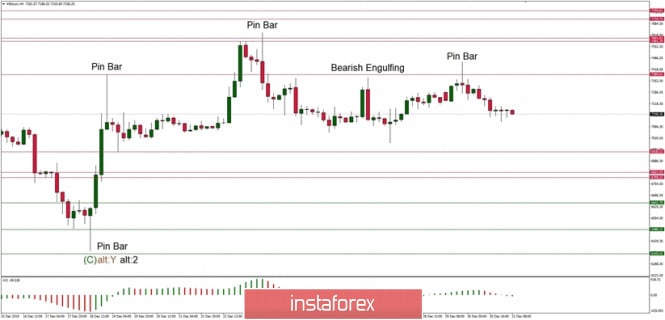
| Technical analysis of BTC/USD for 31/12/2019: Posted: 30 Dec 2019 11:45 PM PST Crypto Industry News: An application for an ETF investment fund linked to Blockchain technology has been submitted to the Chinese national legislature, according to information disclosed by the Chinese Securities Commission. The proposal submitted on December 24 by the Shenzhen Penghua Fund relates to an ETF that would track the results of a basket of listed shares from companies in the Blockchain sector. If approved, the fund would be the first Blockchain ETF in China, according to information published by financial media. On the same day the Penghua Fund was submitted, the Shenzhen stock exchange announced the "Blockchain 50 Index". The index consists of the top 50 Blockchain companies listed on the Shenzhen Stock Exchange in terms of market capitalization. Apparently, the list includes Ping An Bank, Midea Group and Zixin Pharmaceutical, among others. Companies from the new index reflect a wide cross-section of the industry, with specializations covering hardware development, technology and services as well as Blockchain applications. If the Penghua Fund proposal is successful, many other asset managers will probably follow suit with their own fund proposals. Even now, when the Blockchain sector is still in its infancy, deepening political guidelines and the growing number of established companies in the industry may increase the popularity of national ETFs related to Blockchain. Technical Market Overview: The BTC/USD pair has been trading inside of a tight range located between the levels of $7,461 - $7,195. At the top of this range, another Pin Bar candlestick pattern has been made, which might indicate a possibility of a wave down. The key technical resistance is still located at the level of $7,601, so any rally higher must break through this level. On the other hand, the key technical support is seen at the level of $6,938. Weekly Pivot Points: WR3 - $8,243 WR2 - $7,942 WR1 - $7,641 Weekly Pivot Point - $7,288 WS1 - $6,995 WS2 - $6,660 WS3 - $6,345 Trading Recommendations: The best strategy in the current market conditions is to trade with the larger timeframe trend, which is still down. All the shorter timeframe moves are still being treated as a counter-trend correction inside of the uptrend. When the wave 2 corrective cycles are completed, the market might will ready for another impulsive wave up of a higher degree and uptrend continuation.
|
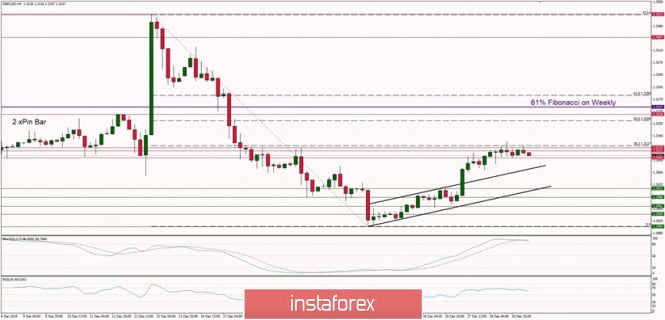
| Technical analysis of GBP/USD for 31/12/2019: Posted: 30 Dec 2019 11:38 PM PST Technical Market Overview: The GBP/USD pair has broken out form the short-term channel around the level of 1.3025 and is rallied towards the 38% of the Fibonacci retracement located at the level of 1.3137 where it was capped. Currently, the market is trading inside of a narrow resistance zone located between the levels of 1.3101 - 1.3131, so any breakout higher will directly expose the Fibonacci retracement. Please notice, the strong and positive momentum which is behind the move up, but please notice as well the overbought market conditions that may lead to the corrective cycle. The nearest technical support is located at the level of 1.3012. Weekly Pivot Points: WR3 - 1.3395 WR2 - 1.3256 WR1 - 1.3182 Weekly Pivot Point - 1.3041 WS1 - 1.2971 WS2 - 1.2819 WS3 - 1.2756 Trading Recommendations: The best strategy for current market conditions is to trade with the larger timeframe trend, which is up. All downward moves will be treated as local corrections in the uptrend. In order to reverse the trend from up to down, the key level for bulls is seen at 1.2756 and it must be clearly violated. The key long-term technical support is seen at the level of 1.2231 - 1.2224 and the key long-term technical resistance is located at the level of 1.3509.
|
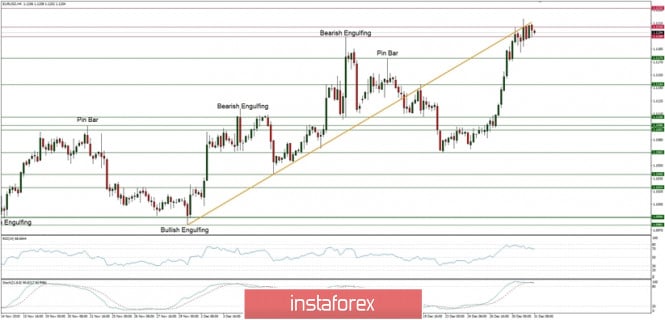
| Technical analysis of EUR/USD for 31/12/2019: Posted: 30 Dec 2019 11:35 PM PST The market is consolidating the recent gains Technical Market Overview: The EUR/USD pair has been rallying towards the swing high located at the level of 1.1199. This high has been violated and a new local high was made at the level of 1.1220. Since then, the market is consolidating the recent gains in a narrow range. Please notice, the bulls are now testing the short-term trendline resistance from below as well as the level of 1.1210 is very close to this line. Moreover, the rally might be terminated soon, despite the strong and positive momentum, the market is in the overbought conditions. The nearest technical support is seen at the level of 1.1174 and the next technical resistance is located at the level of 1.1232. Although the higher timeframes trend remains bearish, the global investors must take into account, that the EUR/USD might be finally breaking up from the multi-month Ending Diagonal pattern. Weekly Pivot Points: WR3 - 1.1349 WR2 - 1.1265 WR1 - 1.1228 Weekly Pivot - 1.1151 WS1 - 1.1114 WS2 - 1.1029 WS3 - 1.0994 Trading Recommendations: The best strategy for current market conditions is to trade with the larger timeframe trend, which is down. All upward moves will be treated as local corrections in the downtrend. The downtrend is valid as long as it is terminated or the level of 1.1445 clearly violated. There is an Ending Diagonal price pattern visible on the larget timeframes that indicate a possible downtrend termination soon. The key short-term levels are technical support at the level of 1.1040 and the technical resistance at the level of 1.1267.
|
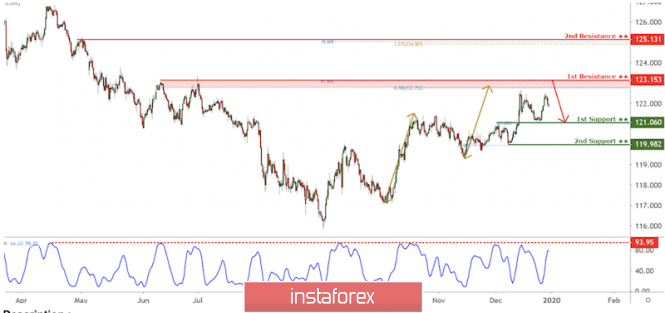
| EUR/JPY approaching resistance, potential drop! Posted: 30 Dec 2019 08:44 PM PST
Trading Recommendation Entry: 123.153 Reason for Entry: Horizontal swing high resistance, 61.8% Fibonacci retracement, 78.6% Fibonacci extension Take Profit : 121.060 Reason for Take Profit: horizontal overlap support, 61.8% Fibonacci retracement Stop Loss: 125.131 Reason for Stop loss: Horizontal swing high resistance, 78.6% Fibonacci retracement, 1.272% fibonacci extension The material has been provided by InstaForex Company - www.instaforex.com |
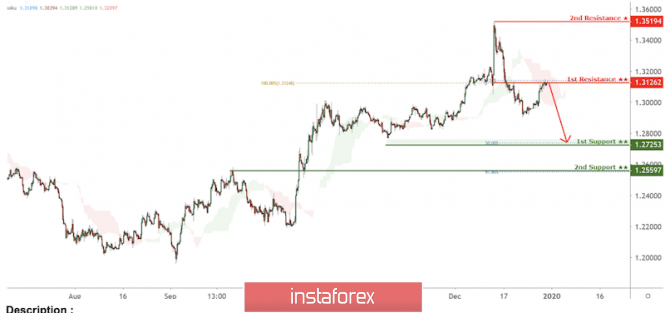
| GBP/USD approaching resistance, potential drop! Posted: 30 Dec 2019 08:43 PM PST
Trading Recommendation Entry: 1.31262 Reason for Entry: breakout level, 38.2% Fibonacci retracement Take Profit : 1.27253 Reason for Take Profit: 50% Fibonacci retracement Stop Loss: 1.35194 Reason for Stop loss: Horizontal swing high resistance The material has been provided by InstaForex Company - www.instaforex.com |
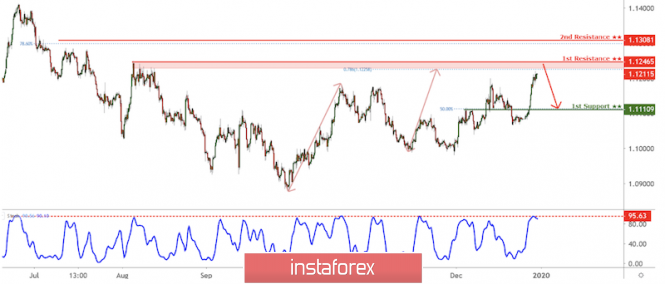
| EUR/USD approaching resistance, potential drop! Posted: 30 Dec 2019 08:41 PM PST
Trading Recommendation Entry: 1.12465 Reason for Entry: horizontal swing high resistance, 78.6% fibonacci extension Take Profit : 1.11109 Reason for Take Profit: 50% Fibonacci retracement, horizontal overlap support Stop Loss: 1.13081 Reason for Stop loss: 78.6% Fibonacci Retracement, horizontal swing high resistance The material has been provided by InstaForex Company - www.instaforex.com |
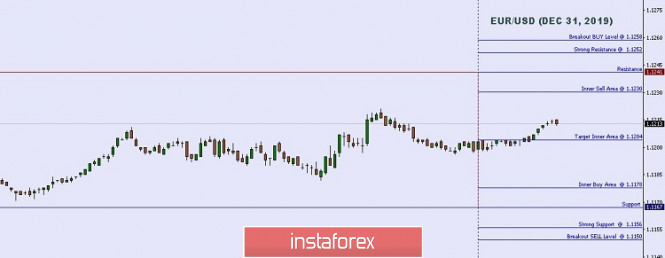
| Technical analysis: Important intraday level for EUR/USD, December 31st, 2019 Posted: 30 Dec 2019 06:56 PM PST
Breakout BUY Level: 1.1244. Strong Resistance: 1.1237. Original Resistance: 1.1226. Inner Sell Area: 1.1215. Target Inner Area: 1.1187. Inner Buy Area: 1.1159. Original Support: 1.1148. Strong Support: 1.1137. Breakout SELL Level: 1.1130.(Disclaimer) The material has been provided by InstaForex Company - www.instaforex.com |
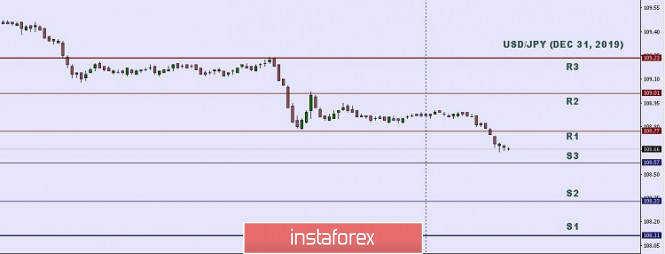
| Technical analysis: Important intraday level for USD/JPY, December 31st, 2019 Posted: 30 Dec 2019 06:53 PM PST
|
| You are subscribed to email updates from Forex analysis review. To stop receiving these emails, you may unsubscribe now. | Email delivery powered by Google |
| Google, 1600 Amphitheatre Parkway, Mountain View, CA 94043, United States | |

No comments:
Post a Comment