Forex analysis review |
- Forecast for EUR/USD on January 22, 2020
- Forecast for GBP/USD on January 22, 2020
- Forecast for USD/JPY on January 22, 2020
- Technical analysis recommendations for USD/JPY and its crosses
- GBP/USD. January 21. Results of the day. Defeat of Brexit bill in British House of Lords
- EUR/USD. January 21. Results of the day. Most Americans favor Trump's removal from office
- GBP/USD. British labor market has pleased, but do not rush with purchases
- EUR/USD: euro is trying to find the bottom
- USDCAD continues sideways
- USDJPY at major resistance area
- Gold short-term target at $1,578
- January 21, 2020 : GBP/USD Intraday technical analysis and trade recommendations.
- January 21, 2020 : EUR/USD Intraday technical analysis and trade recommendations.
- EUR/USD. January 21. We are waiting for a breakout of the low level of 1.1086 and sell according to the general mood of the
- GBP/USD. January 21. The pound does not want to go down, however, it can resume falling around the level of 1.3100
- Evening review for EURUSD for 01/21/2020
- Trading plan for EUR/USD for January 21, 2020
- BTC analysis for 01.21.2020 - Consolidaio around the critical pivot at the price of $6.400, watch for rejection or breakout
- Gold 01.21.2020 - Strong rejection frrom our pivot level on the Gold at the price of $1.562, watch for selling opportunities
- EUR/USD for January 21,2020 - Sell zone on the EUR and overrbought condition, potential for testing 1.1070
- Technical analysis of AUD/USD for January 21, 2020
- The dollar is ready for surprises
- Oil soared high but sat low
- Simplified wave analysis of GBP/USD and USD/JPY on January 21
- Pound: one step forward, two steps backward
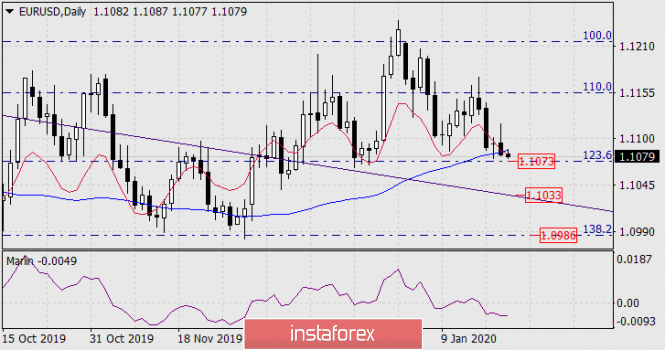
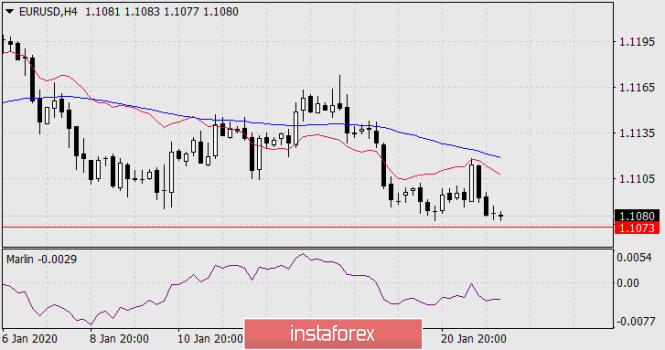
| Forecast for EUR/USD on January 22, 2020 Posted: 21 Jan 2020 07:52 PM PST EUR/USD ZEW Institute showed excellent business sentiment on Tuesday in the eurozone: the ZEW Economic Sentiment index in Germany grew from 10.7 to 26.7 in January while 15.2 was expected; in the eurozone as a whole, the index grew from 11.2 to 25.6 against the forecast of 16.3. According to the first reaction, the euro climbed, but the day ended with a decrease of 12 points, which confirms the intention of investors not to change their strategy and continue to buy the dollar in the medium term. On the daily chart, today opened below the MACD (blue moving) line, which also indicates the market's intention to continue to move down today. The goal of supporting the embedded line of the price channel 1.1033 is open. The direct signal to open a position will be the price overcoming the Fibonacci level of 123.6% at the price of 1.1073. On the four-hour chart, yesterday's short-term growth was stopped by the red indicator line of balance, which can be read as growth "within the permissible limits". The signal line of the Marlin oscillator has turned from the boundary with the territory of growth. Overcoming the first goal by price opens the second at the Fibonacci level of 138.2% (1.0986). The material has been provided by InstaForex Company - www.instaforex.com |
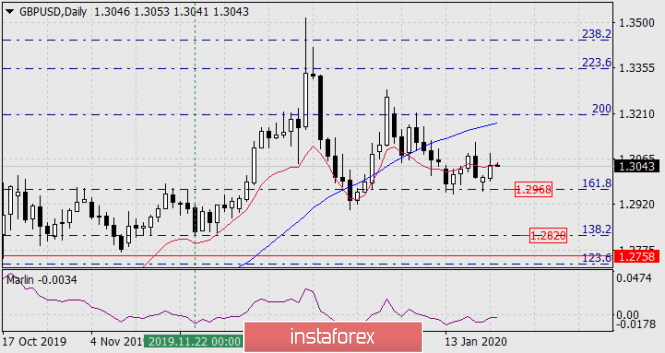
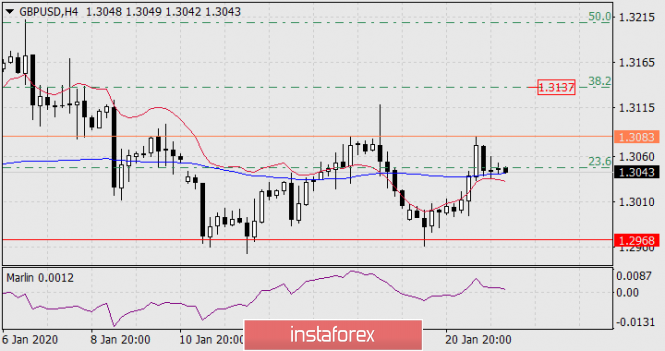
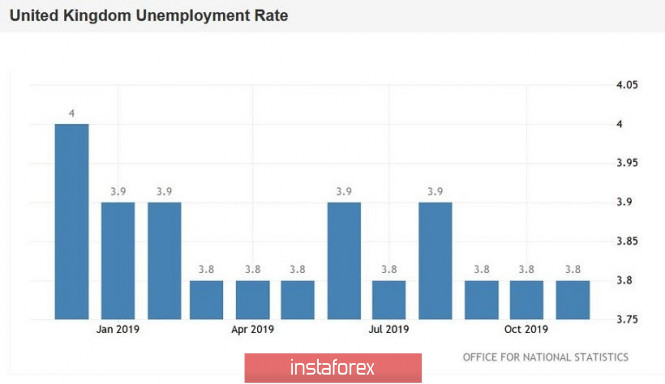
| Forecast for GBP/USD on January 22, 2020 Posted: 21 Jan 2020 07:51 PM PST GBP/USD Optimistic employment data came out in the UK yesterday: 14.9 thousand applications for unemployment benefits were filed in December against the forecast of 22.6 thousand, total employment increased by 208 thousand (in November) against the forecast of 110 thousand, the average level of wages increased by 3.2% in November against the expectation of 3.1%. The overall unemployment rate remained at 3.8%. The data are optimistic primarily in the light of monetary policy - investors have an opinion that the Bank of England will not lower the rate at the next meeting on January 30th. On the daily chart, the price is exactly on the line of balance and the signal line of the Marlin oscillator, remaining in the zone of negative values, is still near the boundary - the situation is neutral. If the market decides to move down from current levels, then the immediate target will be the Fibonacci level of 161.8% at the price of 1.2968. Overcoming of which, in turn, will open the second target 1.2820 - the low of November 22 at the Fibonacci level of 138.2%. On a four-hour chart, the price is located on the MACD line, Marlin in the zone of positive values - in the growth zone. Overcoming yesterday's high price opens a bullish local target 1.3137 at a correction level of 28.2% of the December 13-23 movement. Consolidating the price under the MACD line, below 1.3037, will return to the market a downward mood relative to the British currency. The material has been provided by InstaForex Company - www.instaforex.com |
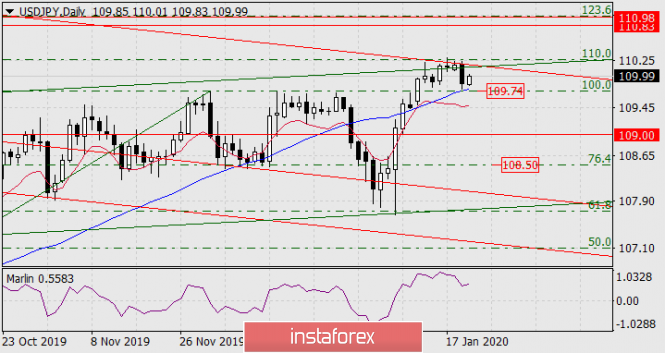
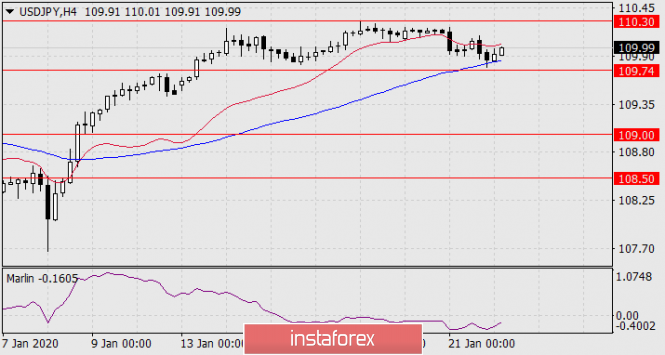
| Forecast for USD/JPY on January 22, 2020 Posted: 21 Jan 2020 07:50 PM PST USD/JPY The dollar lost 30 points against the yen on Tuesday following the fall of the stock market (S&P 500) by 0.27%. The reason was a certain Chinese virus that caused the death of several people. We are very far from the perception of the local outbreak of the flu for the global epidemic, but, as it has been more than once in the last decade, pharmaceutical companies may well make a fuss and pull down markets using another cause of the disease. Today, the Chinese China A50 is down 1.21% in the Asian session, while the Japanese Nikkei225 is up 0.31%. The stability of the Japanese market helps the yen stay in the range of Fibonacci levels of 100.0-110.0% on the daily chart. Consolidating the price under yesterday's low formally opens 108.50 at the Fibonacci level of 76.4%, but there are many obstacles to it from earlier record levels, 109.00 looks the most powerful - July 10 last year high and May 13 low. Overcoming the price peak on January 17 (110.30) may delay or stop the panic and send the price to the range of 110.83/98. On a four-hour chart, the price is above the MACD line. Consolidating under it, which will automatically mean also consolidating below the MACD line of a higher scale, will unfold a complex, multivariant scenario of pulling down. The material has been provided by InstaForex Company - www.instaforex.com |
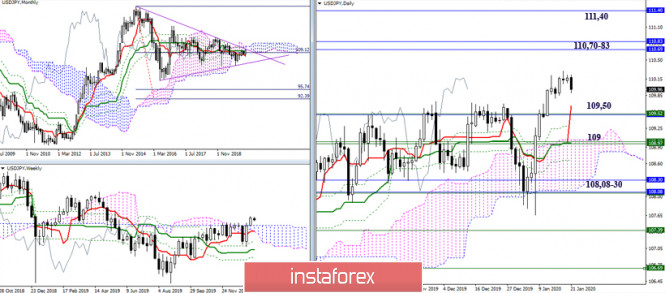
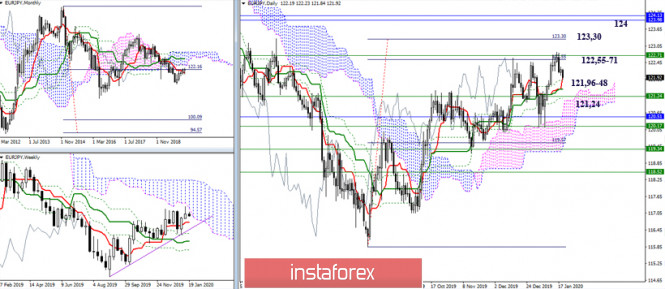
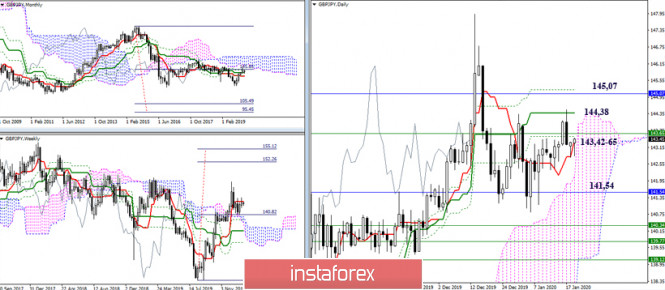
| Technical analysis recommendations for USD/JPY and its crosses Posted: 21 Jan 2020 04:15 PM PST USD / JPY The yen began in 2020 with the realization of what did not work out last year. So far, the pair closed the week in the bullish zone of the relative weekly cloud. Now, the main task of the players is fixing in this zone to increase in the near future. After that, monthly resistance will follow 110.70 - 110.83 - 111.40. However, breaking through the monthly boundaries is a more difficult task, since this will eliminate the monthly dead cross and mark the exit to the bullish zone of the relative Ichimoku cloud at the most upper time. In this situation, support is located at 109.50 (weekly cloud + monthly medium-term trend + daily short-term trend) - 109 (weekly Tenkan and the lower border of the cloud + daily Kijun and the upper border of the cloud) - Fixing below 108.08-30 can move players away from their goals for a long time. EUR / JPY At the beginning of the year, the pair attempted a new test of important resistance, but the first target of the daily target for breakdown of the cloud (122.55), now strengthened by the lower border of the weekly cloud (122.71), withstood the defense again. As a result, we observe the next development of a downward correction. The nearest support is the daytime cross of Ichimoku, first Tenkan (121.96), then Kijun (121.48), as well as the most protected area 121.24 (weekly Tenkan + daytime cloud + final line of the daytime cross of Ichimoku). At the same time, securing below can significantly affect the current balance of power, opening up new prospects for players to decline. GBP / JPY The pound / yen is trying to gain a foothold and stay in the bullish zone relative to the weekly cloud, using the cloud as support. Now, the main attention of the players to increase is aimed at breaking through the weekly short-term trend (143.65) and eliminating the dead crosses of Ichimoku at the daily (144.38 - 145.21) and monthly (145.07) time intervals. Moreover, breaking through these resistance forms new horizons and opportunities before the players to increase. The nearest support, in turn, can now be identified at 141.54 (monthly medium-term trend + daily cloud) and 140.34 - 139.12 (weekly levels + lower border of the daily cloud). Fixing below will change the existing balance and can lead to an active recovery of bearish sentiment. Ichimoku Kinko Hyo (9.26.52), Pivot Points (classic), Moving Average (120) The material has been provided by InstaForex Company - www.instaforex.com |
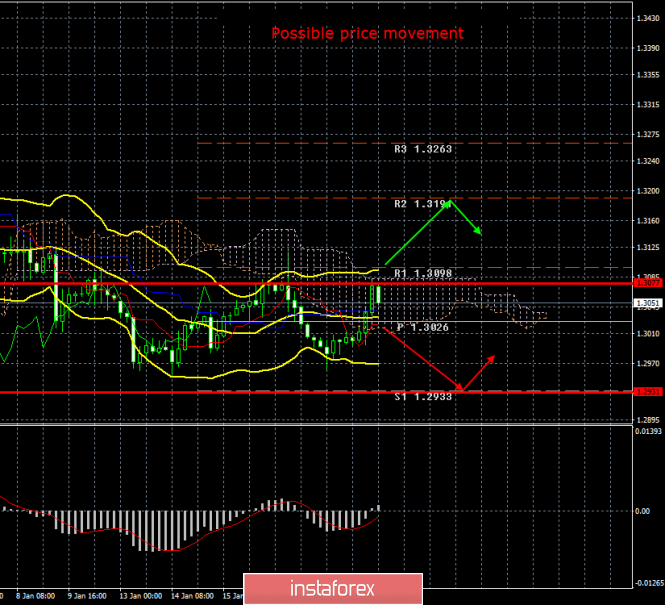
| GBP/USD. January 21. Results of the day. Defeat of Brexit bill in British House of Lords Posted: 21 Jan 2020 02:44 PM PST 4-hour timeframe Amplitude of the last 5 days (high-low): 79p - 58p - 57p - 115p - 52p. Average volatility over the past 5 days: 73p (average). The British pound on Tuesday, January 21, as well as the euro, adjusted most of the day. The pound/dollar pair managed to enter the Ichimoku cloud and work out its upper boundary, which could not be overcome the first time. At the moment, we can state a rebound from the Senkou Span B line, which can return the pair to a downward channel. The upper line of the volatility channel was also worked out - the level of 1.3077, from which a rebound also occurred. As a result, at the moment, we can say that the prospects for upward movement in the British currency remain very vague. Bulls remain extremely weak. Quotes fail to overcome key resistance levels on their way up. Thus, if the pair regains consolidation below the critical Kijun-sen line, we can conclude that the downward trend will resume. Or downward movement, at least to the lower Bollinger band. Today's macroeconomic statistics came down to publications in the UK. Here, three macroeconomic reports were published immediately, from which traders finally expected not disastrous values. Despite the current weakness of the British economy, wages have shown steady growth since 2017, so this indicator did not cause much concern. And so it turned out in practice. The average salary including bonuses showed an increase of 3.2% with a forecast of 3.1%. Without premiums - 3.4% with a similar forecast. More attention was focused on the unemployment benefit application rate, which was also "on top", amounting to only 14,900 with expert forecasts of 22,600. The unemployment rate was expected to remain unchanged at 3.8%. Thus, today's package of macroeconomic statistics turned out to be positive for the first time in a long time. The pound has received the support of market participants, but we believe that key indicators of the British economy remain extremely weak, reports on wages and unemployment are clearly not enough to count on an upward trend for the pound. Meanwhile, the pun in the British Parliament continues, however, this time without consequences. Immediately after the party of Boris Johnson won the election in December, the fate of Brexit was considered decided. The Conservative party won a majority in the Lower House of Parliament, respectively, no longer depended on the opposition forces and voted for the "deal" between Boris Johnson and the EU without problems. It would seem that only formalities remained: the approval of the same deal by the European Parliament (which there is no point in blocking this agreement) and its approval by the House of Lords. And it turned out that the House of Lords, in which Johnson does not have a majority, refused to accept the agreement with the EU, making amendments to some points. In particular, we are talking about the need for a physical document for EU residents to legally reside in the UK, as well as for depriving ministers of the right to decide which decisions of the European Court will be rejected by local courts. In general, the bill returns to the House of Commons, where another vote will take place, which may block the demand of the House of Lords by a simple majority. The technical picture of the currency pair remains essentially the same. The pair failed to gain a foothold above all the lines of the Ichimoku indicator, therefore, upward prospects are still absent. We expect the resumption of the downward movement to the support level of 1.2933. Only overcoming the Senkou Span B line and the first resistance level of 1.3098 can contribute to the formation of a new upward trend, however, fundamental factors remain not on the side of the British pound. The country is still moving into the future without the EU and is already suffering enormous financial losses due to this gap. In 2020, the situation is unlikely to change. Although Donald Trump announced a trade agreement with Great Britain during his speech at the Davos International Economic Forum, while calling Johnson "smart," this does not mean that this deal will be signed in the near future. The Bank of England is still looking to lower the key rate, and its head Mark Carney resigns. Trading recommendations: GBP/USD remains downside. Thus, traders are advised to resume sales of the pound/dollar pair with the target of 1.2933, after the correction is completed and the pair is consolidated below the Kijun-sen line. It is recommended that purchases of British currency be returned no earlier than the price consolidation above the Senkou Span B line and the level of 1.3098 with the first target of 1.3191. Explanation of the illustration: Ichimoku indicator: Tenkan-sen is the red line. Kijun-sen is the blue line. Senkou Span A - light brown dotted line. Senkou Span B - light purple dashed line. Chikou Span - green line. Bollinger Bands Indicator: 3 yellow lines. MACD indicator: Red line and bar graph with white bars in the indicators window. Support / Resistance Classic Levels: Red and gray dashed lines with price symbols. Pivot Level: Yellow solid line. Volatility Support / Resistance Levels: Gray dotted lines without price designations. Possible price movements: Red and green arrows. The material has been provided by InstaForex Company - www.instaforex.com |
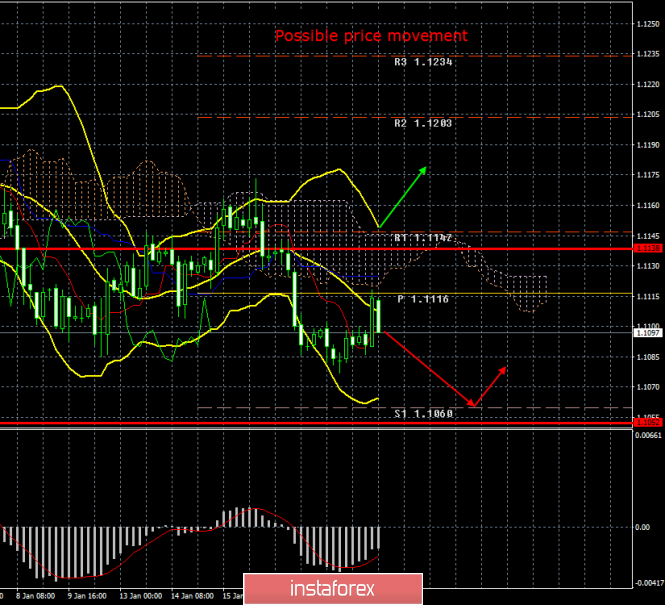
| EUR/USD. January 21. Results of the day. Most Americans favor Trump's removal from office Posted: 21 Jan 2020 02:44 PM PST 4-hour timeframe Amplitude of the last 5 days (high-low): 41p - 44p - 45p - 57p - 25p. Average volatility over the past 5 days: 43p (average). The second trading day of the week ends for the EUR/USD pair with a rapid rise and the next no less rapid fall following it. At least that's how it looks in the graph, but in fact the pair went as much as 25 points up and now down. Thus, the current total volatility of the day is 32 points. Needless to say, this is the lowest value of volatility, which means that, in fact, no trading was conducted today, and the emptiness of the calendar of macroeconomic events can be stated without even looking at the calendar itself. The main thing is that the euro/dollar pair has made a correction and can now resume the downward movement, which, as we are tired of repeating, has all the necessary fundamental and macroeconomic reasons. The bulls remain extremely weak, and now only the bears, which regularly increase their shorts, and from time to time take profits, are trades, which leads to corrections. Thus, now we expect the resumption of the downward trend. As we have already said, there were few macroeconomic publications today. There were no important ones at all. Information was received from the ZEW Institute that the index of moods in the business environment of Germany rose to 26.7, although the forecasts were significantly lower (15.0), the index for assessing current economic conditions in Germany was -9.5 (with the forecast - 13.5), and the index of economic sentiment in the eurozone was 25.6 with a forecast of 5.5. Thus, it turns out that the current economic conditions are assessed as negative, but investor sentiment is growing, which perhaps means that the business climate is starting to improve in the EU countries. Although it is too early to draw such conclusions, it is better to look at the indices of business activity and draw conclusions on them. Meanwhile, the European Central Bank conducted a study according to which the demand for loans from an EU enterprise decreased in the fourth quarter of 2019 for the first time since 2013. Interest rates in the European Union, of course, remain ultra-low. Banks continue to expect that in 2020 the demand for bank loans will remain stable, we also believe that one decrease over six full years is not an indicator of decline. However, there is a bad call in itself. If in 2020 the demand for loans begins to fall at such low rates, then the EU economy may begin to suffer even more. And the central bank will have to further lower the key refinancing rate. But the demand for housing loans, as well as for consumer loans, continues to increase, which is good for the EU economy. But since any economy is repelled from the production of goods and services in the first place, corporate loans are, of course, more important. Meanwhile, Christine Lagarde, the head of the ECB, according to many experts, is preparing to conduct the most ambitious revision of the central bank's strategy since 2003. This process can last about a year, and many landmarks will be revised in accordance with new realities and changes in the world in recent years and even decades. Most experts are skeptical of the revision of the strategy, as officials have not been able to accelerate inflation over the past ten years, despite the fact that the ECB does not abandon the quantitative stimulus program and uses a policy of ultra-low rates. Despite the fact that macroeconomic indicators of the eurozone remain rather weak, and business activity indexes in the manufacturing sector, as well as industrial production itself, continue to decline and lose growth, experts do not expect a revision of monetary policy parameters at the next ECB meeting, which will take place this Thursday . It is expected that the main topic during the two-day meeting of the ECB will be inflation, the reasons for its low value, the reasons for the failure to stimulate economic growth through all the same inflation. At the same time, a poll was conducted in the United States regarding Donald Trump and his impeachment. About 1,200 Americans over the age of 18 were interviewed over the phone. The error of the study is not more than 3-4%. The main questions asked by the Americans were: 1) Do they support the impeachment of Trump? 51% were in favor, 45% were against. 2) Should the Senate sitting include the testimonies of new witnesses? 69% were in favor. 3) 58% of Americans believe the evidence, which indicates that Trump really took advantage of his official position to put pressure on Ukraine. 4) 57% believe that Trump impeded Congress. These are the results that, despite Trump's statements at the international economic forum, which takes place at the same time in Davos, about "America's prosperity as never before," suggests otherwise. As before, a fairly large number of Americans do not support Trump's policies and do not want him to be re-elected for a second term. It remains to wait for the results of the Senate meeting. The technical picture of the euro/dollar pair implies the resumption of the downward movement. At the moment, the correction has reached the pivot level of 1.1116 and this may end safely. Trading recommendations: EUR/USD may resume a downward movement. Thus, it is recommended that you either hold open shorts with targets 1.1060 and 1.1052, or open new ones with new signals (MACD turn down or a rebound from the Kijun-sen line). It will be possible to consider purchases of the euro/dollar pair no earlier than the traders of the Senkou Span B line overcome with the first goal the resistance level of 1.1203. Explanation of the illustration: Ichimoku indicator: Tenkan-sen is the red line. Kijun-sen is the blue line. Senkou Span A - light brown dotted line. Senkou Span B - light purple dashed line. Chikou Span - green line. Bollinger Bands Indicator: 3 yellow lines. MACD indicator: Red line and bar graph with white bars in the indicators window. Support / Resistance Classic Levels: Red and gray dashed lines with price symbols. Pivot Level: Yellow solid line. Volatility Support / Resistance Levels: Gray dotted lines without price designations. Possible price movements: Red and green arrows. The material has been provided by InstaForex Company - www.instaforex.com |
| GBP/USD. British labor market has pleased, but do not rush with purchases Posted: 21 Jan 2020 02:44 PM PST Before traders of the GBP/USD pair had time to get used to the idea that the Bank of England would soon resort to a preventive rate cut, the British labor market was surprised by an unexpected increase. The British economy has recently regularly surprised investors, though, as a rule, in a negative context. The country's GDP is declining, inflation has been growing at the slowest pace since 2016, retail sales have completely collapsed into the negative region, despite the pre-holiday December period. With each report of this kind, the probability of a decrease in the interest rate naturally increased, all the more so as the dovish sentiment was fueled by the relevant comments of the representatives of the English regulator. Today's release on the growth of the British labor market could complement the general fundamental picture for the GBP/USD pair - the puzzle finally developed if the numbers came out in the red zone. However, British labor market data supported the pound. Despite a significant increase in applications for unemployment benefits, the pair adjusted almost to the boundaries of the 31st figure. Traders drew attention to the positive aspects of the release: firstly, the unemployment rate remained at a record low value of 3.8%, and secondly, the level of salaries (including premiums) remained at 3.2% in annual terms, although experts predicted a decline to a three percent level. As for the number of applications for unemployment benefits, the situation here is as follows. According to forecasts of many economists, this figure was supposed to exceed multi-year highs in December. According to some estimates, it could jump to 40 thousand, while others said it could reach up to 55 thousand. But in reality, this indicator came out at the level of the previous month, that is, at around 14 thousand. In other words, the result itself is not positive, however, given previous expectations, it fully satisfied the bullish appetite. All this made it possible for the pair to demonstrate a small correctional growth. By and large, GBP/USD buyers became active only for one reason - market participants doubted that members of the BoE would lower their interest rates at the January meeting, which will be held next Thursday. Three members (out of nine) of the Committee are guaranteed to vote for a cut in the rate - from among those who have publicly stated the need for easing monetary policy (Vlieghe, Saunders and the recently joined Tenreyro). But most of their colleagues can still give the British economy another chance to independently get out of this situation. At least this logic guides the buyers of the GBP/USD pair. Last week, the likelihood of monetary easing on January 30 was almost 80%. At the moment, the chances are down to 65%. And yet, in my opinion, the position of the British currency looks precarious. Traders of the pair were too emotional about the release of data on the labor market, as it was the only one of many releases that supported the pound. Nevertheless, the rest of the statistical reports cannot be saved - the members of the English regulator will either have to "close their eyes" to them or react accordingly. And even if members of the Bank of England do not dare to lower their rates next Thursday, they can take an extremely soft position - right up to the announcement of easing monetary policy at one of the next meetings. Therefore, the euphoria of GBP/USD bulls is unlikely to be long. Also, remember that the pound remains vulnerable due to the Brexit factor. Let me remind you that recently the pair plunged into the region of the 29th figure not only because of a series of disappointing statistics. The British finance minister, Sajid Javid, also had an influence on the Briton. He also said that after Brexit "there will be no trade agreements with the EU." According to the minister, large companies "had three years to prepare for a change in trade relations with the European Union." Such harsh statements worried market participants, after which the pound lost its foothold and fell into the 29th figure. It is worth noting that during the transition period, officials and (especially) politicians (both British and European) will voice a variety of speculative statements, as the negotiations between Brussels and London promise to be difficult. And each such speech will exert strong pressure on the British currency, slowing the upward trend of GBP/USD or strengthening the downward one. Thus, the pair's traders got a reason for corrective growth today, however, it is impossible to speak about long-term upward movement. After the first emotions from today's release come to naught, the price will return to the bottom of the 30th figure with a possible test of 29 price levels. The negative macroeconomic reports that were published earlier this year will continue to crush the pair - until January 30, when the BoE does not reach a verdict. The material has been provided by InstaForex Company - www.instaforex.com |
| EUR/USD: euro is trying to find the bottom Posted: 21 Jan 2020 02:44 PM PST Although central banks claim that they cannot cope with Donald Trump's protectionist policies alone and call for national fiscal stimulus, the IMF believes that their aggressive monetary expansion will make a significant contribution to the first acceleration of global economic growth in three years. If it were not for the Federal Reserve, which lowered the interest rate three times in 2019, not the ECB, which revived the program of quantitative easing, nor the remaining 47 central banks, which reduced borrowing costs a total of 67 times last year, the global GDP would not have been calculated at 0.5%. Thus, the indicator is likely to expand in 2020 from 2.9% to 3.3%. According to representatives of the IMF, a truce in the trade war of Washington and Beijing will also contribute to the restoration of the global economy. If the latter continued, then global GDP would not have been calculated at 0.8%. And so the loss will be only 0.5%, since the lion's share of trade tariffs continues to operate. Experts of a reputable organization believe that the global economy has groped the low and, thanks to the positive from the manufacturing sector and business investment, will gradually go uphill. The IMF expects that in 2020 the growth rate of US and Chinese GDP will slow down (from 2.3% to 2% and from 6.1% to 6%, respectively), while international trade, on the contrary, will accelerate (from 1% to 2, 9%). Meanwhile, the uncertainty in the global economy remains, because the trade truce of the United States and China is not the same as the trading world. However, the first step has been taken, a precedent has been set, and other countries can follow their example. France has decided to postpone the introduction of a digital tax. In response, the United States promised not to increase duties on French imports until the end of 2020. This news made it possible for the EUR/USD pair to suspend a three-day decline, although the situation in US-EU trade relations remains tense. According to Bundesbank estimates, an increase in US tariffs on deliveries of cars from Europe to 25% will deduct 0.25% from GDP in the eurozone. Moderate optimism from the IMF, as well as a truce between Washington and Paris, give the single European currency a chance to find the ground under its feet. EUR/USD rebounded off from a 3.5-week low of 1.1075 and returned to the 1.1100 area. Fans of the euro are counting on both improving assessments of the current state of the eurozone economy from the ECB, and positive from German and European business activity. A pleasant surprise to the bulls on EUR/USD can be presented by Trump at the economic forum in Davos. Two years ago, the US leader had already declared there the dangers of a strong dollar. Why shouldn't he do the same now? This would allow the bulls to storm the resistance at 1.1110 and go on a counterattack. The material has been provided by InstaForex Company - www.instaforex.com |
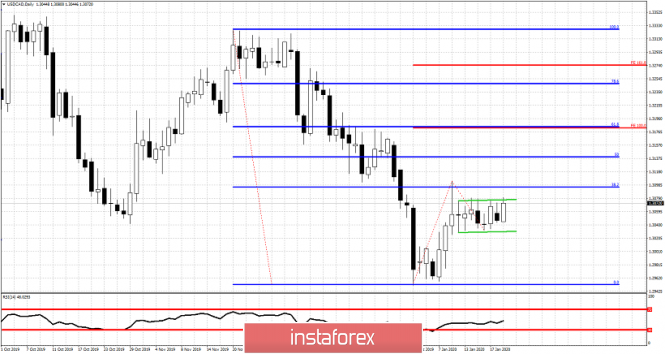
| Posted: 21 Jan 2020 02:09 PM PST USDCAD has made no real progress since our last analysis was posted. Price continues to move sideways in a bullish flag pattern. If price breaks above 1.31-1.3085 we should expect Gold price to reach $1,575 or higher.
Green lines - bullish flag Red lines - expected targets USDCAD is moving sideways below the 38% Fibonacci retracement. If resistance at 1.31 fails to hold I expect 61.8% Fibonacci retracement. USDCAD is forming higher lows and if we see a break above 1.3105 then we will be more confident of reaching 1.3180. Support remains at 1.3030. Soon I believe price will exit the consolidation and start a new move. The material has been provided by InstaForex Company - www.instaforex.com |
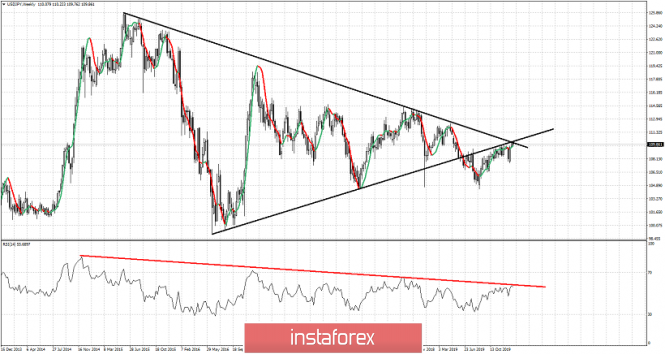
| USDJPY at major resistance area Posted: 21 Jan 2020 02:02 PM PST In our previous posts I mentioned the importance of the resistance area around 110-110.25. Price is showing reversal signs as we get a price rejection. The RSI indicator is also getting rejected. This is bearish sign.
Black lines - triangle pattern Red line - RSI resistance trend line USDJPY is challenging the very important resistance area of 110. At current levels I prefer to be bearish as price is very close to resistance/stop level. My risk is very low and the potential reward is a pull back towards 109 at least. The long-term triangle pattern has been broken downwards and we now witness a back test. Next major support is at 107.55. Bulls need to protect this otherwise we could see 106-105. The material has been provided by InstaForex Company - www.instaforex.com |
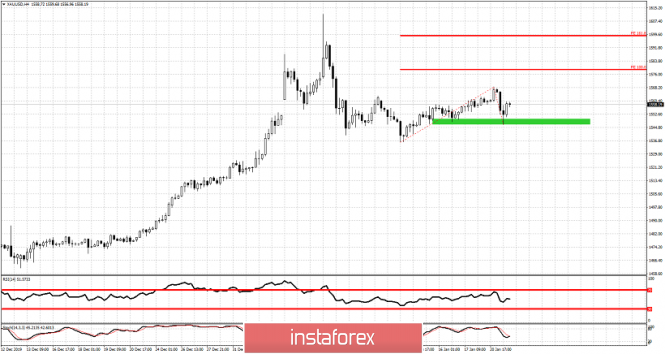
| Gold short-term target at $1,578 Posted: 21 Jan 2020 01:57 PM PST Gold price was under pressure at the beginning of the trading session today and price pulled back towards the short-term support area of $1,548-50 area. Price respected support and bounces off that area challenging again the short-term resistance at $1,565-60.
Red Fibonacci extension - possible targets Gold price has so far created a higher low with today's pull back. Resistance is at $1,565-68 and a break above this level will push price towards $1,578 or even $1,598. Short-term trend is bullish and a move above $1,568 will confirm this strength. On the other hand bears want to see price break below $1,548 for a move towards $1,510. At this point I believe that the most probable and best scenario to trade, is the bullish one. The material has been provided by InstaForex Company - www.instaforex.com |
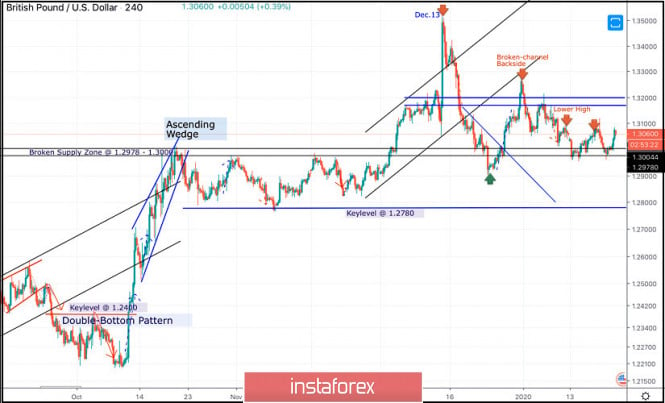
| January 21, 2020 : GBP/USD Intraday technical analysis and trade recommendations. Posted: 21 Jan 2020 07:40 AM PST
On December 13, the GBPUSD pair looked overpriced around the price levels of 1.3500 while exceeding the upper limit of the newly-established bullish channel. On the period between December 18 - 23, bearish breakout below the depicted channel followed by initial bearish closure below 1.3000 were demonstrated on the H4 chart. However, earlier signs of bullish recovery were manifested around 1.2900 denoting high probability of bullish pullback to be expected. Thus, Intraday technical outlook turned into bullish after the GBP/USD has failed to maintain bearish persistence below the newly-established downtrend line. That's why, bullish breakout above 1.3000 was demonstrated allowing the recent Intraday bullish pullback to pursue towards 1.3250 (the backside of the broken channel) where bearish rejection and another bearish swing were suggested for conservative traders in previous articles. Moreover, two descending highs were recently demonstrated around 1.3120 and 1.3090 which enhances the bearish side of the market. Intraday technical outlook remains bearish as long as the pair maintains is movement below 1.3120. Conservative traders should wait for bearish breakdown below 1.2980, This is needed first to enhance further bearish decline towards 1.2900, 1.2800 and 1.2780 where the backside of the previously-broken downtrend is located. In the Meanwhile, Intraday traders can watch any bullish pullback towards the depicted price zone (1.3170 - 1.3200) for bearish rejection and another valid SELL entry with intraday bearish targets projected towards 1.3000 and 1.2980. On the other hand, any bullish breakout above 1.3100-1.3120 (the recently established descending high) invalidates the intraday bearish scenario. Thus, further bullish pullback would be expected towards 1.3200. The material has been provided by InstaForex Company - www.instaforex.com |
| January 21, 2020 : EUR/USD Intraday technical analysis and trade recommendations. Posted: 21 Jan 2020 07:39 AM PST
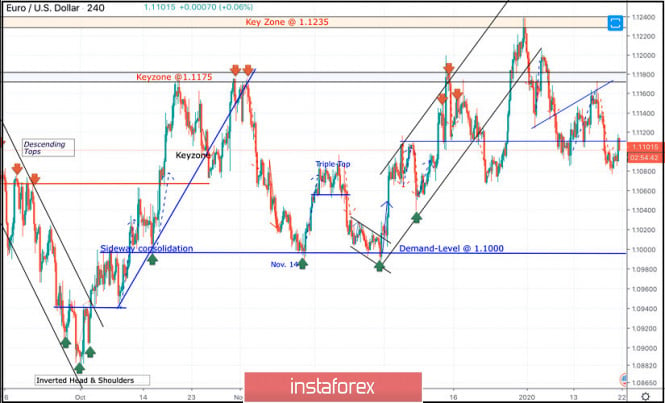
Since November 14, the price levels around 1.1000 has stood as a significant DEMAND-Level offering adequate bullish SUPPORT for the pair on two successive occasions. During this Period, the EUR/USD pair has been trapped within a narrow consolidation range between the price levels of 1.1000 and 1.1085-1.1100 (where a cluster of supply levels and a Triple-Top pattern were located) until December 11. On December 11, another bullish swing was initiated around 1.1040 allowing recent bullish breakout above 1.1110 to pursue towards 1.1175 within the depicted short-term bullish channel. Initial Intraday bearish rejection was expected around the price levels of (1.1175). Moreover, On December 20, bearish breakout of the depicted short-term channel was executed. Thus, further bearish decline was demonstrated towards 1.1065 where significant bullish recovery has originated. The recent bullish pullback towards 1.1235 (Previous Key-zone) was suggested to be watched for bearish rejection and another valid SELL entry. Suggested bearish position has achieved its targets while approaching the price levels around 1.1110. As expected, the Key-Level around 1.1110 has provided some bullish rejection. That's why, the previous bullish pullback was expected to pursue towards 1.1140 and 1.1175 where the depicted key-zone as well as the recently-broken uptrend are located. Recent signs of bearish rejection were demonstrated around 1.1175. That's why, further bearish decline was anticipated towards 1.1110. For the bearish side of the market to dominate, bearish persistence below 1.1110 is needed to enable further bearish decline towards 1.1060 and probably 1.1040. Trade recommendations : Intraday traders can consider the current bullish pullback towards 1.1120-1.1135 as another valid SELL signal. Bearish projection target to be located around 1.1060. Any bullish breakout above 1.1175 invalidates the mentioned bearish trading scenario. The material has been provided by InstaForex Company - www.instaforex.com |
| Posted: 21 Jan 2020 07:11 AM PST EUR/USD - 4H.
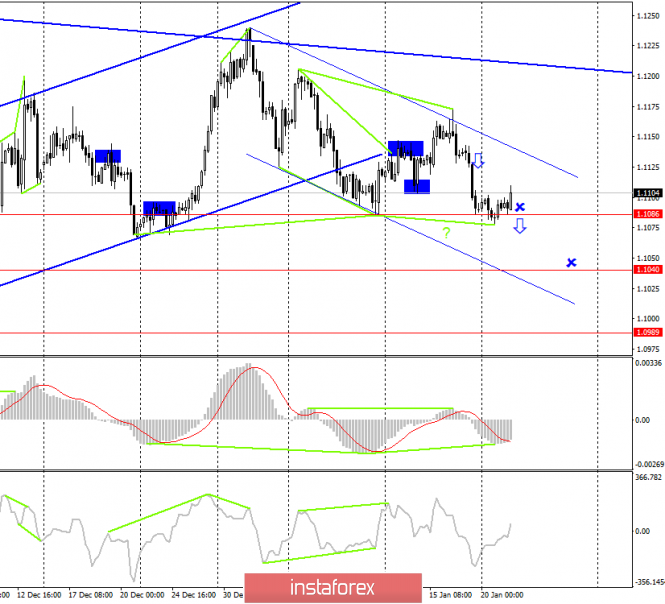
As seen on the 4-hour chart, EUR/USD pair reversed in favor of the European currency after the formation of a bullish divergence of the MACD, and begin the process of growth towards the upper area of the downward trend of the corridor. It often happens that instead of turning in the direction of the trend, there is a closure outside the corridor, so you should be careful in the upper area of the corridor. I believe that there is a possibility of a new fall of the euro-dollar pair, however, it is better to identify this option by closing the pair's rate below the low level of 1.1086. In this case, traders will be able to count on a further drop in quotes in the direction of the low level of 1.1040. So far, we are dealing with only a small pullback up. The information background today is unlikely to help the euro currency go too high. Research by the ZEW Institute has shown slightly better results than traders expected, however, reports on the mood in the business environment and on the assessment of current economic conditions are unlikely to be of much interest to traders. Forecast for EUR/USD and trading recommendations: The long-term trading idea remains valid, as the pair's quotes have performed a consolidation under the upward corridor on the 24-hour chart. Traders still have a long-term target for a fall near the level of 1.0850. Terms of execution - 2-3 weeks. The short-term trading idea is to sell the pair with the goal of 1.1040 since the trend on the 4-hour chart is again "bearish". Since there is now a pullback, I recommend selling after closing under the previous target of 1.1086. The material has been provided by InstaForex Company - www.instaforex.com |
| Posted: 21 Jan 2020 07:10 AM PST GBP/USD - 4H.
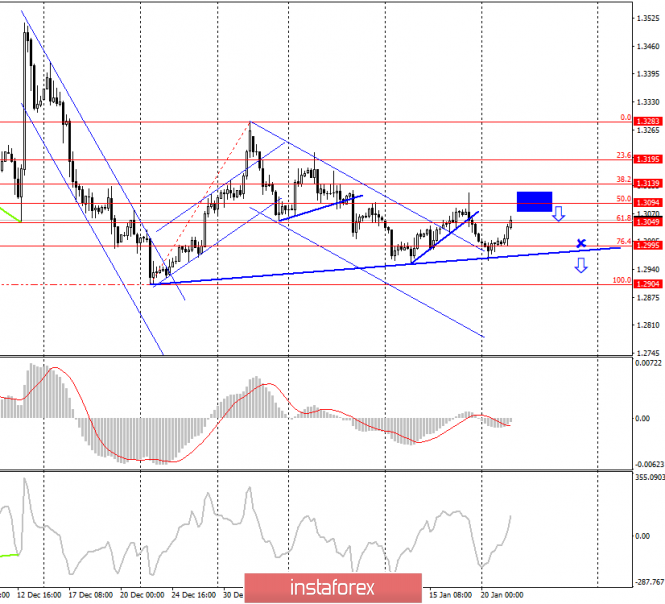
As seen on the 4-hour chart, the GBP/USD pair rebounded from the new correction line and began the growth process in the direction of the previous peak level - 1.3118. Last time, the upward pullback ended near the corrective level of 50.0% (1.3094). If you look closely at the chart, it is obvious that each subsequent peak of the pair's quotes is lower than the previous one. Thus, if this trend continues, about 50.0% of traders can once again count on turn in favor of the US dollar and renewed fall in the direction of the line of correction or near the level of 76.4% (1.2995). Fixing the pair's rate under the correction line itself will work in favor of the US dollar and resuming the fall towards the levels of 1.2900 and 1.2800. For more confidence, I recommend waiting for the close below the correction line to make sure that traders are ready for a new fall in the pound-dollar pair. The information background today slightly supported the Briton, as the level of wages rose in December by 3.2% (better than forecasts), and the number of applications for unemployment benefits was lower than forecasts - 14.9 K. However, it is not yet possible to say that the pound "rose from the ashes" and is ready to conquer the top. Forecast for GBP/USD and trading recommendations: The trading idea is still in the sales of the pound. However, this time, I expect a reversal around the level of 1.3094 with a drop of about 100 points down. Or closing below the correction line and further falling by 100-200 points down. The material has been provided by InstaForex Company - www.instaforex.com |
| Evening review for EURUSD for 01/21/2020 Posted: 21 Jan 2020 05:28 AM PST
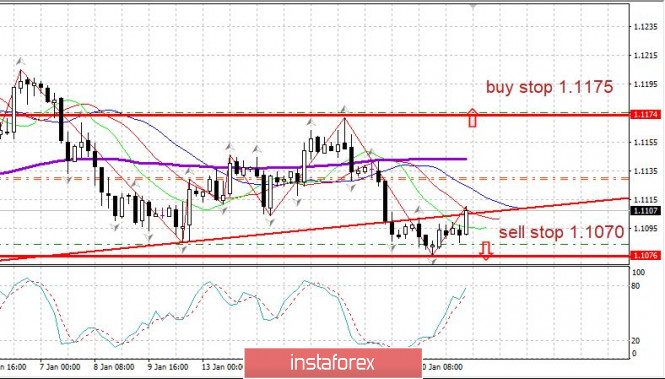
EURUSD: Market sentiment is starting to turn towards the euro from the US dollar. There is no important news. The market is waiting for ECB decisions and statements on Thursday, January 23. No one expects an ECB rate increase, but just one word from the ECB head about changing the monetary policy soon and the EURUSD market may experience very strong changes. EURUSD: Buy on a break above 1.1175. We sell at a break down of 1.1070. The material has been provided by InstaForex Company - www.instaforex.com |
| Trading plan for EUR/USD for January 21, 2020 Posted: 21 Jan 2020 05:09 AM PST
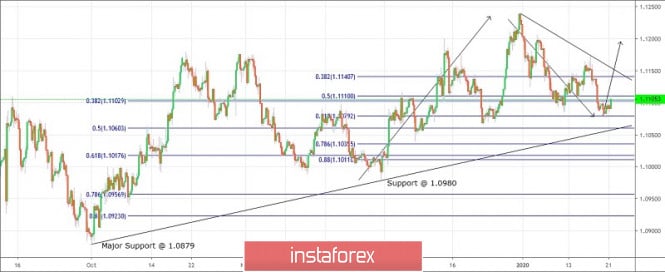
Technical outlook: EUR/USD has dropped close to the expected 1.1070 level today, before bouncing back sharply. The single currency pair is seen to be trading at around 1.1105 levels at this point in writing and could possible continue rallying further from here. Immediate resistance is seen at 1.1160/70, and a break above that would confirm that a meaningful bottom is in place at 1.1075. Also note that prices have found support around the fibonacci 0.618 retracement of the recent upswing between 1.0980 and 1.1240 respectively. Hence a significant bullish turn from todays' lows remains a high probability. On the flip side, if prices drop lower towards 1.1050 and further, please consider further buying since the bullish scenario remains intact. Immediate price support is at 1.0980 followed by 1.0879 and until prices stay above 1.0879, EUR/USD is poised to push through higher levels. The potential upside remains at 1.1500, 1.1800 and further. Trading plan: Remain long and buy more towards 1.1050, stop at 1.0879, target above 1.1500 Good luck! The material has been provided by InstaForex Company - www.instaforex.com |
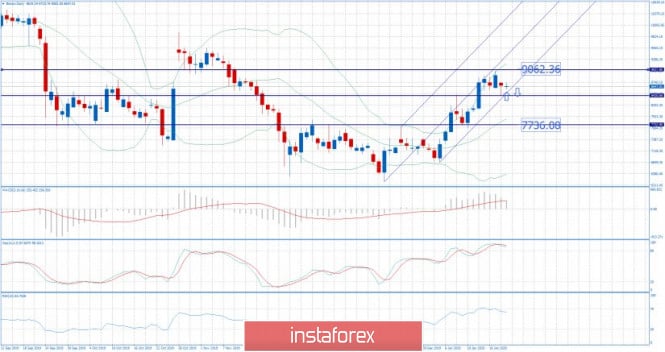
| Posted: 21 Jan 2020 05:00 AM PST Industry news: Leading cryptocurrency exchange Binance has completed its Q4 2019 burn of the Binance coin (BNB). It was the 10th quarterly token burn the exchange has done since the launch of the BNB in July 2017. The event, which took place during the weekend, saw a total of 2.2 million BNB worth more than $38 million destroyed. Although the figure represents a mere 1.1% of the total supply of BNB, it is Binance's second and third-biggest burn in terms of USD and BNB, respectively. Technical analysis:
BTC has been trading sideways at the price of $8.646. I found that the level of $8.440 is critical pivot level for BTC and further direction. In case of the downside breakout of $8.440, watch for selling opportunities on the rallies with the main target at $7.725. In case of the rejection of the pivot $8.440, watch for buying on the dips with the main target at $9.000. Stochastic is in overbought zone and we got fresh new bear cross MACD oscillator is still showing positive reading above the zero. Resistance level is seen at the price of $9.000 Main support pivots are set at $8.440 and $7.725The material has been provided by InstaForex Company - www.instaforex.com |
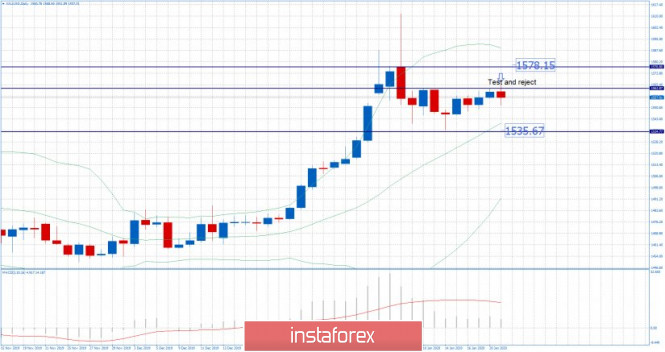
| Posted: 21 Jan 2020 04:45 AM PST Gold has been trading upwards. The price tested and rejected of my critical resistance at $1.562, which is strong sign of selling power. I expect further downside movement and potential test of $1.535.
Due to strong rejection of our critical pivot level at $1.562, watch for selling opportunities on the rallies using the lower fames 5/15 minutes. MACD oscillator is showing positive reading but the slow line is tuned to the downside. Major resistance is set at the price of $1.562. Support levels and downward target is set at the price of $1.535. The material has been provided by InstaForex Company - www.instaforex.com |
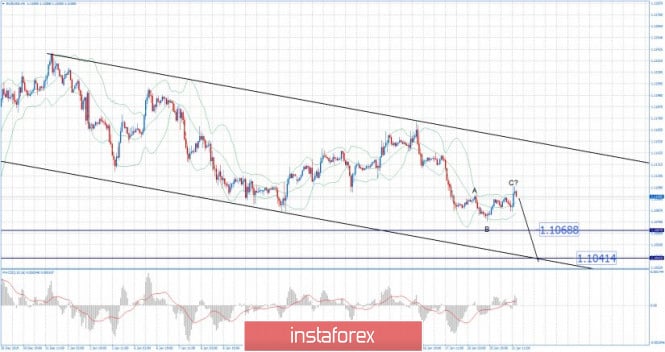
| Posted: 21 Jan 2020 04:37 AM PST EUR has been trading upwards. The price tested and rejected of the level of 1.1110. I see further downside on the EUR and potential re-test of 1.1070 and 1.040.
There is the potential completion of the ABC upward correction phase, which is sign that selling is on the way. Watch for selling opportunities on the rallies using the intraday-frames 5/15 minute. MACD oscillator is showing positive reading but without new expansion... Resistance levels are set at the price of 1.1110 and 1.1126 Support levels and downward targets are set at the price of 1.1068 and 1.1041. The material has been provided by InstaForex Company - www.instaforex.com |
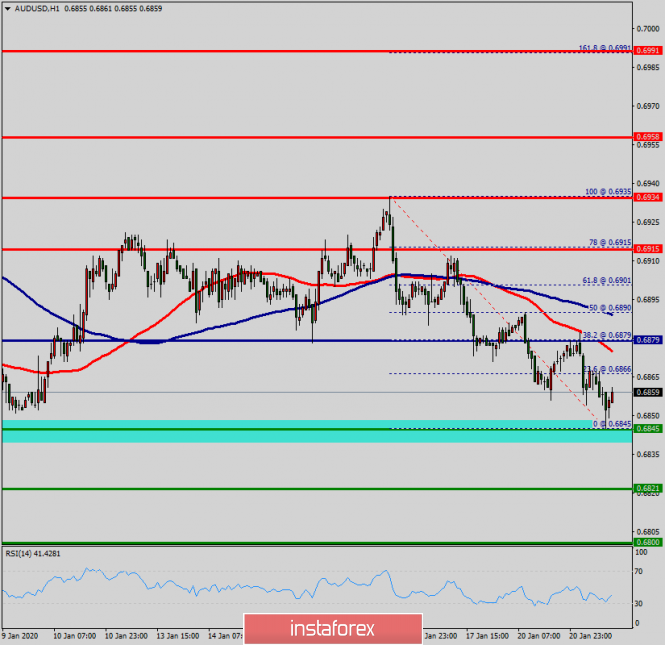
| Technical analysis of AUD/USD for January 21, 2020 Posted: 21 Jan 2020 03:15 AM PST Overview: The AUD/USD pair fell sharply from the level of 0.6915 towards 0.6845. Now, the price is set at 0.6861. The resistance is seen at the level of 0.6915 and 0.6934. Moreover, the price area of 0.6915/0.6934 remains a significant resistance zone. Therefore, there is a possibility that the AUD/USD pair will move downside and the structure of a fall does not look corrective. The trend is still below the 100 EMA for that the bearish outlook remains the same as long as the 100 EMA is headed to the downside. Thus, amid the previous events, the price is still moving between the levels of 0.6915 and 0.6845. If the AUD/USD pair fails to break through the resistance level of 0.6915, the market will decline further to 0.6821 as as the first target. This would suggest a bearish market because the RSI indicator is still in a negative spot and does not show any trend-reversal signs. The pair is expected to drop lower towards at least 0.6800 so as to test the daily support 2. On the contrary, if a breakout takes place at the resistance level of 0.6934, then this scenario may become invalidated. The material has been provided by InstaForex Company - www.instaforex.com |
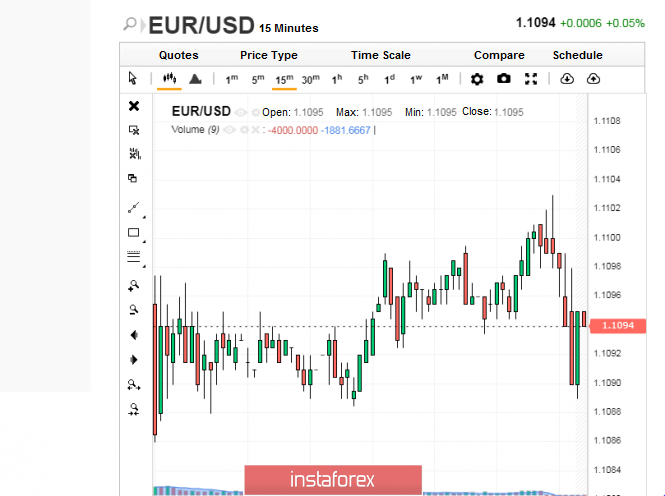
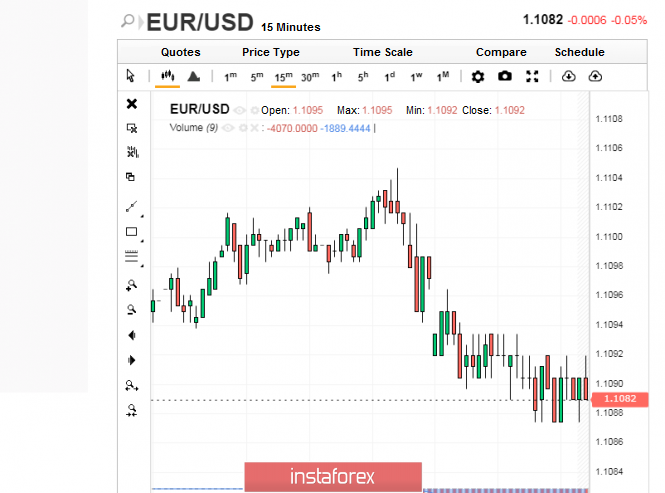
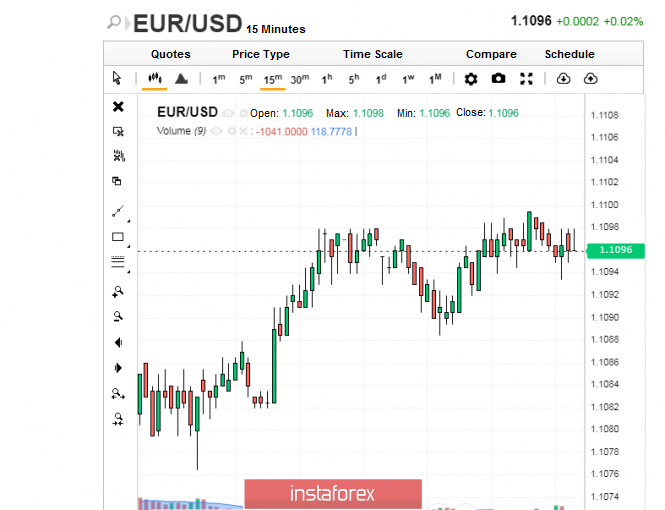
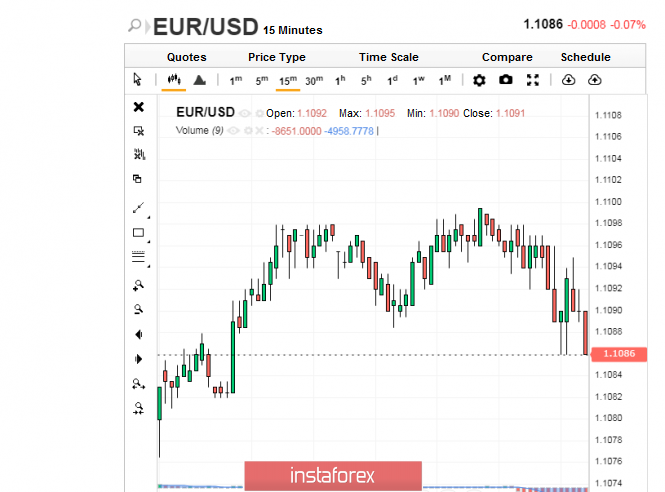
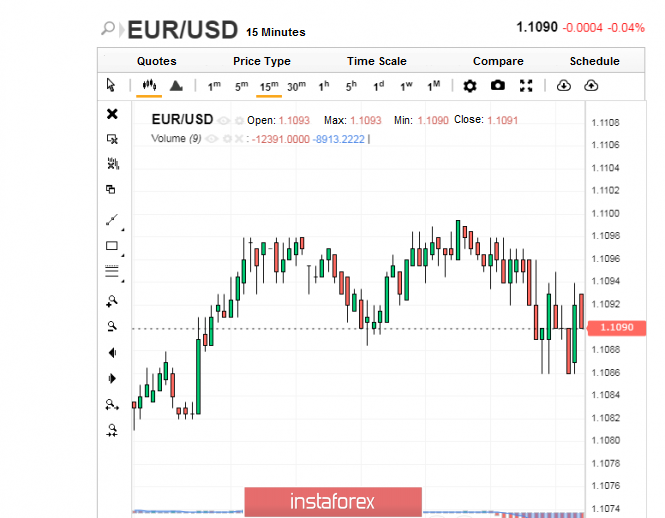
| The dollar is ready for surprises Posted: 21 Jan 2020 02:46 AM PST Although slowdowns, suspensions and temporary falls are possible during the dollar's current growth, market participants who bet on the currency are not afraid. Many of them are confident on dollar's strength, and there are good reasons for this. At the end of 2019, some analysts confidently predicted the weakening of the US currency in 2020. Their calculations turned out to be wrong, and this was just the first surprise of the dollar in the coming year. The dollar still proved to be the most popular financial instrument for investors due to the attractiveness of interest rates on American securities. They still exceed the rates of most of the other countries. This week, the dollar began to grow, and its quotes remained to a nearly one-month high against key world currencies. Positive macroeconomic data from the United States was the driver of this recovery. Recall that in December of last year, the growth rate of housing construction in America reached a 13-year high. Retail sales were also on top, and the indicator of industrial activity in the country took the highest level in the last eight months. In contrast to the strengthening of dollar's positions, the European currency was a loser. It has lost its former gains, largely helped by the weak data on both the German economy and the Eurozone economy. Although the data published after the previous ECB meeting was a bright spot against the background of the gathering economic clouds, the euro could not take advantage of the situation. It sharply against the dollar., and as a result, the EUR/USD pair is stuck in a low range, from which it is constantly trying to get out. On Monday, January 20, the classic tandem rose to 1.1094, but failed to gain a foothold in these positions. The EUR/USD pair, unable to overcome the downward movement, began to slide and ended up at 1.1082. Meanwhile, on Tuesday morning, January 21, the EUR/USD pair started cheerfully. It rose to the level of 1.1096. However, there were difficulties in preserving the conquered peaks. Because of this, the EUR/USD pair fell to 1.1086. And although it managed to recover later on, analysts emphasize that there is no upward trend. At the moment, the tandem runs near 1.1090–1.1091, unable to leave the low range. The dollar feels more confident than the euro, and is continuing to strengthen. Experts believe that with the predominance of an upward trend, the dynamics of the dollar will be multidirectional this year. Although many experts bet on such developments, forecasts on the weakening of the dollar are yet to be confirmed. Perhaps, some analysts were just misled by the words of US President Donald Trump about the harm of a strong dollar. Recall that the Fed has repeatedly tried to weaken it by lowering interest rates, but the currency still recovered after a while. Experts believe that the strength of the national economy also contributes to the steady growth of the currency. When the dollar is backed by such a force as the US economy, it is not afraid of any economic hurricanes. In the short and medium terms, the dollar may present surprises with both a plus and a minus sign. Analysts are counting on a positive attitude towards the dollar, which can not be said about the euro. The European currency depends heavily on geopolitical sentiment, the state of the Euro zone economy and the German economy, and the ECB's further monetary policy. At the same time, experts are still expecting the balance to remain in the EUR/USD pair. The material has been provided by InstaForex Company - www.instaforex.com |
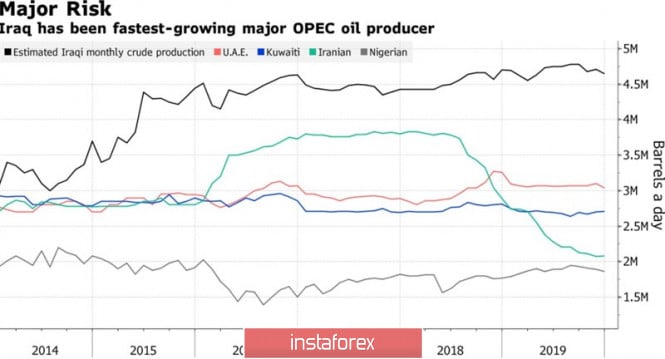
| Posted: 21 Jan 2020 02:36 AM PST When the oil market is oversaturated, a roller coaster is inevitable. They can be very cool, like after attacks on the manufacturing sector of Saudi Arabia in September or after the assassination of an Iranian general in January. Or they can be insignificant, as in the case of supply disruptions in Libya and Iraq. As soon as it became known about the unrest in these countries, the crowd began to consider their production volumes, and the major players did what they were supposed to do. They sold. In the end, everything is on the market, as usual, someone is in chocolate and someone is tearing his hair out because he missed the moment. The rise of Brent above $66 per barrel was due to information that the Libyan national army blocked the pipeline connecting the two fields, the production volume of which is estimated at 400 thousand bps. A little earlier, there was data on interruptions in the work of several ports through which about 700 thousand bps pass. Libya's total black gold production is estimated at 1.3 million bps, with conflicts erupting periodically over the past 9 years, and tensions have reduced production to their lowest levels since August 2011. The EU is the main buyer of Libyan oil and after the information about Europe's intention to send armed troops to this country to monitor the situation, Brent quickly returned to its original position. The conflict in Iraq turned out to be even less long-playing, where supply disruptions also occurred due to clashes between trade unions and law enforcement agencies. Baghdad is one of the largest players in the black gold market, its production volume is estimated at 4.6 million bps. It was not possible to catch fire from the spark as the very next day, the official authorities announced that the conflict had been settled. Oil production dynamics in Iraq and other countries:
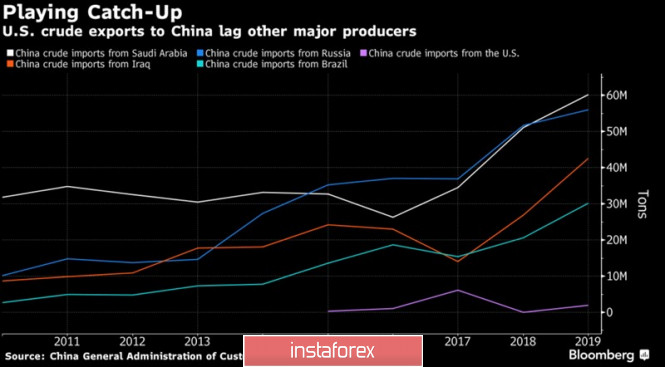
Events in Libya and Iraq have once again convinced that a new reality has entered the market. The aggravation of geopolitical risks makes prices soar, but they immediately come back. This is possible when it comes to a glut. Indeed, according to IEA estimates, supply growth from non-OPEC countries will amount to 2.1 million bps in 2020, and global demand growth will only be 1.2 million bps. The cartel needs to try very hard to balance the market. Among investors, there is a growing belief that the US is sitting on a huge amount of stocks, so it's not worth worrying about geopolitical shocks. Meanwhile, China, in the framework of the implementation of the trade agreement with the United States, is ready to increase US imports of black gold to 700 thousand bps, which will allow the States to enter the TOP-10 oil suppliers for China. The question is, will Beijing cut purchases from other countries? The dynamics of oil imports by China:
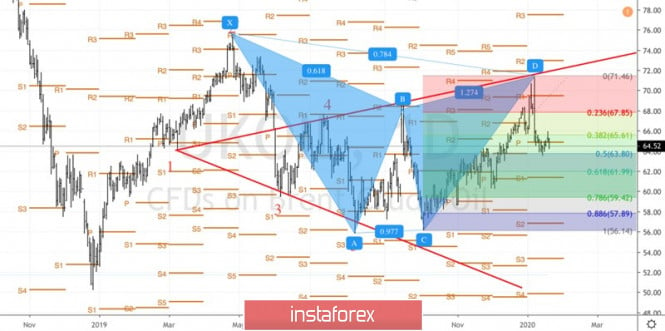
Technically, the correction of Brent after reaching the targets for the Gartley and Wolfe Waves continues. The North Sea oil managed to find support near $ 63.8 per barrel (50% of the Gartley model CD wave). Resistance is located near $ 66.8 (Pivot levels). As long as the quotes are within the trading range of $ 63.8-66.8, there is no need to talk about the control of the market by either side, "bulls" or "bears". Brent daily chart:
|
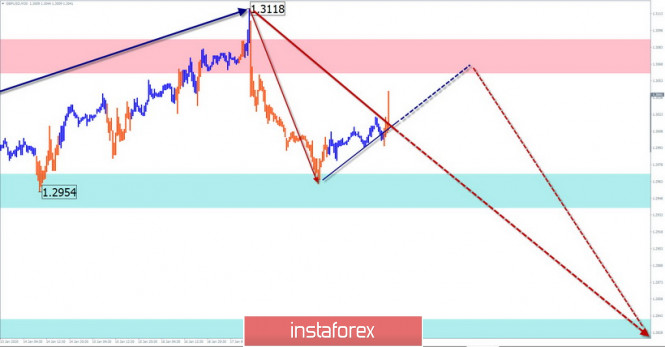
| Simplified wave analysis of GBP/USD and USD/JPY on January 21 Posted: 21 Jan 2020 02:29 AM PST GBP/USD Analysis: Despite the dominant bullish trend on the pound chart, the short-term direction points to the "south" of the chart. In the wave structure since December 23, the price forms a correction in the form of a horizontal triangle. The design is nearing its logical conclusion. Forecast: Today, the flat mood of the previous days' movement is expected to continue. In the first half of the day, an upward vector is possible. You can expect a change of direction by the end of the day or tomorrow. Potential reversal zones Resistance: - 1.3060/1.3090 Support: - 1.2970/1.2940 - 1.2840/1.2810 Recommendations: Purchases of the pound are now possible in intra-session trading. It is safer to wait for the completion of the upward trend and track the entry signals to short positions.
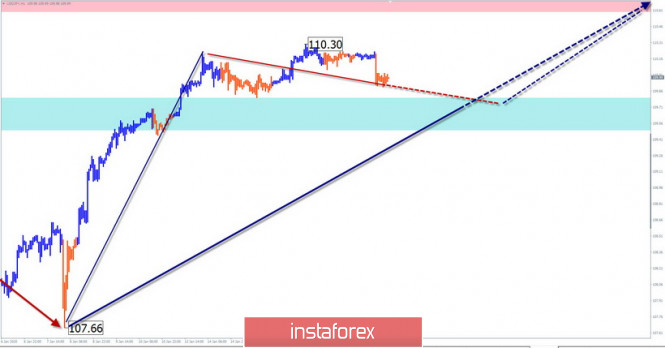
USD/JPY Analysis: The direction of the yen's movement on a short-term scale coincides with the course of the dominant trend since August last year. After a 2-month sideways correction, the pair's price started up on January 8. After breaking through a strong resistance since the beginning of last week, the price rolls back down. Forecast: In the coming trading sessions, the entire rollback is expected to be completed, a reversal is expected to be formed, and the pair's rate will begin to rise. The nearest lifting target is shown by the calculated resistance. Potential reversal zones Resistance: - 110.60/110.90 Support: - 109.80/109.50 Recommendations: Due to the expected small move of the pair downwards, the pair's sales are unpromising today. It is recommended to track reversal signals to find entry points for long positions.
Explanations: In the simplified wave analysis (UVA), waves consist of 3 parts (A-B-C). The last incomplete wave is analyzed. The solid background of the arrows shows the formed structure and the dotted background shows the expected movements. Note: The wave algorithm does not take into account the duration of the tool's movements in time! The material has been provided by InstaForex Company - www.instaforex.com |
| Pound: one step forward, two steps backward Posted: 21 Jan 2020 02:23 AM PST
The British currency continues to struggle for levels around $1.3000. On Monday, the GBP/USD pair sank to weekly lows, but managed to attract buyers near 1.2970. It completed the fall from levels above 1.3100 that began on Friday. 1.3000–1.3300 acts as a strong resistance area, where the pair has repeatedly turned to decline over the past year and a half. The pressure on the pound continues to be exerted via concerns about a "hard" Brexit, as well as the increased expectations of a cut on interest rates by the Bank of England. On Sunday, UK Finance Minister, Sajid Javid, addressed business representatives and urged local companies to adjust to a new future in which the country will no longer be tied to EU's rules and regulations. "UK will not be subject to these rules. We will not be in the single market and the EU customs union," the head of the British Finance Ministry said. Brussels responded to this statement by saying that this approach will inevitably lead to new trade problems between Albion and the bloc, that may consequently cause a reduction in trade, investment and jobs. Meanwhile, the British economy continues to experience difficulties due to Brexit. "A sharp drop of 0.3% over the month means that national GDP is close to stagnation on a quarterly basis. The services sector is sluggish but growing (+0.1%), while production, limited by both global and local headwinds, is declining by 0.6%. Consumers were the main drivers of economic growth in the United Kingdom last year, so the decline on retail sales in December is particularly disappointing. Inflationary pressures unexpectedly eased last month, when the consumer price index fell to a three-year low of 1.3%," the Royal Bank of Scotland said. According to experts, given the weakness of industrial production, trade, inflation and retail sales in the UK, the chances of a rate cut by the Bank of England in the first quarter are quite high. More than two members of the monetary policy committee can vote to ease it. Take note that the pound is just beginning to slow down. Reports on the labor market and business activity in UK, which will be released this week, may worsen the situation. Against the background of weak macrostatistics, the pound may fall below $1.29 against the US dollar. Commerzbank analysts believe that the GBP/USD pair can pay a visit to the 1.2850 area. "On Friday, the pair formed a bearish "external day" pattern on the chart. Now, we expect a decline to the upward trend line at 1.2853. Below the current price level is 1.2908 (December low), followed by the aforementioned four-month upward trend line at 1.2853. The 200-day moving average is at 1.2688. A close above 1.3118 (January 17 high) will ease the current downward pressure, and again target the market at 1.3285, " they said. The material has been provided by InstaForex Company - www.instaforex.com |
| You are subscribed to email updates from Forex analysis review. To stop receiving these emails, you may unsubscribe now. | Email delivery powered by Google |
| Google, 1600 Amphitheatre Parkway, Mountain View, CA 94043, United States | |





No comments:
Post a Comment