Forex analysis review |
- Forecast for GBP/USD on January 24, 2020
- Forecast for USD/JPY on January 24, 2020
- Fractal analysis of the main currency pairs for January 24
- Trading recommendations for GBP/USD on January 23
- Analysis of EUR/USD and GBP/USD for January 23. Christine Lagarde speech pulled down the euro
- EUR/USD: Christine Lagarde pessimism and panic over 2019-nCoV
- "Death cross" and economic factors threaten the dollar, the greenback is not afraid of them at all
- Summersaults of the Australian doll
- Ichimoku cloud indicator Daily analysis of Gold
- Ichimoku cloud indicator Daily analysis of EURUSD
- January 23, 2020 : GBP/USD Intraday technical analysis and trade recommendations.
- January 23, 2020 : EUR/USD Intraday technical analysis and trade recommendations.
- EUR/USD. January 23. The European Central Bank does not plan to cut rates soon
- GBP/USD. January 23. The pound recovered slightly, however, it may still fall to 1.3000
- EURUSD for 01/23/2020. The ECB left rates unchanged but announced the beginning of a policy review
- EUR/USD for January 23,2020 - SBroken support trendline and short-short term downward trend, selling prerferable
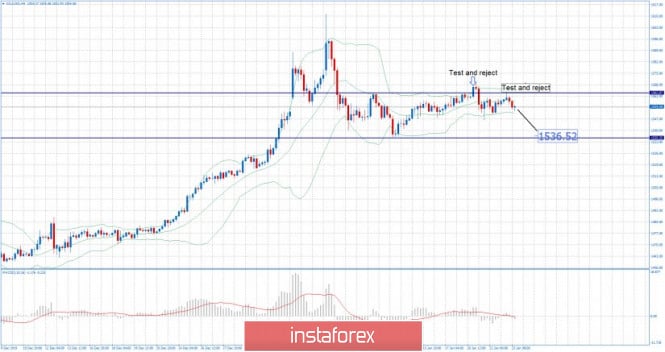
- Gold 01.23.2020 - Second test and reject of the important pivot resistance at $1.562, selling oppoutnties preferable
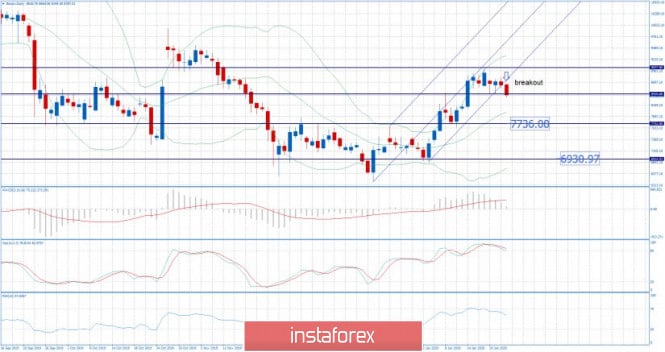
- BTC analysis for 01.23.2020 - Broken upward Pitchfok channel and main pivot support at $8.400, watch fo potential drop and
- Analysis and trading ideas for AUD/USD as of January 23, 2020
- Trading plan for EUR/USD for January 23, 2020
- Technical analysis of GBP/USD for January 23, 2020
- Overview for EUR/USD on January 23, 2020
- GBP/USD: The House of Lords approved the Brexit bill. Pound became the leader of growth among the G10 currencies
- Pound: facing statistics, sideways to geopolitics
- Trading plan on EUR/USD and GBP/USD for January 23, 2020
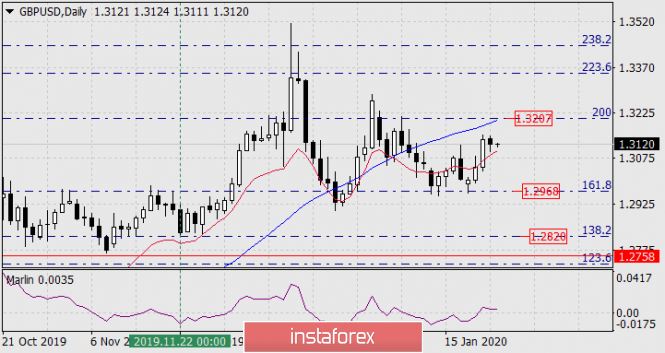
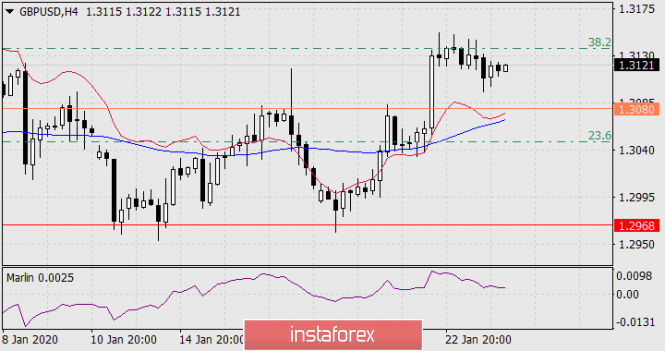
| Forecast for GBP/USD on January 24, 2020 Posted: 23 Jan 2020 08:29 PM PST GBP/USD The pound fell by 16 points on Thursday. This was not enough for technical indicators to show a decrease in the risk of continued growth. On the daily scale, the price continues to develop above the balance line, since the Marlin oscillator has only slightly decreased in the growth trend zone. The development of the magnetic point at 1.3207, formed by the intersection of the Fibonacci level of 200.0% and the MACD line, can still take place. On the four-hour chart, a small consolidation and decline occurred in the area of the correction level of 38.2% of the extremes on December 13 and 23. The price is also higher than the indicator lines of balance and MACD, Marlin remains in the growth zone. The price will retain increasing potential until it goes below the signal level 1.3080 - this is the growth potential of the MACD line for the next day and technical resistance on January 16, 21 and earlier record extremes. Consolidation at 1.3080 will allow a decrease to develop towards the first target of 1.2968 - to the Fibonacci level of 161.8% on a daily scale. The material has been provided by InstaForex Company - www.instaforex.com |
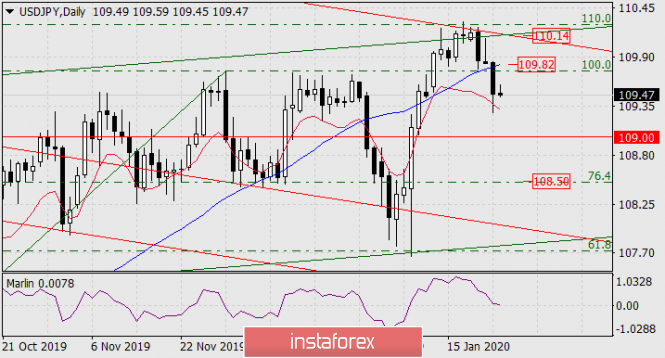
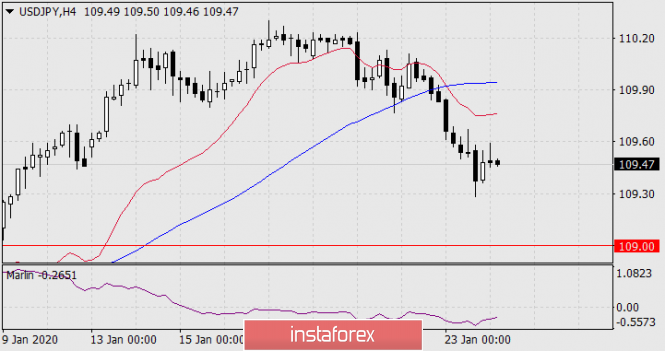
| Forecast for USD/JPY on January 24, 2020 Posted: 23 Jan 2020 08:21 PM PST USD/JPY The Shanghai Composite Chinese stock index fell 2.75% on Thursday, US indices closed mixed, which caused the USD/JPY pair to fall by 55 points at the moment. The movement was still not very persistent, the price did not begin to overcome the support of the balance line on the daily chart. The Marlin oscillator approached the boundary with the territory of the bears, and can turn up from it. Unless, of course, stock market fears of a pandemic of the Chinese coronavirus subside. In general, the price is in the uncertain range formed by the support of the indicator line of balance and the resistance of the MACD line (109.82). In this state, staying between these two lines, the price may drop to an intermediate level of 109.00 (a July 10 high and a May 13, 2019 low). Consolidation below it opens the target of 108.50 - the Fibonacci level of 76.4%. The positive scenario assumes that the Marlin signal line is turning up, the price is moving above the MACD line (109.82) and there is a slight continuation of growth towards the intersection of the lines of rising and falling price channels - 110.14. The situation is decreasing in all indicators on the four-hour chart, but Marlin is aggressively turning up. The overall picture for the yen is not defined, the market is waiting for external incentives. The material has been provided by InstaForex Company - www.instaforex.com |
| Fractal analysis of the main currency pairs for January 24 Posted: 23 Jan 2020 06:17 PM PST Forecast for January 24: Analytical review of currency pairs on the scale of H1:
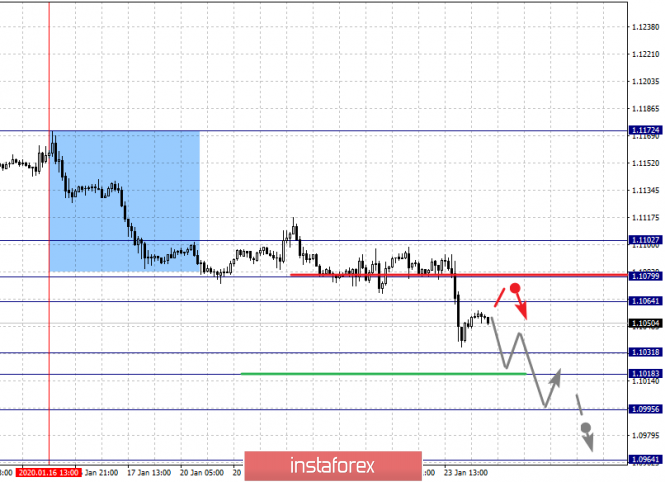
For the euro / dollar pair, the key levels on the H1 scale are: 1.1102, 1.1079, 1.1064, 1.1031, 1.1018, 1.0995 and 1.0964. Here, we are following the descending structure of January 16. Short-term downward movement is expected in the range of 1.1031 - 1.1018. The breakdown of the latter value will lead to a pronounced movement. Here, the target is 1.0995. Price consolidation is near this level. For the potential value for the bottom, we consider the level of 1.0964. Upon reaching which, we expect a rollback to the top. Short-term upward movement is possibly in the range of 1.1064 - 1.1079. The breakdown of the latter value will lead to an in-depth correction. Here, the goal is 1.1102. This level is a key support for the downward structure. The main trend is the descending structure of January 16 Trading recommendations: Buy: 1.1065 Take profit: 1.1077 Buy: 1.1082 Take profit: 1.1100 Sell: 1.1031 Take profit: 1.1018 Sell: 1.1016 Take profit: 1.0996
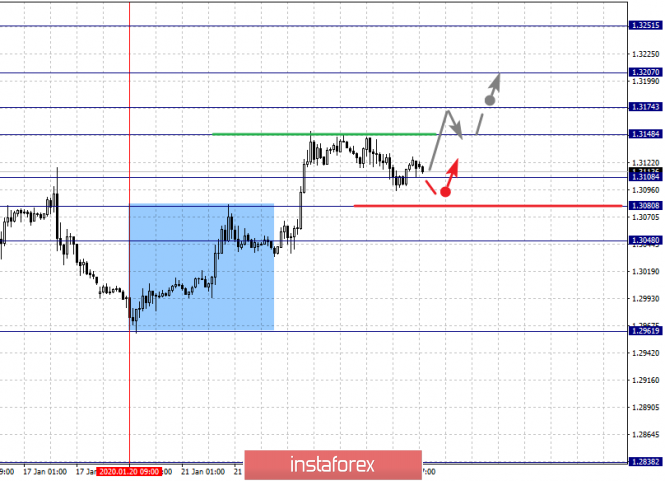
For the pound / dollar pair, the key levels on the H1 scale are: 1.3251, 1.3207, 1.3174, 1.3128, 1.3108, 1.3080 and 1.3035. Here, we continue to follow the upward cycle of January 20. Short-term upward movement is expected in the range 1.3174 - 1.3207. The breakdown of the latter value will lead to movement to a potential target - 1.3251. We expect a pullback to the bottom from this level. Short-term downward movement is possibly in the range of 1.3128 - 1.3108. The breakdown of the last value will lead to an in-depth correction. Here, the target is 1.3080. This level is a key support for the top. The main trend is the upward structure of January 20 Trading recommendations: Buy: 1.3148 Take profit: 1.3172 Buy: 1.3176 Take profit: 1.3207 Sell: 1.3105 Take profit: 1.3083 Sell: 1.3078 Take profit: 1.3050
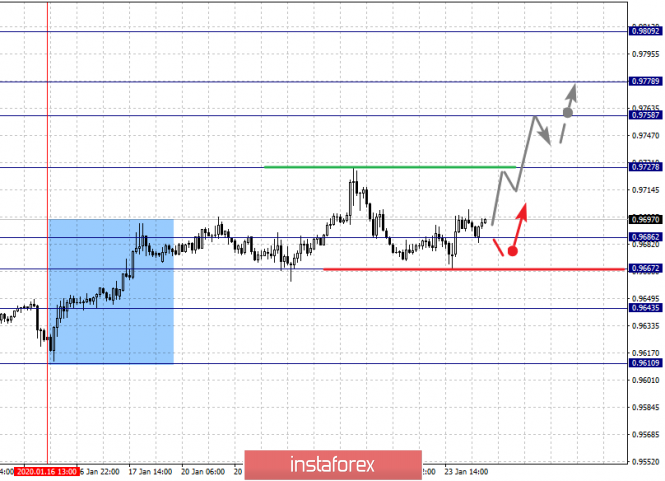
For the dollar / franc pair, the key levels on the H1 scale are: 0.9809, 0.9778, 0.9758, 0.9727, 0.9686, 0.9667 and 0.9643. Here, we are following the development of the ascending structure of January 16. The continuation of the movement to the top is expected after the breakdown of the level of 0.9727. In this case, the target is 0.9758. Short-term upward movement, as well as consolidation is in range of 0.9758 - 0.9778. We consider the level of 0.9809 to be a potential value for the upward movement; upon reaching this level, we expect a pullback to the bottom. Short-term downward movement is possibly in the range of 0.9686 - 0.9667. The breakdown of the latter value will lead to an in-depth correction. Here, the target is 0.9643. This level is a key support for the top. The main trend is the upward cycle of January 16 Trading recommendations: Buy : 0.9727 Take profit: 0.9756 Buy : 0.9758 Take profit: 0.9776 Sell: 0.9665 Take profit: 0.9645 Sell: 0.9640 Take profit: 0.9616
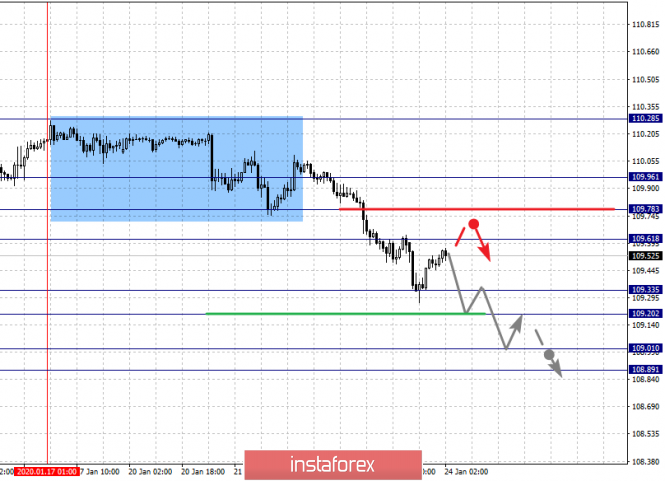
For the dollar / yen pair, the key levels on the scale are : 109.96, 109.78, 109.61, 109.33, 109.20, 109.01 and 108.89. Here, we are following the downward cycle of January 17 (initial conditions have been clarified). Short-term downward movement is possible in the range 109.33 - 109.20. The breakdown of the last value will lead to a pronounced movement. Here, the target is 109.01. For the potential value for the bottom, we consider the level of 108.89, upon reaching which, we expect consolidation, as well as a rollback to the top. Short-term upward movement is possibly in the range of 109.61 - 109.78. The breakdown of the latter value will lead to an in-depth correction. Here, the goal is 109.96. This level is a key support for the downward structure. Main trend: potential downward structure of January 20 Trading recommendations: Buy: 109.61 Take profit: 109.76 Buy : 109.80 Take profit: 109.96 Sell: 109.33 Take profit: 109.20 Sell: 109.18 Take profit: 109.01
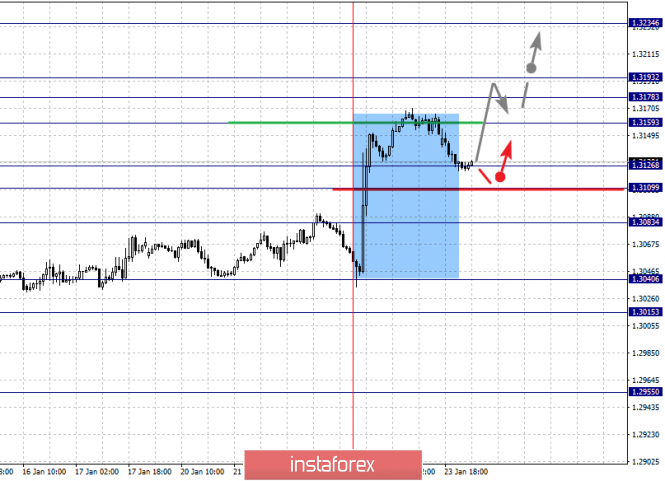
For the Canadian dollar / US dollar pair, the key levels on the H1 scale are: 1.3234, 1.3193, 1.3178, 1.3159, 1.3126, 1.3109 and 1.3083. Here, the price registered the local upward structure of January 22. The continuation of the movement to the top is expected after the breakdown of the level of 1.3160. In this case, the target is 1.3178. Price consolidation is near this level. Passing at the price of the noise range 1.3178 - 1.3193 will lead to a movement to a potential target - 1.3234. We expect a pullback to the bottom from this level. Short-term downward movement is possibly in the range of 1.3126 - 1.3109. The breakdown of the latter value will lead to an in-depth correction. Here, the target is 1.3083. The main trend is the local ascending structure of January 22. Trading recommendations: Buy: 1.3160 Take profit: 1.3178 Buy : 1.3194 Take profit: 1.3234 Sell: 1.3126 Take profit: 1.3110 Sell: 1.3107 Take profit: 1.3085
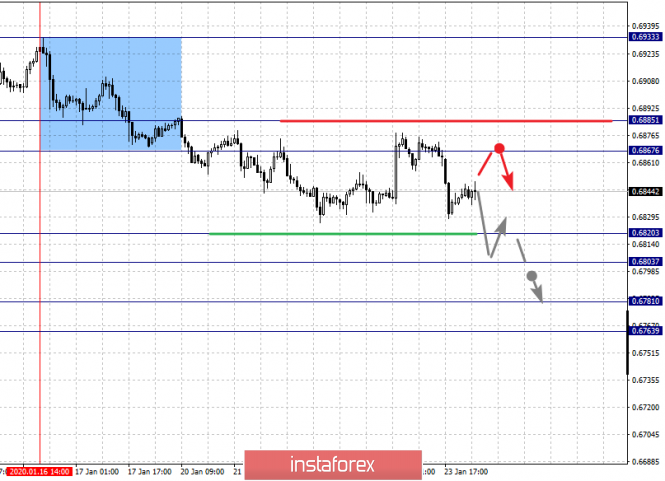
For the Australian dollar / US dollar pair, the key levels on the H1 scale are : 0.6885, 0.6867, 0.6853, 0.6820, 0.6867 and 0.6885. Here, we are following the development of the descending structure of January 16. Short-term downward movement is expected in the range 0.6820 - 0.6803. The breakdown of the last value should be accompanied by a pronounced downward movement. Here, the target is 0.6781. For the potential value for the bottom, we consider the level of 0.6763. Upon reaching which, we expect consolidation, as well as a rollback to the top. Short-term upward movement is expected in the range of 0.6867 - 0.6885. The breakdown of the latter value will lead to the formation of initial conditions for the top. In this case, the potential target is 0.6910. The main trend is the descending structure of January 16, the correction stage Trading recommendations: Buy: Take profit: Buy: 0.6868 Take profit: 0.6883 Sell : 0.6820 Take profit : 0.6804 Sell: 0.6802 Take profit: 0.6784
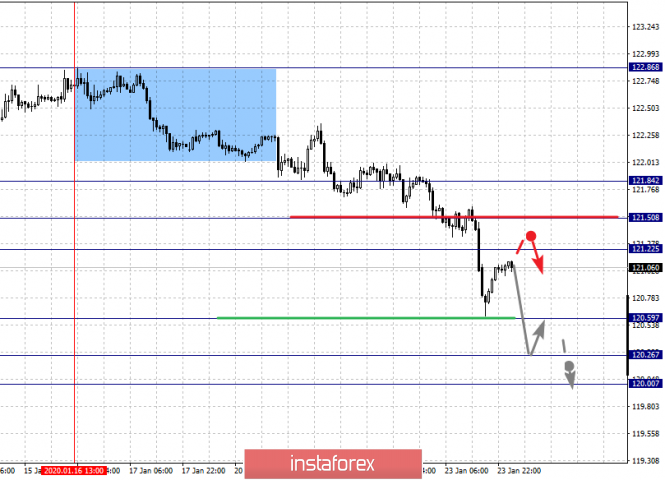
For the euro / yen pair, the key levels on the H1 scale are: 121.84, 121.50, 121.22, 120.59, 120.26 and 120.00. Here, we are following the descending structure of January 16. The continuation of movement to the bottom is expected after the breakdown of the level of 120.59. In this case, the goal is 120.26. Price consolidation is near this level. For the potential value for the bottom, we consider the level of 120.00. Upon reaching which, we expect a pullback to the top. Short-term upward movement is possibly in the range of 121.22 - 121.50. The breakdown of the last value will lead to an in-depth correction. Here, the goal is 121.84. This level is a key support for the downward structure. The main trend is the descending structure of January 16 Trading recommendations: Buy: 121.22 Take profit: 121.50 Buy: 121.52 Take profit: 121.84 Sell: 120.57 Take profit: 120.28 Sell: 120.24 Take profit: 120.00
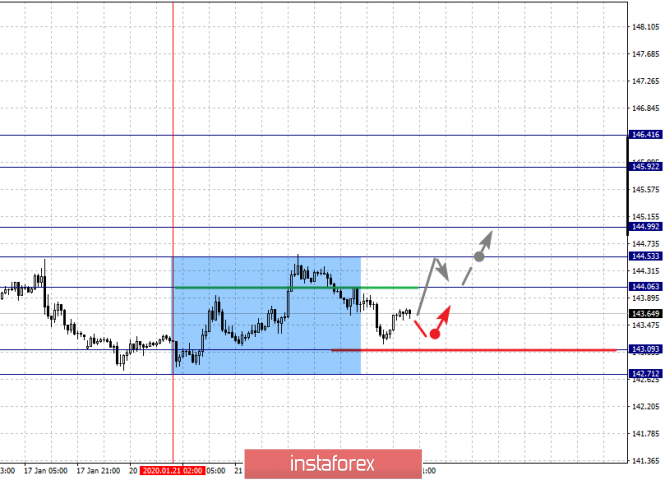
For the pound / yen pair, the key levels on the H1 scale are : 146.41, 145.92, 144.99, 144.53, 144.06, 143.09 and 142.71. Here, we are following the formation of the ascending structure of January 21. The resumption of movement to the top is expected after the breakdown of the level of 144.06. In this case, the goal is 144.53. Short-term upward movement is expected in the range 144.53 - 144.99. The breakdown of the last value should be accompanied by a pronounced upward movement. Here, the target is 145.92. For the potential value for the top, we consider the level of 146.41. Upon reaching this level, we expect consolidation, as well as a pullback to the bottom. The level 143.09 is a key support for the top. Its passage at a price will lead to the cancellation of this structure. In this case, the potential target is 142.71. The main trend is the local ascending structure of January 21 Trading recommendations: Buy: 144.06 Take profit: 144.50 Buy: 144.55 Take profit: 144.97 Sell: 143.09 Take profit: 142.71 The material has been provided by InstaForex Company - www.instaforex.com |
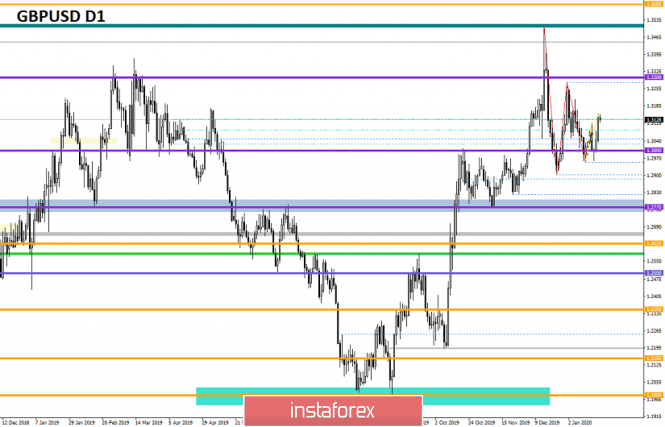
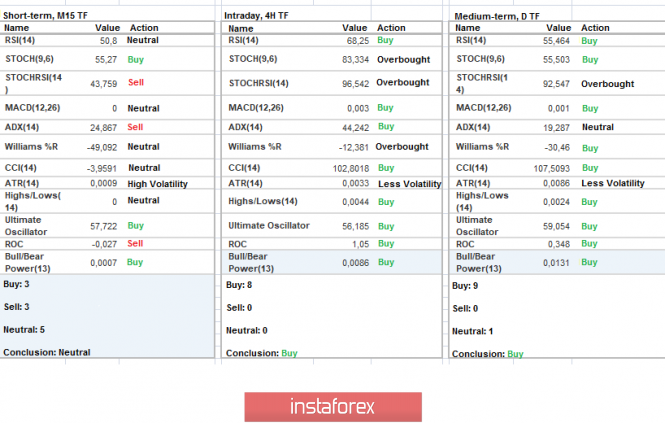
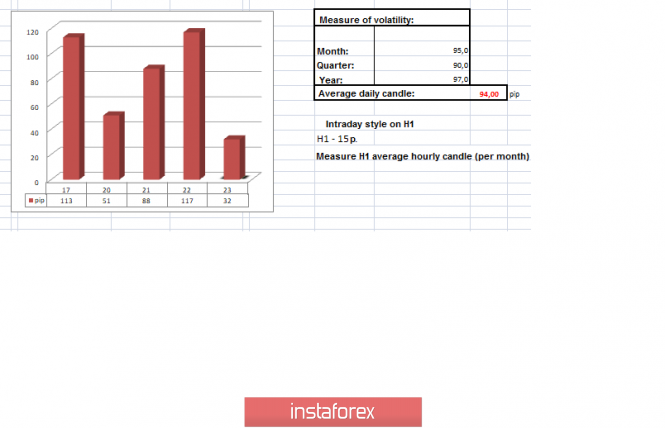
| Trading recommendations for GBP/USD on January 23 Posted: 23 Jan 2020 03:33 PM PST From the point of view of complex analysis, we see a sharp surge in activity, which led to a jump in prices towards 1.3150. In fact, the psychological level of 1.3000 was left behind, and the structure of the Zigzag-shaped model has undergone a significant change. The long-running Zigzag model led to a significant compression of the amplitude, where the psychological level, relative to which the compression phases occurred, became the point of interaction. Yesterday's surge in activity, larger than 110 points, managed to break through the maximum of the third phase of the model [01/17/19 (High) -20.01.20], which led to discussion of the fracture of the Zigzag-shaped model and a sharp surge of long positions. Predictions coincided, traders earned, but in the depths of consciousness lies the thought that this is not the end, but we should expect something more. What is the doubt? That is, we have two assumptions since the impulse that occurred earlier is insufficient in comparison with the mass of the model. The first suggests that the current impulse is only the beginning of a future move, and the second judgment, on the contrary, casts doubt on the structure of the model and the correctness of the phases. To be more precise, the previous phase [01/17/19/20/01/20] is only a tact, the current phase and the reverse is still possible. In terms of volatility, we see the highest indicator since the beginning of the trading week, where for the first time we exceeded the average daily indicator by 24%. A characteristic acceleration was observed in the market since Tuesday, where the daily indicator grew to the level of 88 points in comparison with Monday. Analyzing the past minute by minute, we see that the structure of the move resembles steps, and the impulse move raised us to a new level, where the surge in activity occurred at 10: 00-13:00 [UTC+00 time on the trading terminal]. Subsequent swings were in terms of deceleration, reflecting a range of 1.3115 / 1.3150. As discussed in the previous review, speculators had long positions even from the value of 1.3201, where the breakdown of the January 17 maximum gave confidence to the actions, which led to the further progress and the achievement of subsequent predicted coordinates. Considering the trading chart in general terms [the daily period], we see that there are no cardinal changes, the main coordinates are not affected by the price. Thus, the medium-term upward movement is preserved in the structure of the global downward trend. The news background of the past day contained statistics for the UK, where the volume of borrowing in the public sector fell by 4 billion pounds. At the same time, data were published on the Business Optimism Index [CBI], which rose from -44 to +23, now it remains only for investors to believe in these indicators, since most of them left the United Kingdom since the beginning of the referendum. The market reaction to the statistics was conditionally in favor of the pound sterling, but probably the sacred meaning was different. In terms of the general information background, we have the long-awaited approval by the British Parliament of the bill on the country's withdrawal from the EU. The last delay was from the House of Lords, the trough delayed the long-awaited moment of approval for all. "Parliament has passed a bill to withdraw from the European Union, which means that the United Kingdom will leave the EU on January 31 and will move forward as a whole. At times, it seemed like we would never cross the Brexit finish line, but finally we succeeded, "said the British Prime Minister. Now all that remains is the signature of Queen Elizabeth II, after which the European side will sign the necessary documents in Brussels, and on January 29 the agreement will have to finalize the European Parliament. In turn, the Chancellor of the Exchequer of Great Britain, Sajid Javid, was inspired by what was happening and said to the United States government during the World Economic Forum that they should wait in line until Britain finishes negotiations with the European Union and after it comes to them, which the Ministry of Finance did not like USA. Subsequently, the British government corrected the words of Javid, saying that there are no plans for priorities and from February 1 they can freely negotiate with any country. Today, in terms of the economic calendar, we only had applications for US unemployment benefits, where no changes are expected. The main event of the day was the meeting of the ECB, followed by a press conference, where, according to expectations, changes in the strategy of the regulator may take place. This event belongs to the European Union, but do not forget that there is a characteristic correlation between the EUR/USD and GBP/USD currency pairs. As a result of which, there may be synchronous moves. Further development Analyzing the current trading chart, we see a very remarkable slowdown with perfectly even borders of 1.3115 / 1.3150, where the quote has been fluctuating for more than 20 hours. In fact, we are faced with local ambiguity, which is caused by a small overbought, as well as third-party factors, as we wrote above. In terms of the emotional mood of the market, we see a high coefficient of speculative positions, which was caused by yesterday's surge in activity. By detailing the per minute portion of time, we see that the structure of the candles does not have a doji, which indicates the strength of the current accumulation. In turn, speculators came to the closure of previously opened long positions in connection with a divergence of opinion and a possible new, more profitable entry point. Having a general picture of actions, it is possible to assume that market activity will continue to grow, and current accumulation is a temporary point of regrouping of trading forces. Due to doubts about the assurance of the Zigzag-shaped model, it is considered to be the best tactic to work with fluctuations, that is, we can safely talk about the completion of the model in case of a price higher than 1.3150 and fixing at 1.3180. An alternative judgment is considered in the form of preserving the Zigzag-shaped model and changing the beat, where the priority impulse awaits us if the price is fixed lower than 1.3105, with a move to the psychological level of 1.3000. After that, the analysis of price fixing points and quotation behavior is performed. Based on the above information, we derive trading recommendations: - Buy positions are considered in case of price fixing higher than 1.3180. Speculative positions may already be from the value of 1.3155. - Sell positions are considered in case of price fixing lower than 1.3105, towards the psychological level of 1.3000. Indicator analysis Analyzing a different sector of timeframes (TF), we see that the indicators of technical instruments turned upward following the impulse move. In turn, the minute intervals took a neutral position due to the ambiguous range. Volatility per week / Measurement of volatility: Month; Quarter; Year Measurement of volatility reflects the average daily fluctuation, calculated for the Month / Quarter / Year. (January 23 was built taking into account the time of publication of the article) The current time volatility is 32 points, which is an extremely low value. It is likely to assume that volatility will increase locally at the moment of breakdown of the current range. Key levels Resistance zones: 1.3180 **; 1.3300 **; 1.3600; 1.3850; 1.4000 ***; 1.4350 **. Support Areas: 1.3000; 1.2885 *; 1.2770 **; 1.2700 *; 1.2620; 1.2580 *; 1.2500 **; 1.2350 **; 1.2205 (+/- 10p.) *; 1.2150 **; 1.2000 ***; 1.1700; 1.1475 **. * Periodic level ** Range Level *** Psychological level **** The article is built on the principle of conducting a transaction, with daily adjustment The material has been provided by InstaForex Company - www.instaforex.com |
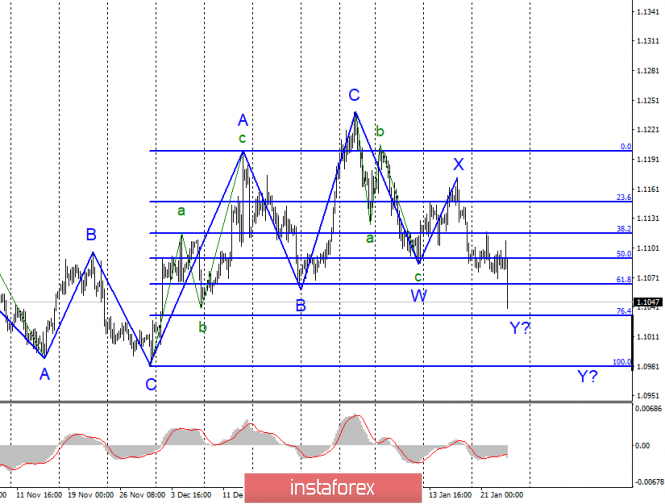
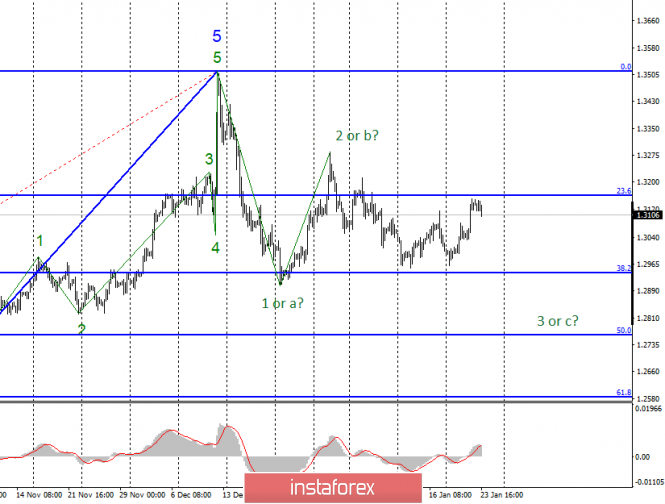
| Analysis of EUR/USD and GBP/USD for January 23. Christine Lagarde speech pulled down the euro Posted: 23 Jan 2020 03:09 PM PST EUR/USD The EUR/USD pair gained about ten base points on January 22, which did not particularly affect the current wave marking, which still implied a continued decline in the instrument. Today, January 23, when Christine Lagarde began her speech, the euro began to decline, which has already lost about 50 base points, and the day can end with even greater losses. Thus, the instrument continues to build a downward trend section and its expected wave Y. Failure to break the 76.4% Fibonacci level may lead to quotes moving away from the lows reached, a break - to continue going down in the direction of the 100.0% Fibonacci level. Fundamental component: The news background for the instrument was very strong on Wednesday. By and large, only one event was expected by the markets today. Summing up the ECB meeting, the first in 2020. Expectations about changes in interest rates by the markets were negative, and it is unlikely that anyone would count on statements about changes in the volume of the quantitative stimulus program. Therefore, all attention was paid to the speech of Christine Lagarde, and she did not disappoint. Indeed, she disappointed investors of the euro. At first, Lagarde's speech did not portend disaster. The ECB president announced moderate growth in the EU economy, as well as certain signs of improving the economic situation and accelerating inflation. However, after a few minutes, the markets heard the words that in general the risks for the EU economy remain downward, and industrial production and trade continue to slow down the eurozone economy. Thus, only that which was clear to the markets was confirmed. The decline in industrial production in recent months, weak business activity, geopolitical conflicts, the recession of the global economy - all this has had and continues to have a negative impact on the economy of the eurozone. And since these problems have not yet been resolved, it is too early to expect improvement in the situation in Europe. General conclusions and recommendations: The euro-dollar pair, presumably, continues to build a downward set of waves. Thus, I would recommend continuing to sell the instrument with targets located near the levels of 1.1034 and 1.0982, which corresponds to 76.4% and 100.0% Fibonacci. GBP/USD The GBP/USD pair gained about 95 base points on January 22, but at the same time it continues to remain within the framework of the construction of the proposed wave 3 or c, which takes a very complex and extended form. Now we can still assume that the decline could resume in the near future, although the internal wave structure of wave 3 or c already leaves some questions unanswered. A successful attempt to break through the 38.2% Fibonacci level will confirm the readiness of the markets for further sales of the pound sterling. Fundamental component: There was no news background for the GBP/USD instrument on Wednesday. The markets are now only watching the settlement of the last controversial issues between the House of Commons and Lords in the Parliament of Great Britain, but there is nothing special to note here. The Queen of Great Britain will sign the Brexit bill in the near future, and ratification of the deal in the European Union is due on January 29. Although in fact all these issues have long been resolved. A small wave of optimism was present in the Forex currency market, the pound slightly rose, but due to what should it continue to rise? The country will enter the so-called transitional period in a week, which will last 11 months. By and large, nothing will change in relations between the EU and Britain on February 1. Only negotiations will begin on agreements defining relations between the EU and Britain after December 31, 2020. There were no economic reports in the US and Britain today, so I'm waiting for a return to the 38.2% Fibonacci level. General conclusions and recommendations: The pound/dollar tool continues to build a new downward trend. I recommend selling the instrument again with targets near 1.2941 and 1.2764, which corresponds to 38.2% and 50.0% Fibonacci, on the new MACD "down" signal. A successful attempt to break through the 23.6% level will require adjustments to the current wave marking. The material has been provided by InstaForex Company - www.instaforex.com |
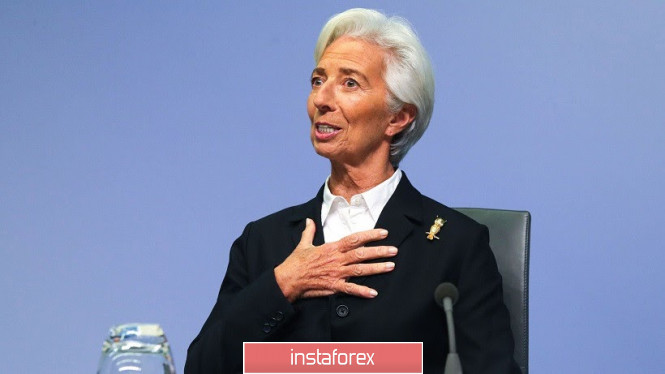
| EUR/USD: Christine Lagarde pessimism and panic over 2019-nCoV Posted: 23 Jan 2020 03:09 PM PST The euro-dollar pair is plunging down: at the moment, the bears are trying to gain a foothold below the support level of 1.1050 in order to discover the way to the area of the ninth figure. Although in the morning the pair showed corrective growth, in the hope of hawkish notes from the ECB. But to the disappointment of the EUR/USD bulls, Thursday events turned against the European currency. And it's not just because of Christine Lagarde's overly cautious rhetoric. The financial world today has finally succumbed to panic about the spread of the deadly 2019-nCoV virus. Demand for defensive assets has increased again, as well as that for the US currency, which many investors use as a kind of safe-haven in times of heightened uncertainty. In other words, the EUR/USD bulls hope for a resumption of the upward trend burst like a soap bubble - Lagarde could not support the single currency, while the anti-risk sentiment only increased the pressure on the pair. The European Central Bank today, quite expectedly, left all the parameters of monetary policy unchanged. In its accompanying statement, the regulator indicated that the ECB rates will remain at the current "or lower level" until inflation approaches the target two percent level "or close enough to this target". This wording was not a surprise to traders. The only innovation in the final communique is the announcement that the ECB will conduct a strategic review of its policy (for the first time in 17 years). However, firstly, this process will take about a year, and secondly, the regulator has not yet shared any details regarding the scope of the policy review. Therefore, the main attention of traders today was riveted to the press conference of Christine Lagarde. It cannot be said that the head of the ECB took a peremptory-dovish position. Not at all. During her speech, she, in particular, stated that "current rates are worrisome," therefore, in the future, the regulator will take into account the collateral effect of low rates. This statement suggests that there is still a split in the ECB, which appeared back in September last year, when Mario Draghi "pushed" the decision to resume QE. Some of the central bank members then also expressed their concern about the side effect of negative rates. However, the above remark could not provide the euro with long-term support. Lagarde generally maintained a pessimistic stance on the current situation. First of all, according to the head of the ECB, industrial production is a "brake"on the European economy. On the whole, the existing risks are "tilted downward," although they are less pronounced compared to last year. Despite the signing of the first phase of a trade deal between the US and China, the ECB continues to be concerned about this protracted trade conflict. Lagarde uttered a rather capacious phrase on this subject: "... geopolitics is a threat that leaves the door open for accommodation policy." At the same time, Lagarde rather modestly commented on the growth of European inflation. According to her, the regulator noted "some signs of growth", however, these trends "correspond to earlier expectations". Summing up the January meeting, the head of the ECB said that monetary policy will remain stimulating "for a long period of time", despite some signs of stabilization of the situation in the eurozone. Buyers of the EUR/USD pair certainly expected more from today's meeting. Previous macroeconomic releases made it possible to count on a more hawkish tone by the central bank chief. Therefore, following the meeting, the pair updated the daily low. But ironically, the press conference of Lagarde coincided with a general increase in anti-risk sentiment in the markets. For example, the yen paired with the greenback fell to the bottom of the 109th figure, and the dollar index jumped to a one-month high (the last time it was at 97.57 points in early December), reflecting investor demand for defensive instruments. Stock indices - on the contrary, collapsed. Asian markets have been hit hardest. In particular, the Hong Kong Hang Seng index fell 2.8%, the Shanghai blue chips index fell 1.7%, and the Japanese Nikkei lost 0.9%. The shares of tourism and passenger transportation companies (including airlines) fell most strongly. There is growing concern in financial markets that a virus spreading from China could slow global growth. Cases of infection have already been recorded in Taiwan, Thailand, Japan, South Korea, Saudi Arabia and the United States. The authorities of the PRC quarantined two cities in Hubei province (including the 11 millionth Wuhan), canceling all the large-scale events in Beijing dedicated to the celebration of the New Year on the lunar calendar (January 25). Such unprecedented measures have reminded traders of the effects of the 2003 pneumonia epidemic. Then the key countries of the Asian region in total lost, according to various estimates, from 30 to 40 billion dollars. (first of all, the tourism sector has suffered). The oil market fell then, due to a significant decrease in air transportation, and, accordingly, the demand for aviation fuel and crude oil. It is worth noting that at the moment it is impossible to say with certainty that a repetition of the year 2003 awaits us, however, in the context of the prospects of the foreign exchange market (and directly the EUR/USD pair), the very fact that traders succumbed to panic is important. If the situation with the spread of the virus will gain momentum, the pair will continue to decline, despite the other fundamental factors. So far, the EUR/USD bulls are defending - the bears have failed to gain a foothold below the support level of 1.1050. But in the event of an increase in anti-risk sentiment, buyers of the pair will not be able to maintain this level - the price will drop to the ninth figure. The material has been provided by InstaForex Company - www.instaforex.com |
| "Death cross" and economic factors threaten the dollar, the greenback is not afraid of them at all Posted: 23 Jan 2020 03:09 PM PST According to some experts, clouds are gathering over the US currency, as a two-year greenback rally hit corporate profits in the United States and angered White House head Donald Trump. Judging by the latest data from the Commodity Futures Trading Commission (CFTC), the bullish prospects for the dollar in the futures markets are now the most faded in more than a year and a half. Bank of America analysts point out that the USD index formed the so-called "death cross" on the last day of 2019. This bearish pattern occurs when a 50-day moving average crosses down a 200-day moving average, which was previously accompanied by periods of dollar weakness in seven out of eight cases since 1980. According to strategists at TD Securities, easing concerns about global trade and Brexit fueled investor risk appetite by forcing them to exit safe haven assets such as the dollar. "The global economy now seems to be recovering. A reduction in uncertainty is likely to allow investors to take risks that they did not want to take before," they said. Over the past few years, the US currency has been forced to confront a number of factors, including the Fed's dovish turn and concerns about a slowdown in US economic growth, which analysts thought should push the greenback down. Last year, the USD index grew by more than 10% compared with the low of 2018. UBS and Societe Generale are among the banks forecasting a weakening dollar this year. American billionaire Jeffrey Gundlach also believes that the greenback's next major move will be a fall. Trump is unhappy with the overly strong dollar, partly because it makes American products less competitive abroad. The index, which measures the strength of the USD against the currencies of the largest US trading partners, is near a record high. Momtchil Pojarliev from BNP Asset Management believes that this trend will change soon. He is betting that the exchange rate of the US currency will fall against the euro, Japanese yen and Australian dollar, as economic growth in these countries is accelerating, and local central banks can raise interest rates, while the Fed will keep them unchanged. This should narrow the yield gap that supports the US currency. However, there are those who believe that any weakness of the dollar will be short-lived. In particular, Lee Ferridge of State Street Global Markets doubts that the yield spread between the US and other developed countries will be narrow enough to weaken the attractiveness of the greenback. "A sharp slowdown in economic growth in the United States is likely to force investors to return to the dollar," he said. The material has been provided by InstaForex Company - www.instaforex.com |
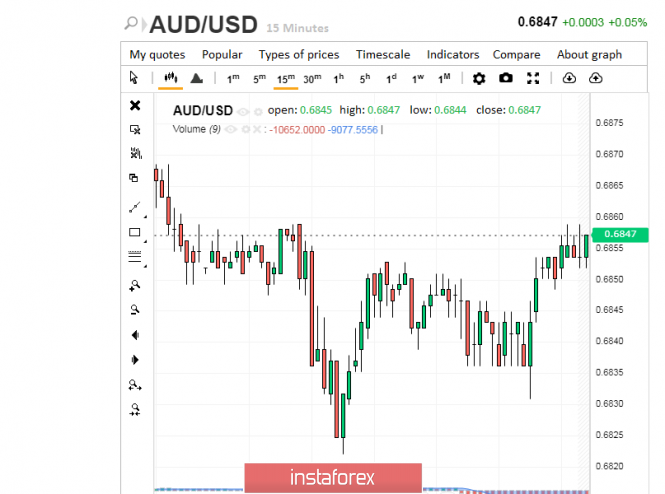
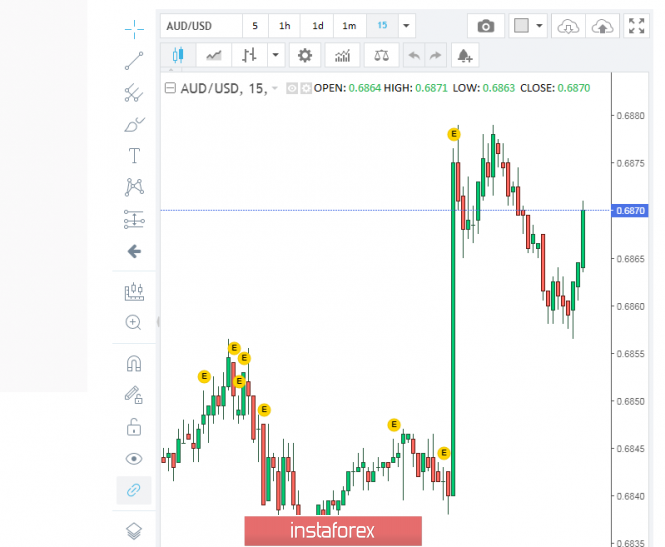
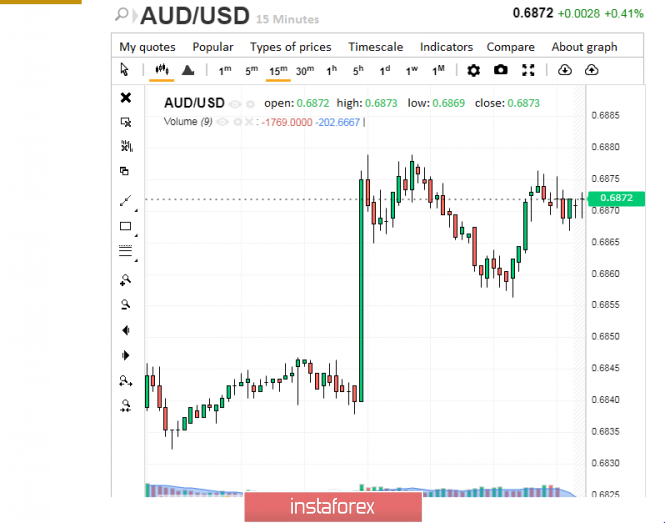
| Summersaults of the Australian doll Posted: 23 Jan 2020 03:09 PM PST At the end of this week, the Australian currency made an unexpected leap, sharply soparing to its highest values. At first glance, nothing foreshadowed such somersaults, and experts, on the contrary, predicted the aussie's fall. On Wednesday, January 22, the AUD/USD pair showed a downward trend with 20 points. Later, the pair reached 0.6830, while the potential for further decline was still maintained. By Wednesday evening, the aussie slightly grew, haggling close to 0.6847, but being ready to fall down at any moment. However, further events developed in a different way. On Thursday morning, January 23, the AUD/USD pair surprised the market with a sharp increase to 0.6870. As it turned out, this is not the limit. Now the pair continues to move in the wake of this optimism. At the moment, the AUD/USD pair rose to 0.6872, but then handed back a little. Experts recorded a mass sell-off of the Australian currency this week. According to experts, the main reason for the sales is the consequences of large-scale fires in Australia, which covered over 64% of the country's area. Despite the emergency situation in Australia, data on losses and impact on the agricultural sector were not recorded. However, the lion's share of investors leaves the asset, selling the aussie. Many of them expect a fall in key macroeconomic indicators in Australia. Many market participants are confident in a significant deterioration in the macroeconomic environment of Australia. A difficult situation was recorded in the country before the fires, and now it has worsened. Analysts fear that the current state of affairs will force the Reserve Bank of Australia not only to cut interest rates, but also to launch a quantitative easing program (QE). Information on the Australian labor market is currently expected. Experts believe that the unemployment rate in the country will remain the same - within 5.2%, and the employment growth rate may drop. In December 2019, the Australian economy created only 15 thousand new jobs, which is much lower than the previous indicator - 39.9 thousand new jobs. In this regard, the prospects for the Australian currency, prone to unexpected jerks, do not look very bright. Experts are unanimous in the opinion that the Australian currency should be sold at the moment. They are certain that in the near future, the strengthening of the US currency will put pressure on the aussie. It will be difficult for the aussie to compete with the greenback, and AUD may lose in this fight, experts conclude. The material has been provided by InstaForex Company - www.instaforex.com |
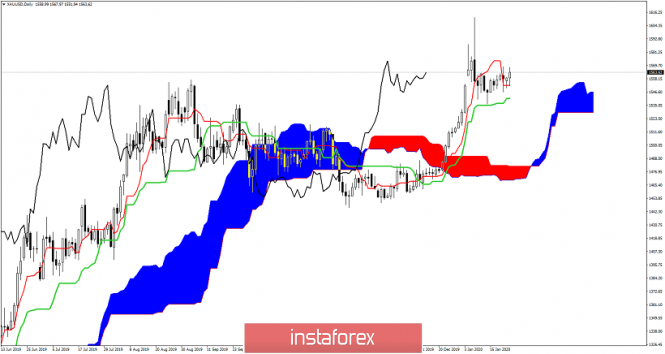
| Ichimoku cloud indicator Daily analysis of Gold Posted: 23 Jan 2020 01:58 PM PST Gold price remains in a bullish trend according to the Ichimoku cloud indicator. Price only managed to pull back towards the Daily Kijun-sen indicator and now it is trading again above both the kijun- and the tenkan-sen.
|
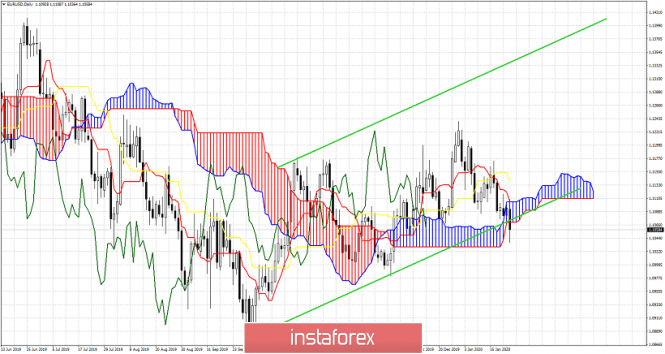
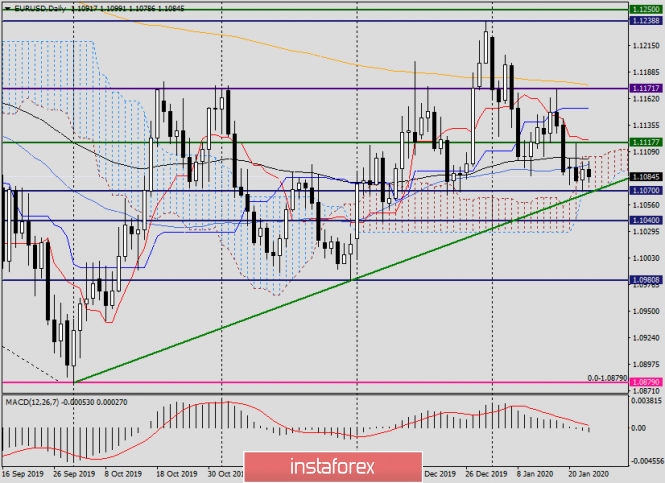
| Ichimoku cloud indicator Daily analysis of EURUSD Posted: 23 Jan 2020 01:54 PM PST EURUSD today has broken below important technical and Ichimoku support area of 1.1050-1.1060. Bulls need to step in tomorrow and close the week above 1.1060-1.1070 in order to hope for a recovery next week. Otherwise we should expect more downside for the end of the month.
EURUSD has not only closed today below and out of the short-term bullish channel, but is has also closed below the Daily Kumo. Price is making lower lows and lower highs. The weak sell signal we got on January 16th as we noted in previous posts, has now been supported by a stronger sell signal when price broke below the Kumo (cloud). As long as price is below the cloud trend will be bearish. With the tenkan-sen and kijun-sen indicators in downward trend, the Chikou span breaking below the candlestick formation, bears seem to be taking over the control again. Only hope for bulls is to see price back above 1.11 again. The material has been provided by InstaForex Company - www.instaforex.com |
| January 23, 2020 : GBP/USD Intraday technical analysis and trade recommendations. Posted: 23 Jan 2020 08:28 AM PST
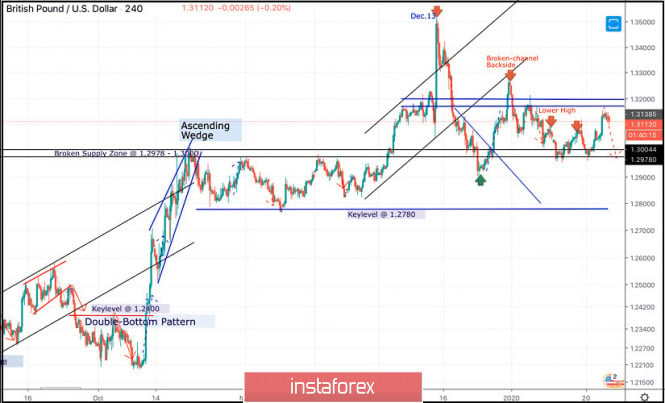
On December 13, the GBPUSD pair looked overpriced around the price levels of 1.3500 while exceeding the upper limit of the newly-established bullish channel. On the period between December 18 - 23, bearish breakout below the depicted channel followed by initial bearish closure below 1.3000 were demonstrated on the H4 chart. However, earlier signs of bullish recovery were manifested around 1.2900 denoting high probability of bullish pullback to be expected. Thus, Intraday technical outlook turned into bullish after the GBP/USD has failed to maintain bearish persistence below the newly-established downtrend line. That's why, bullish breakout above 1.3000 was demonstrated allowing the recent Intraday bullish pullback to pursue towards 1.3250 (the backside of the broken channel) where bearish rejection and another bearish swing were suggested for conservative traders in previous articles. Moreover, two descending highs were recently demonstrated around 1.3120 and 1.3090 which enhances the bearish side of the market. Intraday technical outlook was supposed to remain bearish as long as the pair maintains is movement below 1.3120. However, recent bullish breakout above 1.3100-1.3120 (the recently established descending high) is being demonstrated Today. This may hinder the intraday bearish scenario. Thus, further bullish advancement would be expected towards 1.3200. In the Meanwhile, Intraday traders can watch any bullish pullback towards the depicted price zone (1.3170 - 1.3200) for bearish rejection and another valid SELL entry with intraday bearish targets projected towards 1.3000 and 1.2980. On the other hand, conservative traders should wait for bearish breakdown below 1.2980, This is needed first to enhance further bearish decline towards 1.2900, 1.2800 and 1.2780 where the backside of the previously-broken downtrend is located. The material has been provided by InstaForex Company - www.instaforex.com |
| January 23, 2020 : EUR/USD Intraday technical analysis and trade recommendations. Posted: 23 Jan 2020 08:07 AM PST
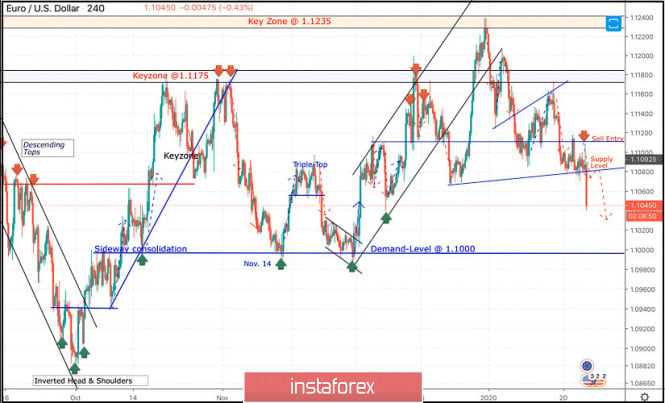
On December 6, a bullish swing was initiated around 1.1040 allowing another bullish breakout above 1.1110 to pursue towards 1.1175 within the depicted short-term bullish channel. Initial Intraday bearish rejection was expected around the price levels of (1.1175). On December 20, bearish breakout of the depicted short-term channel was executed. Thus, further bearish decline was demonstrated towards 1.1065 where significant bullish recovery has originated. Shortly-after, another bullish pullback towards 1.1235 (Previous Key-zone) was suggested to be watched for bearish rejection and another valid SELL entry. Suggested bearish position has achieved its targets while approaching the price levels around 1.1110. However, the Key-Level around 1.1110 has provided some bullish demand. This was followed by a bullish pullback towards 1.1140 and 1.1175 where the depicted key-zone as well as the recently-broken uptrend were located. Recently, evident signs of bearish rejection were demonstrated around 1.1175. That's why, quick bearish decline was executed towards 1.1110. As expected in Yesterday's article, bearish persistence below 1.1110 enabled further bearish decline towards 1.1060 and 1.1040 where some bullish rejection may be expressed. Currently, the EURUSD pair has a recently-established Supply Level around 1.1080-1.1090 to be watched for new SELL entries if any bullish pullback is expressed. Trade recommendations : Any bullish pullback towards the backside of the recently-broken trend around 1.1080-1.1090 should be considered for another valid SELL entry. The material has been provided by InstaForex Company - www.instaforex.com |
| EUR/USD. January 23. The European Central Bank does not plan to cut rates soon Posted: 23 Jan 2020 07:40 AM PST EUR/USD - 4H
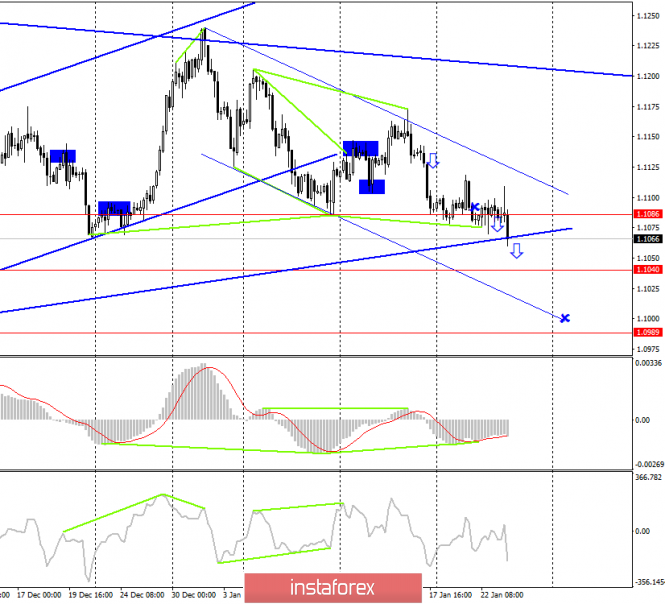
As seen on the 4-hour chart, the EUR/USD pair performed a reversal in favor of the US currency and resumed the process of falling. Thus, the pair's quotes can be said to have performed a consolidation under the peak level - 1.1086. Now the matter remains small - closing under the trend line, which will allow traders to expect a further fall in the direction of the peak levels - 1.1040 and 1.0989. The downward trend corridor continues to display the current mood of traders - "bearish". A few days of "downtime" slightly confused the cards, however, as we can see, the downward mood among traders remains. The pair's rebound from the trend line may again work in favor of the European currency and some growth of the pair in the direction of the upper area of the downward corridor. The information background of today was the summing up of the ECB meeting. It turned out that the key rates, deposit, and credit, remained unchanged and the ECB does not plan to reduce or raise them soon. Asset buyback programs also remain unchanged, and when economic data starts to improve, QE programs will be curtailed first, and only then will there be the talk of raising rates. EUR/USD - daily
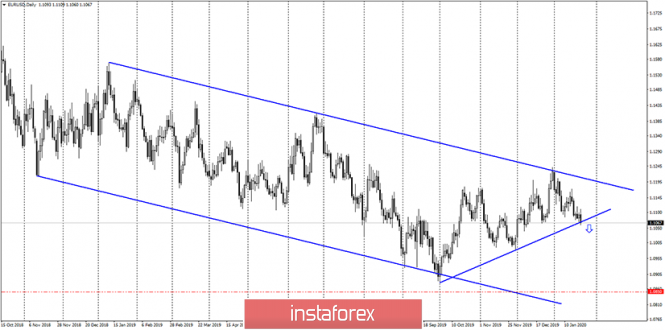
As seen on the 24-hour chart, we still have a trading idea with a drop to the lower border of the downward trend corridor. At the moment, the upward trend line remains in effect, which is the resistance for further falling quotes. Thus, fixing the euro-dollar pair under this line will significantly increase the probability of falling towards the target level of 1.0850. Forecast for EUR/USD and trading recommendations: The long-term trading idea remains valid. Traders still have a long-term target for a fall near the level of 1.0850. It is advisable to open new sales for this trading idea after closing under the trend line. The short-term trading idea is to sell the pair with the goals of 1.1040 and 1.0989 since the trend on the 4-hour chart remains "bearish". The trend line may not send quotes so low, so for both trading ideas, you need to wait for the closing of the euro-dollar pair under this line. The material has been provided by InstaForex Company - www.instaforex.com |
| GBP/USD. January 23. The pound recovered slightly, however, it may still fall to 1.3000 Posted: 23 Jan 2020 07:40 AM PST GBP/USD - 4H.
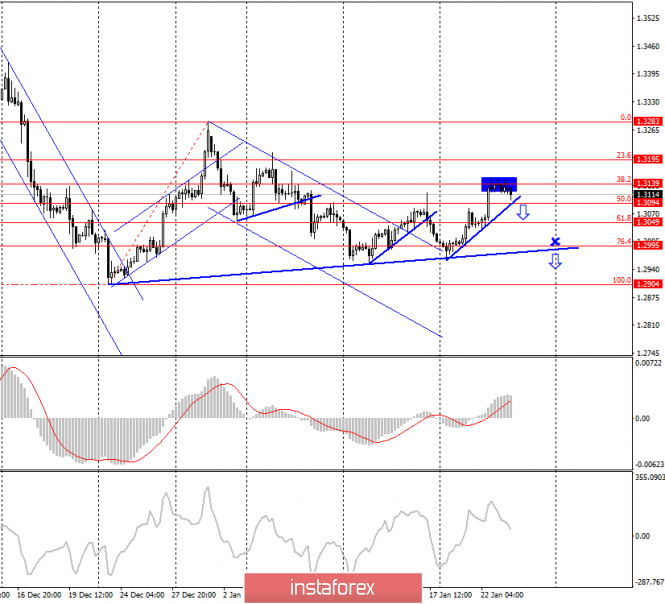
As seen on the 4-hour chart, the GBP/USD pair performed an increase to the corrective level of 38.2% (1.3139). At the moment, traders have not been able to close above this Fibo level, so the rebound of quotes will work in favor of the US dollar and the resumption of the fall. Fixing the pair's rate under the upward correction line will also work in favor of the US dollar and falling in the direction of the global correction line near the level of 76.4% (1.2995). There are no emerging divergences today. Closing the pair's rate above the Fibo level of 38.2% will cancel or delay expectations of a fall in the British dollar for some time. The pound-dollar pair had no information background today. There is no news from the UK (important). There were only reports that the Parliament (both Houses) finally approved the Brexit bill and now the matter remains small - the signature of Queen Elizabeth II. There is even less news on the trade agreement with the European Union. British Finance Minister Sajid Javid said the deal could be signed in both goods and services. However, this is the opinion of the British Minister and not the EU Ministers. It's too early to be happy. Forecast for GBP/USD and trading recommendations: The trading idea is still in the sales of the pound. Near the level of 1.3139, I expect a reversal with a further fall to 1.2995. I recommend that traders wait for the close below the corrective line and make a Stop Loss for the Fibo level of 38.2% (1.3139). The material has been provided by InstaForex Company - www.instaforex.com |
| EURUSD for 01/23/2020. The ECB left rates unchanged but announced the beginning of a policy review Posted: 23 Jan 2020 05:28 AM PST
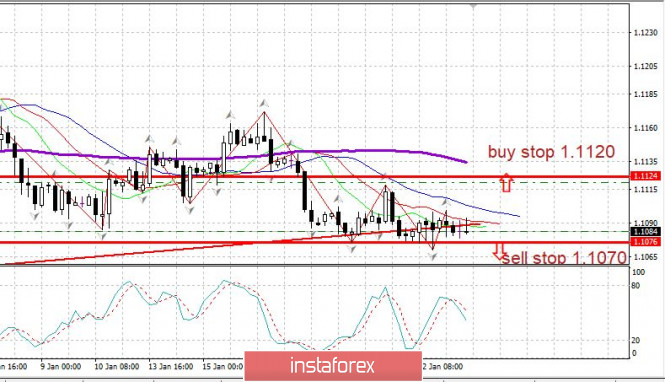
The ECB left the base rate at 0%; the deposit rate for banks - minus 0.5%. The ECB left the purchase of assets from the market at 20 billion euros a month. However, the ECB has announced that it is beginning to review its monetary policy strategy. The ECB is going to leave rates unchanged until inflation hits the ECB's target, slightly below 2%. Before the revision of rates, the ECB will stop the repurchase of assets. EURUSD: We buy from 1.1120. We sell from 1.1070. The material has been provided by InstaForex Company - www.instaforex.com |
| Posted: 23 Jan 2020 05:08 AM PST Technical analysis:
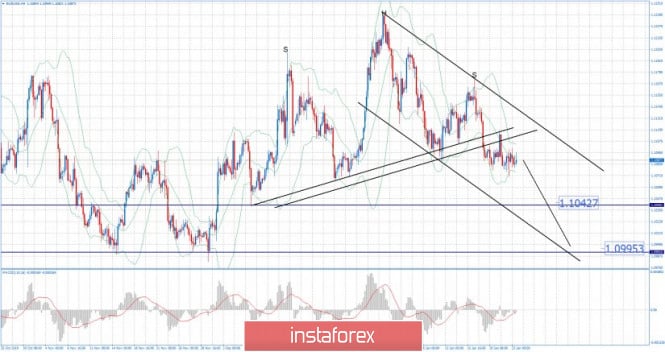
EUR/USD has been trading sideways at the price of 1.1088. Anyway, I found the breakout of the important pivot support and there is also Head and Shoulders pattern in the background, which is sign for the downside pressure. The breakout of the important support is the early trigger for the downside movement. My advice is to watch for selling opportunities on the rallies using intraday-frames 5/15 minutes. MACD oscillator is showing decreasing momentum and the slow line turned bullish. Resistance levels are set at the price of 1.1100 and 1.1115 Support levels and downward targets are set at the price of 1.1040 and $1.1000 The material has been provided by InstaForex Company - www.instaforex.com |
| Posted: 23 Jan 2020 04:56 AM PST Technical analysis:
Gold tried once more to break important pivot resistance at $1.562 but with no success, which is sign that sellers are in control. Watch for selling opportunities on the rallies using the lower frames with main target at $1.536. Putting the second test and reject of $1.562 is the early trigger for the downside. My advice is to watch for selling opportunities on the rallies using intraday-frames 5/15 minutes. MACD oscillator is showing decrease on the upside momentum and slow line turned bearish. Resistance levels are set at the price of $1.562 and $1.568 Support levels and downward targets are set at the price of $1.550 and $1.536. The material has been provided by InstaForex Company - www.instaforex.com |
| Posted: 23 Jan 2020 04:39 AM PST Industry news: As China slips, the world economy remains on edge as markets posted relatively anemic trading yesterday. Bitcoin was no exception, slipping downward by around -2.5 percent. It is currently trading at around $8,450. Although Bitcoin is often characterized as a hedge against global chaos, this has not been backed up by historical trends. In fact, it's been determined again and again that Bitcoin's price tends to follow the S&P 500. In order words, a healthy stock market means that Bitcoin will see healthy price growth. That's what makes the panicked Chinese stock market so concerning — it could cause a domino effect that could severely impact world markets. The end result would destructive not only for the S&P500 but also for Bitcoin (BTC). All eyes are on China now as it looks to regain the losses it recently incurred. However, the panic likely won't subside completely until the Wuhan coronavirus is fully under control. Technical analysis:
BTC finally managed to break important pivot support at the price of $8.400, which is good confirmation for further downside movement. The rejection of the Pitchfork upward channel is the early trigger for the downside. My advice is to watch for selling opportunities on the rallies using intraday-frames 5/15 minutes. MACD oscillator is showing decrease on the upside momentum, which is sign of the weak buying. Stochastic is in overbought zone and with fresh new bear cross Resistance levels are set at the price of $8.740 and $9.000 Support levels and downward targets are set at the price of $7.736 and $6.930. The material has been provided by InstaForex Company - www.instaforex.com |
| Analysis and trading ideas for AUD/USD as of January 23, 2020 Posted: 23 Jan 2020 04:04 AM PST Hello, dear colleagues! After the Australian Bureau of Statistics reported today at 01:30 (London time) that the unemployment rate in the country fell to 5.1%, contrary to forecasts that unemployment will remain at 5.2%, the Australian currency perked up and even at the time of writing shows a significant strengthening. Since no more macroeconomic statistics from Australia will be published this week, the AUD/USD currency pair will be influenced by technical factors and external background. For example, the price dynamics of this currency pair may be affected by the situation of a very dangerous and not yet fully understood virus that is gaining strength in China. Let me remind you that China is Australia's largest trading partner, so everything that happens in China is reflected in the Australian dollar to some extent. If Australia does not receive macroeconomic reports by the end of this week, this cannot be said of the United States, where we will receive data on changes in oil reserves from the Department of Energy, the index of business activity in the manufacturing sector, as well as the index of business activity for the service sector from Markit. However, as I wrote above, this is not particularly important data, so all attention, in my personal opinion, should be paid to the charts of the AUD/USD currency pair. Daily
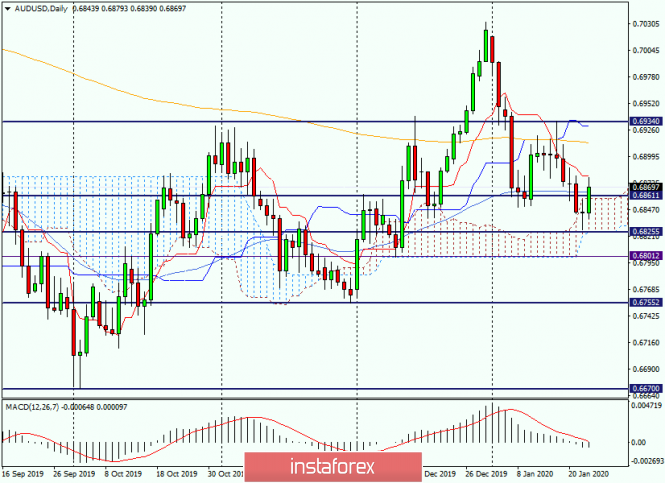
The picture that is observed on the daily chart demonstrates the pair's reversal in the north direction, which we observe at this stage of time. First of all, this is indicated by the "Rickshaw" candle, which appeared on January 22. As you can see, the pair entered the limits of the Ichimoku indicator cloud. As a result of today's growth, the quote is trading above the upper border of the cloud and the strong Kijun line. The next obstacle for the "Aussie" bulls will be the Tenkan line, which runs at 0.6881. Closing today's trading session above Tenkan will give reason to expect further growth to 0.6913, where the 200 exponent passes, and possibly higher, to the Kijun line, which is at 0.6930. In my opinion, it is premature to talk about the further promotion of the pair to the top. First, let's see how the "Australian" will pass the designated obstacles, and whether it will pass them at all. As for the targets at the bottom, everything will depend on the ability to break through strong support in the area of 0.6856-0.6850, where the lower border of the Ichimoku indicator cloud passes very close. If the AUD/USD bears manage to push the pair down from the cloud and gain a foothold under it, the sellers will have control over this instrument. In this case, the next extremely important mark at the bottom will be a strong level of 0.6800, on the passage of which the prospects of the instrument will depend. H4
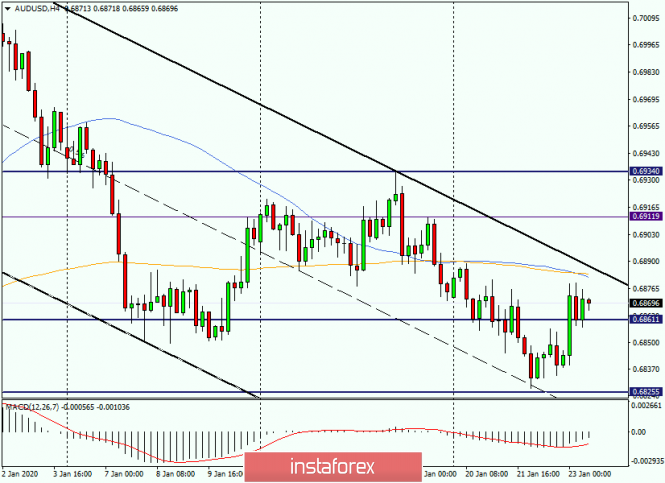
On the four-hour chart, I built a downward channel with the parameters: 0.7032-0.6934 (resistance line) and 0.6850 (support line. At the moment of writing, AUD/USD is trading at the top of the channel, but to leave it up, you need to penetrate not only the upper border but also simple 50 and 200 exponential moving averages, which may provide additional and strong enough resistance in moving prices up. Technically, this is a pretty good point to open short positions, however, the strong data on unemployment in Australia and the technical picture on the daily chart indicating a reversal of the pair do not inspire much optimism in terms of sales. On the other hand, purchases under the moving averages and the channel's resistance line cannot be called an actual trading decision. Thus, based on the technical picture considered on the daily and four-hour charts, you can try the following trading plan. Based on the H4 chart, you can risk selling the pair when it rises to the price zone of 0.6882-0.6888. Above, you can look at opening short positions after rising to 0.6912 and 0.6934. Naturally, if it takes place. When it comes to purchasing - we are waiting for a true breakdown of 50 MA, 200 EMA and the upper border of the channel, then on the rollback to the broken line and moving averages, we buy in the hope of continuing growth. We are looking for purchases at more attractive and low prices after the pair's decline to the area of 0.6855-0.6850. That's probably all. I wish you successful trading and profitable transactions! The material has been provided by InstaForex Company - www.instaforex.com |
| Trading plan for EUR/USD for January 23, 2020 Posted: 23 Jan 2020 03:57 AM PST
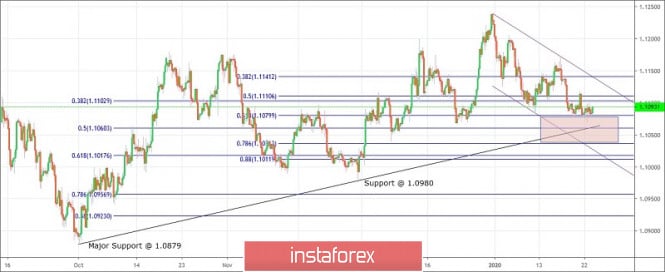
Technical outlook: EUR/USD is seen to be trading at around 1.1093 levels at this moment of writing after printing lows at 1.1070 yesterday. The pair still remains extremely close to the fibonacci 0.618 retracement of recent upswing between 1.0980 through 1.1240. A bullish reversal remains the high probability from current levels, but please do not rule out yet another dip towards 1.1017 before a major turn. It looks like a complex correction is underway since 1.1240 and yet another drop might be required before euro bulls are back in thh market again. I expect a short rally towards 1.1130/35 levels from here before EUR/USD could turn lower again. Please note that the channel support is also seen towards the 1.1010 levels, which should be encouraging to bulls. While the overall bullish structure remains intact until EUR/USD stays above 1.0879, we expect yet another shallow drop in the short term before a major uptrend towards 1.1500 could resume. Trading plan: Remain long, stop @ 1.0879, target 1.15 Good luck! The material has been provided by InstaForex Company - www.instaforex.com |
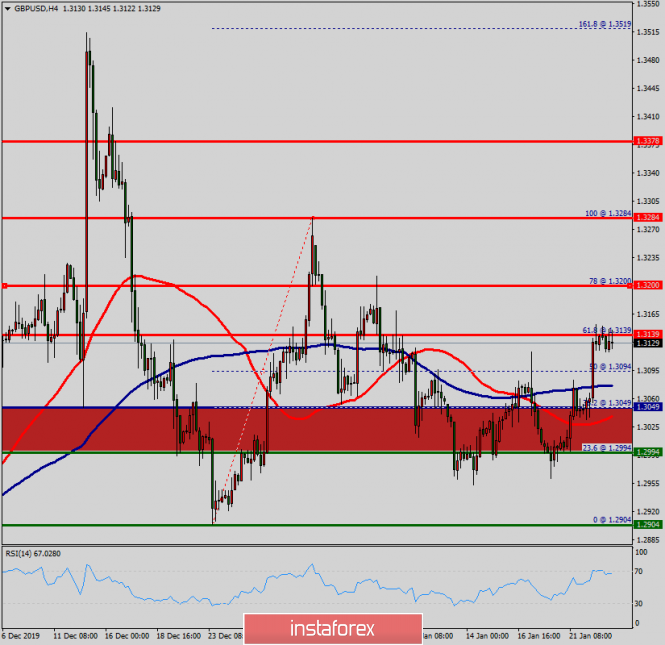
| Technical analysis of GBP/USD for January 23, 2020 Posted: 23 Jan 2020 03:03 AM PST Overview: The resistance of GBP/USD pair has broken; it turned to support around the daily pivot point of 1.3049. Thereby, forming a strong support at 1.3049. The level of 1.3049 coincides with the ratio of 38.2% Fibonacci retracement which is acting as major support today. The Relative Strength Index (RSI) is considered overbought because it is above 30. At the same time, the RSI is still signaling an upward trend, as the trend is still showing strong above the moving average (100), this suggests the pair will probably go up in coming hours. Accordingly, the market will probably show the signs of a bullish trend. In other words, buy orders are recommended above 1.3049 level with their first target at the level of 1.3200. From this point, the pair is likely to begin an ascending movement to the point of 1.3200 and further to the level of 1.3284. The price of 1.3378 will act as a strong resistance and the double top has already set at the point of 1.3378. On the other hand, if a break happens at the support of 1.2904, then this scenario may become invalidated. But in overall, we still prefer the bullish scenario. The material has been provided by InstaForex Company - www.instaforex.com |
| Overview for EUR/USD on January 23, 2020 Posted: 23 Jan 2020 03:01 AM PST Hello! The trade war between the US and China is yielding its "fruits". Since 2009, world trade has declined by 0.5%, and it seems that this is far from the limit. Compared to 2018, the trade turnover between the United States of America and the people's Republic of China fell by about 90 billion US dollars in the eleven months of 2019. This is the main reason for the decline in world trade by half a percent. Also, the trade war between Washington and Beijing has created many other problems and uncertainties. For example, in the industrial processing sector - a significant increase in tariffs last year could lead to additional barriers, and this could become another serious problem for the global economy. Now let's move on to the current situation for the main currency pair euro-dollar. Yesterday's data from the US on home sales in the secondary market was stronger than the forecast of 5.43 and amounted to 5.54. Macroeconomic statistics from the euro area were not provided yesterday. But today, the single European currency has another day. It's a busy and very important day. The main event for the euro will be the ECB's interest rate decision, which will be published at 13:45 (London time). No changes are expected here. The European Central Bank will most likely not change the parameters of its monetary policy and will keep the main rate at zero. Much more interesting for market participants will be the press conference of ECB President Christine Lagarde, which is scheduled to start at 14:30 (London time). As a rule, it is based on the tone and rhetoric of the head of the ECB that investors begin to actively sell or buy the single currency. Weekly reports on initial applications for unemployment benefits from the United States are less important than the ECB's decision on rates and, especially, the press conference of the head of this department. However, in today's EUR/USD trading, data from the US for benefit requests must also be taken into account. Now let's look at the daily chart of the euro-dollar and try to understand the further direction of the main currency pair of the Forex market. Daily
As you can see, since January 13, the pair is consolidating in the range from 1.1173 to 1.1070. The fact that the euro bulls managed to overcome the mark of 1.1200 and, most importantly, confidently gain a foothold above this important and strong level indicates a lack of strength and weakness of the players to increase the rate. Most often, after such cases, the pair turns down and shows an active decline. However, in our case, this is not happening yet. Today is a very good day for this. In the case of Christine Lagarde's "dovish" tone, during her press conference and disappointing prospects for the economy of the currency bloc, the euro will come under serious selling pressure and will decline across the entire spectrum of the market. In the case of a moderate tone or a moderately hawkish one, depending on the nuances of the ECB head's speech, the single currency can demonstrate a strengthening, and quite serious. So, the main and very important support is at 1.1070. A true breakout of this level will indicate further downward prospects for EUR/USD. If the nearest resistance of sellers is broken at 1.1103, the road to higher targets in the area of 1.1117 and 1.1152 will open. On a day like this, when during Lagarde's press conference, volatility will go off the scale and anything can happen. I will not give clear trading recommendations and even more so offer to place pending orders. I believe that extra and not mandatory stops are unnecessary. Good luck and have a good day! The material has been provided by InstaForex Company - www.instaforex.com |
| Posted: 23 Jan 2020 01:55 AM PST
On Wednesday, the GBP/USD pair updated two-week highs around 1.3150. Following the results of the past five trading days, pound became the leader of growth among the "Big Ten" currencies. A number of factors contributed to the strengthening of the British currency. The day before, the House of Lords approved the Brexit bill. Or rather, it was forced to approve it, since earlier on Wednesday, the House of Commons rejected all the amendments proposed by the peers. Now, the document must be signed by Queen Elizabeth II of England for formalities. Thus, in nine days, on January 31, the United Kingdom will leave the European Union, but the European Parliament must first ratify the "divorce" agreement, which is expected to happen on January 29. And so, a transition period will begin in February, which will last until the end of this year. During this period, Albion will continue to comply with EU laws until a new free trade agreement is concluded with the remaining 27 countries in the Alliance.
Both London and Brussels recognize the tight deadlines which a trade deal must be concluded. Yesterday, British Finance Minister Sajid Javid said that an agreement could be reached on both goods and the services market. A report released yesterday by the Confederation of British Industrialists (CBI) showed that quarterly business optimism among British manufacturers jumped to the highest level since April 2014 (from -37 in October last year to -22 in January). Against this background, the chances of cutting interest rates by the Bank of England next week fell from 70% to 50%, and the pound was able to recoup its losses against the US dollar from January 9. At this time, BoE Governor Mark Carney signaled that monetary easing is still on the table, as the recovery of the national economy, hit by Brexit's uncertainty, is not guaranteed. Now, the focus of market participants is on the British purchasing managers' indices for January. A positive surprise from business activity can significantly accelerate the growth rate of the pound. The technical picture of the GBP/USD pair indicates that the pound is ready to try to retest the highs in the $1.3500 area. This maximum level since May 2018 was reached on December 13, when the Conservative party won a landslide victory in the UK elections, and won a majority of seats in the House of Commons. The nearest target for GBP/USD is 1.3300, which is the maximum of the last trading day of 2019. The material has been provided by InstaForex Company - www.instaforex.com |
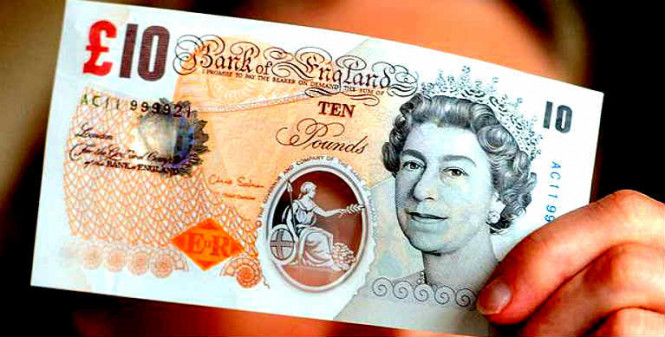
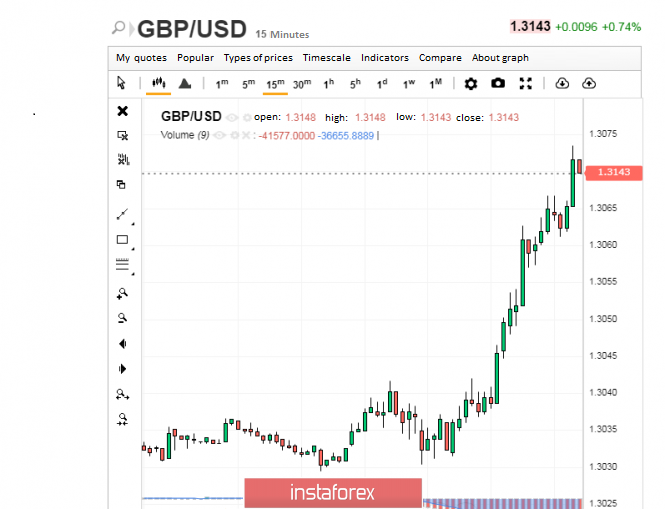
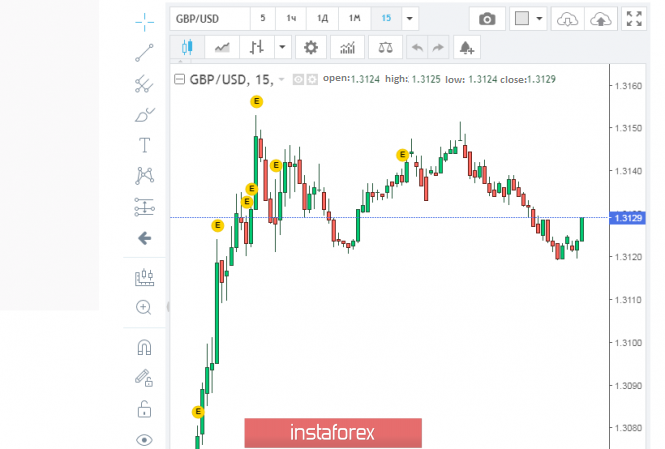
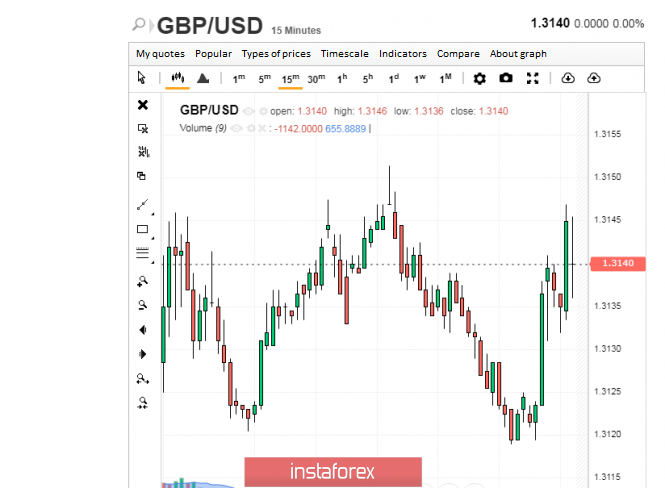
| Pound: facing statistics, sideways to geopolitics Posted: 23 Jan 2020 01:54 AM PST At the end of the week, the British currency managed to surprise experts, showing an unexpected reaction to the current macroeconomic data in the country. Previously, the pound either ignored such news or showed a weak reaction to them. However, this time everything turned out differently, analysts emphasized. For a long time, the dynamics of the sterling depended solely on news related to the British exit from the European Union and did not pay much attention to the "smaller" factors. And at the moment, macroeconomic data came first for the pound quotes. Experts say such a reaction may be due to the coincidence and sequence of two important events, namely, the release of macro statistics and then the adoption of the Brexit bill. Recall, that on the evening of January 22, a document was approved in the House of Lords of the British Parliament that regulates Britain's exit from the EU. Its signing will be the first step towards the divergence of Foggy Albion and the countries of the Euroblock. It is expected that on January 31 this year, the country will leave the EU, as planned. The transition period will begin on February 1, and this adaptation will last until the end of this year. Throughout 2020, the UK will comply with the laws of the Euroblock until a new free trade agreement is concluded with the remaining 27 EU countries. The current situation provided significant support to the British currency, the pound that had previously fallen, perked up. And on Wednesday, the quotes fell to 1.3143 and subsequently remained at that level. According to analysts, the key resistance level for the pair GBP/USD was the mark of 1.3128. On Thursday, January 23, the tandem cruised near this bar adding 1 point to 1.3129. Furthermore, the sterling managed to rise to 1.3139–1.3140, and in this range, the GBP/USD pair continues to run. Finding itself dependent on economic reports, the British currency baffled market participants. On Tuesday, the pound gained 0.7% against the greenback after the publication of the report of the Confederation of British Industry. Current data regarding business optimism exceeded experts' forecasts, which allowed sterling to move up. For some time, the risks associated with Brexit were secondary, and investors focused on the upcoming meeting of the Bank of England. At the moment, experts estimate the probability of a decrease in the interest rate of less than 50% compared with 70% that was recorded last week. The current situation instills vigor in the currency of Foggy Albion. According to analysts, the "British pound" has already won back the losses incurred since January 9, 2020. Recall that at that time Mark Carney, Governor of the Bank of England, made it clear that the likelihood of a reduction in the key rate is still valid. Currently, this threat has passed but not to the end, as the economic growth in the UK which has suffered from problems with Brexit remains low by European standards. According to experts, this week the pound has clearly demonstrated its contradictory nature. Its violent reaction to statistics even slightly exceeded the response to the Brexit bill. Experts believe that in the near future, the British currency can present no less interesting surprises related to the current economic and political situation. The material has been provided by InstaForex Company - www.instaforex.com |
| Trading plan on EUR/USD and GBP/USD for January 23, 2020 Posted: 23 Jan 2020 01:14 AM PST What happened with the pound yesterday is a real holiday. It's rapid rise was so sudden that it had a hypnotic effect at first. Market participants could not take their eyes off the vertical line aimed somewhere in the direction of the stratosphere. At the same time, the take-off speed clearly indicated the intention to reach the first space speed. The spell, however, gradually relaxed, and most of the speculators immediately began to ask stupid questions about what exactly happened to the pound. As you can easily guess, objective and balanced responses were received immediately, but it had to be corrected and adjusted, that its meaning changed beyond recognition.
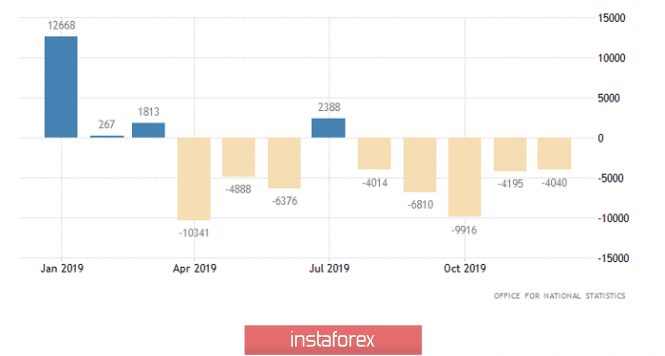
Naturally, everyone rushed to look at the British statistics first. However, the trouble is that data on government borrowing, which decreased by 4.0 billion pounds, was published an hour and a half before the pound flew into the upper atmosphere. At the same time, the net government borrowing did not just decrease, but has been declining for five months in a row, and its total amount of decline during this time is at almost 29.0 billion pounds. This did not impress anyone at all. What turned out though is that at the exact same time that the pound went up like a rocket, the CBI published its indices, and everyone immediately started shouting that it was all about them. The proof was instantly found in the form of the business optimism index, which rose from -44 to 23 points. Meanwhile, everyone somehow easily dismissed the index of industrial orders, which grew from -28 points to -22 points. What they focused on is that there is a fantastic increase in the business optimism index. I want to ask just one stupid question though. Can anyone, until yesterday, remember mentioning the CBI business optimism index in the context of its impact on the pound? After all, if it was the reason why such a holiday happened, then we should contemplate such a thing once a month. No one can remember anything like this though, so explaining the growth of the pound with an index that no one knows anything about is a classic example of pulling an owl on the globe. If the real financial situation of the state pales against the background of some kind of optimism of some entrepreneurs, then put out the light. If it turns out that the economy depends on the emotional mood of businessmen, then it is easier to close such an economy and forget about it as a nightmare. Net government borrowing (UK):
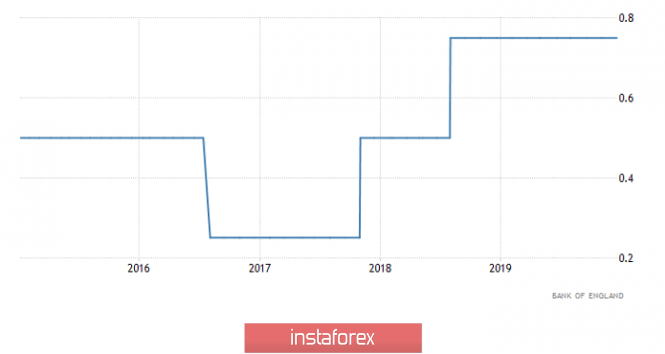
So what really caused the pound to rise so suddenly? Practice shows that in a market squeezed in a narrow range, any indexes, even most macroeconomic indicators, can not breathe new life into the market. What they are capable of is a reversal in the central banks' policy. And so, on Tuesday, all forecasts said that at the end of the next board meeting of the Bank of England, the refinancing rate will be reduced from 0.75% to 0.50%. However, yesterday, forecasts were revised, and now, the reduction in the refinancing rate of the Bank of England is postponed until the third quarter. These forecasts were largely based on the value of interest rate futures. In other words, what happened is at first, everyone was preparing to reduce the refinancing rate. However, we were told that we can relax, as the decision on the issue is postponed. As a result, everyone relaxed and happily began to buy the pound. That's the whole story. But most importantly, the upcoming board meeting of the Bank of England has lost all its intrigue. The rate of refinancing (United Kingdom):
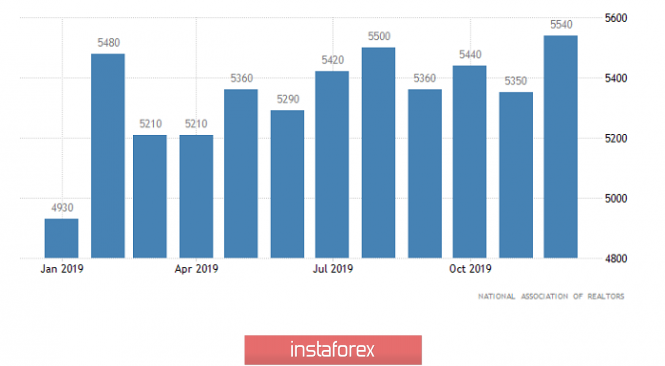
Pound's growth was only stopped by excellent statistics on the real estate market in the United States. First, it became known that real estate prices for the month increased by 0.2%. However, this did not impress anyone much, since the data coincided with the forecasts. Meanwhile, the same cannot be said for home sales in the secondary market, as it should have increased by 1.3%, but instead increased by 3.6% from 5.35 million to 5.54 million. This clearly demonstrates that the optimism of individual businessmen is a good thing, however, the reality is still more tangible. Home sales in the secondary market (United States):
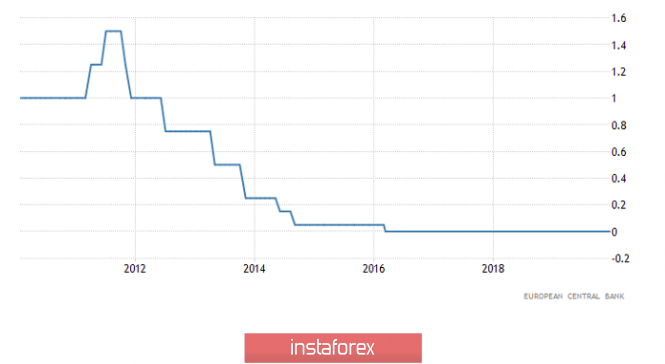
If the upcoming board meeting of the Bank of England is no longer of any interest to investors, then today's meeting of the Board of the European Central Bank is the most intriguing event of the month. It's worth mentioning right away that based on the results of this meeting, no practical changes are expected in the current monetary policy. The topic that is anticipated is the ECB's plans in the near future. In addition, adding to the intrigue is the fact that Christine Lagarde forbade ECB representatives from making any statements regarding the regulator's monetary policy. Such actions only make sense if Christine Lagarde is intending to make a loud statement today. In fact, at the moment, the European Central Bank continues to pursue an ultra-soft monetary policy that implies a gradual reduction in the interest rates. This policy has been implemented for almost a whole decade, and if nothing is changed, the next step will be to reduce the refinancing rate to negative values. The goal of this policy is very simple: to stimulate economic growth. However, if you look closely at this very economic dynamics in Europe, what seems to be the one being achieved is the opposite result. Why set a full radio silence mode? Is it to announce the beginning of normalization of monetary policy? We are waiting for an incredibly interesting press conference by Christine Lagarde. There, she will either confirm her commitment to the current exchange rate, or announce that the European Central Bank will gradually tighten the parameters of monetary policy in the near future. If everything remains the same, the single European currency will continue its dismal downward movement. On the other hand, if we hear about a change on political course, euro may arrange a performance that will make pound's performance yesterday a child's amateur one. The rate of refinancing (Europe):
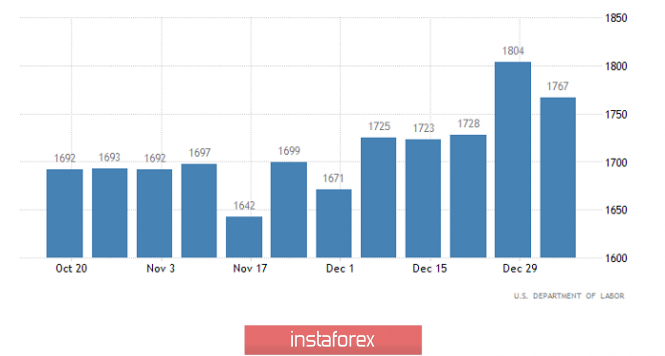
Christine Lagarde's press conference will begin at the same time that data on applications for unemployment benefits in the United States will be published. Because og this, no one will pay attention to them, especially since there is nothing to look at, as the overall balance should remain unchanged. The number of initial applications for unemployment benefits should increase by 8 thousand, while the number of repeated applications will be reduced by exactly this amount. Number of repeated applications for unemployment benefits (United States):
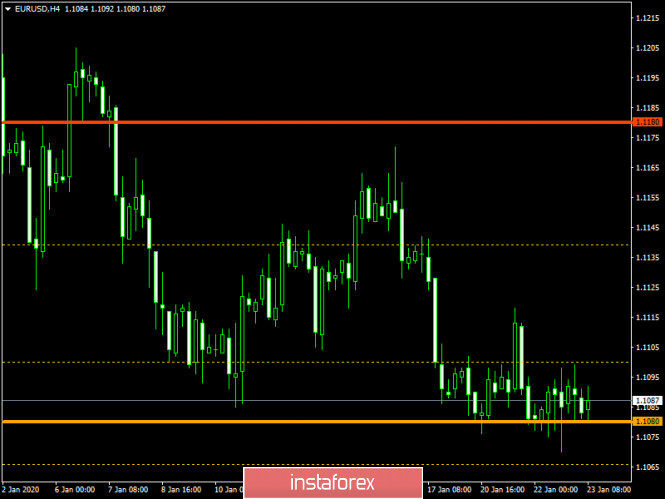
Having an extremely low amplitude of oscillation, the EUR/USD currency pair is still concentrated within the range of 1.1080. In fact, the past days have formed a variable range from 1.1070 to 1.1100, where there is a distinct indecision for action. The range boundaries will likely play a role in the market, but not for long. As soon as there is a characteristic noise, a surge will break through the framework. If this happens, it is better to take a wait-and-see position outside the market. After clearing the circumstances, work on the course of the residual impulse.
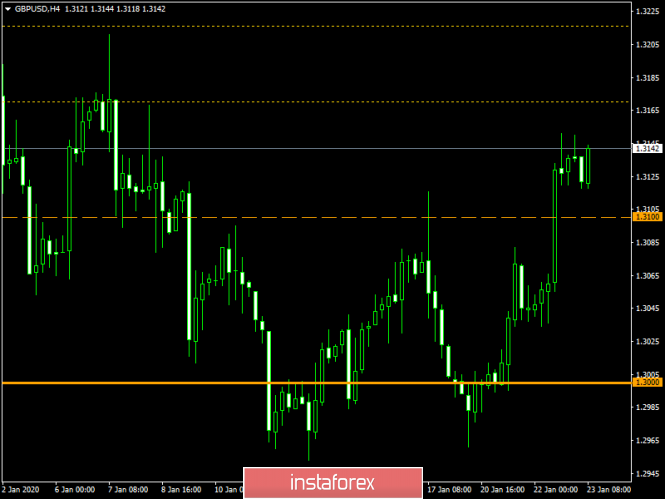
The GBP/USD currency pair showed activity, and formed an impulse candle towards the 1.3150 mark. There are odd that the local overbought will temporarily restrain the ardor of buyers, and form a slowdown in the range of 1.3115/1.3150. If that happens, it is worth to look at the price fixing points, as well as the dynamics of the EUR/USD pair.
|
| You are subscribed to email updates from Forex analysis review. To stop receiving these emails, you may unsubscribe now. | Email delivery powered by Google |
| Google, 1600 Amphitheatre Parkway, Mountain View, CA 94043, United States | |





No comments:
Post a Comment