
Forex analysis review |
- Forecast for EUR/USD on January 29, 2020
- Forecast for GBP/USD on January 29, 2020
- Forecast for AUD/USD on January 29, 2020
- Fractal analysis of the main currency pairs for January 29
- Trading idea for gold
- EUR/USD. January 28. Results of the day. US macroeconomic statistics supported the dollar
- GBP/USD. Pound to the slaughter: prospects look gloomy
- Donald Trump caught in a lie. Video proves the insincerity of the US president
- GBPUSD: Pros and cons of UK interest rates
- GBP/USD. Passion rate: will the Bank of England soften monetary policy?
- Swiss franc: feast during the plague?
- January 28, 2020 : GBP/USD Intraday technical analysis and trade recommendations.
- January 28, 2020 : EUR/USD Intraday technical analysis and trade recommendations.
- EUR/USD. January 28. A report on orders for long-term products can stop the pair from falling
- GBP/USD. January 28. The Briton almost fulfilled the target of 1.2995. We are waiting for the formation of a new trading
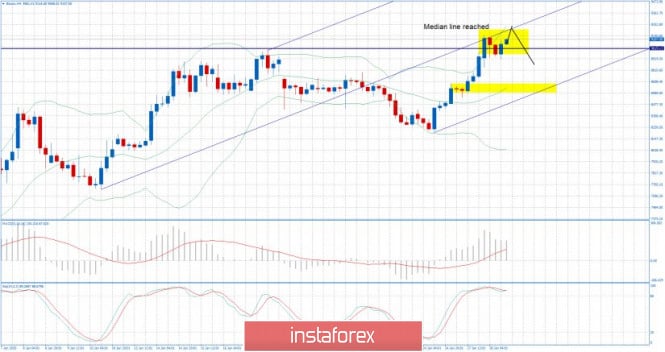
- BTC analysis for 01.28.2020 - Median line reached, possible rotation around it and even short-term decline
- GBP/USD: plan for the US session on January 28. The bears continued to put pressure on the pound, reaching 1.2997. New target
- EUR/USD: plan for the US session on January 28. Time to protect the level of 1.1004. The euro continues to decline against
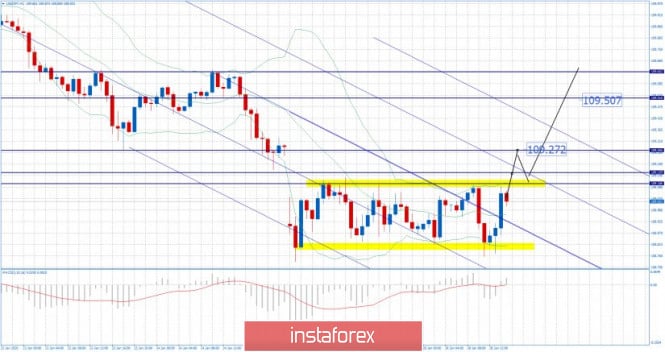
- USD/JPY analysis for January 28, 2020 - Watch for breakout of the well defined trading range, key resistance at 109.16
- Gold 01.28.2020 - First downward target has been reached at the price of $1.577, possible second target at $1.569
- Evening review for EURUSD on 01/28/2020. Virus in the spotlight
- Trading recommendations for EURUSD on January 28
- Trading plan for AUDUSD for January 28, 2020
- Trading plan for GBPUSD for January 28, 2020
- Trading plan for EURUSD for January 28, 2020
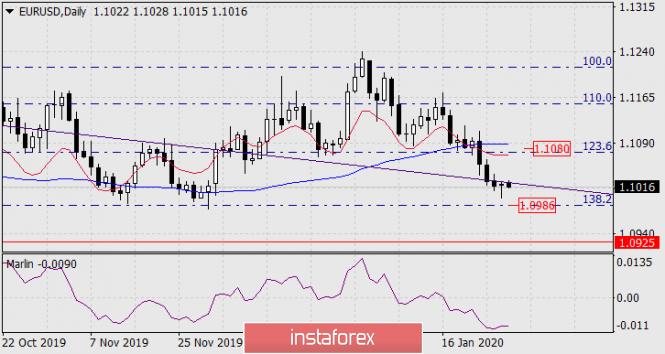
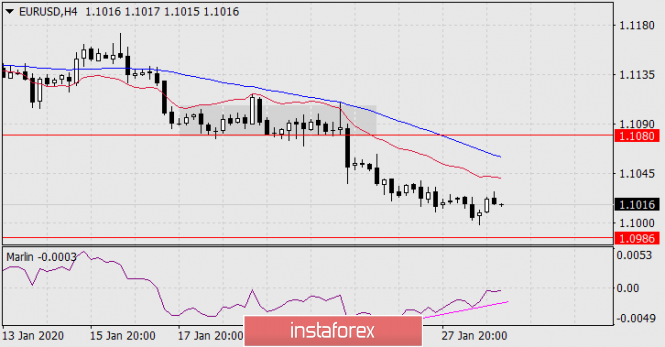
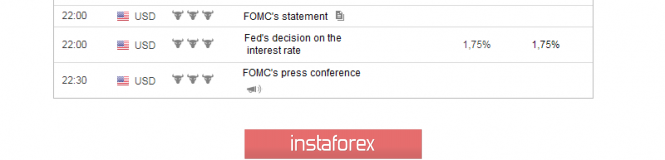
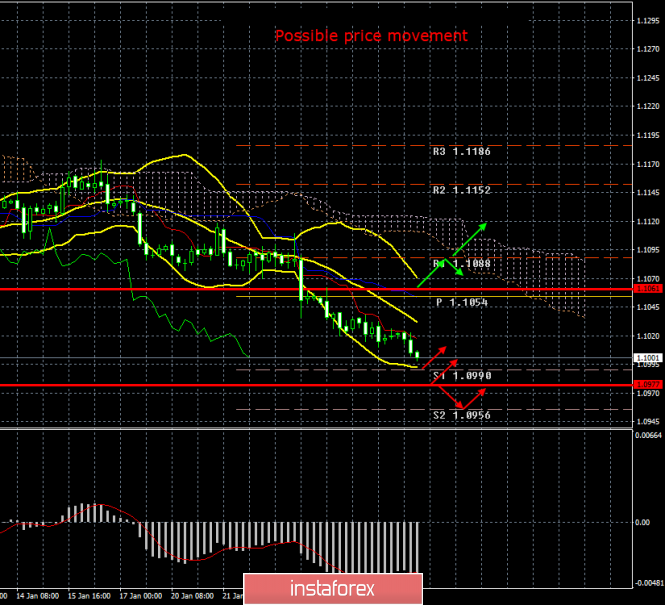
| Forecast for EUR/USD on January 29, 2020 Posted: 28 Jan 2020 08:08 PM PST EUR/USD Expectations of investors on good US data came true yesterday. The volume of orders for durable goods increased by 2.4% in December against the forecast of 1.2%, the root index (excluding vehicles) still showed negative -0.1%. But then everything is fine: the business activity index in the manufacturing sector of Richmond amounted to 20 points in January against expectations of -3 and -5 in December, consumer confidence from the Conference Board increased from 128.2 to 131.6 in January. The US stock index S&P 500 grew 1.01%. Also yesterday it was reported that a vaccine was developed in Hong Kong against the Wuhan coronavirus. If clinical trials are suspiciously fast, in a few weeks, then this topic can be considered exhausted. Note that the former chief state sanitary doctor of the Russian Federation Gennady Onishchenko previously reported that this coronavirus is successfully treated with existing drugs. Today, the main event will be the Federal Reserve meeting. The meeting is passing, that is, without making any decisions and without publishing the Fed's economic forecasts. But there is one caveat - during Jerome Powell's press conference, the issue of the duration of the current program for repo operations may be discussed. Rumor has it that the program will be diluted with the repurchase of longer-term securities, which in fact will no longer be hidden by QE. This could put pressure on the dollar. On the daily chart, the price did not exactly fulfill the target level of 138.2% Fibonacci, but the price tested the November support range. The signal line of the Marlin oscillator is turning up, the price is near the embedded line of the price channel. Consolidation above it will lead to corrective growth of the euro, to the area of the Fibonacci level of 123.5% (1.1080). On the four-hour chart, the Marlin oscillator formed a convergence with the price. Here, the 1.1080 level is a support for the January consolidation. The probability of correction is 70%. The material has been provided by InstaForex Company - www.instaforex.com |
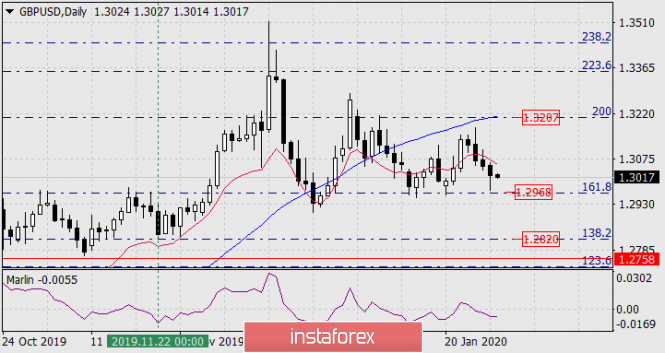
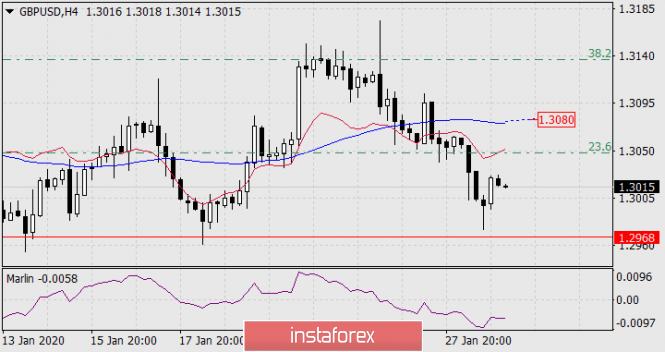
| Forecast for GBP/USD on January 29, 2020 Posted: 28 Jan 2020 08:06 PM PST GBP/USD The pound showed increased volatility on Tuesday - lost 77 points and sharply grew and closed the day with 29 points. The price as a whole worked out the area of the first target at the Fibonacci level of 161.8%, but showed a sign of correction from it. The correction can be deep, to the Fibonacci level of 200.0%, where the blue line of MACD develops. Consolidation at 1.2968 will allow the price to continue to decline to the Fibonacci level of 138.2% (1.2820). Much will depend on today's Fed meeting. There are no obvious reversal signs on the four-hour chart. But there is a free space both for the price - to the MACD line (1.3080), and for the Marlin indicator to the boundary with the growth territory, which in the current situation roughly corresponds to the level of the MACD line on the price chart. On the day of the Fed meeting, the range of free wandering (1.2068-1.3080) attracts increased attention of speculators. Consolidating the price above the upper limit of this range will entail further growth in a deeper correction. Consolidating the price under the Fibonacci level of 161.8% on daily (1.2968) opens the target for the next Fibonacci level of 138.2% at the price of 1.2820. The material has been provided by InstaForex Company - www.instaforex.com |
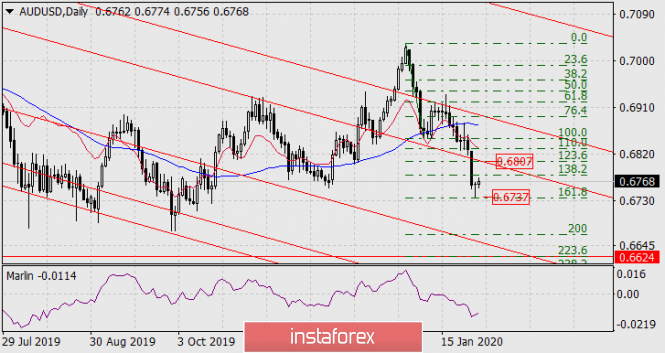
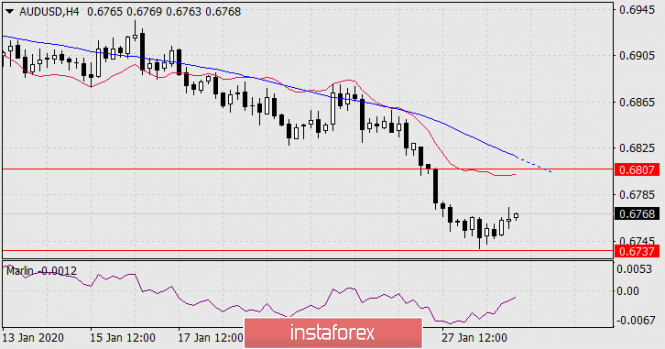
| Forecast for AUD/USD on January 29, 2020 Posted: 28 Jan 2020 08:04 PM PST AUD/USD Yesterday, the Australian dollar worked exactly the first target of 0.6737, adopted at the Fibonacci reaction level of 161.8% on the daily chart. A sharp enough rebound occurred from the level, which visually indicates the price's intention to continue the correction, the immediate goal of which is 0.6807 - the Fibonacci level of 123.6%. Consolidating the price under yesterday's low opens the target at the Fibonacci level of 223.6% at the point of intersection with the embedded line of the price channel (magnetic point) - 0.6624. The Fibonacci level of 200.0% looks weak in this case, as the price tends to a stronger point of attraction. If we assume that the price will continue to decline without preliminary correction, then the movement to the 0.6624 target will follow a gentle path, which is uncharacteristic for the trend. After completion of the expected short-term correction, the decrease to the magnetic point will occur at a traditional speed. |
| Fractal analysis of the main currency pairs for January 29 Posted: 28 Jan 2020 06:20 PM PST Forecast for January 29: Analytical review of currency pairs on the scale of H1:
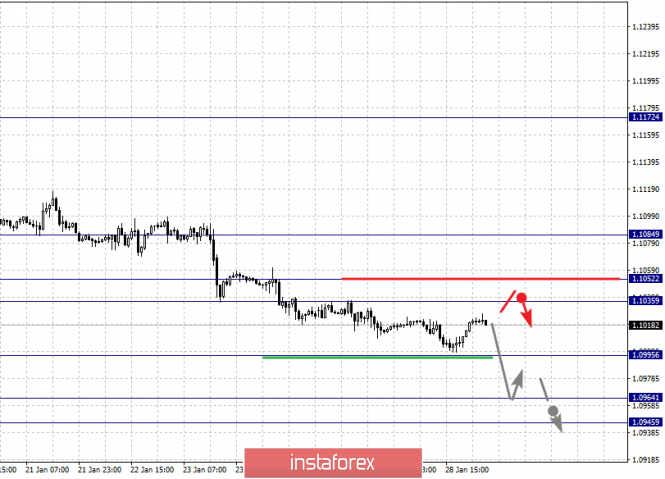
For the euro / dollar pair, the key levels on the H1 scale are: 1.1084, 1.1052, 1.1035, 1.0995, 1.0964 and 1.0945. Here, we are following the descending structure of January 16. The continuation of the movement to the bottom is expected after the breakdown of the level of 1.0995. In this case, the target is 1.0964. For the potential value for the bottom, we consider the level of 1.0945. Upon reaching this level, we expect a pullback to the top. Short-term upward movement is possibly in the range of 1.1035 - 1.1052. The breakdown of the last value will lead to an in-depth correction. Here, the goal is 1.1084. This level is a key support for the downward structure. We expect the initial conditions for the upward cycle to be formed before it. The main trend is the descending structure of January 16 Trading recommendations: Buy: 1.1035 Take profit: 1.1051 Buy: 1.1054 Take profit: 1.1082 Sell: 1.0995 Take profit: 1.0970 Sell: 1.0964 Take profit: 1.0947
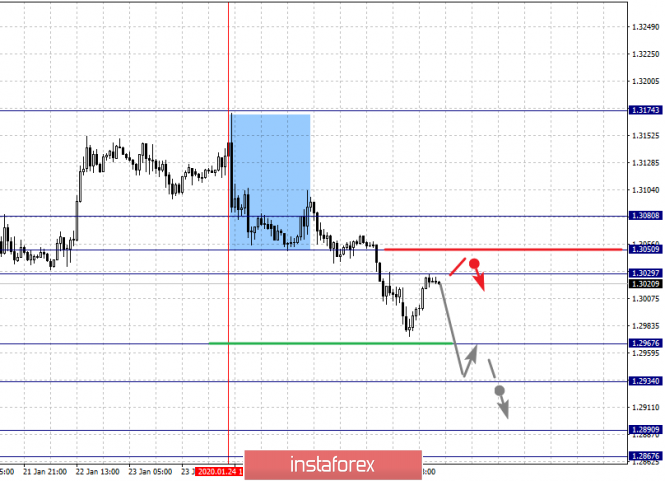
For the pound / dollar pair, the key levels on the H1 scale are: 1.3080, 1.3050, 1.3029, 1.2967, 1.2934, 1.2890 and 1.2867. Here, we are following the development of the downward cycle of January 24. The continuation of the movement to the bottom is expected after the breakdown of the level of 1.2967. In this case, the target is 1.2934. Price consolidation is near this level. Its price passage should be accompanied by a pronounced downward movement to the level of 1.2890. For the potential value for the bottom, we consider the level of 1.2867. Upon reaching which, we expect consolidation, as well as a rollback to the top. Short-term upward movement is possibly in the range of 1.3029 - 1.3050. The breakdown of the latter value will lead to an in-depth correction. Here, the target is 1.3080. This level is a key support for the bottom. The main trend is the descending structure of January 24 Trading recommendations: Buy: 1.3029 Take profit: 1.3050 Buy: 1.3052 Take profit: 1.3080 Sell: 1.2965 Take profit: 1.2936 Sell: 1.2932 Take profit: 1.2890
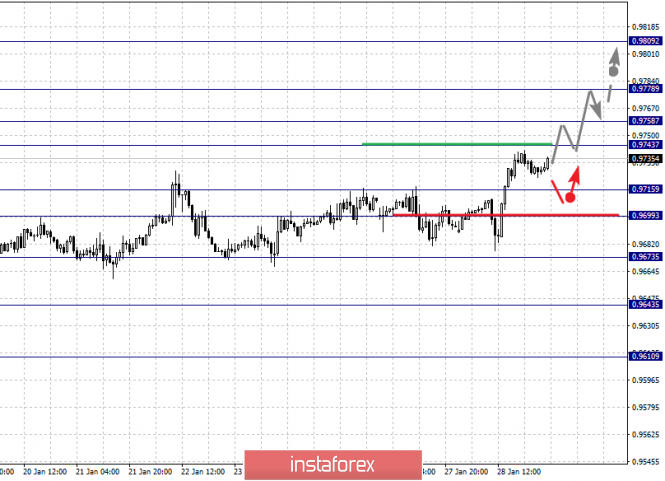
For the dollar / franc pair, the key levels on the H1 scale are: 0.9809, 0.9778, 0.9758, 0.9743, 0.9715, 0.9699 and 0.9673. Here, we are following the development of the ascending structure of January 16. Short-term upward movement is expected in the range of 0.9743 - 0.9758. The breakdown of the latter value will lead to a movement to the level of 0.9778. Price consolidation is near this level. We consider the level of 0.9809 to be a potential value for the upward movement; upon reaching this level, we expect a pullback to the bottom. Short-term downward movement is possibly in the range of 0.9715 - 0.9699. The breakdown of the latter value will lead to an in-depth correction. Here, the target is 0.9673. This level is a key support for the top. The main trend is the upward cycle of January 16 Trading recommendations: Buy: 0.9743 Take profit: 0.9756 Buy: 0.9758 Take profit: 0.9776 Sell: 0.9715 Take profit: 0.9700 Sell: 0.9697 Take profit: 0.9675
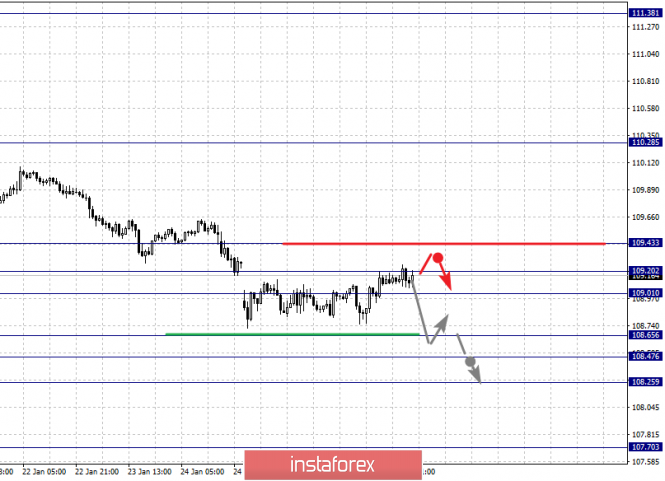
For the dollar / yen pair, the key levels on the scale are: 109.43, 109.20, 109.01, 108.65, 108.47 and 108.25. Here, we are following the downward cycle of January 17. Short-term downward movement is possible in the range of 108.56 - 108.47. The breakdown of the last value will lead to a movement to a potential target - 108.25, and upon reaching this level, we expect a pullback to the top. Consolidated movement is possibly in the range of 109.01 - 109.20. The breakdown of the last value will lead to an in-depth correction. Here, the goal is 109.43. This level is a key support for the downward structure. Main trend: potential downward structure of January 17, correction stage Trading recommendations: Buy: Take profit: Buy: 109.23 Take profit: 109.40 Sell: 108.65 Take profit: 108.48 Sell: 108.45 Take profit: 108.25
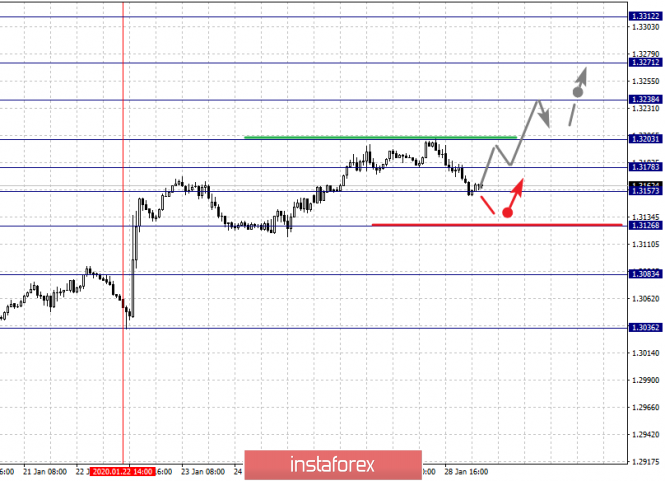
For the Canadian dollar / US dollar pair, the key levels on the H1 scale are: 1.3312, 1.3271, 1.3238, 1.3198, 1.3178, 1.3157 and 1.3126. Here, we are following the development of the upward cycle of January 22. The continuation of the movement to the top is expected after the breakdown of the level of 1.3198. In this case, the target is 1.3238. Price consolidation is near this level. There is a short-term upward movement in the range of 1.3238 - 1.3271. Hence, a reversal to a correction is also possible. The potential value for the top is considered to be the level of 1.3312. Consolidated movement is possibly in the range of 1.3178 - 1.3157. The breakdown of the latter value will lead to an in-depth correction. Here, the target is 1.3126. This level is a key support for the top. The main trend is the local ascending structure of January 22, the correction stage Trading recommendations: Buy: 1.3198 Take profit: 1.3236 Buy: 1.3240 Take profit: 1.3270 Sell: Take profit: Sell: 1.3155 Take profit: 1.3130
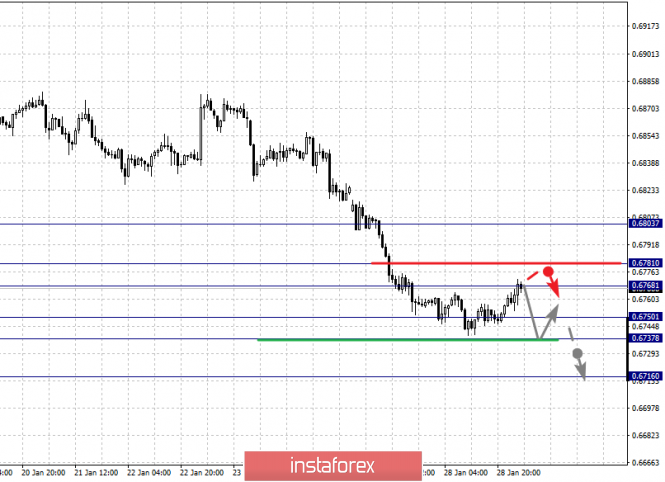
For the Australian dollar / US dollar pair, the key levels on the H1 scale are: 0.6803, 0.6781, 0.6768, 0.6750, 0.6737 and 0.6716. Here, we are following the development of the descending structure of January 16. Short-term downward movement is expected in the range 0.6750 - 0.6737. The breakdown of the latter value will lead to movement to a potential target - 0.6716. We expect a pullback to the top from this level. Short-term upward movement is expected in the range of 0.6768 - 0.6781. The breakdown of the last value will lead to an in-depth correction. Here, the target is 0.6803. This level is a key support for the bottom and before it, we expect the initial conditions for the upward cycle to be formed. The main trend is the descending structure of January 16 Trading recommendations: Buy: 0.6768 Take profit: 0.6780 Buy: 0.6783 Take profit: 0.6800 Sell: 0.6750 Take profit: 0.6737 Sell: 0.6736 Take profit: 0.6716
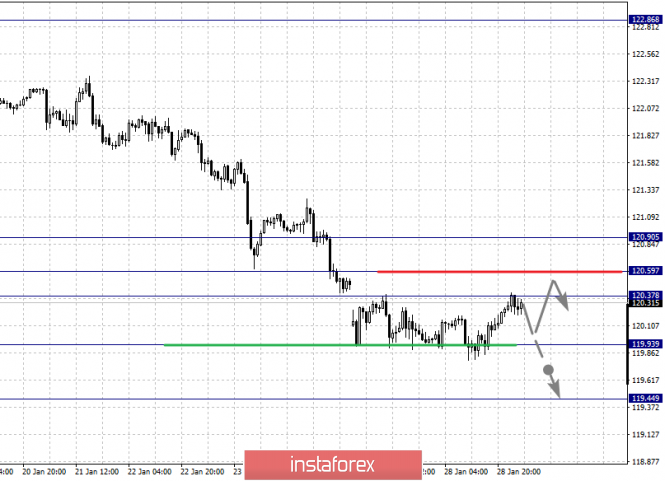
For the euro / yen pair, the key levels on the H1 scale are: 120.90, 120.59, 120.37, 119.93 and 119.44. Here, we are following the descending structure of January 16. The continuation of movement to the bottom is expected after the breakdown of the level of 119.90. In this case, the potential target is 119.44. We expect a pullback in correction upon reaching this level. Short-term upward movement is possibly in the range of 120.37 - 120.59. The breakdown of the last value will lead to an in-depth correction. Here, the goal is 120.90. This level is a key support for the downward structure. The main trend is the descending structure of January 16 Trading recommendations: Buy: 120.37 Take profit: 120.57 Buy: 120.61 Take profit: 120.90 Sell: 119.90 Take profit: 119.48 Sell: Take profit:
For the pound / yen pair, the key levels on the H1 scale are : 143.28, 142.85, 142.53, 142.11, 141.74, 141.21, 140.92 and 140.30. Here, we are following the development of the downward cycle of January 22. Short-term downward movement is expected in the range of 142.11 - 141.74. The breakdown of the last value should be accompanied by a pronounced downward movement. Here, the goal is 141.21. Price consolidation is in the range of 141.21 - 140.92. For the potential value for the bottom, we consider the level of 140.30. We expect a pullback to the top upon reaching this level. Short-term upward movement is expected in the range of 142.53 - 142.85. The breakdown of the last value will lead to an in-depth correction. Here, the goal is 143.28. This level is a key support for the downward movement. The main trend is the descending structure of January 22 Trading recommendations: Buy: 142.53 Take profit: 142.85 Buy: 142.87 Take profit: 143.28 Sell: 142.10 Take profit: 141.76 Sell: 141.72 Take profit: 141.25 The material has been provided by InstaForex Company - www.instaforex.com |
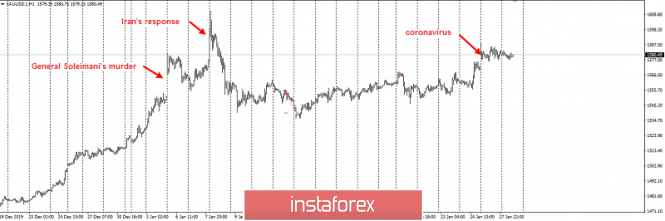
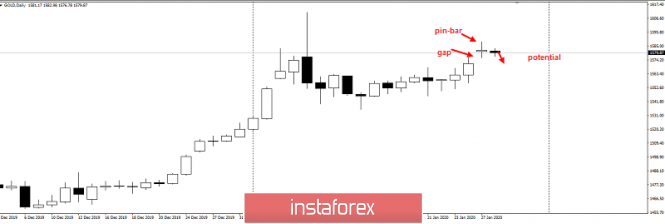
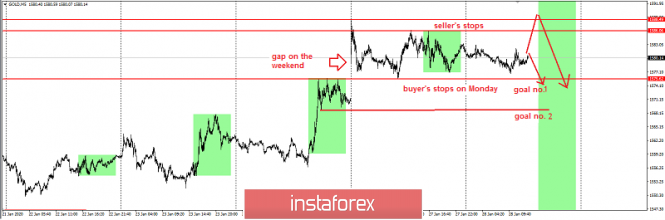
| Posted: 28 Jan 2020 03:30 PM PST Good evening, dear traders! I present to you the trading idea for gold. So, the fears around the Chinese coronavirus drove the price of the precious metal to the region of $ 1,580 per troy ounce. Gold was only more expensive in early January during the Iranian attack on US military bases in Iraq after the assassination of General Soleimani: D1's price action picture: Analysis of H1: In this situation, priority is in sales, because a pinbar with a gap in the bottom remained on the highs yesterday. At the same time, the base of this pin-bar coincides with the mirror level of 1575, behind which now stands all the stops of buyers for Monday and part of the environment. I remind you that gold should be traded exclusively at the American session (green areas). The intrigue is that the sellers were not touched yesterday, and this is not very good for moving down. Therefore, I recommend 2 scenarios. The first is to work on the profit from sales on the fact of signals from smaller TF. The second one is for a false breakdown of 1586-1588, I recommend to catch sales with a take profit at the level of 1575. If these events do not happen today, I recommend waiting for the news tomorrow night at the interest rate of US dollar, as well as the Fed press conference: Have a successful trading and control the risks! The material has been provided by InstaForex Company - www.instaforex.com |
| EUR/USD. January 28. Results of the day. US macroeconomic statistics supported the dollar Posted: 28 Jan 2020 03:07 PM PST 4-hour timeframe Amplitude of the last 5 days (high-low): 38p - 28p - 73p - 42p - 28p. Average volatility over the past 5 days: 42p (average). The first trading day of the week was completely empty in terms of macroeconomic events. However, today traders already had something to turn their attention to. The volatility during the day, however, has not grown much and is currently at least 28 points, but given the fundamental background of today, there is still reason to believe that the indicator will still reach an average of 42 points. Bears continue to hold the market in their hands, there is no talk of any correction, although the MACD indicator has turned up. But since there was no parallel increase in price, we believe that the indicator simply started to discharge, since it has nowhere to decline further - the downward movement of the euro/dollar pair, although weak, is recoilless. The immediate goals for the euro are levels 1,0990 and 1,0977, each of which can trigger the beginning of an upward correction, which has been brewing for two days. However, at the same time, we would like to note that if the movement is very weak and at the same time trendy, then it can continue for a very long time and without corrections. It is best to pay attention to the Kijun-sen line, which in such cases follows the trend well and is the reference line for this trend itself. In fact, traders were interested in only one macroeconomic report today and it was extremely controversial. Now it's easy to guess that the reaction of traders to this report was to sell the euro/dollar pair, respectively, it was at least not a failure. Although, as we have said, it can be interpreted in different ways. This report is for durable goods orders. It is important because the production of durable goods (for example, automobiles) requires serious investments, and the goods themselves are expensive, respectively, their sales volumes significantly affect the economy. So, the most significant indicator showed an increase of 2.4% in December against the previous value of -2.0% and the forecast of + 0.5%. It seems that it was precisely on this indicator that traders paid the most attention, which is completely logical. The second most important indicator is orders for capital goods, excluding the defense and aviation sectors. These goods are intended for the production of other goods and services with a service life of at least three years. This indicator decreased by 0.9% in December, although the forecast predicted a zero change compared to the previous month. Next, orders were published excluding transport (decreased by 0.1% with higher forecasts) and excluding the defense sector (decreased by 2.5%). In general, all derivatives of the main report were reduced, some by very impressive values. This is probably why the strengthening of the US currency is quite restrained. What conclusions can be drawn from this report? Twofold. On the one hand, the main indicator - did not disappoint. On the other hand, other indicators disappointed. Once again, we are forced to think about a possible new slowdown in the US economy, as the latest macroeconomic statistics indicate a decline in some indicators, such as industrial production or business activity in the manufacturing sector. Of course, this is still not enough to make louder conclusions, however, these figures may cause concern not only for ordinary traders, but also the Federal Reserve, which previously announced that there might not be any changes in monetary policy parameters until mid-2020. Tomorrow will be the summing up of the January meeting of the Fed. The probability of a rate cut is zero. However, in light of the latest macroeconomic statistics, new information may be heard at a press conference by the Federal Open Market Committee. No other important events or reports are contained in the calendar for tomorrow; the very announcement of the results of the Fed meeting will take place late in the evening. Based on the foregoing, calm trading is expected almost tomorrow evening until tomorrow. In the evening, the source of the imbalance in the market might come from Jerome Powell's speech, and then only if he expresses his fears or notes the worsening statistics. Trading recommendations: EUR/USD continues to move down. Thus, it is recommended to hold open short positions with the targets of 1.0990 and 1.0977, until the start of the correctional movement (rebound from any target or the MACD indicator upward with a parallel increase in price). It will be possible to consider purchases of the euro/dollar pair not earlier than the Kijun-sen line in small lots with the goals of the resistance level of 1.1088 and Senkou Span B line. Explanation of the illustration: Ichimoku indicator: Tenkan-sen is the red line. Kijun-sen is the blue line. Senkou Span A - light brown dotted line. Senkou Span B - light purple dashed line. Chikou Span - green line. Bollinger Bands Indicator: 3 yellow lines. MACD indicator: Red line and bar graph with white bars in the indicators window. Support / Resistance Classic Levels: Red and gray dashed lines with price symbols. Pivot Level: Yellow solid line. Volatility Support / Resistance Levels: Gray dotted lines without price designations. Possible price movements: Red and green arrows. The material has been provided by InstaForex Company - www.instaforex.com |
| GBP/USD. Pound to the slaughter: prospects look gloomy Posted: 28 Jan 2020 03:07 PM PST The pound paired with the dollar is slowly but surely sliding to the support level of 1.2950. After a sharp jump in the middle of the 31st figure, the price began to decline gradually, yielding also to the strengthening of the US currency. The temporary strengthening of the pound was due to the growth of the UK labor market. A relatively good report supported the pair, which was under pressure from disappointing releases. But this support was of a short-term nature, since all other (almost all) fundamental factors played against the pound. It is even amazing how the pound stayed within 30-31 pieces for such a long time, given the negative fundamental background for GBP/USD. Only relatively rare news regarding the implementation of the "soft" Brexit fueled interest in the pound. In general, the prospects for the pair look rather gloomy - even if the Bank of England takes a wait-and-see attitude the day after tomorrow. Let me remind you that the last surge in interest in the British currency was due to two factors. First, the House of Lords, after a brief "bickering," approved the Brexit bill. On the one hand, this decision was expected, but on the other hand, there was a risk of "legislative ping-pong" - the bill would be considered several times by the Lower and Upper Houses of Parliament. There are no time limits for such a ping-pong, but the time allotted for negotiations was gradually drawing to an end. Therefore, when the peers nevertheless approved the deal, the pound received substantial support. Further procedural aspects (the signing of the document by the queen, ratification by the EU authorities, Boris Johnson's signing of the deal) were practically ignored by the market, despite their historical importance. But from the point of view of the foreign exchange market, Brexit has already taken place de facto, therefore ceremonial events have already slightly worried traders. The GBP/USD pair was further supported by the British labor market. Firstly, unemployment remained at a record low level of 3.8%, and secondly, the level of salaries (including premiums) remained at 3.2% in annual terms, although experts predicted a decrease to a three percent level. The growth rate of applications for unemployment benefits reached 14 thousand, but analysts expected it at higher values (from 40 to 50 thousand), so the actual result met the demands of investors. After this release, rumors appeared in the market that the English regulator would take a wait-and-see attitude at the January meeting, thereby giving the British economy a chance to independently get out of this situation - without additional help from the central bank. The Bank of England may indeed maintain the status quo in monetary policy this Thursday. But at the same time, if the regulator's members do not announce a rate reduction at the next meetings, they will probably take an extremely dovish position, thereby putting additional pressure on the pound. In addition, it can be said with almost certainty that the number of those who voted for the rate cut will increase to three - these are Vlieghe, Saunders, and Tenreyro recently joined them. If at least one other member of the Committee joins the dovish wing, then the pound will again fall under the wave of sales (after all, in this case four out of nine members of the regulator will vote for a rate cut). By the way, some currency strategists do not exclude the option of reducing the rate as early as January 30. Their arguments sound convincing - the UK GDP indicator has been steadily declining, inflation has been growing at the slowest pace since 2016, retail sales have completely collapsed into the negative area, despite the pre-holiday December period. All of these factors can push members of the BoE to decisive action. Mark Carney did not exclude the likelihood of easing monetary policy (by the way, this will be his last meeting as the head of the English regulator). And although his position is accompanied by a multitude of "ifs," he is generally ready to support the British economy. Thus, the British currency, in my opinion, is in any case in a disadvantageous position. The pound will instinctively jump across the entire market if the BoE leaves the interest rate unchanged. But the subsequent comments by the head of the central bank, which are likely to be of a dovish character, offset the initial optimism. If the regulator lowers the interest rate, then the pound will dive further, since this scenario is not taken into account in prices by 100%. Also, one should not forget about the pressure of the US currency, which is growing due to panic in the market. This combination of fundamental factors will make it possible for GBP/USD bears to reduce the price not only to the nearest support level of 1.2950 (the lower line of the Bollinger Bands is at D1), but also to approach the next support level, which is 100 points lower (i.e. 1.2850 - this is the lower boundary of the Kumo cloud on the same timeframe). The material has been provided by InstaForex Company - www.instaforex.com |
| Donald Trump caught in a lie. Video proves the insincerity of the US president Posted: 28 Jan 2020 03:07 PM PST The impeachment case of Donald Trump continues to be considered in the US Senate. It is still unknown and incomprehensible when the verdict will be issued, however, the fact that the case is overgrown with new details cannot be denied. John Bolton's testimony can still be qualified as false information that has no evidence. However, what then can be generally considered evidence of Trump's guilt, even if the testimony of his former national security adviser is not regarded as the truth? Immediately after Bolton's testimony, a two-year-old video hit the net. Video of a dinner at the Trump Hotel in Washington, in which the US President, Lev Parnas, Igor Fruman (businessmen, business partners of Trump's personal lawyer Rudolph Giuliani) took part. Who filmed this dinner remains a mystery. It was also attended by several other minor characters who have no significance in the whole matter. So, as you can clearly see and hear from the video, Trump, Fruman and Parans discussed the activities of the US ambassador to Ukraine Marie Yovanovitch, as well as Ukraine itself. Fruman and Parnas thanks Ukraine for the help and can hold out for some time (meaning the situation in the Donbass), and it is better to get rid of Ambassador Yovanovitch, as she says to everyone that Trump will soon be impeached, after which Trump gives the order "Get rid of her." A year later, Marie Yovanovitch will be recalled from Kiev, and she will become one of the main witnesses in the Trump case on abuse of authority. Trump's defense has already commented on this review. According to Giuliani, the US president has every right to appoint and remove ambassadors from office at any time, and even without explanation. However, this is not the most interesting. Trump said earlier that he was not familiar with Parnas and Fruman, but the record proves the opposite. Not only knew, but also talked and conducted business. Trump previously stated that he is doing business with hundreds of people, some of whom he can really forget. It seems that approximately such an explanation is preparing to be voiced now. Thus, the situation at the moment looks like this. Democrats insist on inviting Bolton to testify at the Senate. However, in order to do this, they need the votes of at least four Republicans, since their own number in the Senate is 47. If these four votes cannot be obtained, they will not be involved in Bolton. At the same time, Republicans want to see Joe Biden or Hunter Biden in the Senate to testify about their activities in Ukraine. For obvious reasons, the Democrats do not want this. In general, the whole thing still resembles more political games, a political conspiracy, a redistribution of power in the US government. Obviously, Joe Biden and his son are clearly not suspected of crossing the street at a red light. But Trump's fault is obvious. It's not even Yovanovitch's matter, but Trump's desire through Ukraine to denigrate his main rival in the fight for the presidency or even eliminate him. Thus, it is impossible to say that Democrats are 100% right, and Republicans are not. In the same way, the opposite conclusion cannot be made. Thus, we, ordinary citizens and traders, can only watch the process and wait for it to end. In fact, now it all comes down to getting the answer to the question: "Whose ratings will decline after the Senate, Joe Biden or Donald Trump? It is unlikely that the Senate will indeed approve of impeachment to the president. At the same time, experts note that the rating of the current president of the United States is now at its highest values, but will the American people want to vote for Trump a second time? The material has been provided by InstaForex Company - www.instaforex.com |
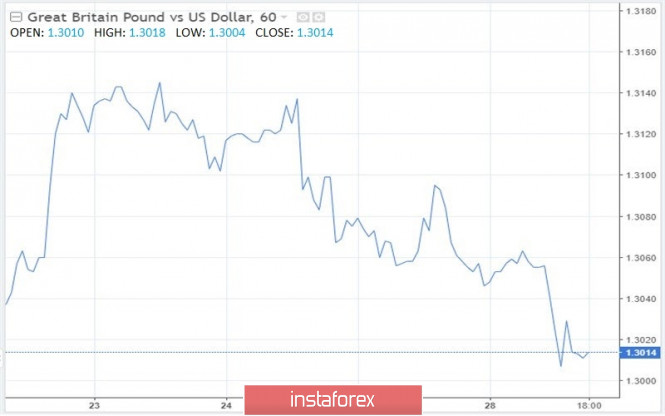
| GBPUSD: Pros and cons of UK interest rates Posted: 28 Jan 2020 03:07 PM PST If tomorrow's meeting of the Federal Reserve is more or less clear, then how the Bank of England will behave remains a mystery. Different analytical agencies and large management funds look at the situation with interest rates differently, which divides them into two camps. Some are convinced that lowering the BoE interest rate this Thursday would be too premature a decision. This argument is supported by a recent report by the Organization for Economic Co-operation and Development, which points to the stabilization of UK economic data. However, problems persist with retail sales, not to mention the uncertain prospects for a Brexit deal and the development of the situation in this direction, which many have already forgotten about. Those who expect interest rates to remain unchanged focus on recent data on services and manufacturing activity, where real improvements have been noted, which may also affect the BoE's decision. Another camp believes that the English regulator will actively reduce interest rates in the near future, and it is necessary to wait for this, perhaps not on Thursday, but in the coming months. Here the emphasis is placed on the likely deterioration of the economic situation in the UK at the beginning of this year, which will force the BoE to consider a more serious rate cut, as well as stimulating the economy in other ways. Let me remind you that at present the key interest rate is at the level of 0.75%. Meanwhile, the yield on 10-year UK government bonds is at 0.503%. Today's report from the Confederation of British Industry CBI, which pointed to the lack of growth in retail sales in the UK in January this year, is unlikely to affect the BoE's decision on interest rates, but adds even more uncertainty. According to the data, about 40 retailers noted a lack of growth in retail sales. However, despite the fact that the data reflects only the report for the first half of January, the British pound did not miss the moment and fell against the US dollar. Although the downward movement of the GBPUSD pair is more connected with the demand for the US dollar due to the aggravation of the situation with coronavirus infection in China than with the weakness of the pound itself. Regarding the technical picture of the GBPUSD pair, most likely, an intermediate stop of the downward trend will be noted at 1.2985, while a larger support level can be seen at the January 20 low at 1.2960. It will be possible to talk about buyers returning to the market only after the BoE has assessed further prospects for the economy and the publication of a decision on interest rates and monetary policy. The bulls need an urgent return of resistance 1.3035, from which it will be possible to successfully build an upward momentum to the highs of 1.3130 and 1.3175. EURUSD Although the data on the moods of German exporters are not very important, the lack of other fundamental statistics makes us pay attention to them. The weakening of the euro and other risky assets is quite obvious, as I spoke in more detail in my morning review. According to Ifo, the sentiment of German exporters deteriorated in January this year, as a result of which the index of expectations of exporters in the manufacturing sector fell to 0.9 in January from 2.0 in December. However, Ifo expects that the recent easing of uncertainty and the signing of the first phase of the trade agreement between the US and China will have a positive impact on global markets and will affect the situation with export orders in Germany. As for the technical picture of the EURUSD pair, the bears pushed the euro to support 1.1000, but that was all. It will be possible to talk about the restoration of the euro only after consolidating above the high of 1.1040, and for now, the trend is on the side of sellers of risky assets, which opens a direct path to the lows of 1.0980 and 1.0960. The material has been provided by InstaForex Company - www.instaforex.com |
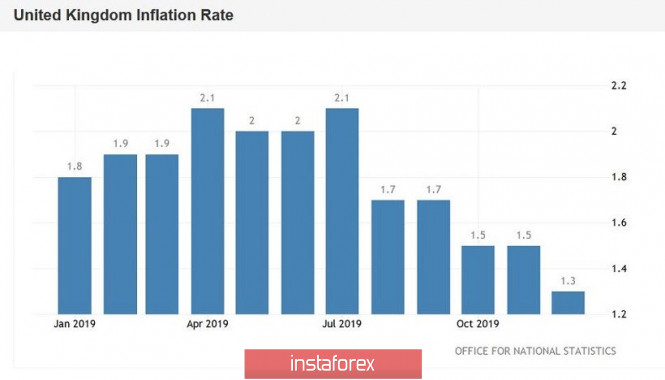
| GBP/USD. Passion rate: will the Bank of England soften monetary policy? Posted: 28 Jan 2020 03:07 PM PST The first meeting of the Bank of England this year attracts much more attention than the January meeting of the Federal Reserve. This is not surprising. For all the time Mark Carney has been at the helm of BoE, the chances of the regulator cutting the interest rate have not been as high as they are now. Recall that the Bank of England rate has remained unchanged at 0.75% since August 2018. Its last decline occurred in 2016. For the first time since August, the business activity index in the UK services sector rose above 50, indicating a sector expansion. The composite PMI has peaked since September 2018. Recent data on employment and wage growth indicate a relatively healthy labor market in the country. At the same time, reports on GDP, industrial production, inflation and retail sales were disappointing. Thus, the BoE has reason to lower the interest rate, and this circumstance pulls the GBP/USD pair to the lower boundary of the medium-term range of consolidation of $1.3000-1.3350. Since the political upheavals associated with Brexit have so far receded into the background, the pound is vibrantly responding to macro statistics across the United Kingdom. Even the roller coaster of the GBP/USD pair against the background of the release of the British indices of purchasing managers look quite understandable. When everyone buys, there is a great opportunity to take profits on long positions. The pound is also sensitive to changes in the chances of easing BoE's monetary policy, which, prior to the publication of January business activity data, soared above 70%, then dropped to 52%, and then rose to 60%. Whatever decision the CB makes at the upcoming meeting, the GBP/USD pair is unlikely to remain in place. According to the consensus forecast of Bloomberg analysts, the Bank of England Monetary Policy Committee will vote six times against three to keep the interest rate at 0.75%. This circumstance and the fact that speculators are skeptical about the idea of weakening BoE's monetary policy (by the end of the week by January 21, bullish positions in the British currency on the derivatives market fell quite slightly) can play a trick on the pound. If BoE lowers the interest rate by 25 basis points, then the GBP/USD pair can easily go down to 1.2900 amid large-scale pound sales by hedge funds and asset managers. In the meantime, they prefer to stand aside and not force things. Keeping the rate at the current level may result in the growth of the pound to 1.3100–1.3140. As for the long-term prospects, fans of the British currency say that even the BoE's easing of the monetary rate will not put an end to the bullish trend in GBP/USD. According to them, improving the political landscape in Great Britain will contribute to the influx of foreign capital into the country. The bears are betting on difficulties in trade negotiations between London and Brussels, which may lead to increased uncertainty and a drop in business activity in the UK. The material has been provided by InstaForex Company - www.instaforex.com |
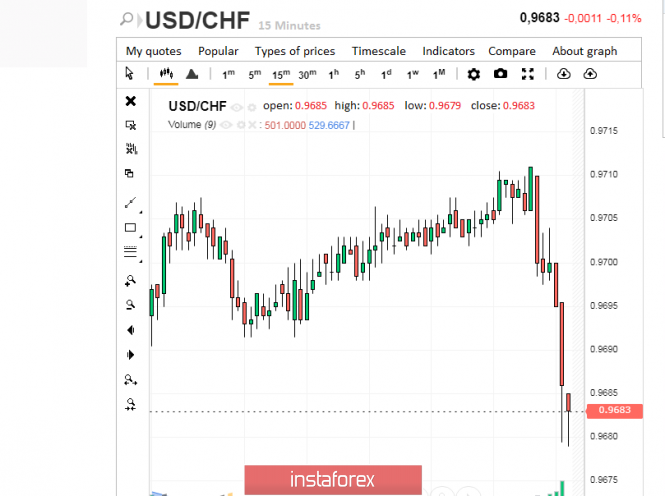
| Swiss franc: feast during the plague? Posted: 28 Jan 2020 03:07 PM PST The Swiss currency is actively gaining momentum, surprising the market with rapid growth. According to analysts, the rise of the Swiss franc is due to world markets' fears over the spread of the Chinese coronavirus. Most investors who are seriously worried about the epidemic that came from China go into defensive assets, one of which is the Swiss franc. In relation to the European currency, the Swiss has reached the highest level that has not been recorded over the past three years. In the USD/CHF pair, the growth of this currency is not so impressive: it is restrained by the negative attitude of the American authorities to the policies pursued by the Swiss National Bank (SNB). Recall that previously Washington accused the country's monetary authorities of manipulating the national currency. The intervention of US authorities provides additional support to investors. Currently, Swiss franc sellers have stepped up, taking advantage of the fact that the USD/CHF pair is in a bearish trend. Last week, experts recorded its correction, and now recommend opening short positions on the USD/CHF pair. On Tuesday, January 28, the dynamics of the USD/CHF pair remains unchanged. The pair froze at 0.9683, not wanting to move up or down. Now the Swiss currency is contemplating where it should direct the vector of its movement. Earlier, the franc was rapidly growing in price in relation to other European currencies. However, the threat of the spread of coronavirus has made adjustments. Together with the Norwegian krone, the Swiss franc may yield to its competitor, experts said. On Monday, January 27, the highest growth was recorded in the CHF/NOK pair, which is only 2.3% lower than the record for 2015. Recall that in that period the pair reached the level of 9.5538. The reason for the dizzying takeoff was the sudden abolition of the SNB limit of strengthening the national currency at 1.20 francs for a euro. Analyzing the situation with the current explosive growth of the Swiss franc, many experts draw a parallel with the feast during the plague. It turns out that the Swiss currency took advantage of the difficult situation on world markets, not missing a chance to rise. However, the taste of victory was mixed with bitterness and anxiety for the future. At the same time, the tense external background does not allow the franc to turn around, holding back further growth. In the short term, the Swiss currency will maintain its current dynamics, experts said. The material has been provided by InstaForex Company - www.instaforex.com |
| January 28, 2020 : GBP/USD Intraday technical analysis and trade recommendations. Posted: 28 Jan 2020 07:54 AM PST
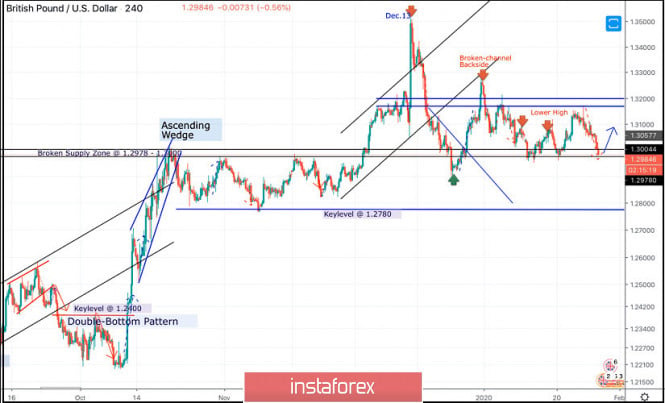
On December 13, the GBPUSD pair looked overpriced around the price levels of 1.3500 while exceeding the upper limit of the newly-established bullish channel. On the period between December 18 - 23, bearish breakout below the depicted channel followed by initial bearish closure below 1.3000 were demonstrated on the H4 chart. However, earlier signs of bullish recovery were manifested around 1.2900 denoting high probability of bullish pullback to be expected. Thus, Intraday technical outlook turned into bullish after the GBP/USD has failed to maintain bearish persistence below the newly-established downtrend line. That's why, bullish breakout above 1.3000 allowed the recent Intraday bullish pullback to pursue towards 1.3250 (the backside of the broken channel) where bearish rejection and another bearish swing were suggested for conservative traders in previous articles. Moreover, new descending highs were recently demonstrated around 1.3120 and 1.3085. That's why, Intraday technical outlook is supposed to remain bearish as long as the pair maintains its movement below 1.3120 (recently established descending high). Conservative traders can wait for bearish breakdown below 1.2980. This would be needed first to enhance further bearish decline towards 1.2900, 1.2800 and 1.2780 where the backside of the previously-broken downtrend is located. In the Meanwhile, Intraday traders can watch for bullish rejection around 1.3000-1.2980 as a bullish signal for another bullish pullback towards the depicted price zone (1.3170 - 1.3200). The material has been provided by InstaForex Company - www.instaforex.com |
| January 28, 2020 : EUR/USD Intraday technical analysis and trade recommendations. Posted: 28 Jan 2020 06:54 AM PST
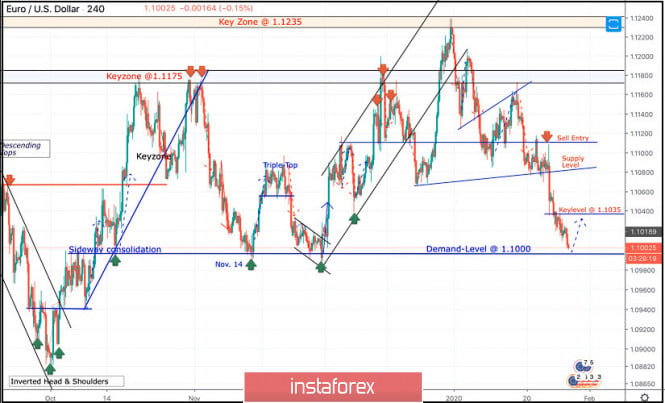
In December, the depicted bullish channel was initiated around 1.1000 allowing another bullish breakout above 1.1110 to pursue towards 1.1175. Initial Intraday bearish rejection was expected around the price levels of (1.1175). On December 20, bearish invalidation of the depicted short-term channel was demonstrated. Thus, further bearish decline was expressed towards 1.1065 where significant bullish recovery has originated. Shortly-after, a quick bullish spike towards 1.1235 (Previous Key-zone) was suggested to be watched for bearish rejection and another valid SELL entry. Suggested bearish position has achieved its targets while approaching the price levels around 1.1110. However, the Key-Level around 1.1110 has provided some bullish demand. This was followed by a bullish pullback towards 1.1140 and 1.1175 where the depicted key-zone as well as the recently-broken uptrend were located. Recently, evident signs of bearish rejection were demonstrated around 1.1175. That's why, quick bearish decline was executed towards 1.1110. As expected in a previous article, bearish persistence below 1.1110 enabled further bearish decline towards 1.1060 then 1.1035 which failed to provide any bullish SUPPORT for the EURUSD pair. Instead, further bearish decline is currently being demonstrated towards 1.1000 where the pair looks quite Oversold. On the other hand, the EURUSD pair has a recently-established Key Level around 1.1035 to be watched for price action if any bullish pullback is expressed. Short-term technical outlook remains bearish as long as the EURUSD maintains its movement below 1.1035. Otherwise, bullish breakout above 1.1035 is needed to bring further bullish advancement towards 1.1085 where a more consistent supply level is located. The material has been provided by InstaForex Company - www.instaforex.com |
| EUR/USD. January 28. A report on orders for long-term products can stop the pair from falling Posted: 28 Jan 2020 06:29 AM PST EUR/USD - 4H.
As seen on the 4-hour chart, the EUR/USD pair continues the weak process of falling in the direction of the target I indicated – the low level of 1.0989. Since the information background is practically absent in recent days, the movement is very weak. However, there are no pending divergences for any indicator, as well as other signals indicating a possible pullback of quotes up. The only thing that should be immediately noted – today's report on orders for long-term products in the United States. This is a fairly important report, so traders can respond to it with stormy purchases or sales of the euro-dollar pair. If the report is strong-well, the probability of working out the goal of 1.0989 today will increase several times. If the report is weak and the pair do not have time to perform a fall to the level of 1.0989 by this time, then a reversal in favor of the European currency may follow and some growth in the direction of the upper area of the downward trend corridor, which continues to eloquently indicate the current mood of traders. Forecast for EUR/USD and trading recommendations: The long-term trading idea remains valid. Traders still have a long-term target for a fall near the level of 1.0850, confirmed by the closing of the pair's rate below the trend line. The short-term trading idea is to sell the pair with a target of 1.0989 since the trend on the 4-hour chart remains "bearish". Stop Loss levels can now be placed behind the level of 1.1040. In the US session, we closely monitor the report on orders in the US, and if it turns out to be worse than forecasts, we can close deals for sale. The material has been provided by InstaForex Company - www.instaforex.com |
| Posted: 28 Jan 2020 06:29 AM PST GBP/USD - 4H.
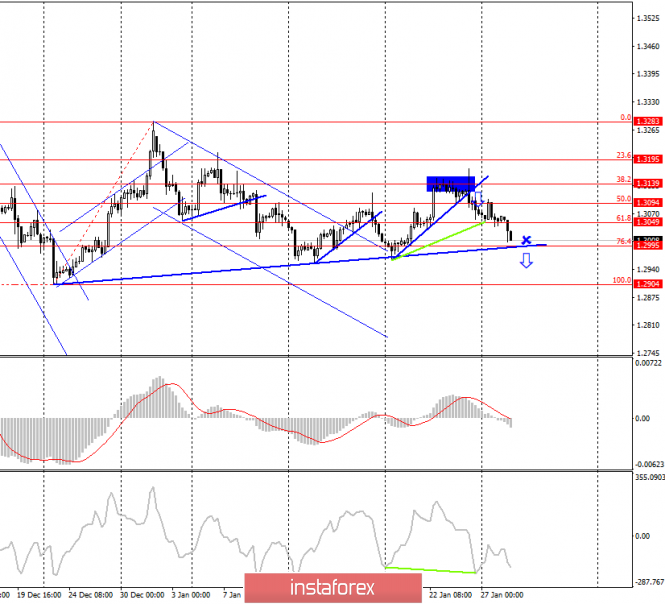
As seen on the 4-hour chart, the GBP/USD pair made a reversal in favor of the US currency after rebounding from the corrective level of 50.0% (1.3094) and resumed the process of falling in the direction of the target I indicated – the Fibo level of 76.4% (1.2995). At the time of writing, about 15 points remained to this level, which means that it has already been practically worked out. From the corrective level of 76.4%, a rebound can be made with a reversal in favor of the British and the growth process can begin. Also, the pair's quotes can perform a rebound from the global correction line, which passes very close to the corrective level of 76.4%. If the pair still falls to the level of 1.2995, we can assume that the trading idea has been worked out perfectly. If the pair closes below the correction line and the level of 1.2995, then a new trading idea will be formed immediately, again for sales with the goal of the corrective level of 100.0% (1.2904), that is, Take Profit will be another 70-90 points. There are no pending divergences in any indicator today, and the information background will be in the same report on orders for long-term products in the United States. If the report is weak, the probability of the pair's quotes rebounding from the correction line will increase. Forecast for GBP/USD and trading recommendations: The trading idea is still in the sales of the pound. Near the level of 1.3139, there was a reversal with a close under the correction line. I recommend that traders stay in sales with a target of 1.2995 until the report on orders in the US is released. The material has been provided by InstaForex Company - www.instaforex.com |
| Posted: 28 Jan 2020 06:21 AM PST Industry news: The Japanese Economy Minister Yasutoshi Nishimura recently stated that the coronavirus outbreak is causing serious threats to the global economy. On a local level, he said that he's concerned a lot, especially when it comes to tourism. Chinese tourists account for 30% of the people who visit Japan for that purpose. As such, transportation hurdles, as well as cancellations are among the minister's prime concerns. If China's affected cities remain closed, Nishimura fears that it will have more Technical analysis:
BTC reached Pitchfork median line at the price of $9.400. This is sign that we might have short term topping activity and potential rejection. Usually, after the price reach Pitchfork median line we can form few pivots around it. Stochastic oscillator is showing overbought condition, which may cause short-term decline on BTC and potential test of $8.910 or $8.700. The material has been provided by InstaForex Company - www.instaforex.com |
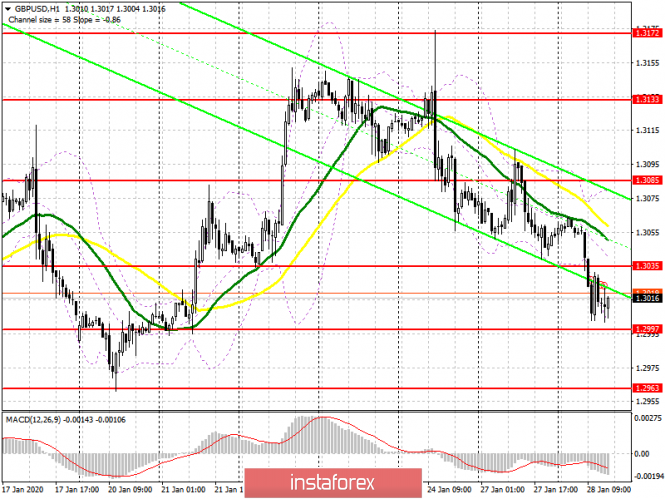
| Posted: 28 Jan 2020 06:18 AM PST To open long positions on GBPUSD, you need: Even in the morning forecast, I paid attention to the breakdown of the level of 1.3035, which led to a further decline in the pound on the trend and the support test of 1.2997. At the moment, the bulls have no choice but to protect this range based on weak data on consumer confidence in the US and a return to the resistance of 1.3035. If there is no activity on the part of buyers in the area of 1.2997, it is best to postpone long positions until the test minimum of 1.2963, which coincides with the lows of January 20 and 14 this year. If consumer sentiment deteriorates in the US, the breakout and consolidation at the level of 1.3035 will quickly return buyers to the pound, which will lead to an update of the highs of 1.3085 and 1.3133, where I recommend fixing the profits. To open short positions on GBPUSD, you need: Sellers coped with the morning task and broke below 1.3035, which led to the update of the support of 1.2997, which I paid attention to in my morning forecast. Now, it is no less important to hold the resistance at 1.3035, and the formation of a false breakout at this level will be an additional signal for opening short positions in GBP/USD. Also, sellers of the pound can take advantage of good statistics on the American economy, which will lead to a breakthrough in support of 1.2997 and a further downward trend to the area of the lows of 1.2963 and 1.2939, where I recommend fixing the profits. In the scenario of the bulls returning to the level of 1.3035 in the afternoon, it is best to postpone short positions until the maximum of 1.3085 is updated. Indicator signals: Moving Averages Trading is conducted below the 30 and 50 daily averages, which indicates a further decline of the pound on the trend. Bollinger Bands In the scenario of an upward correction, the upper limit of the indicator around 1.3080 will act as a resistance.
Description of indicators
|
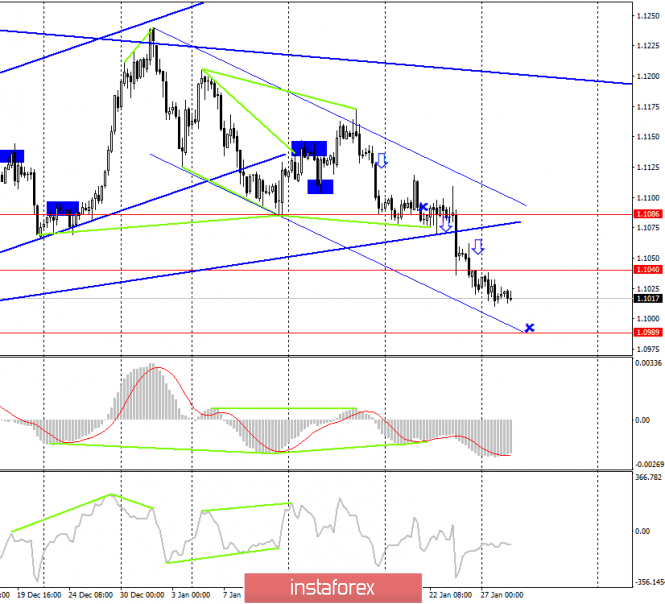
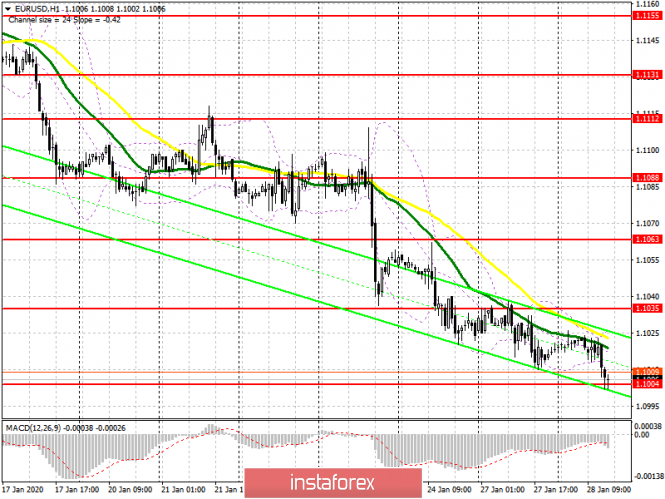
| Posted: 28 Jan 2020 06:18 AM PST To open long positions on EURUSD, you need: The lack of fundamental data in the first half of the day and a good report on the growth of orders for durable goods in the US has led to the strengthening of the dollar against the euro and test a significant support level 1.1004, to which I drew attention in the morning forecast. Although the technical picture has not changed, you can count on purchases from the level of 1.1004 only if a false breakout is formed. Larger players will show themselves after the test of the lows of 1.0982 and 1.0964, which can be updated after the release of the report on consumer confidence in the United States. Weak indicators, on the contrary, will lead to the closure of several long positions in the US dollar and the correction of EUR/USD to the resistance area of 1.1035, where I recommend fixing the profits. An equally important task for the bulls will be to consolidate above the level of 1.1035, which will open a direct road to the highs of 1.1063 and 1.1088. To open short positions on EURUSD, you need: Sellers came close to the support of 1.1004, however, they failed to break below this level the first time. However, as you can see on the chart, there is no special activity and volume surge, so we can talk about a further decline in EUR/USD in the case of a good report on consumer confidence in the United States, which will be published at the North American session. In this case, you can expect to update the lows of 1.0982 and 1.0964, where I recommend fixing the profits. In the scenario of the pair's growth in the second half of the day against the background of closing long positions in the dollar after a weak report, you can count on short positions after updating the resistance of 1.1035 and forming a false breakout there or sell immediately for a rebound from the highs of 1.1063 and 1.1088. Indicator signals: Moving Averages Trading is conducted below the 30 and 50 moving averages, which keeps the chance of a decline in the euro. Bollinger Bands Volatility remains extremely low, which does not give signals to enter the market.
Description of indicators
|
| Posted: 28 Jan 2020 06:02 AM PST USD/JPY has been trading inside of the well defined trading range. Watch for potential breakout of the resistance at 109.16 to confirm further upside and potential test of 109.27 and 109.50.
Today we got rejection of the important low at 108.80. I expect further upside and my advice is to watch for buying opportunities on the breakout with main target at 109.50. MACD oscillator is showing positive reading above the zero and the slow line just turned to the upside. Resistance level is set at the price of 109.15. Support level is set at the price of 108.75. The material has been provided by InstaForex Company - www.instaforex.com |
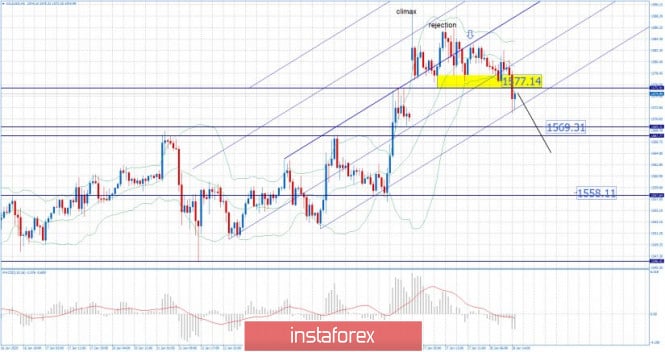
| Posted: 28 Jan 2020 05:50 AM PST Gold has been trading downwards. The price the price reached our first downward target at the price of $1.577 and is heading to test second at $1.569.. I see further downside on the Gold and potential test of $1.569 and $1.558.
The rejection and climax of the mini Pitchfork warning line was the main reason for the current downside pressure. My advice is to watch for selling opportunities on the rallies using intranet-frames 5/15 minutes. MACD oscillator is showing negative reading below the zero and the slow line is turned to the downside. Resistance levels are set at the price of $1.577 and at $1.580. Support levels and downward targets are set at the price of $1.569 and $1.558. The material has been provided by InstaForex Company - www.instaforex.com |
| Evening review for EURUSD on 01/28/2020. Virus in the spotlight Posted: 28 Jan 2020 05:35 AM PST
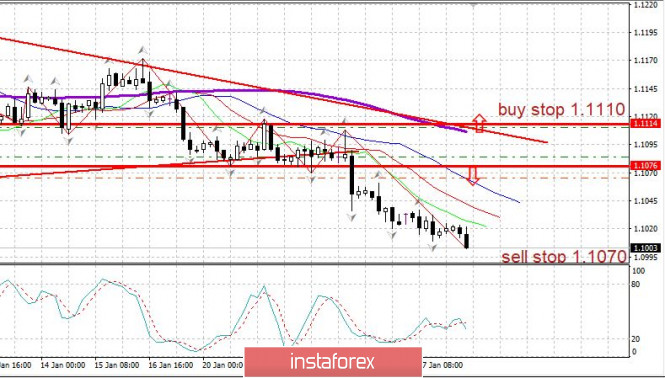
The outbreak of a new type of flu in China remains in the spotlight of the world's main media and markets: there is a real chance that it will not be possible to limit the spread and China will plunge into a large-scale epidemic. Against this background, the Fed meeting tomorrow, January 29, takes a back seat. EURUSD: sellers' pressure continues - new lows. We keep sales from 1.1084. Sales are possible in the case of rebounds to the top - from 1.1050 or higher. The material has been provided by InstaForex Company - www.instaforex.com |
| Trading recommendations for EURUSD on January 28 Posted: 28 Jan 2020 05:14 AM PST From a complex analysis, we see a continuing downward interest set by an earlier inertial move, where the quote came close to the psychological level of 1.1000 and formed a local slowdown. We see that short positions were under strong pressure from the control level, which affected the volatility, as well as the course itself. At the same time, we should not omit the point that the extreme inertia move (23.01.20-27.01.20) was conditionally integral, thus local overheating of the meek positions could occur. Otherwise, together with the psychological level of 1.1000, there would already be a rebound/correction. Based on the above reasoning, we can assume that the downward move set in the first days of January has a chance to develop into a full recovery, where the quote has already reached the second level of the oblong correction. That is, in theory, we have more support for sellers than we had before. In terms of volatility, we see a sharp slowdown in activity by about 40% relative to the daily average. Many regard this activity as a kind of platform for the future jump. Analyzing the past day by the minute, we see a conditional lateral movement with a variable amplitude of 10-20 points. The oscillation structure consists of more than 30% Doji candles. As discussed in the previous review, downside traders closed their trading positions due to the risk of a rebound. The next steps were in terms of a thorough analysis of the quote behavior and fixing points, where the market needed to fix below 1.0980 to resume short positions. Looking at the trading chart in general terms (the daily period), we see a renewed recovery process, where the quote has already reached the second stage of interaction. Let me remind you that the oblong correction, in the structure of the global downward trend, has been held for at least four months, where the recovery steps are coordinates #1 – 1.1080; #2 – 1.1000; #3/1 – 1.0950; #3/2 – 1.0879. The news background of the day included data on new home sales in the United States, which recorded a more significant decline than expected. So, the previous data was revised for the worse - from 719 thousand to 697 thousand, and the current figures came out with an indicator of 694 thousand with a forecast of 719 thousand. There was no market reaction to the statistics, perhaps because of the general slowdown or perhaps because of the risk of the upcoming Fed meeting, where, in principle, nothing drastic should happen. In terms of the general information background, we see an increase in noise about the coronavirus, which is actively inflated in the media. So, the virus itself does not affect the world economy at the current scale, whatever the media wrote, it scares the other. After analyzing the flow of information, as well as the trends of search engines, it was noticed that almost daily, the popularity of the discussion is growing, affecting all corners of the world. This increase in discussion can put pressure on public opinion, where even without the facts, we will get a tool for manipulation, which will be reflected in the market as a fact. It is worth considering as a hypothesis in the analysis. In terms of the long-running Brexit process, we have the comment of the EU's chief negotiator, Michel Barnier, who believes that Brexit will inevitably lead to negative consequences for the British economy, in contrast to the consequences on the territory of the European Union. "Even without the UK, the EU forms a single market of 450 million people, a truly global market. Our economic power allows us to stand proudly on the world stage and speak on equal terms with other superpowers on issues such as the economy, climate change, security, and trade," said Michel Barnier. Today, in terms of the economic calendar, we have data on orders for durable goods in the United States, the volume of which may increase by 0.6% compared to the previous period, where there was a decline of 2.0%. Data on house prices will also be published (S&P/Case-Shiller), where it is expected to accelerate from 2.2% to 2.6%. Further development Analyzing the current trading chart, we see still low activity, where the quote is trying to come close to the psychological level of 1.1000. The fact of pressure from the control level is obvious, but at the same time, sellers do not seek to leave the market and continue to consider further recovery of the quote relative to the oblong correction. In terms of the emotional component, we see clear indecision, which is reflected in almost everything, but even in it, we see a large flow of speculative positions. Detailing the trading day that is available every minute, we see that just now local bursts have started to appear, all the previous candles are in the structure of a sideways move. In turn, traders continue to painstakingly analyze the behavior of the quote, where special attention is paid to such values as 1.0980 and 1.1040. It is likely to assume that the quote will continue to concentrate on the psychological level, where punctures are not excluded, but before entering the market, it is necessary to carefully analyze the price-fixing points to filter out false breakouts as much as possible. At the same time, the tactic is "Breakdown or Rebound". Based on the above information, we derive trading recommendations: - Buy positions will be considered in the event of a rebound from the psychological level of 1.1000 and a price fix higher than 1.1040. - Sell positions are considered if the downward interest is held and the price is fixed below 1.0980, without the shadow piercing the candle. The perspective of the move is located in the following stages: #3/1-1.0950 and #3/2-1.0879. Indicator analysis Analyzing different sectors of timeframes (TF), we see that the indicators of technical instruments continue to work for a decrease relative to all major time intervals. It is worth considering that minute sections display variable interest due to the process of slowing down. Volatility per week / Measurement of volatility: Month; Quarter; Year. The volatility measurement reflects the average daily fluctuation, based on the calculation for the Month / Quarter / Year. (January 28 was based on the time of publication of the article) The volatility of the current time is 18 points, which is an extremely low indicator for this section of time. It is likely to assume that a kind of accumulation lasting as long as the second day will lead to the fact that we will see a surge in activity and there will no longer be a breakdown of the level or a rebound will occur in the market. Key levels Resistance zones: 1.1080**; 1.1180; 1.1300**; 1.1450; 1.1550; 1.1650*; 1.1720**; 1.1850**; 1.2100. Support zones: 1.1000***; 1.0900/1.0950**;1.0850**; 1.0500***; 1.0350**; 1.0000***. * Periodic level ** Range level *** Psychological level ***** The article is based on the principle of conducting a transaction, with daily adjustments. The material has been provided by InstaForex Company - www.instaforex.com |
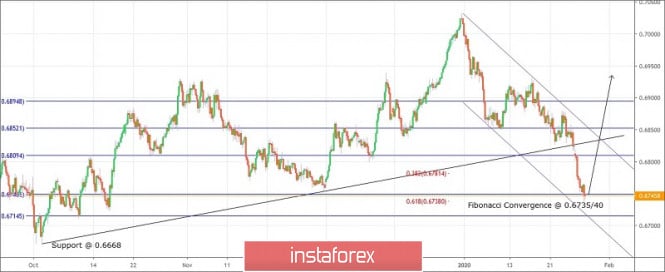
| Trading plan for AUDUSD for January 28, 2020 Posted: 28 Jan 2020 04:12 AM PST
Technical outlook: AUDUSD is seen to be trading around the 0.6750 levels at this point in writing, looking to produce a bullish reversal. A break above 0.6765 would confirm that bulls are back in control. The overall structure still remains bullish with 0.6668 lows intact. AUDUSD earlier rallied between 0.6668 towards 0.6930 levels and since then it has produced a complex corrective structure like its peer EURUSD and NZDUSD respectively. The pair has found support at 78.6% retracement of the entire rally between 0.6668 and 0.7031 levels. Also note that a fibonacci convergence is also seen through 0.6735/40 levels. A bullish candlestick pattern is expected here to confirm resumption of the next leg higher. Until 0.6668 support remains intact, AUDUSD bulls remain in control and upside targets are market at 0.7200 levels at least. Trading plan: Remain long @ 0.6748/50, stop @ 0.6668 target 0.7200 and above. Good luck! The material has been provided by InstaForex Company - www.instaforex.com |
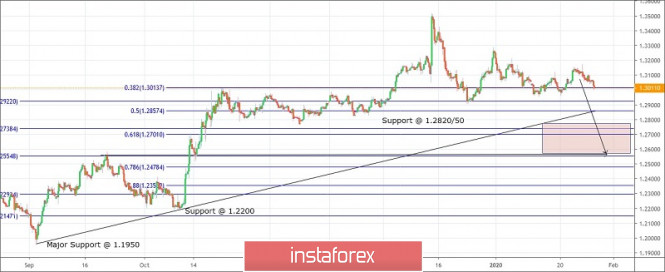
| Trading plan for GBPUSD for January 28, 2020 Posted: 28 Jan 2020 03:49 AM PST
Technical outlook: GBPUSD continues to drift in a sideways corrective manner since hitting ita high at 1.3515. It may drop to the support zone marked as a rectangle here. The single currency pair is seen to be trading around 1.3010/13 and bears are likely to push it lower one last time to 1.2550/1.2750 support zone. A number of convergences are seen towards the above viz: Fibonacci convergence is seen around 1.2700/30 levels, the past resistance turned support is seen around 1.2550, Fibonacci 61/8% drop of the entire rally between 1.1950 and 1.3515 is also seen around 1.2550 levels. Hence we are expecting GBPUSD to drop further towards 1.2550/1.2750 levels before it can resume its rally further. The projected targets for this rally are towards 1.4200 and 1.4500 respectively. Wait for another low to print below 1.2900 mark to enter buying against 1.1950 levels. Trading plan: Look to buy between 1.2550/1.2750 levels, stop @ 1.1950 and target is 1.4200 at least. Good luck! The material has been provided by InstaForex Company - www.instaforex.com |
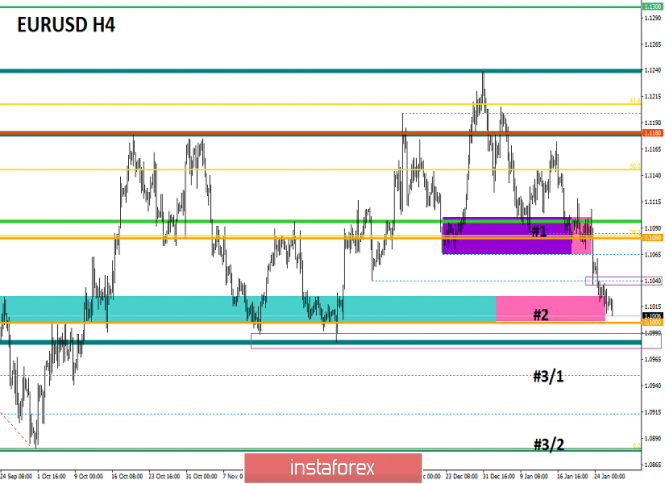
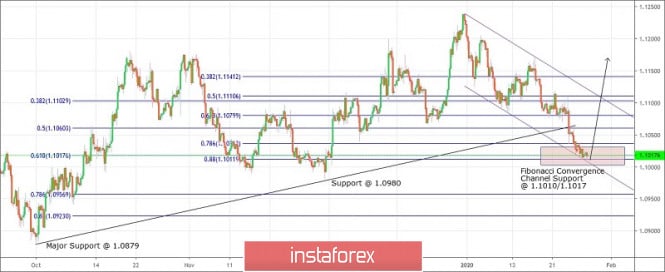
| Trading plan for EURUSD for January 28, 2020 Posted: 28 Jan 2020 03:23 AM PST
Technical outlook: EURUSD has dropped to 1.1010/12 levels today. Currently, it is trading around 1.1018/20. Believe it or not, the drop in EURUSD was in line with our expectations when the single currency pair was trading near highs at 1.1240 around January 01, 2020. At the moment, the euro is trading close to a Fibonacci convergence and the Elliott Channel support around 1.1010/20 levels. The entire structure still remains constructive for bulls to continue rallying further while prices stay above 1.0879 support. The recent upswing was between 1.0879 and 1.1181 levels earlier. EURUSD has produced a complex corrective structure and probably it will end soon. Strong support is seen around the 1.0980/1.1010 zone and the probability for a bullish reversal remains extremely high. The upside targets remain intact towards 1.1500 and 1.1800 levels. Trading plan: Remain ling, stop @ 1.0879, target is towards 1.1500 and 1.1800. Good luck! The material has been provided by InstaForex Company - www.instaforex.com |


| You are subscribed to email updates from Forex analysis review. To stop receiving these emails, you may unsubscribe now. | Email delivery powered by Google |
| Google, 1600 Amphitheatre Parkway, Mountain View, CA 94043, United States | |
No comments:
Post a Comment