Forex analysis review |
- Comprehensive analysis of movement options of #USDX vs AUD/USD vs USD/CAD vs NZD/USD (H4) on February 26, 2020
- Trading plan for EUR / USD and GBP / USD on 02.25.2020
- British pound's triangle
- Technical analysis recommendations for EUR/USD and GBP/USD on February 25
- Take profit on gold
- Indicator analysis. Daily review of the GBP / USD currency pair for February 25, 2020
- Indicator analysis. Daily review of the EUR / USD currency pair for February 25, 2020
- Comprehensive analysis of movement options of #USDX vs EUR/USD vs GBP/USD vs USD/JPY (H4) on February 25, 2020
- EUR/USD. Dollar in disgrace: the pair braces to storm the ninth figure
- GBP/USD. Results of February 25. EU has decided on the "basis" of a future deal with Britain
- EUR/USD. Results of February 25. Nondescript package of eurozone data reduces the chances of euro growth
- EURUSD and GBPUSD: euro remains in the channel after German economy report, which is not in the best shape. Pound returns
- Fear runs ahead of the engine, or gold rush continues
- Evening review 02/25/2020
- Correction is unlikely to be deep, AUD and NZD remain in a downward trend
- EUR/USD: euro tries to stay afloat, but runs the risk of plunging again
- Yen: snail leaves its shell
- Revival for the euro: close recovery?
- Watching wedge pattern in AUDUSD for possible break out
- 5 waves down are about to be completed in NZDUSD
- Analysis and forecast for USD/JPY on February 25, 2020
- Overview and forecast for EUR/USD on February 25, 2020
- Oil in search of the bottom
- Analysis of EUR/USD and GBP/USD on February 25. German GDP did not cause any market reaction
- GBP/USD: plan for the US session on February 25. The pound bulls have reasserted themselves, however, problems with the level
| Posted: 25 Feb 2020 06:04 PM PST Minuette operational scale (H4) Here's a comprehensive analysis of development options for the movement of the dollar index and commodity currency instruments #USDX vs AUD / USD vs USD / CAD vs NZD / USD in the last week of a leap winter. ____________________ US dollar index The movement of the dollar index #USDX from February 26, 2020 will be determined by the direction of the breakdown of the range :
In case of breakdown of ISL38.2 Minuette - support level of 99.30, the development of the dollar index movement will continue in the equilibrium zone (99.30 - 99.10 - 98.88) of the Minuette operational scale forks with the prospect of reaching the boundaries of 1/2 Median Line channel (98.70 - 98.30 - 97.85) of the Minuette operational scale forks and start line SSL Minuette (97.20). On the other hand, in case of breakdown of the 1/2 Median Line Minuette - resistance level of 99.50 - will lead to the continuation of the development of the upward movement #USDX towards the goals: - the upper boundary of ISL61.8 (100.06) equilibrium zone of the Minuette operational scale forks; - control line UTL (100.30) of the Minuette operational scale forks. The markup of #USDX movement options from February 26, 2020 is shown on the animated chart.
____________________ Australian dollar vs US dollar The development and the breakdown of the range :
will begin to determine the development of the movement of the Australian dollar AUD / USD from February 26, 2020. The breakdown of the warning line LWL61.8 of the Minuette operational scale forks - resistance level 0.6595 - is an option for the movement of the Australian dollar to the boundaries of the 1/2 Median Line channel (0.6610 - 0.6623 - 0.6635) and the equilibrium zone (0.6655 - 0.6675 - 0.6695) of the Minuette operational scale forks. Meanwhile, in case of breakdown of the initial line of SSL of the Minuette operational scale forks - support level 0.6587 - the downward movement of AUD / USD can be continued to the control line LTL Minuette (0.6565) and the warning line LWL100.0 (0.6535) oof the Minuette operational scale forks. We look at the layout of the AUD / USD movement options from February 26, 2020 on the animated chart.
____________________ US dollar vs Canadian dollar Starting from February 26, 2020, the Canadian dollar USD / CAD will continue its movement depending on the direction of the breakdown of the range :
The breakdown of the support level of 1.3280 on the initial SSL line of the Minuette operational scale forks will make it relevant to continue the development of the downward movement of the Canadian dollar to the goals: - the initial SSL Minuette line (1.3225); - control line LTL Minuette (1.3215); - local minimum 1.3201; - 1/2 Median Line Minuette channel (1.3185 - 1.3140 - 1.3095).The breakdown of the resistance level of 1.3300 on the ISL38.2 Minuette will lead to the development of the USD / CAD movement in the equilibrium zone (1.3300 - 1.3330 - 1.3360) of the Minuette operational scale forks with the prospect of reaching the final Schiff Line Minuette (1.3410). We look at the markup of USD / CAD movement options from February 26, 2020 on the animated chart.
____________________ New Zealand dollar vs US dollar On February 26, 2020, the development of the movement of the New Zealand dollar NZD / USD will depend on the development and direction of the breakdown of the range :
In case of breakdown of the resistance level of 0.6325, the NZD / USD movement will continue in the 1/2 Median Line Minuette channel (0.6325 - 0.6336 - 0.6350) with the prospect of reaching the boundaries of the equilibrium zone (0.6390 - 0.6415 - 0.6440)of the Minuette operational scale forks. Alternatively, with the breakdown of the support level of 0.6310 on ISL38.2 Minuette, the development of the movement of the New Zealand dollar in the equilibrium zone (0.6310 - 0.6215 - 0.6120) of the Minuette operational scale forks will be relevant, taking into account the development of the control line LTL Minuette (0.6275) and the final Schiff Line Minuette (0.6170). We look at the layout of the NZD / USD movement options from February 26, 2020 on the animated chart.
____________________ The review was compiled without taking into account the news background. Thus, the opening trading sessions of major financial centers does not serve as a guide to action (placing orders " sell " or " buy ") The formula for calculating the dollar index: USDX = 50.14348112 * USDEUR0.576 * USDJPY0.136 * USDGBP0.119 * USDCAD0.091 * USDSEK0.042 * USDCHF0.036. where the power coefficients correspond to the weights of the currencies in the basket: Euro - 57.6%; Yen - 13.6%; Pound Sterling - 11.9%; Canadian dollar - 9.1%; Swedish krona - 4.2%; Swiss franc - 3.6%. The first coefficient in the formula leads the index to 100 at the start date of the countdown - March 1973, when the main currencies began to be freely quoted relative to each other. The material has been provided by InstaForex Company - www.instaforex.com |
| Trading plan for EUR / USD and GBP / USD on 02.25.2020 Posted: 25 Feb 2020 03:46 PM PST What is happening in the currency market raises more and more questions especially if you look at the behavior of the single European currency and the pound, which behave in completely different ways. And it would be nice if this happened under the influence of certain macroeconomic data or political events both in the European Union and Great Britain. So no, nothing of the kind happened yesterday.
At the same time, as usual, the market completely ignored the rather secondary data on Germany. We are talking about the IFO indices, which remained completely without any attention. At the same time, the business optimism index increased from 96.0 to 96.1, but the current situation assessment indicator declined from 99.2 to 98.9. In turn, the expectations index rose from 92.9 to 93.4. At the same time, it is surprising how expectations can grow if the current situation worsens. So, on the whole, the data can be characterized as multi-directional, and no conclusions can be drawn from them. Moreover, the lack of reaction is also associated with this. IFO Business Optimism Index (Germany):
On the other hand, the single European currency began to grow actively from the very opening of the American trading session, although at the same time, I placed French government securities, the yield on which went down. In particular, the yield on 6-month bonds decreased from -0.587% to -0.589%, while 12-month bills from -0.582% to -0.591%. Only on 3-month bills was an increase in profitability recorded from -0.596% to -0.587%. And yes, this is not a mistake. The yield on them is negative for all. That is, investors will receive less than they invested. And in theory, this situation should scare investors, but the single European currency was growing.
And against the background of all this, the subsequent behavior of the dollar at the time of placement of already US government debt securities, looks extremely untypical. It's just right. The profitability went down and the dollar became cheaper. But then again, only in relation to the single European currency. So, the yield on 3-month bills decreased from 1.545% to 1.505%, while on 6-month bills from 1.51% to 1.44%. And here is where the behavior of the dollar is completely logical and correct. However, another thing is surprising, because the yield on government loans should go down if the market expects a decrease in the refinancing rate of the Federal Reserve. But the fact is that American macroeconomic statistics clearly indicate that Jerome Powell just right to think about the possibility of raising this refinancing rate. So questions are raised by the dynamics of the yield on government debt securities, since it is clearly moving in the wrong direction. Although this may be due to just growing demand associated with a clear deterioration in the economic situation in Europe, while the US economy is doing quite well.
The market continues to demonstrate its indifference to European macroeconomic data since early in the morning. Although in Germany, Europe's largest economy, the fourth quarter final GDP data showed that economic growth did not slow down from 0.6% to 0.4%, as preliminary data showed, but to 0.3%. In other words, the German economy is moving toward recession even faster, but the market does not seem to notice it. Just as he did not notice the slowdown in the decline in producer prices in Spain from -1.9% to -0.8%. Although everything is clear here, since the Spanish macroeconomic data are in any case not as important as the German ones. GDP growth rate (Germany):
However, today is seriously different from yesterday, as the United States publishes important macroeconomic data. Well, the market reacts extremely sensitive to American statistics. So, the S & P / CaseShiller data should show an acceleration in the growth rate of housing prices from 2.6% to 2.8%. Given the fact that rising house prices is a leading inflation indicator, then inflation will continue to rise. It turns out that American statistics may well be the reason for the resumption of the strengthening of the dollar. S & P / CaseShiller (United States) Housing Price Index:
The euro / dollar currency pair which is in the correction phase returned to the area of 1.0850, where the quote slowed down and formed a range of 1.0840 / 1.0870. It is likely to assume that the fluctuation in the given framework will continue in the market, where in case the price is fixed lower than 1.0830, a signal of working off the level of 1.0850 will be received and, as a fact, the downward trend will be restored.
The pound / dollar currency pair is within the correctional course of the past week, where the quote tends to a maximum of 1.2976. It is likely to assume that the local upward interest will soon change, and the quote will return to the values of 1.2900 ---> 1.2885 again.
|
| Posted: 25 Feb 2020 03:44 PM PST Good evening, dear traders! I bring to your attention a trading idea for the GBP/USD pair. Let me remind you that we hunted for the level of 1.3070 last week as part of the Hunting for Feet system. To date, the pair has stopped at around the level of 1.2930, forming the so-called. figure "triangle" on a daily scale. I'll tell you a little secret. In fact, no one knows where this triangle can be traded, but if it is traded through longs, this will allow the pair to work out the Absorption model with the first target with a round level of 1.29 and then take the main target of 1.3070, which is the current price that will make the passage to 1400p. A full breakdown of yesterday's low of 1.2880 and 1.28500 will cancel the long scenario. This is a very realistic scenario against the background of a careful recovery of major currencies. Have a successful trading and control the risks! The material has been provided by InstaForex Company - www.instaforex.com |
| Technical analysis recommendations for EUR/USD and GBP/USD on February 25 Posted: 25 Feb 2020 03:44 PM PST Economic calendar (Universal time) There are practically no important indicators in today's economic calendar. We can only note the consumer confidence index, the publication of data on which was expected at 15:00 (USA). EUR / USD The players on the increase were able to keep the situation yesterday and did not allow the opponent to form a rebound from the resistance encountered in the daily short-term trend. Thanks to this, we can say that the bulls insist on the development of a corrective rise. This week, we close the month. If the downside players cannot fix the close within the downward trend (the minimum extremum is 1.0879), and throw only a long shadow of the monthly candle in its direction, then most likely, the activity in March and strengthening of moods will come from the opponent. In the lower halves, the inability of players to increase reliably to go beyond the correction zone deprives them of support for some technical indicators. And only the continuation of the rise and the formation of new highs can change the situation on H1. The upward reference points within the day are the resistance of the classic Pivot levels 1.0881 - 1.0910 - 1.0948. The key support is located today at 1.0843 (central Pivot level) and 1.0815 (weekly long-term trend). GBP / USD On the first day of the week, the pair failed to realize anything that would make a difference. The current resistance is still 1.2958 (daily Tenkan), further with the quality of resistance 1.2986 (Fibo Kijun) - 1.3028 (Kijun) - 1.3066 (daily Fibo Kijun + weekly Tenkan). The role of key supports in this sector remains at the levels of 1.2920 (weekly Fibo Kijun) - 1.2882 (monthly Fibo Kijun). At the moment, the struggle for key levels continues in the lower halves, they are located at 1.2922-39 (central Pivot level + weekly long-term trend) today. So, developing the above levels will provide an initial advantage for players to increase. Further, updating the highs (the first 1.2980) and overcoming the resistance of the higher halves, which strengthen the intraday resistance of the classic Pivot levels 1.2957 - 1.2990 - 1.3025, will be of importance. Ichimoku Kinko Hyo (9.26.52), Pivot Points (classic), Moving Average (120) The material has been provided by InstaForex Company - www.instaforex.com |
| Posted: 25 Feb 2020 03:44 PM PST Good evening, dear traders! Congratulations to those who took advantage of yesterday's trading idea for selling gold. Let me remind you that the idea was to develop the so-called the "climax of growth", which is determined by the huge ATR at the end of the trend. And it so happened that this ATR was passed yesterday during Asian session and completed to about 4000p. This is a lot even for gold, I'm not saying that it was in Asia, where the average volatility is about 30 - 500p It is worth noting separately the goals for which recommendations were given to sell gold, it was an Asian platform at the level of 1658 and a test of the "mirror level" at the quote of 1650. The first goal developed last night during the American session, while the second was today in Asia. The pass on the first target was 2500p, while 3400p on the second. Good luck in trading and see you in the next reviews! The material has been provided by InstaForex Company - www.instaforex.com |
| Indicator analysis. Daily review of the GBP / USD currency pair for February 25, 2020 Posted: 25 Feb 2020 03:43 PM PST Trend analysis (Fig. 1). On Tuesday, it is possible to move up with the first target 1.2987 - a pullback level of 38.2% (red dashed line) from the support level 1.2903 (white bold line). If this level is reached, we can continue working upwards with the target of 1.3031 which is a pullback level of 50.0% (red dashed line).
Fig. 1 (daily chart). Comprehensive analysis: - indicator analysis - up; - Fibonacci levels - up; - volumes - up; - candlestick analysis - up; - trend analysis - up; - Bollinger lines - down; - weekly schedule - up. General conclusion: Today, the price may continue to move up. On Tuesday, there is also a very possible scenario: Working down with the target of 1.2756 which is the support line (red bold line) from the support level of 1.2903 (white bold line). The material has been provided by InstaForex Company - www.instaforex.com |
| Indicator analysis. Daily review of the EUR / USD currency pair for February 25, 2020 Posted: 25 Feb 2020 03:43 PM PST On Monday, the pair moved down by 30 points all day after the gap, breaking through the pullback level of 14.6% - 1.0847 (red dotted line). Today, strong calendar news was expected at 7.00 Universal time (Euro) and 15.00 Universal time (dollar). Trend analysis (Fig. 1). On Tuesday, the market may continue to move up with the target of 1.0888 - a pullback level of 23.6% (red dashed line). Upon reaching the level of 1.0888, it is likely to continue working up.
Fig. 1 (daily chart). Comprehensive analysis: - indicator analysis - up; - Fibonacci levels - up; - volumes - up; - candlestick analysis - up; - trend analysis - up; - Bollinger Lines - up; - weekly schedule - up. General conclusion: Today, we expect an upward movement with the target of 1.0888 - a pullback level of 23.6% (red dashed line). Upon reaching the level of 1.0888, it is likely to continue to work up. An unlikely but possible scenario: Working down with the target at 1.0779 - the lower fractal (red dashed line), from the level of 1.0855 (closing yesterday's daily candle). The material has been provided by InstaForex Company - www.instaforex.com |
| Posted: 25 Feb 2020 03:43 PM PST Minuette operational scale (H4) This week is the last week of February and then spring. So, what have we prepared the main currency instruments before spring? ____________________ US dollar index The movement of the dollar index #USDX from February 25, 2020 will continue to be determined by the development of the range :
The breakdown of the support level of 99.54 on ISL61.8 Minuette will lead to the development of the #USDX movement which will then occur in the equilibrium zone (99.54 - 99.34 - 99.14) of the Minuette operational scale forks, with the prospect of reaching the starting line SSL Minuette (98.50) and the upper boundary of ISL38.2 (98.30) of the Minuette operational scale forks after the breakdown of ISL38.2 Minuette (99.14). In case of breakdown of the warning line UWL38.2 of the Minuette operational scale forks - resistance level of 99.68 - option to continue the development of the upward movement #USDX to the targets: - local maximum of 99.91 ; - warning line UWL61.8 Minuette (99.9 7); - final line FSL Minuette (100.22); - warning line UWL100.0 Minuette (100.45). The details of the #USDX movement is presented on the animated chart. ____________________ Euro vs US dollar The development of the single European currency EUR / USD movement from February 25, 2020 will be determined by the development and direction of the breakdown of the channel boundaries 1/2 Median Line (1.0800 - 1.0815 - 1.0830) of the Minuette operational scale forks. For details, look at the animated chart. The breakdown of the resistance level of 1.0830 on the upper boundary of the 1/2 Median Line Minuette channel is the resumption of the upward movement of EUR / USD to the equilibrium zone (1.0850 - 1.0880 - 1.0905) of the Minuette operational scale forks with the prospect of reaching the lower boundary of the ISL61.8 (1.0990) equilibrium zone of the Minuette operational scale forks. Alternatively, the breakdown of the support level of 1.0800 on the lower border of the 1/2 Median Line Minuette channel will lead to the continuation of the development of the downward movement of the single European currency towards the goals: - local minimum 1.0778 ; - SSL start line (1.0760) of the Minuette operational scale forks; - control line LTL Minuette (1.0740); - warning line LWL100.0 Minuette (1.0730). The details of the EUR / USD movement options are shown on the animated chart. ____________________ Great Britain pound vs US dollar From February 25, 2020, Her Majesty's currency GBP / USD will continue to develop its movement depending on the development of the range :
A return above the resistance level of 1.2920 will determine the development of the GBP / USD movement in the 1/2 Median Line Minuette channel (1.2920 - 1.2945 - 1.2970) with the possibility of reaching (after the breakdown of the upper boundary of the 1/2 Median Line Minuette channel - 1.2970) the boundaries of the equilibrium zone (1.3000 - 1.3040 - 1.3075) of the Minuette operating scale forks. On the other hand, the breakdown of the support level of 1.2880 on the SSL Minuette start line will make it possible to continue the downward movement of Her Majesty's currency to the local minimum 1.2848 and the boundaries of the equilibrium zone (1.2830 - 1.2775 - 1.2720) of the Minuette operational scale. The details of the GBP / USD movement can be seen on the animated chart. ____________________ US dollar vs Japanese yen The development of the currency movement of the "country of the rising sun" USD / JPY from February 25, 2020 will continue depending on the development of the range :
The breakdown of the final Shiff Line Minuette - support level of 111.25 - will lead to the continuation of the development of the downward movement of USD / JPY to the boundaries of the 1/2 Median Line channel (110.40 - 110.10 - 109.80) of the Minuette operational scale forks. In contrast, the breakdown of ISL38.2 Minuette - resistance level of 111.66 - will lead to the resumption of the development of the currency of the "country of the rising sun" in the equilibrium zone (111.66 - 112.10 - 112.55) of the Minuette operational scale forks with the prospect of reaching the final line FSL Minute (114.00). We look at the details of the USD / JPY movement on the animated chart. ____________________ The review is made without taking into account the news background. Thus, the opening of trading sessions of major financial centers does not serve as a guide to action (placing orders "sell" or "buy"). The formula for calculating the dollar index : USDX = 50.14348112 * USDEUR0.576 * USDJPY0.136 * USDGBP0.119 * USDCAD0.091 * USDSEK0.042 * USDCHF0.036. where the power coefficients correspond to the weights of the currencies in the basket: Euro - 57.6% ; Yen - 13.6% ; Pound Sterling - 11.9% ; Canadian dollar - 9.1%; Swedish krona - 4.2%; Swiss franc - 3.6%. The first coefficient in the formula leads the index to 100 at the start date of the countdown - March 1973, when the main currencies began to be freely quoted relative to each other. The material has been provided by InstaForex Company - www.instaforex.com |
| EUR/USD. Dollar in disgrace: the pair braces to storm the ninth figure Posted: 25 Feb 2020 03:08 PM PST The dollar index continues to lose ground as it falls following the yield of 10-year Treasuries, which in turn dropped below 1.130% - that is, to the lows of 2016. The coronavirus factor, which until recently significantly strengthened the US currency, now turned against it a heavy anchor. Traders are afraid of investing in the dollar, as rumors about the Federal Reserve's possible reaction to the current situation intensified in the market. In addition, the Japanese currency returned to operation this week, after unexpectedly optimistic statements by the head of the Bank of Japan. After the risk of interest rate cuts by the Japanese central bank weakened, the yen began to gain momentum, being in demand as a defensive tool. But traders have revised their attitude to the US currency: and although the dollar index is still kept at high values, the downward trend has become quite persistent. The euro-dollar pair also uses the greenback's temporary "disgrace". After reaching many-year lows, the price got stuck in a flat last week: the bears were afraid to catch the price low, in turn, the bulls had no arguments for growth. The situation was in limbo for several days. It became clear at the beginning of the week that sellers are not able to develop the downward trend. For many reasons, both because of the oversoldness of the pair (the price nearly plunged without retreating for three weeks), and because of the continued vulnerability of the dollar, amid the dovish comments of some Fed representatives. In other words, it was only a matter of time for the corrective growth of the EUR/USD pair. I did not have to wait long: the buyers of the pair took the initiative today, gradually approaching the boundaries of the 9th figure. The price growth was provoked only by a weakening dollar - the European currency is still under pressure from fundamental problems, including those related to the spread of coronavirus. Why is the dollar so drastically weakened? A catalyst for the overall decline in greenback was an indicator of consumer confidence in the Americans. Contrary to growth forecasts, it remained almost at the level of January, adding only four tenths of a percent. But this release served only as a formal occasion, while the real reasons are more widespread. So, on the market they are increasingly saying that the Federal Reserve may lower the interest rate at one of the next meetings (either in April or in June). Some of the analysts even allow a double decline - in summer and autumn. In their opinion, such a scenario cannot be ruled out - everything will depend on the scale of the economic crisis, which could be triggered by the coronavirus factor. Representatives of the Fed do not confirm, but do not refute such intentions. For example, Jerome Powell made it clear at the end of his speech in Congress that the Fed is ready to maintain a wait-and-see attitude unless events of an "unforeseen nature" lead to a significant reassessment of current prospects. This conclusion was also mentioned in the Fed's semi-annual report. Obviously, the negative consequences of the epidemic can be attributed to events of "unforeseen nature." The rest of the Fed voiced diametrically opposed opinions. So, the president of the Federal Reserve Bank of Atlanta, Rafael Bostic, believes that the coronavirus epidemic will have a short-term effect on economic activity, and therefore there is no need to change monetary policy at the moment. His colleagues - Judy Shelton and Christopher Waller (Trump's allies) said they were ready to reduce the interest rate - down to zero. Neel Kashkari, who is a consistent dove, also called for an interest rate cut to offset the negative effects of coronavirus. The head of the Federal Reserve Bank of Cleveland, Loretta Mester, called the epidemic "a significant risk factor," but at the same time called for a wait-and-see attitude. In other words, the Fed's interest rate cut is back on the agenda. The very fact of such a discussion is already putting pressure on the dollar. Pressure will increase if there are more supporters of the dovish scenario. By the way, the representative of the European Central Bank - the head of the Bank of France Francois Villeroy - unexpectedly voiced optimistic rhetoric today. According to him, an outbreak of coronavirus will negatively affect the dynamics of key indicators, but at the moment, "you should not respond to the circumstances with the help of monetary policy." And although Villeroy has only voiced his opinion, this news feed provided background support for the euro, especially after yesterday's IFO reports that came out in the green zone. Thus, buyers of the EUR/USD pair took advantage of the fundamental picture that has developed against the US currency today. Although the correction for the pair was brewing for a long time, the bulls needed a good reason for the upward momentum. Today, as they say, "the stars came together" - against the backdrop of a rapid decline in the dollar index, the ECB representative voiced very encouraging theses. But here it must be emphasized that we are only talking about a temporary correction. According to many experts, Italy will not be able to restrain the spread of the epidemic, especially given the openness of borders between EU countries. For example, they announced the first people who became infected in Austria and Croatia - according to local authorities, all those who were ill recently visited Italy. Therefore, the coronavirus is just beginning its "tour" in Europe, and the euro will still feel the consequences of this "trip". Therefore, when the pair approaches the resistance level of 1.0920, traders should be careful - EUR/USD bears can become active here, especially when panic in Europe intensifies. The material has been provided by InstaForex Company - www.instaforex.com |
| GBP/USD. Results of February 25. EU has decided on the "basis" of a future deal with Britain Posted: 25 Feb 2020 03:08 PM PST 4-hour timeframe Amplitude of the last 5 days (high-low): 78p - 115p - 80p - 105p - 68p. Average volatility over the past 5 days: 90p (average). The GBP/USD currency pair continues to trade indistinctly, in different directions. For example, on the second trading day of the week, quotes of the pair resumed the upward movement, although there were no special reasons and grounds for this. Even the technical ones. The current picture did not require, for example, an upward correction, as in the situation with the euro currency. However, the pound is growing, again without reason. Today, traders managed to work out the upper line of the volatility channel on February 25th. If you look at the 24-hour timeframe, it becomes clear that since December 20, an absolutely slurred and non-trending movement has continued. Thus, trading on the pair is complicated by this particular factor - the lack of trend movement, although, of course, a certain downward trend (very weak) is taking place. Meanwhile, the EU Council of Ministers today approved a mandate to negotiate with the British government as part of a future cooperation agreement after Brexit. According to sources in the European Commission, Brussels (as previously reported) will seek to conclude a comprehensive agreement with London on the basis of mutual obligations and fair competition between European and British companies. The European Union is ready to conclude an agreement with zero tariffs and duties, but it will also include a lot of points that determine the regulation of other areas of life, and not just trade relations. On the most controversial issue regarding fishing in British waters, the European Union proposes to conclude a separate bilateral deal, in which clear rules will be determined. Of course, the EU is not going to give up the opportunity to fish in British waters. It is also reported that the mandate of the European Commission concerns cooperation in areas such as intellectual property, government procurement, transport, energy, and security. In simpler terms, the EU lays down in a 46-page document the principles by which Michel Barnier will negotiate with Boris Johnson. That is, the European Union offers London zero quotas and tariffs only in exchange for the application of its own standards in the areas of state aid, competition, the social sphere, labor, ecology, climate, tax issues and so on ... Thus, the EU's position in future negotiations is absolutely understandable and it is radically opposed to the position of London. It is absolutely obvious that the government of Boris Johnson will not like this mandate, and in the near future we can expect comments from top officials of the UK, which will probably say that London will not agree to such conditions in Brussels. Even in exchange for a soft trade deal. However, the question will be whether Boris Johnson is really ready to refuse to sign an agreement with the EU, considering what kind of blow will be inflicted on the economy in this case? After all, such an option could be justified if Johnson had already had a trade agreement with the United States on hand. However, with Donald Trump, you still need to agree. Given that the US president is a businessman to the bone, one can hardly expect that the United States will conclude an agreement that will be disadvantageous for them. Thus, it is far from a fact that Johnson will be able to agree with his "friend" Trump on the subject of trade relations. Recall that recently the "black cat" has already run before the heads of countries because of Huawei, which Trump is fighting with, but whom Johnson allowed to develop 5G networks in Britain. Thus, both potential trade agreements are "hanging in the air" and so far there is no information that would make their signing truly credible. In any case, we should now wait for comments from the British negotiating group, as well as the start of official negotiations. From a technical point of view, the pound/dollar pair continues to trade in the "seesaw" mode with a low downward slope. We still believe that there are no good reasons for the British currency to sharply strengthen. The pound will receive a powerful support factor if Johnson manages to sign an agreement with the EU, since Brexit can really be considered soft. Otherwise, we expect the pound's quotes to collapse. The same as the euro/dollar was in the last month. Sooner or later, the bulls will stop resisting in the GBP/USD pair, since they have no macroeconomic support. Thus, in spite of overcoming the Kijun-sen and Senkou Span B lines, a downward reversal and the resumption of the downward movement may occur in the near future. Trading recommendations: GBP/USD pair began a new round of upward correction. Thus, it is recommended to sell the British pound with targets at 1.2850 and 1.2824 no earlier than the return of quotes of the pair below the critical line. We recommend that you consider buying the pair with a target of 1.3055 in small lots, since a downward turn could occur at any moment, and the fundamental background still does not support the pound. Explanation of the illustration: Ichimoku indicator: Tenkan-sen is the red line. Kijun-sen is the blue line. Senkou Span A - light brown dotted line. Senkou Span B - light purple dashed line. Chikou Span - green line. Bollinger Bands Indicator: 3 yellow lines. MACD indicator: Red line and bar graph with white bars in the indicators window. Support / Resistance Classic Levels: Red and gray dashed lines with price symbols. Pivot Level: Yellow solid line. Volatility Support / Resistance Levels: Gray dotted lines without price designations. Possible price movements: Red and green arrows. The material has been provided by InstaForex Company - www.instaforex.com |
| Posted: 25 Feb 2020 03:08 PM PST 4-hour timeframe Amplitude of the last 5 days (high-low): 52p - 26p - 43p - 80p - 64p. Average volatility over the past 5 days: 54p (average). The EUR/USD currency pair was adjusted against the correction on the second trading day of the week. Formally, we now have a signal to buy from the Ichimoku Golden Cross. However, the price is located inside the Ichimoku cloud, so the signal is weak. The bulls have very little strength even despite the fact that quotes of the euro/dollar pair fell for almost three full weeks. This suggests that the bears continue to own the initiative in the market and simply do not reduce previously opened dollar positions. Since it turns out that the demand for the US currency does not decrease, but the euro is not growing as well, the pair is moving up reluctantly. Of course, everything may change in the coming days, but at the moment we can say that the pair does not have enough strength to make a normal correction. Zero macroeconomic data and fundamental backgrounds provide great help in this. Not a single truly important report was published either in the US or in the European Union during the first two trading days of the week. The situation will not change for the better tomorrow. The German GDP report, which became known today, was of a secondary nature, since Germany, although it has a great influence on the entire economy of the eurozone, is still only one out of 27 countries. Moreover, the real value of GDP for the fourth quarter completely coincided with the forecast : +0.4% in annual terms and 0.0% in quarterly terms. Thus, the economy of the EU locomotive is slowing down more and more and threatens to go into a frank recession in the coming year. Given this fact, as well as the fact that coronavirus affects the global economy, it is unlikely that in the near future we should expect an acceleration of the German or pan-European economy. Of course, the US economy is also unlikely to continue to accelerate, since it is closely linked to the Chinese one. And in China, there is now a decline in business activity, a drop in industrial production due to quarantine due to the virus in certain areas. Outbreaks of the epidemic have already been announced in other countries, for example, in Italy. Several areas have also been quarantined. All of this will continue to slow down the global economy, which has just recovered from a trade war between the United States and China. Based on the foregoing, it turns out that both American and European economies are very likely to slow down due to the coronavirus. The question is which economy will slow down faster. World media also note a serious drop in US stock indices, in particular the S&P 500 index. But even taking into account the fact that more than 900 billion capitalization has been lost, the US dollar has undergone sales coupled with the euro. It may have fallen in price with some other currencies, but hardly too much. Thus, even with the increased likelihood of lowering the key Fed rate, if the coronavirus cannot be overcome in the near future, the US currency would still be alright. What can I say, paired with the euro, it feels just fine, because it does not lose ground even after strong growth, and traders do not have enough strength to start a sensible correction. Thus, the general conclusion remains the same. Whatever happens in the world, it affects both the US and the EU. The alignment of forces between the two economies does not change. The alignment of forces between the monetary policies of the Fed and the ECB does not change. Thus, the US dollar still looks much stronger than the euro and will continue to strive for price parity with the euro in the long run. We said earlier that in order for the euro to start to rise in price not within the framework of a simple correction (although this is not observed now), serious improvements in the EU economy or a strong weakening of the US economy are required. Neither one nor the other is now observed. Moreover, if Trump does start a trade war with the EU, as he intends, it will be another blow to Brussels. Moreover, the European economy is already experiencing problems due to a hole in the budget of 75 billion euros due to Great Britain's withdrawal from the bloc. This means that it will be necessary to cut down various programs, financing various projects, all this only weakens Europe. Thus, the situation does not even maintain equilibrium. Factors affecting the economy negatively are now much more in the EU than in the US. From a technical point of view, the euro/dollar fell to the critical line and is now trying to resume the upward movement. And all this happens within the Ichimoku cloud. Thus, the upward prospects of the euro remain obscure. Trading recommendations: The EUR/USD pair continues a corrective movement. Thus, now it is formally possible to consider long positions with targets 1.0881 and 1.0905, but with extremely small lots or none at all. It will be possible to return to selling the pair with targets at support levels of 1.0795 and 1.0743, if traders manage to gain a foothold back below the critical line. Explanation of the illustration: Ichimoku indicator: Tenkan-sen is the red line. Kijun-sen is the blue line. Senkou Span A - light brown dotted line. Senkou Span B - light purple dashed line. Chikou Span - green line. Bollinger Bands Indicator: 3 yellow lines. MACD indicator: Red line and bar graph with white bars in the indicators window. Support / Resistance Classic Levels: Red and gray dashed lines with price symbols. Pivot Level: Yellow solid line. Volatility Support / Resistance Levels: Gray dotted lines without price designations. Possible price movements: Red and green arrows. The material has been provided by InstaForex Company - www.instaforex.com |
| Posted: 25 Feb 2020 03:08 PM PST The euro remained traded in a narrow price range against the US dollar and, after an unsuccessful attempt to break above yesterday's highs, retreated to the support area of 1.0835. The evidence that the German economy cannot gain strength and show good growth in any way did not put serious pressure on risky assets, since after recent fundamental statistics, few expected a good start to this year. Weak global demand and a decline in domestic investment are key issues for Germany, where industrial production can also be recorded, a recession in which will continue. Small growth in the manufacturing sector is likely to be quickly crossed out by weak demand from Asia, which is slowing amid the negative impact of coronavirus on the global economy. According to a report by the Destati National Bureau of Statistics, Germany's GDP in the fourth quarter of 2019 remained unchanged from the previous quarter. Compared with the same period of the previous year, GDP in the fourth quarter grew by only 0.4%. The data completely coincided with the forecasts of economists. It should be noted that it was possible to count on domestic consumption back in the third quarter, which by the end of the year also significantly decreased, as did external demand. Consumer and government spending also declined. Household expenses in the fourth quarter remained unchanged, while government spending grew by only 0.3%. The euro managed to maintain its position only because the data coincided with the forecasts of economists, as some experts, after weak December data on manufacturing orders and industrial production in Germany, expected a contraction in the fourth quarter. Let me remind you that Germany's GDP grew by 0.2% in the third quarter, and it fell by 0.2% in the second quarter after increasing by 0.5% in the first quarter. The growth of the German economy was at the level of 0.6% for the entire 2019. Today's report from Ifo Institute on the mood of German exporters in February this year did not please traders. According to the data, the index of expectations regarding export of the manufacturing sector fell to -0.7 points in February from 0.8 points in January, and a more serious surge of coronavirus on the European continent leaves little room for improvement in the future. Data on the mood of business circles in France also once again confirmed the complexity of the situation. According to the report, the sentiment index in business circles of France in February of this year remained at the level of 102 points against 102 points in January, while its decline was predicted to reach the level of 99 points. As for the technical picture, the bulls have not yet managed to renew yesterday's high, while a large resistance was formed in the 1.0870 area, which, although it leaves the market on their side, it is best to look at long positions only after correction to the lower boundary of the ascending channel, which passes the area of 1.0810. A break of the high of 1.0870 will make it possible to maintain a bullish momentum in risky assets, which will lead to an update of the levels of 1.0895 and 1.0930. GBPUSD The British pound continues to strengthen against the US dollar. Talk that the new British finance minister, Rishi Sunak, can seriously address the issue of easing fiscal policy, is supporting the pound, which, taking advantage of growing problems in other countries, is gradually regaining its position before the start of important UK-EU negotiations. It should be noted the gradual improvement in economic indicators after the MP elections in the UK in December last year, as well as after Brexit at the end of January this year, which adds confidence to investors and businesses after a long period of uncertainty. Let me remind you that the plan of government spending will be presented on March 11. The material has been provided by InstaForex Company - www.instaforex.com |
| Fear runs ahead of the engine, or gold rush continues Posted: 25 Feb 2020 03:08 PM PST The body's response to the infection sometimes causes more severe pain than the infection itself. The same applies to the impact of the epidemic on the economy. Like financial crises, epidemics create widespread uncertainty, and sometimes panic. The sharp drop in the US stock market last Monday reflected fears that the reaction to the spread of coronavirus in other countries could become as severe as in China. Goldman Sachs experts predict that economic growth in the United States will slow down by 0.8% year on year due to declining tourist flows, exports, and supply chain disruptions, but by the end of the year this slowdown will be largely offset. "The fear of the virus so far spreads around the world much faster than the virus itself," analysts say. Markets fear that further spread of the infection will have a negative impact on the global economy. Gold has traditionally been considered a defensive asset in which players invest in situations fraught with recession or serious economic shocks. On the eve of the course, the precious metal reached a seven-year high, soaring above $1,690 per ounce. Gold rose by a record 2.7%. Until that moment, the highest growth of quotations within one day took place in June 2016. Then the results of the referendum in the UK became known, as a result of which the inhabitants of the country decided to leave the European Union. Today, the precious metal broke the five-day growth band and retreated in the region of $1650 per ounce. The main reasons for this correction are short-term overbought and profit taking, the precious metal has risen in price by more than 9% since the beginning of the month. Although gold has already updated multi-year highs, experts do not yet see global reasons for the reversal of the upward trend. Goldman Sachs expects the precious metal to continue to rise in price. The main drivers are low interest rates on US government bonds, weakening stock markets and the coronavirus epidemic, which began to spread outside of China. "If, according to the results of the first quarter, it is not possible to slow down the spread of the virus, then the cost of precious metals may rise to $1,750 per ounce, and if the situation worsens in the second quarter, it will rise to $1,850. Much will depend on the measures taken by central banks and national governments against the backdrop of a deteriorating situation in the global economy," bank strategists believe. The material has been provided by InstaForex Company - www.instaforex.com |
| Posted: 25 Feb 2020 03:08 PM PST Markets expect hints from the behavior of US indices: On Monday, the US market fell by 3.5% in major indices - after reports of the spread of coronavirus in Italy and South Korea. Today, the market is waiting - will there be a continued fall in US indices or the market will calm down. Furthermore, investors will wait until the release of new data on the virus tomorrow morning. EURUSD: Correction continues. The highest correction level is up 1.0910. We are waiting for a reversal down and the euro to fall. We sell from 1.0880 and above. The material has been provided by InstaForex Company - www.instaforex.com |
| Correction is unlikely to be deep, AUD and NZD remain in a downward trend Posted: 25 Feb 2020 03:08 PM PST The pace of distribution outside of China has led to large-scale sales in world markets. The US and European indices fell by 3-4%, the yield is approaching record low levels in 2016, the probability of a FOMC rate cut by the end of the year is 75%, oil fell by 4% on Monday. The virus does not have a noticeable effect on the US economy, unlike the Asia-Pacific countries or Europe, so the dollar remains a favorite in the foreign exchange market. A large package of macro-statistics will be published on Thursday, in particular, annual GDP data and a report on orders for durable goods in January. The dollar will go into a shallow correction if the data turns out to be disappointing, otherwise, only the yen will be able to compete with it by the end of the week. NZDUSD The COVID-19 virus continues to have a devastating effect on the global economy. The main blow in New Zealand was dealt to exporters, but if the Chinese economy continues to slow down at the same pace, then problems will begin not only with exports, but also with imports. China is not only a supplier of toys or electronics, it is also a key supplier of a number of goods that are crucial for construction, manufacturing and agriculture. Since it is impossible to reliably assume a return to China's normal economic activity, the risks are shifting towards worse. ANZ Bank forecasts GDP growth in Q1 of just 0.1%, which is close to stagnation, while 0.5% for the second quarter, and this is provided that the pandemic remains under control. Only in terms of employment can the forecasts be considered neutral, and all other key parameters are expected to deteriorate. Despite the fact that the NZDUSD rate has gone significantly lower than the estimated fair price, all that kiwi bulls can count on is just a correction within the current trend. Until January, the flow of capital in the main financial markets of New Zealand was positive; by the beginning of February, a net long position in kiwi was formed on the CME exchange, which gave good chances for the New Zealand dollar to continue to grow. However, the coronavirus has confused all the cards, the capital goes into reliable assets, waiting for troubled times, and the direction for NZD remains bearish. All you can count on is correctional growth, since the kiwi is oversold for a short time. The resistance zone is 0.6445/60, with growth to this level, you can sell with the target of 0.6250, where a short consolidation is possible before the breakout of support of 0.6203. AUDUSD The aussie has a slightly higher chance of corrective growth than the NZD, since the CFTC report was neutral and not negative for it, and in general, forecasts for the stability of the Australian economy still look confident. Large-scale fires did not lead to a reorientation of capital flows, and what we see at the moment is a reaction to the virus and following the market. The fair value of the aussie is higher than the current spot value, so the chances of a corrective pullback are pretty high. The January employment report turned out to be slightly better than expected, mainly due to an increase in full employment and a decrease in partial employment, but the PMI together showed activity below the level of 50p, which under deteriorating external conditions can lead to an overestimation of the main forecast indicators. Instead of growth, the PMI in the services sector showed a decline to 48.4p against 50.6p a month earlier, there were minimal changes in the manufacturing industry, the dynamics of the composite index was depressing - there was no way to consider the process positive. Corrective growth to 0.6660/75 is quite likely, but an upward movement will not indicate a trend reversal, resistance is unlikely to be passed and will serve only as the basis for sales from more favorable levels. The long-term goal is in the region of 0.60 - the low of 2008, and if the situation with the virus does not begin to improve, its achievement will happen faster than it seemed a week ago. The material has been provided by InstaForex Company - www.instaforex.com |
| EUR/USD: euro tries to stay afloat, but runs the risk of plunging again Posted: 25 Feb 2020 03:07 PM PST Increased concerns about the spread of coronavirus provoked a 3.4% drop in the S&P 500 index, which was the worst result in the last two years. During the day, the stock index, which now accounts for approximately 44% of the capitalization of the global stock market, lost about $927 billion. A sharp deterioration in the global risk appetite made it possible for the funding currencies in the form of the euro and the yen to return to the game. Until recently, global stock indices ignored the outbreak of a new virus, believing that the US economy, whose export share is insignificant, will remain resistant to external threats. However, an increase in the number of coronavirus cases in Italy, Iran and South Korea has served as a catalyst for the S&P 500 sales. Investors still rely on the Federal Reserve to save the stock index from falling. Against the backdrop of the collapse of US stocks, the chances of the regulator implementing two acts of monetary expansion in 2020 has increased from 46% to 63%. At the same time, rates on ten-year treasuries have come close to record lows since the referendum on UK membership in the EU. Their spread with three-month bills deepened into the red zone, signaling the risk of a recession in the United States. This is an alarming bell for a greenback. The EUR/USD pair managed to cling to the foundation of the 8th figure, also thanks to comments by ECB Vice President Luis de Guindos. In his view, a strong labor market and low interest rates support economic growth in the eurozone. The regulator has long held the position that internal strength provides some protection against global risks, as evidenced by the latest data on European business activity. In February, the composite index of procurement managers rose from 51.3 to 51.6 points. Production PMI rose to an annual high of 49.1 points. Service PMI reached its highest value in the past six months - 52.8 points. Even despite the publication of encouraging PMI statistics, Capital Economics experts believe that eurozone GDP is still lacking momentum. They kept the forecast for economic growth in the region in the first quarter at 0.1%. Thus, the rise of PMI may turn out to be nothing more than market noise. Support for the single European currency was also provided by speeches by the heads of the central banks of France and Italy - Francois Villeroy de Galhau and Ignazio Visco, who called on the national governments of the eurozone to fiscal stimulus. According to them, the ECB's monetary policy is already too soft, the regulator's room for maneuver is limited, so it is unlikely that he will be able to cope with the impending disaster alone. The situation is especially threatening for Italy, which, due to the coronavirus epidemic, runs the risk of facing a technical recession in January – March. Recall that in October – December, national GDP fell by 0.3%. The main currency pair crossed the 1.0850 mark against the background of the publication of unexpectedly strong indicators of economic sentiment in Germany from the IFO Institute. However, technically, the bulls lack momentum, and this is nullifying attempts to restore EUR/USD. Therefore, growth above the 1.0870–1.0875 area should be considered as a convenient opportunity for selling. The round level of 1.0900 should stop the bulls. If this barrier is still taken by them, then a short compression may follow, which will throw the pair to resistance at 1.0955. In this case, the next target for the bulls will be the key psychological mark of 1.1000. Immediate support is now at 1.0800. The lower boundary of the annual downward trend channel passes below the level of 1.0770. Its clean break will target the bears to the next round mark – 1.0700. The material has been provided by InstaForex Company - www.instaforex.com |
| Posted: 25 Feb 2020 03:07 PM PST The Japanese currency has long played the role of a defensive asset, but now its position has been shaken, experts said. The yen is like a snail, which is slow and cautious, but is not afraid to leave a cozy "house" of its defensive status. Experts recorded the unusual dynamics of the USD/JPY pair at the beginning of the week. The paradox of the yen is that it temporarily became a risky asset, suddenly losing safe-haven status. Recall that the Japanese means of payment has long been perceived as a haven currency, but the Chinese coronavirus (COVID-19) has confused all the cards. It was the spread of COVID-19 in Asia, primarily in Japan, which threatened the country's economy that provoked the flight of this haven, that is, a sharp collapse of the yen against the US dollar. Many experts agree that the greenback knocked out the yen at the end of last week. The yen fell 2% against the dollar last Friday, February 21. The bandwagon of the Japanese currency was framed by weak data on the Japanese economy, as well as the growing fears associated with the spread of coronavirus. Recall that in December 2019, the volume of orders in the Japanese machine-building industry decreased by 3.5% year-on-year, and in January 2020, the trade balance fell. As a result, the USD/JPY pair sharply rose from 109.90 yen to 112.20 yen a dollar. Experts recorded a global downward trend of the pair, formed in December 2018. According to experts, the peak value of the USD/JPY pair is the significant resistance level of 112.40, noted in April 2019. It was from this point that a large-scale fall in pair began, analysts said. The USD/JPY pair met at 110.67 on Tuesday morning, February 25, but could not stay in this position for long. Subsequently, the pair fell to 110.59–110.60, becoming a hostage to the downward trend. It became very difficult for the USD/JPY pair to leave this range in which it was located. The currency strategists of a number of large banks are confident that the pair's downward trend will continue in the short term, and the range of 110.70–111.00 may become a support level. According to the forecast of leading analysts at Societe Generale SA, by the end of this year the Japanese currency is expected to decline to 100 yen against the dollar from the previous 98 yen. Experts are at a loss to answer for how long the yen is ready to part with the status of a safe-haven asset, but they are confident that in the medium term everything will return to normal. The Japanese currency will again become a safe asset attractive to investors, which will slowly but surely save their funds. The snail will return to its shell, guaranteeing it protection from market storms, analysts said. The material has been provided by InstaForex Company - www.instaforex.com |
| Revival for the euro: close recovery? Posted: 25 Feb 2020 03:07 PM PST Last week was extremely unfavorable for the European currency. The single currency steadily declined, almost reaching the bottom. According to analysts, it will be difficult for the euro to recover and long enough, but nothing is impossible for the stubborn and persistent, and the single currency is proof of this. The beginning of this week promises a relative calm for the euro. However, the single currency looks vulnerable amid not-so-good news about the spread of the Chinese coronavirus. Experts fear that the fragile balance that appeared in the EUR/USD pair at the end of last week will be upset. Recall that the rapid rise in the index of business activity in the manufacturing sector in Germany became the springboard for the euro last Friday, February 21. The currency jumped to 47.8 points, although experts expected an increase not higher than 45 points. Six months ago, the German economy showed a significant recession amid a sharp reduction in orders from China, and now the tense situation with coronavirus has been added to them. Another traumatic factor for the euro was the growing strengthening of the dollar. The greenback gain was especially noticeable in the EUR/USD pair. Last Friday, the pair experienced not the best of times, then dropping to 1.0800–1.0801, then rising again. The EUR/USD pair felt much more energetic on Tuesday, February 25, as it traded in the range of 1.0851–1.0852 in the first half of the day. Analysts believe that the pair will move to new heights in the near future. However, not all experts are optimistic about the single currency. Leading strategists at Societe Generale SA Bank believe that pressure on the euro will increase, and it will sink even lower. They worsened the forecast for the single currency from the previous $1.2000 to $1.1600. According to analysts, this month the European currency has become one of the weakest key currencies, and in the short term we should not hope for its active growth. Currently, the euro is trying to grow in the hope of stimulating the economy by the US Federal Reserve, but this position seems a bit naive. According to experts, the US regulator is in no hurry to help the European economy, compensating for the decline in production in China due to the coronavirus. Mitsubishi UFJ bank experts emphasize that the latest news creates an extremely negative background for the single European currency. The bank believes that the current recovery of the EUR/USD pair resembles a normal correction. Analysts recommend closely monitoring the support level of 1.0750, a breakthrough of which will signal the resumption of sales of the euro and will open the way to the levels of 1,0500-1,0400. According to experts, the recovery process of the euro will bear fruit. However, you should not count on a quick rise and bewildering records, experts warn. In the situation with the European currency, gradualness and the ability to gain a foothold in the gained positions, rather than to act sporadically, is important, analysts said. The material has been provided by InstaForex Company - www.instaforex.com |
| Watching wedge pattern in AUDUSD for possible break out Posted: 25 Feb 2020 07:27 AM PST AUDUSD remains in a bearish trend making lower lows and lower highs. Price has formed a downward sloping wedge pattern and I believe if see bulls recapture 0.6640 then we should expect more upside towards 0.6740.
Green line - bullish divergence Yellow rectangle - target if resistance breaks Black rectangle - resistance AUDUSD is showing reversal warnings. Price is still below resistance and continues to make lower lows even if the RSI does not follow. Price has resistance at 0.6640 and a break above this area would be bullish for AUD. Our target would be near 0.6740, so traders need to be cautious as a trend change could be around the corner. The material has been provided by InstaForex Company - www.instaforex.com |
| 5 waves down are about to be completed in NZDUSD Posted: 25 Feb 2020 07:22 AM PST NZDUSD is most probably at the final stages of a downward wave that started from 0.6755 and is now at 0.6370. Price has formed an impulsive downward move and we observe a 5 wave formation. Price is now at the final stages of the fifth wave and this is also supported by the bullish divergence in the RSI.
Red line - expected path Yellow rectangle - possible area of end of wave 5 NZDUSD is expected to reverse its trend soon and bounce towards 0.64-0.65. Price is at its final fifth wave and the bullish divergence in the Daily chart supports this scenario. So far we only have a warning and not a reversal signal. Short-term resistance is at 0.6357 where we see is the last three day highs. Breaking above this level will increase the chances that the low is in. The material has been provided by InstaForex Company - www.instaforex.com |
| Analysis and forecast for USD/JPY on February 25, 2020 Posted: 25 Feb 2020 07:13 AM PST Hello, traders! After the fairly impressive growth shown by the USD/JPY pair last week, the current five-day trading session is experiencing a correction in the exchange rate. Investors are actively moving to safe assets now that outbreaks of coronavirus are observed in Italy, South Korea, and Iran. Against this background, the Japanese yen as a safe-haven currency began to be in demand. I wonder why this hasn't happened before. It is clear that everything has its time, especially since the dollar/yen pair reached a strong technical zone of 112.00-112.40. Weekly
As you can see, trading on USD/JPY opened with a bearish gap. At the time of writing, the current weekly candle is inside the big white, which is classified as a reversal model of the harami candlestick analysis. This model is also called "pregnant". If everything ends this way and the current candle remains inside the previous one, a good signal for selling the pair will appear. However, the Harami model is quite insidious and requires confirmation. For now, we will mark the likely USD/JPY targets at the top and bottom. To continue the upward scenario, the bulls on the instrument need to raise the quote above the previous highs of 112.23 and close weekly trades above this mark. I would like to express my personal opinion that it will be quite difficult to do this. First, the auction opened with a price gap down. Second, the Japanese yen has increased demand as a safe asset. In the current situation, we are seeing a pullback to the broken resistance of 110.30, which was difficult to assume at the end of last week. However, the market never ceases to surprise. I believe that around 110.30, a serious fight between bulls and bears will start, and we will try to determine the prospects for this on lower timeframes. Daily
We see that the Kijun line of the Ichimoku indicator is located right under the broken resistance of 110.30, which along with the broken level can provide good support for the pair and return the quote to growth. You can try aggressive and risky buying near 110.30. It is less risky to wait for the end of today's trading and the closing price. If Tuesday's session ends below 110.30, and even more so at 110.14, purchases will have to be postponed until better times. In this case, a false breakdown of the resistance zone of 110.30-110.14 is not excluded. When the pair is restored from the current values and a candle is formed with a long lower shadow and the closing price above 110.30, the signal for opening long positions will become more obvious. H4
It is difficult to call a sufficiently intensive decline, which is a corrective pullback. The pair has fallen below the 50 simple moving average and is testing for a break down the 89 exponential. If the price is fixed at 89 EMA, the next target will be the 200 exponential moving average, which is located at 110.10. In my opinion, this is the last defense of the USD/JPY bulls. In the event of a breakdown of the 200 EMA, the decline will probably continue and its next target will be the price area of 109.65-109.55. The situation for USD/JPY at the moment is such that giving some specific trading recommendations is like pointing a finger at the sky. It is necessary to observe the pair's behavior in the price zone of 110.30-110.14, see the closing price of today's trading, and carefully monitor the candlestick signals on the four-hour and hourly charts. In a day or two, we will return to this interesting currency pair and try to find the optimal entry points. In the meantime, due to the unclear situation, I recommend staying out of the market for USD/JPY. Have a nice day! The material has been provided by InstaForex Company - www.instaforex.com |
| Overview and forecast for EUR/USD on February 25, 2020 Posted: 25 Feb 2020 07:13 AM PST Hello, colleagues! Although yesterday was not full of important macroeconomic reports, some data was released. First of all, these are IFO indices for Germany. All three IFO indices came out in the green zone. I believe that investors were particularly pleased with the improvement in business sentiment in the largest European economy. The US yesterday received data only on the index of economic activity from the Federal Reserve of Chicago, which also turned out to be better than expected. Did yesterday's statistics influence the growth of the main currency pair? Possible. Nevertheless, I believe that technical factors had a greater impact on the course of Monday's trading. Now about the coronavirus. If earlier the author assumed that the situation with the epidemic supports the US dollar, then yesterday's auction refuted this assumption. In Italy, especially in its Northern part, the coronavirus is rapidly spreading - the number of infected and dead is growing. People are panicking, everything is being swept off the shelves in stores and supermarkets, even drinking water. In particular, this situation is observed in Milan. However, this did not prevent the single European currency from strengthening against the US dollar in yesterday's trading. At the time of writing this article, data on the GDP of Germany was released. In the largest European economy, quarterly growth was the expected 0%, but the annual figure was worse: the forecast is 0.4%, the actual value is 0.3%. However, the single European currency in most cases remains cold to its own statistics, which can not be said about macroeconomic reports from the United States, especially important and significant for the market. Since the topic of American statistics is touched upon, the housing price index will be released today at 15:00 (London time), and the consumer confidence indicator will be published at 16:00 (London time). At the same time, I would like to note that the second report is more significant. Now let's go to the price charts. Daily
As expected yesterday, the closing of trading above the Tenkan line of the Ichimoku indicator will open the way to further prices. Although there is no need to hurry yet. In my opinion, only a return above the broken support level of 1.0879 will signal a false breakdown and send the pair to the strong price zone of 1.0900-1.0920. The Kijun line, which runs at 1.0947, will be a further benchmark for players to increase the rate. It makes no sense to talk about longer-term growth goals in the current situation. Euro bulls first need to return trades above 1.0879. An alternative bearish scenario will have chances to be implemented if a black candle is formed with the closing price below yesterday's lows of 1.0805. Judging by market sentiment and the technical picture on the daily chart, the ascending scenario looks more priority for the euro/dollar pair. Now let's move on to smaller time intervals. H4
The assumption about the importance of the breakdown of 1.0879 is also confirmed on this chart. A new exponential moving average has literally fallen on the broken support level, and there is no doubt that this moving average will provide additional resistance to growth attempts. Judging by the technical picture at the 4-hour chart, I can offer two options for purchases. First, after the decline to the area of 1.0828, where the 50 MA passed up is located. The second option provides for a breakdown of 1.0879 and 89 EMA, a consolidation above and a pullback, after which we open long positions on EUR/USD. H1
On the hourly chart, I built a "young" ascending channel with the parameters: 1.0777-1.0782 (support line) and 1.0871 (resistance line). Here, the options for opening positions are as follows. Purchases: when decreasing to the middle line of the channel - 50 MA and 89 EMA. This is the area of 1.0840-1.0830. Further purchases should be considered if the pair falls to the lower border of the channel, where the horizontal level of 1.0805 also passes. Sales: quite a curious situation. The fact is that the channel's resistance line runs in close proximity to the already mentioned level of 1.0879. If a candle or a combination of candles appears near the upper border of the channel indicating a decline, you can try opening short positions with the nearest targets in the area of 1.0825-1.0805. Good luck! The material has been provided by InstaForex Company - www.instaforex.com |
| Posted: 25 Feb 2020 07:13 AM PST The panic over the spread of coronavirus around the world was the catalyst for a sell-off in the stock and commodity markets. The main US stock indices dropped by more than 3%, the S&P 500 lost about $1 trillion in capitalization, the volatility of black gold increased, and prices returned to the area of minimum marks since December 2018. For the first time in almost a decade, global oil demand may decline, which allows the "bears" on Brent and WTI to keep the market under their total control. The dynamics of the volatility of oil
Cases of mass infection in Italy, South Korea and Iran suggested that the epidemic could become a pandemic, the spread of which would weigh heavily on the shoulders of the global economy. Currently, 10 times more people are infected than in 2003, and the quarantine in areas of Italy such as Lombardy and Veneto will affect the entire country. They account for about 25% of the consumption of all petroleum products and 30% of GDP. As a result, Rome may face a recession, because gross domestic product decreased by 0.3% q/q in the fourth quarter. According to the estimates of the largest oil trader Vitol, due to the coronavirus, the demand for oil in China decreased by 4 million b/d in February, which is equivalent to 4% of the world's consumption of black gold. At the end of the first quarter, we can talk about 200 million barrels. In addition, due to the abnormally warm winter in Europe (the temperature is 3.1 degrees Celsius above average), the demand for fuel is reduced, which deducts about 700 thousand b/d from the total oil consumption. Vitol predicts that the victory over coronavirus will allow global oil demand to recover in the second quarter, but so far the situation for the "bulls" on Brent and WTI looks deplorable. The dynamics of global oil consumption
It is obvious that the current cuts in OPEC+ production volumes are not able to compensate for the drop in global demand. The cartel and other countries will discuss additional cuts for 600,000 b/d in early March, but it is already clear that Russia is not eager to provide additional preferences to American producers. The Russian budget is able to withstand oil at $40 per barrel, and the reduction in production is a voluntary loss of its market share. As a result, the alliance of Saudi Arabia and Russia risks breaking up for some time. Riyadh is considering this option as a plan B and is actively pushing Kuwait and the UAE to jointly reduce production by 300 thousand b/d. Thus, the oil market operates in the "we will live badly, but not for long" mode. The recovery in global demand in April-June may push the price of black gold significantly higher. It remains to determine where the bottom is for Brent and WTI. Technically, the daily chart of the North sea variety shows the transformation of the "Shark" pattern to 5-0. The rebound from the 38.2% Fibonacci resistance from the CD wave allowed short positions to be formed. If the February minimum is updated, the AB=CD model will be activated with a 200% target. Brent, the daily chart
|
| Analysis of EUR/USD and GBP/USD on February 25. German GDP did not cause any market reaction Posted: 25 Feb 2020 07:13 AM PST EUR/USD On February 24, the EUR/USD pair gained about 35 basis points and continued to move away from the previously reached lows. Thus, the assumed wave 3 or C has completed its construction with a high probability. If this is true, then at least one upward wave will be built now, possibly 4. Or a set of waves as part of a new upward trend. There are no signs of resuming the construction of the descending section yet. Fundamental component: There was no news background for the EUR/USD instrument on February 24. Several reports from Germany and the United States that have absolutely no significance for the currency market did not have any impact on the dynamics of the instrument. Nevertheless, the markets, according to the current wave markup, continued to buy the euro at a certain point on Monday. Thus, the news background was not the reason for the increase in the instrument's quotes. Approximately the same pattern will be observed today, on Tuesday. Apart from the German GDP report that has already been released, I have nothing to draw your attention to. Gross Domestic Product in the fourth quarter showed a result of + 0.4% y/y and 0% q/q. These are the numbers that the markets were waiting for, so no special changes occurred after the release of this report. Also, the size of GDP without taking into account seasonal fluctuations became known, but there were also no surprises. Market expectations of 0.3% m/m and an actual value of 0.3% y/y. Thus, the lack of news background does not contribute to the construction of impulse waves, therefore, you need to wait for more important information to make the markets move more quickly. Until then, I expect to continue building the correction wave. General conclusions and recommendations: The euro/dollar pair have presumably completed the construction of a descending set of waves. Based on the current wave markup, I recommend waiting for a successful attempt to break the 127.2% Fibonacci level for new sales with targets located near the mark of 1.0699, which corresponds to 161.8% Fibonacci. I do not recommend buying the tool now since it is not clear whether another descending wave 5 will be built. GBP/USD The GBP/USD pair lost about 20 basis points on February 24 and is still in the process of building a corrective wave 3 in 3 or C. If this is true, then the decline in quotes will resume in the near future. At the same time, a further increase in the tool will not only complicate the wave 3 in 3 or C but also require adjustments and additions to the entire wave markup. However, now the main option is to lower the quotes according to the current wave markup. Fundamental component: The news background for the GBP/USD instrument was also absent on Monday. The British pound continues to wait for news on Boris Johnson's trade negotiations with the European Union and America. The results of these negotiations will determine the dynamics of the instrument not only in the coming weeks but also throughout 2020. Let me remind you that it is at the end of this year that the final break between the EU and the UK will take place, and whether a trade deal is concluded will depend on the economic state of the UK in the coming years. So far, all that is known is that Boris Johnson and Michel Barnier insist on completely different terms of the agreement. However, I would like to remind you that only preliminary negotiations are currently taking place, and official ones will begin only in March. Thus, information on this topic should be expected as early as next month. General conclusions and recommendations: The pound/dollar instrument continues to build a downward wave 3 or C. Thus, I recommend selling the instrument with targets located near the mark of 1.2767, which corresponds to 50.0% of Fibonacci, on the new MACD signal "down", which will signal the completion of the construction of a corrective upward wave. The material has been provided by InstaForex Company - www.instaforex.com |
| Posted: 25 Feb 2020 06:54 AM PST To open long positions on GBPUSD, you need: In my morning forecast, I paid attention to the formation of a false breakdown in the resistance area of 1.2930 and purchases from this level. The pound has updated the local maximum, which maintains an upward trend. At the moment, the bulls need to return and consolidate above the resistance of 1.2970, which can happen if there is weak data on the consumer confidence indicator in the US. Only after that, you can expect to update the larger highs in the area of 1.3006 and 1.3036, where I recommend taking the profits. If the pressure on the pair returns in the second half of the day, it is best to return to long positions only after a repeated test of the minimum of 1.2930, provided a false breakdown or buy immediately for a rebound from the minimum of 1.2889. To open short positions on GBPUSD, you need: Sellers became more active at new weekly highs, however, the downward correction can be attributed to profit-taking on long positions. At the moment, only a false break in the area of 1.2970 with good fundamental statistics on consumer confidence in the US will be the first signal to open short positions in the expectation of a return to the support of 1.2930. However, even a break in this area and a test of the minimum of 1.2889, where I recommend fixing the profits, will not lead to a reversal of the current upward trend. If buyers achieve a return in the second half of the day to the resistance level of 1.2970, then it is best to postpone short positions on the pound until the test of the maximum of 1.3006 or sell immediately for a rebound from the area of 1.3036. Signals of indicators: Moving averages Trading is conducted above the 30 and 50 daily averages, which indicates a continuation of the upward trend. Bollinger Bands The pound bounced off the upper border of the indicator at 1.2985, a repeated test of which will resume the upward trend. In the case of a decline in the pound, support will be provided by the average border of the indicator in the area of 1.2945.
Description of indicators
|
| You are subscribed to email updates from Forex analysis review. To stop receiving these emails, you may unsubscribe now. | Email delivery powered by Google |
| Google, 1600 Amphitheatre Parkway, Mountain View, CA 94043, United States | |

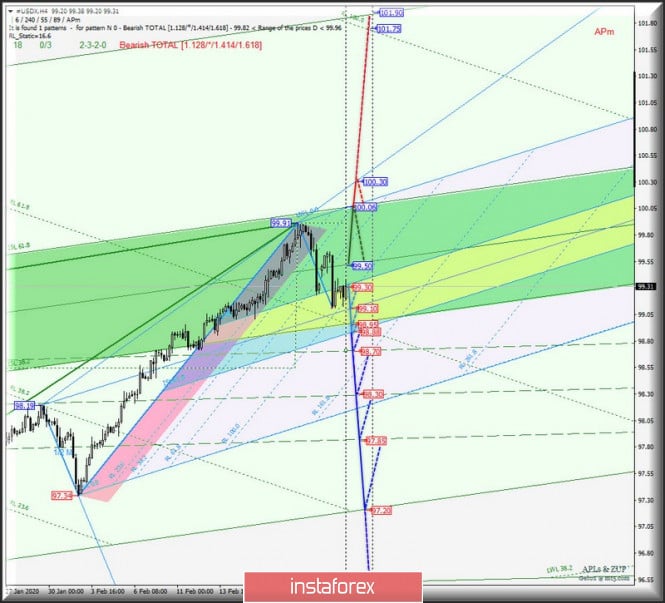
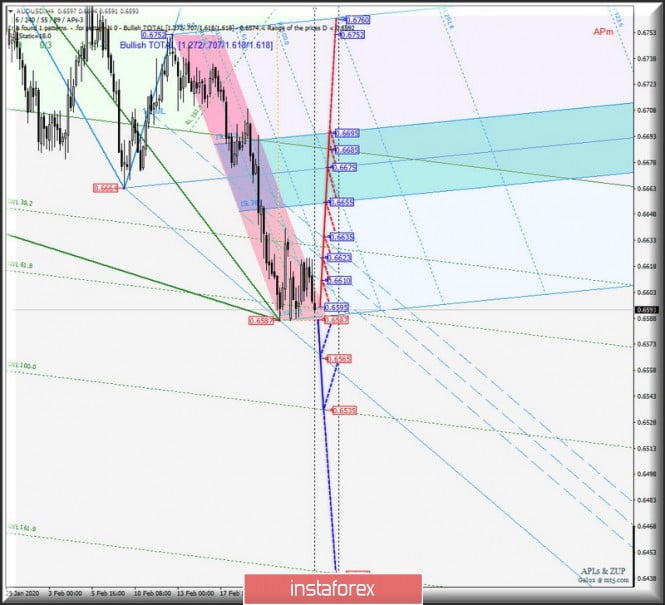
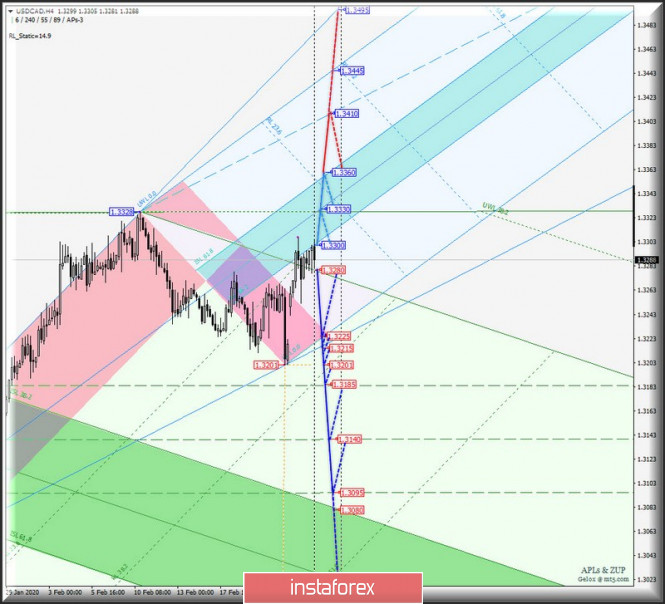
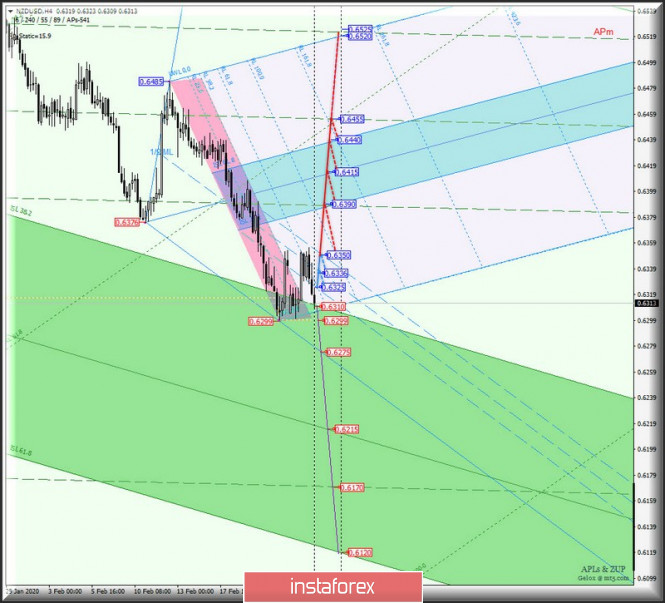

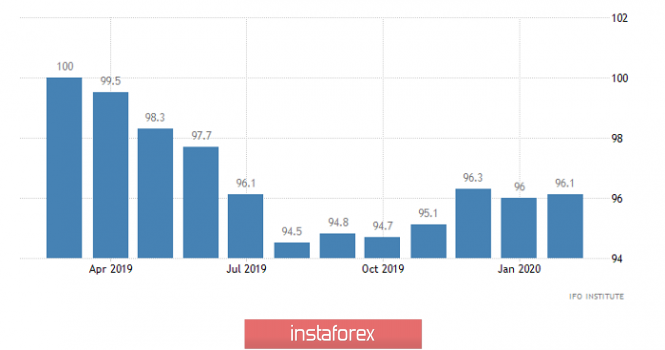


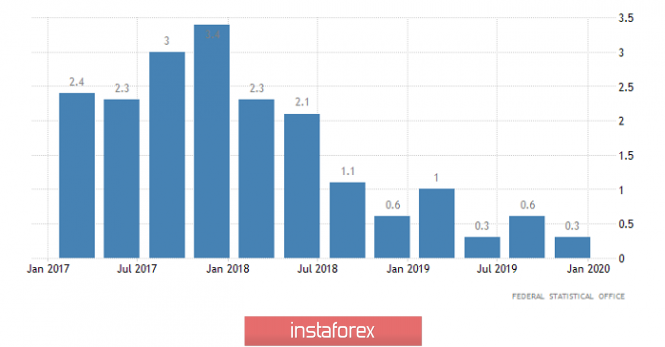
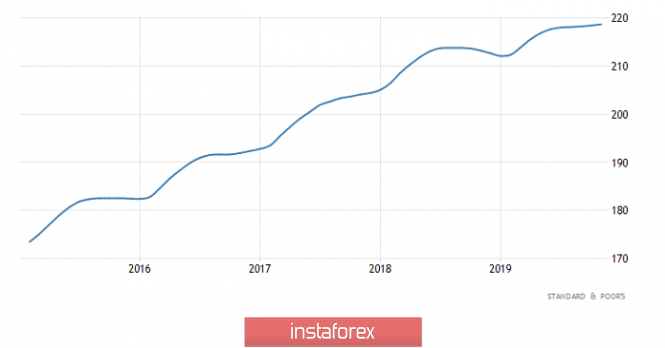
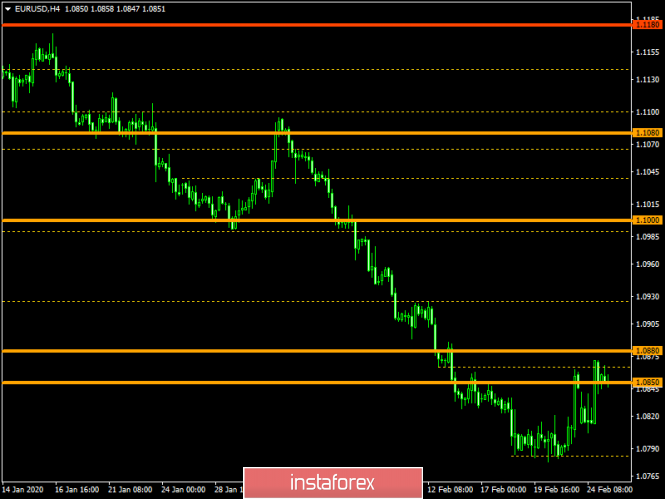
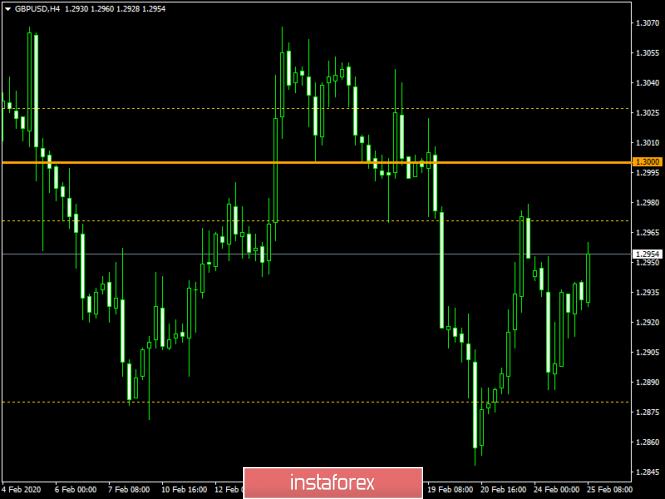

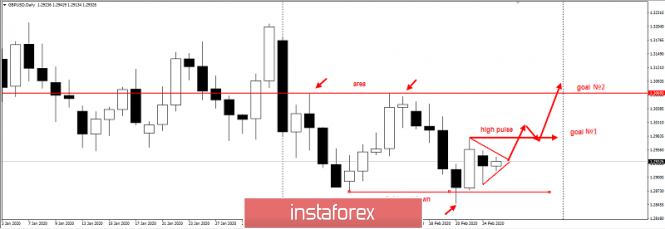
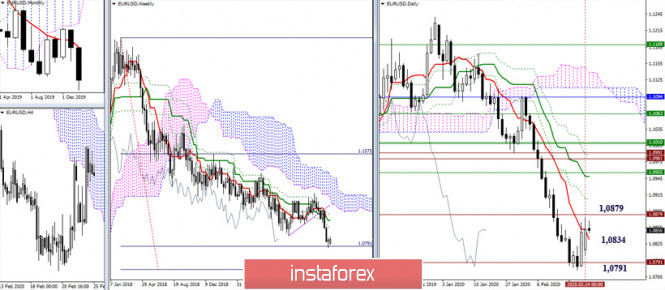
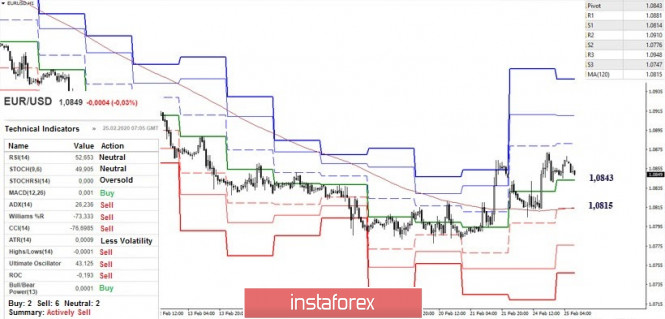
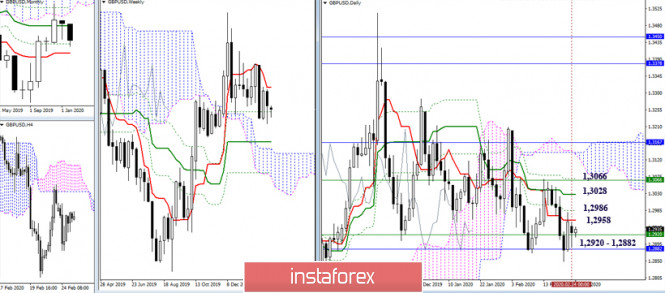
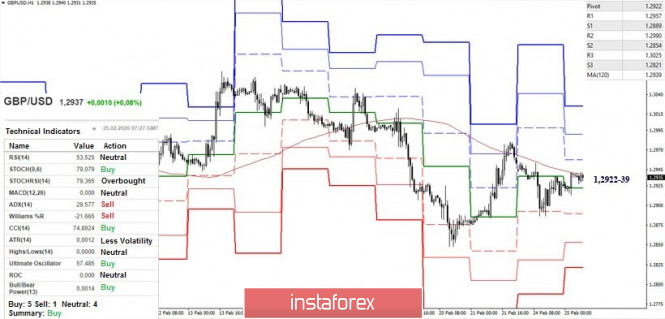


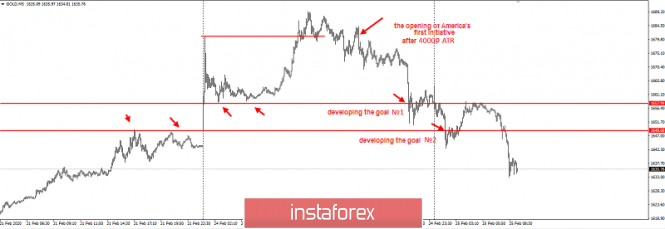
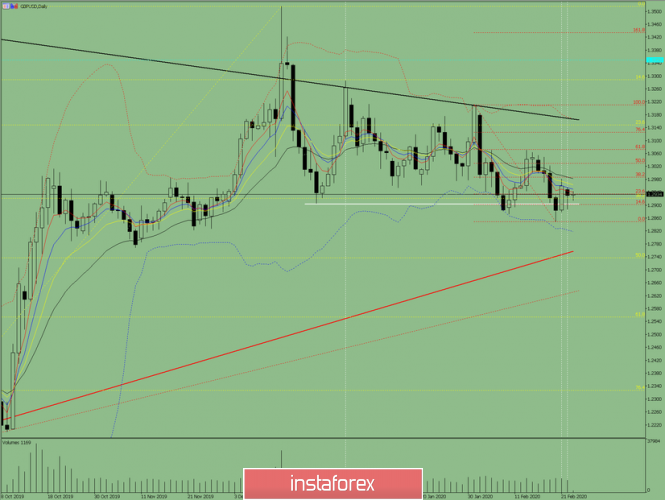
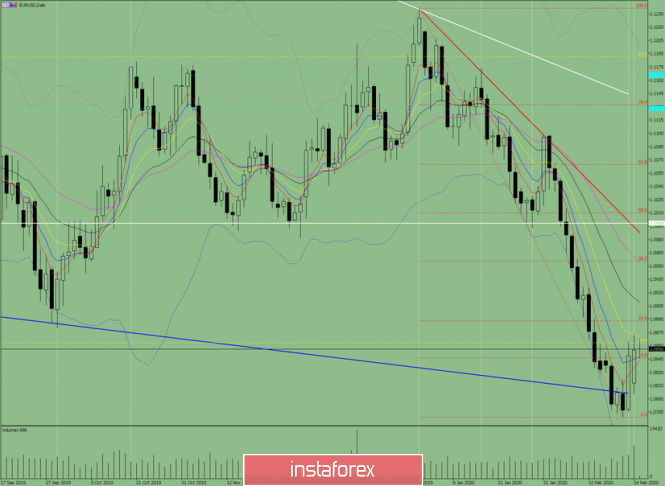
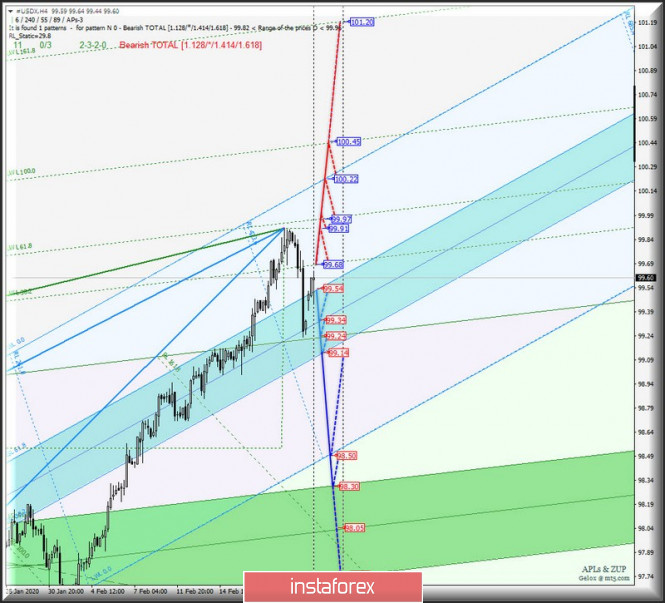
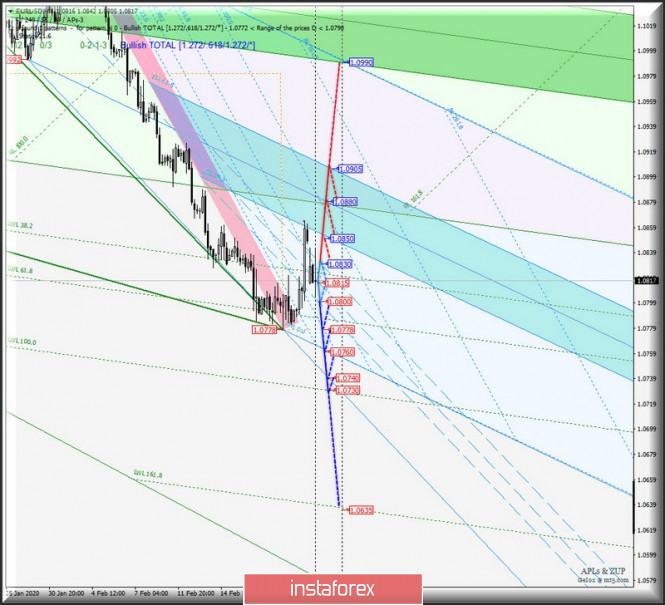
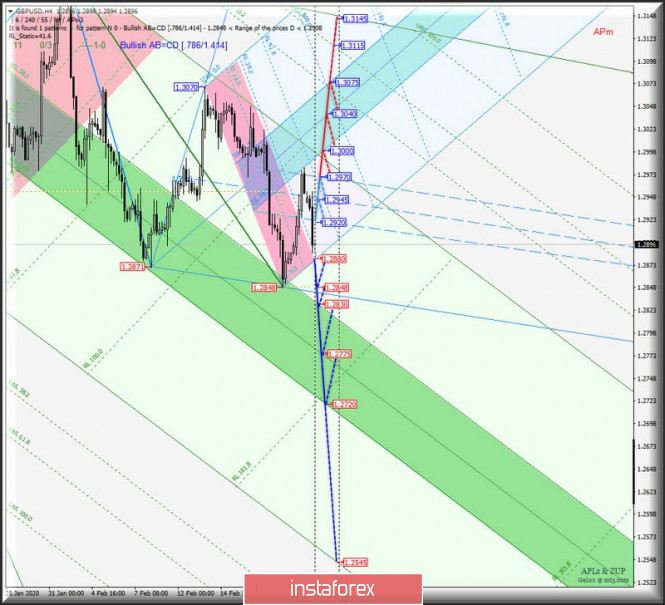
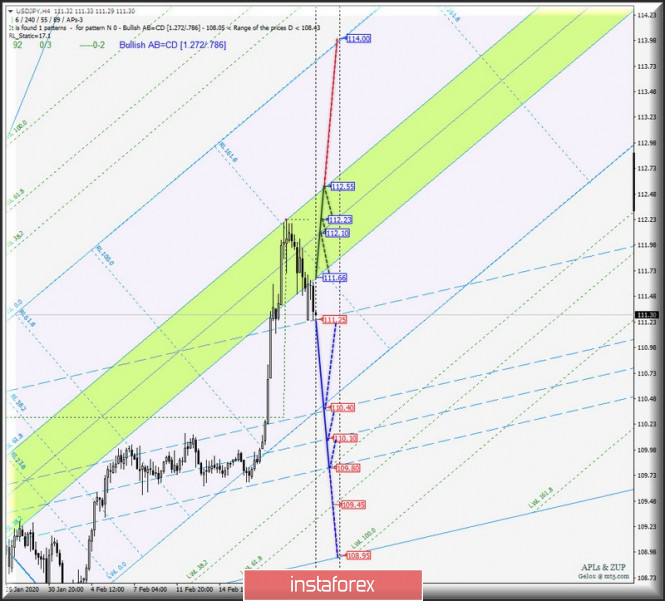


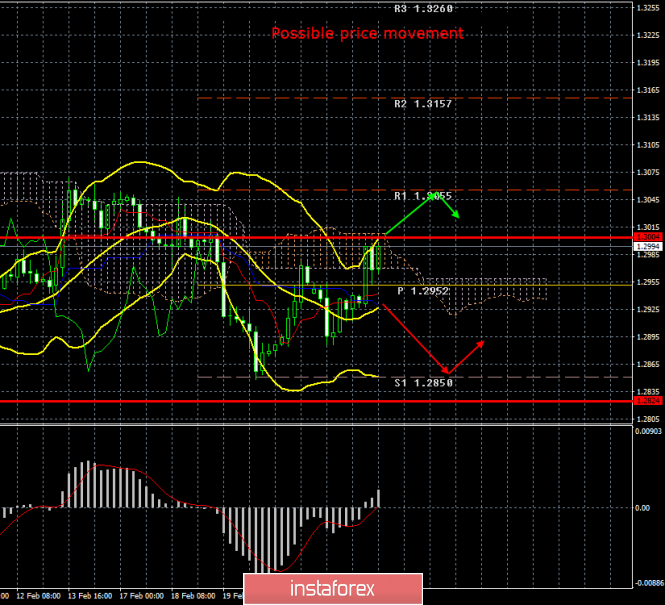
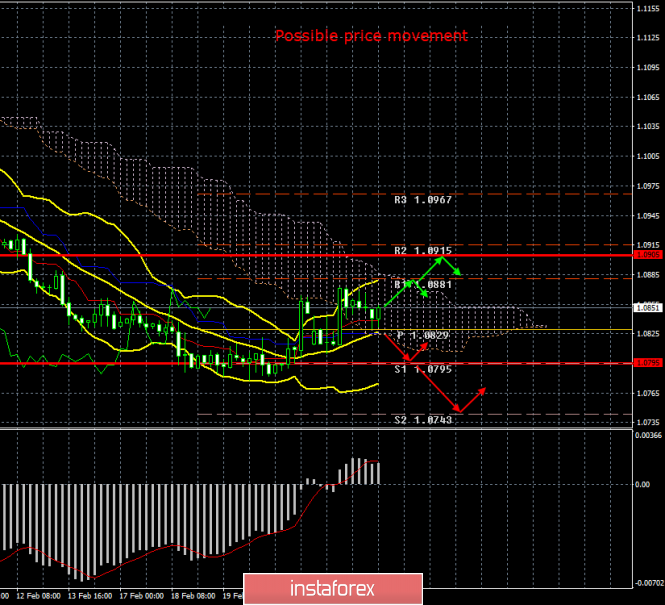
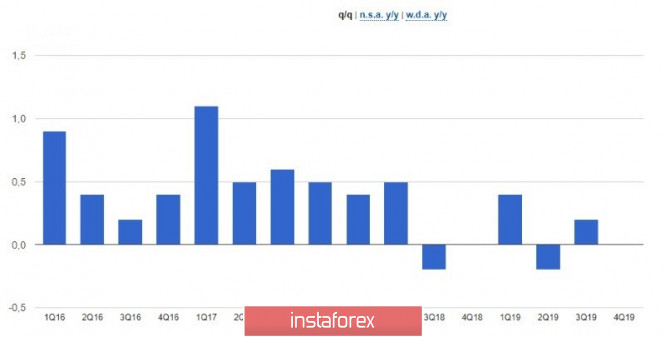

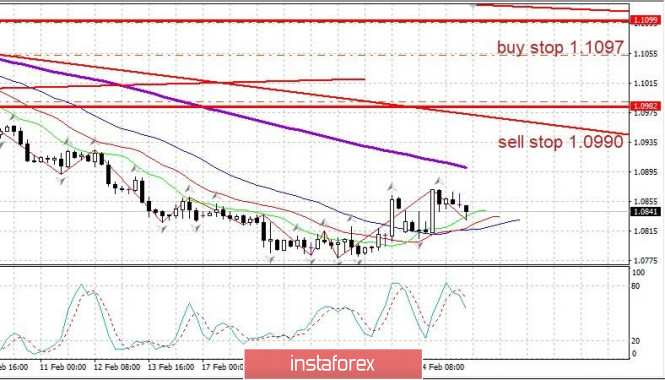
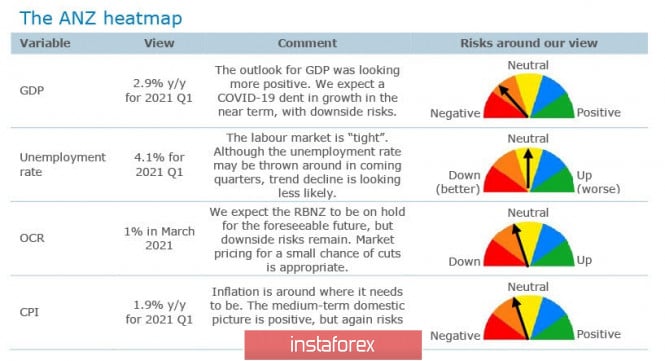
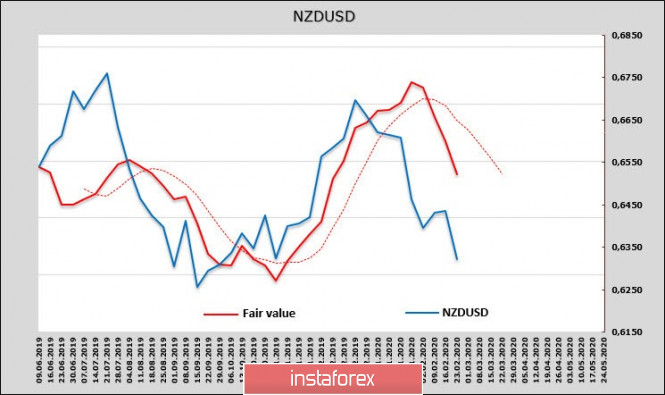
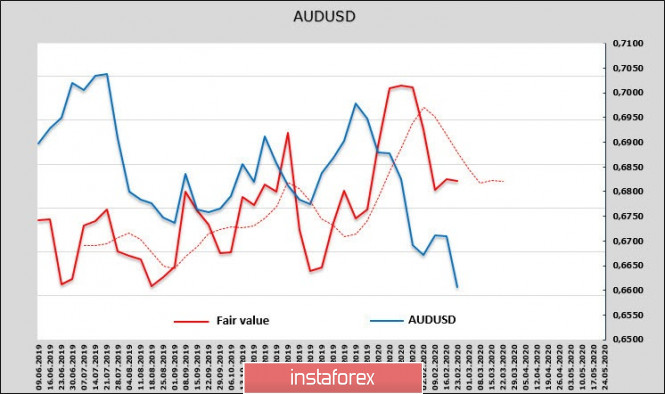
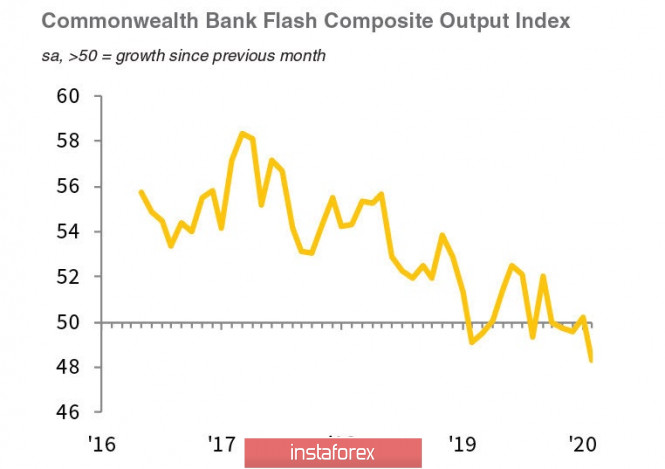


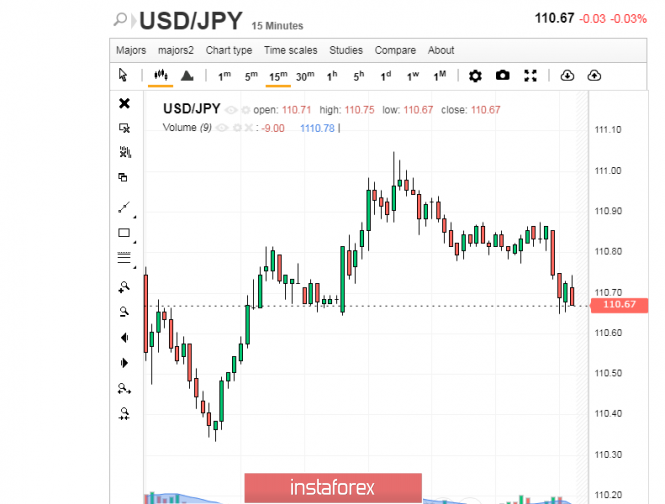
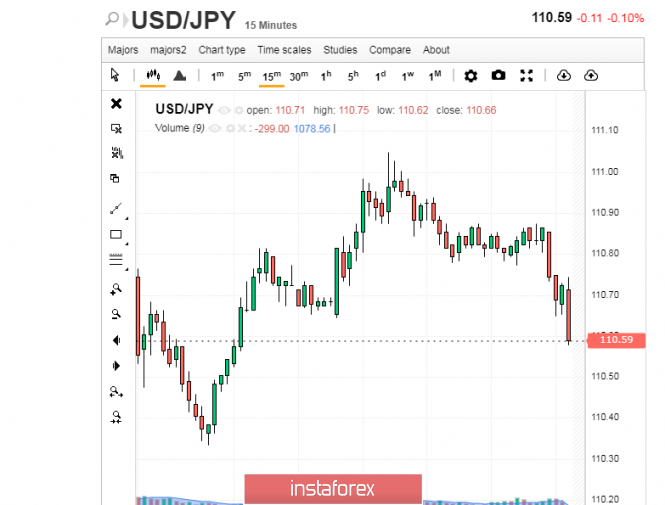

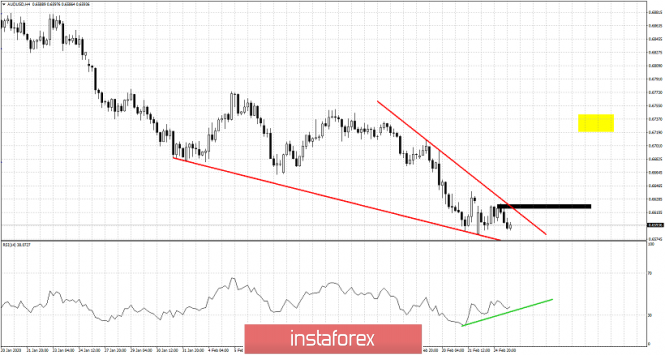
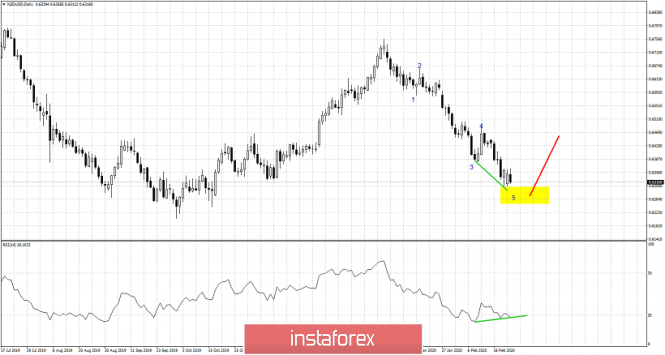
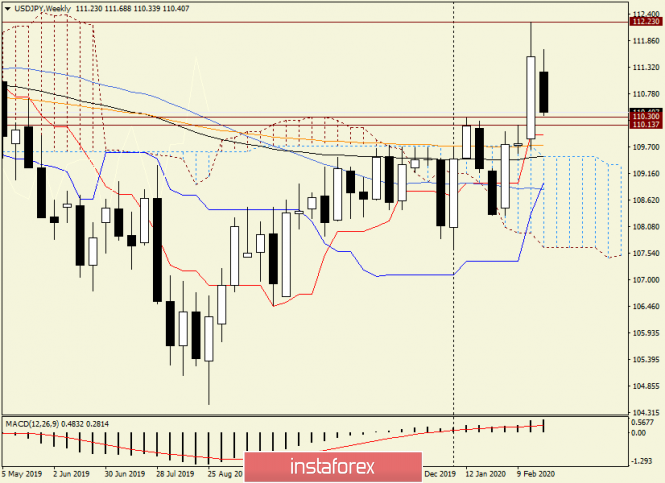
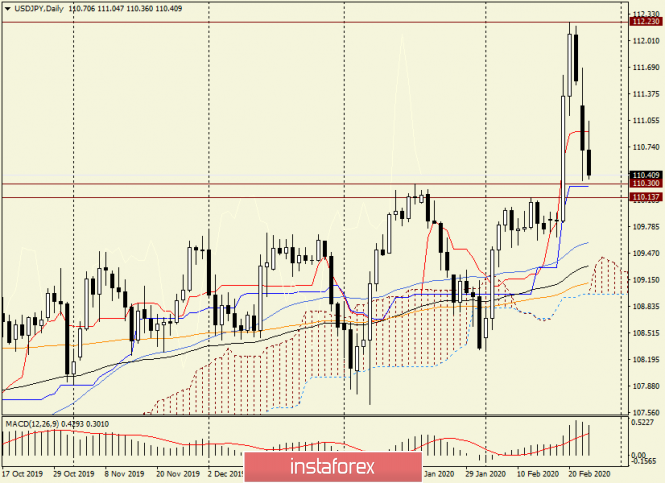
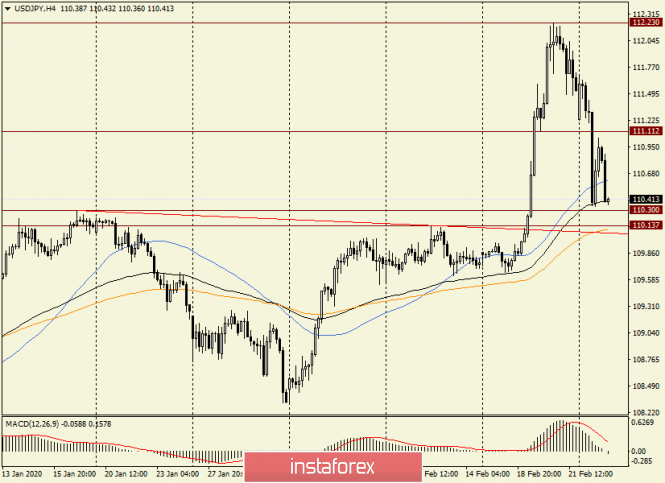
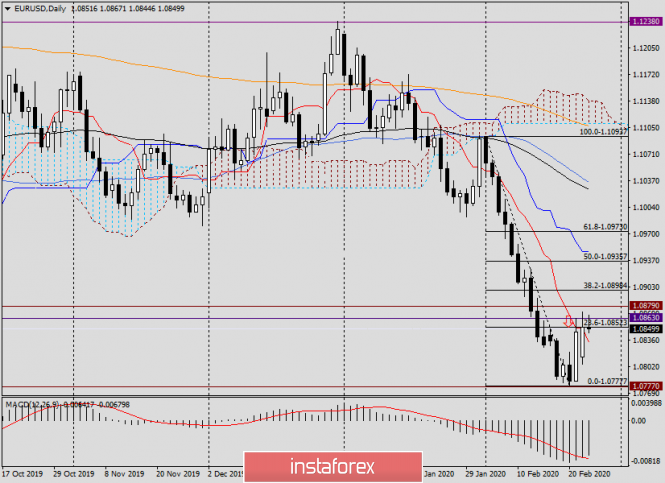
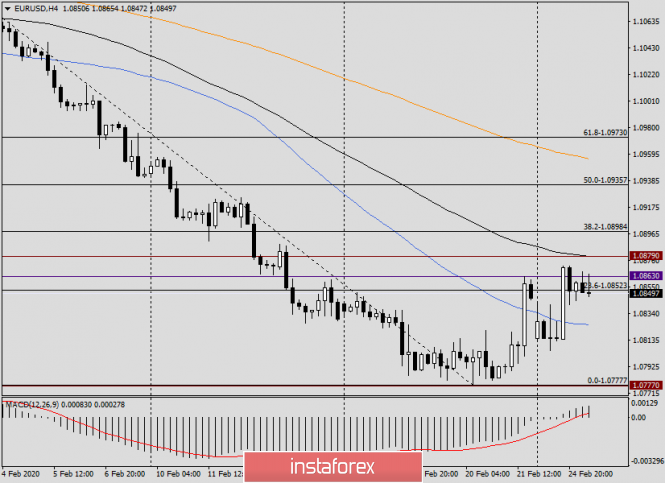
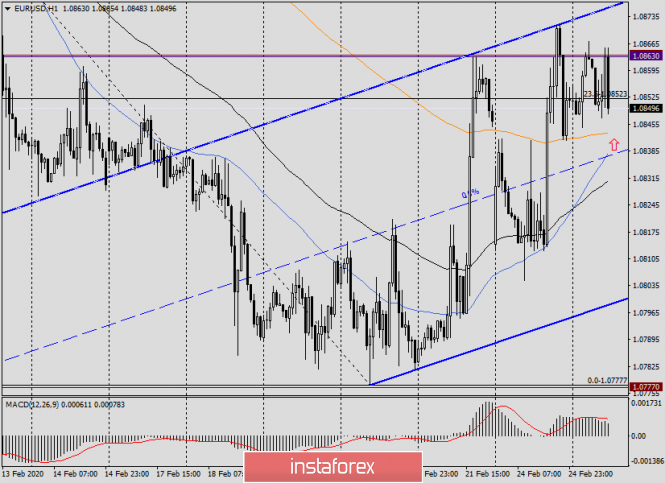
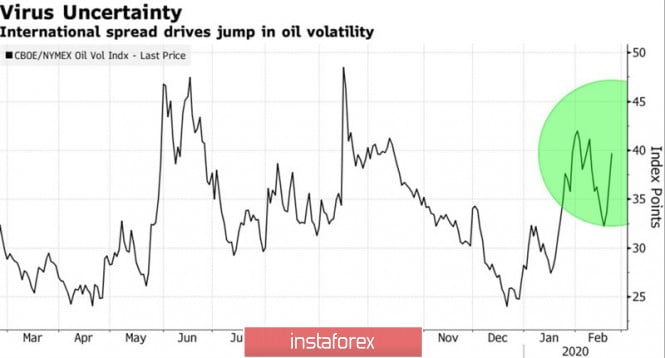
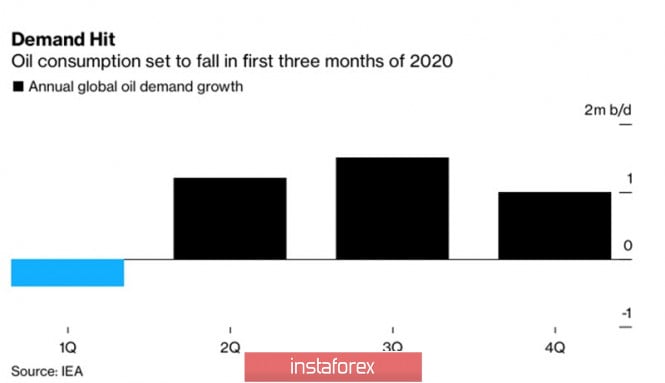
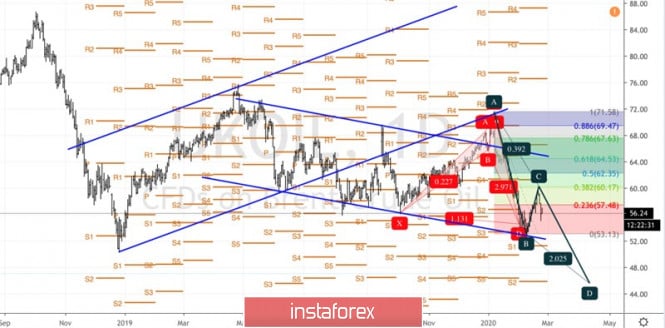
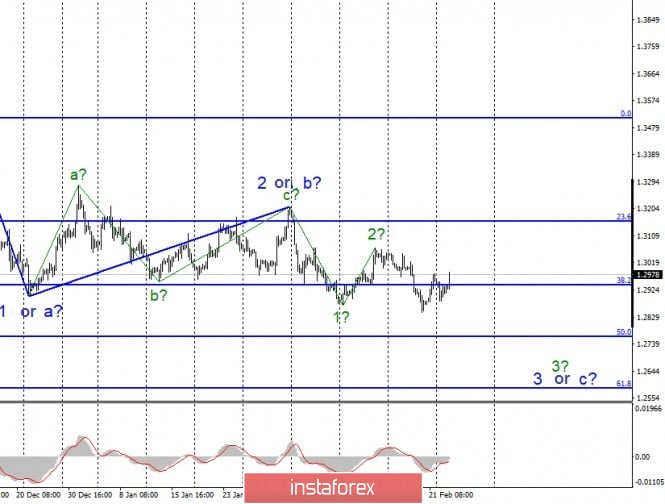
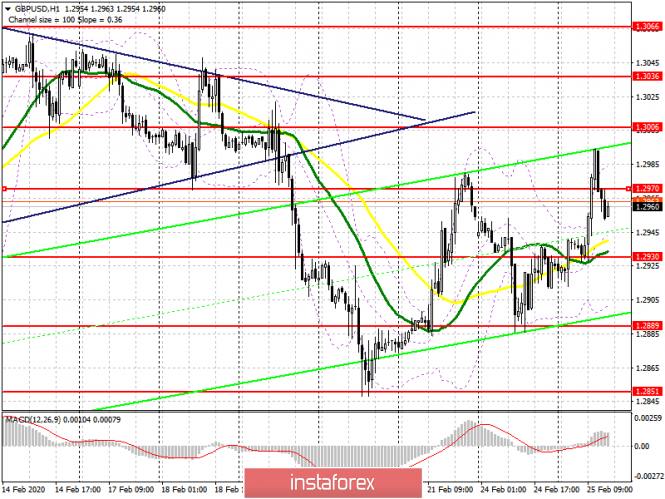
No comments:
Post a Comment