
Forex analysis review |
- February 28, 2020 : GBP/USD Intraday technical analysis and trade recommendations.
- February 28, 2020 : EUR/USD Intraday technical analysis and trade recommendations.
- EURUSD: the growth of the euro ended with a hit to the level of 1.1050. Inflationary pressures in the eurozone remain weak
- Outlook for EUR/USD on February 28, 2020: EUR trading in tight range
- Trading plan for WTI Crude for February 28, 2020
- BTC analysis for 02.28.2020 - Broken bear flag and strong downside momentum on the market, watch for the bigger drop towards
- The dollar returned to the red line
- Trading plan for Gold for February 28, 2020
- GBP/USD 02.28.2020 - Major multi pivot suport is on the test at 1.2850, potential for rally towards the 1.2938
- Gold 02.28.2020 - The drop started as I expected, potential for test of $1.612 and $1.595
- GBP/USD: plan for the US session on February 28. Buyers of the pound made an unsuccessful attempt to return the resistance
- Trading plan for NZDUSD for February 28, 2020
- Trading plan for AUD/USD for February 28, 2020
- Trading plan for USD/CHF for February 28, 2020
- Analysis and trading ideas for EUR/JPY on February 28, 2020
- Trading recommendations for EUR USD pair on February 28
- Trading plan for USD/JPY for February 28, 2020
- Trading plan for GBP/USD for February 28, 2020
- Trading plan for EUR/USD for February 28, 2020
- AUD/USD further push up above support
- AUD/NZD approaching resistance, potential drop!
- CHF/JPY approaching support, potential bounce!
- Instaforex Daily Analysis - 28th Feb 2020
- Gold is looking for allies
- Technical analysis of GBP/USD for February 28, 2020
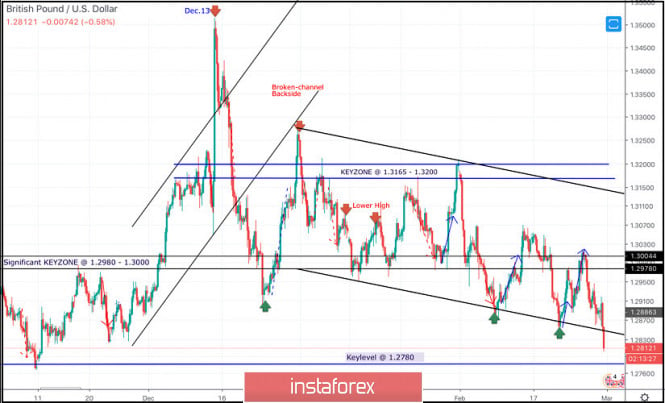
| February 28, 2020 : GBP/USD Intraday technical analysis and trade recommendations. Posted: 28 Feb 2020 08:18 AM PST
On the period between December 18th - 23rd, bearish breakout below the depicted previous bullish channel followed by quick bearish decline below 1.3000 were demonstrated on the H4 chart. However, immediate bullish recovery (around 1.2900) brought the pair back above 1.3000. Bullish breakout above 1.3000 allowed the mentioned Intraday bullish pullback to pursue towards 1.3250 (the backside of the broken channel) where the current wide-ranged movement channel was established between (1.3200-1.2980). In the meanwhile, recent bearish breakdown below 1.2980 enhanced further bearish decline towards 1.2890 (the lower limit of the movement channel) where two episodes of bullish rejection were manifested on February 10th and 20th. This was followed by the recent bullish pullback towards the price zone of 1.2980-1.3000 which has been offering bearish rejection until now. The Intermediate-term technical outlook remains bearish below the price level of 1.3000 (Supply-Zone), That's why, bearish persistence below 1.2980-1.3000 enabled the GBP/USD pair to pursue once more towards the lower limit of the channel around 1.2850 which is failing to provide enough bullish Support for the pair. The nearest DEMAND level to be watched for bullish rejection is located around 1.2780 which is probably going to be reached quite soon. On the other hand, any bullish breakout above 1.2870 hinders any further bearish consolidations and enhances the bullish side of the market towards the price levels of 1.2980-1.3000. The material has been provided by InstaForex Company - www.instaforex.com |
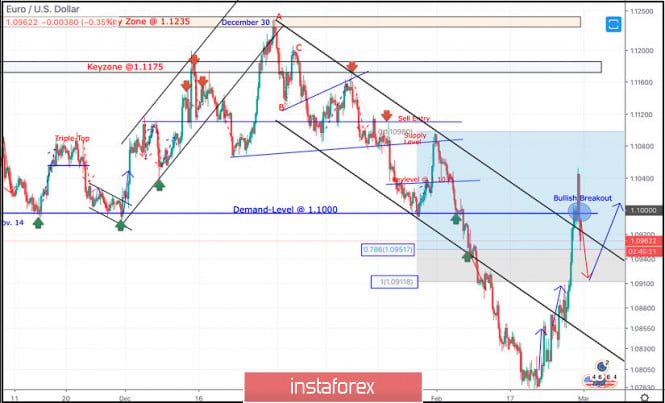
| February 28, 2020 : EUR/USD Intraday technical analysis and trade recommendations. Posted: 28 Feb 2020 07:30 AM PST
On December 30, a bearish ABC reversal pattern was initiated around 1.1235 (Previous Key-zone) just before another bearish movement could take place towards 1.1100 (In the meanwhile, the EURUSD pair was losing much of its bearish momentum). One more bullish pullback was executed towards 1.1175 where the depicted key-zone as well as the recently-broken uptrend were located. That's why, quick bearish decline was executed again towards 1.1100 then 1.1035 which failed to provide enough bullish SUPPORT for the EURUSD pair. Further bearish decline took place towards 1.1000 where the pair looked quite oversold around the lower limit of the depicted bearish channel. That's why, significant bullish rejection was able to push the pair back towards the nearest SUPPLY levels around 1.1080-1.1100 (confluence of supply levels, including the upper limit of the channel). Since then, the pair has been down-trending within the depicted bearish channel until last week when bearish decline went further below 1.0950 and 1.0910 (Fibonacci Expansion levels 78.6% and 100%) establishing a new low around 1.0790. This was where the EUR/USD pair looked oversold after such a long bearish decline. Hence, Intraday traders were advised to look for signs of bullish recovery around the price levels of (1.0790) as a valid intraday BUY signal with initial bullish targets around 1.0910 then 1.0950 (previously-broken demand-levels). By the end of Last week, recent signs of bullish recovery were manifested around 1.0790 leading to the current bullish movement towards 1.0910, 1.0950 and 1.1000. The price level of (1.1000) constitutes a major SUPPLY level in confluence with the upper limit of the current movement channel. That's why, bearish rejection and a short-term bearish pullback should be expected towards 1.0950 and 1.0910 where another bullish swing can be initiated. On the other hand, bearish persistence below 1.0910 enables further bearish decline towards 1.0850 and 1.0830. The material has been provided by InstaForex Company - www.instaforex.com |
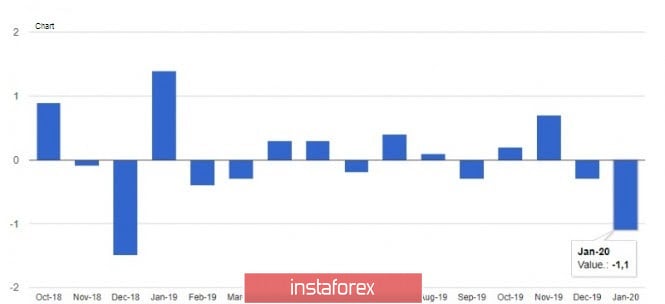
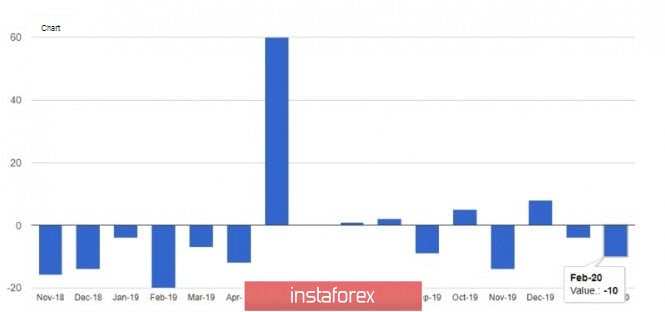
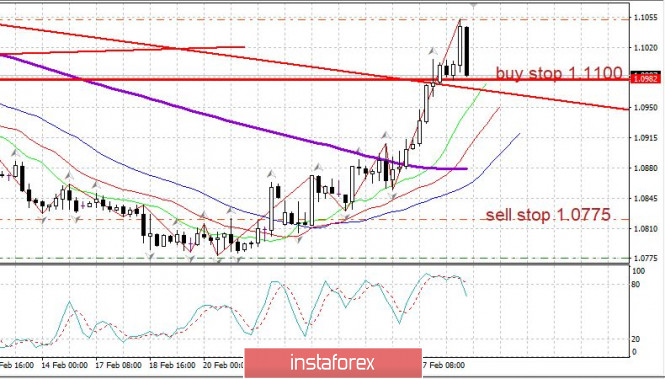
| Posted: 28 Feb 2020 05:29 AM PST The euro rose to the level of 1.1050 against the US dollar amid expectations that the Federal Reserve will be forced to resort to lowering interest rates in the spring of this year after a sharp drop in the US stock market and the spread of coronavirus on the European continent and in America. However, the fundamental statistics that have been released over the past two weeks and yesterday's data on the US economy indicate a stable situation and a slight impact of the coronavirus on GDP growth. There were no hints of such a scenario in statements made this week by representatives of the US Central Bank. However, more specific comments are now required from the Fed's management. The further direction of risk assets, especially the European currency, will depend on the reaction of the Committee. Yesterday's speech by the President of the Federal Reserve Bank of Chicago, Charles Evans, did not shed any light on the situation with rates. Evans repeated the words of his colleagues that the US Central Bank is closely monitoring the consequences of the spread of the coronavirus, but it is still very early to talk about changes in monetary policy. Meanwhile, data on inflation in France indicate that problems remain in the economy. According to the report, the preliminary consumer price index (CPI) of France in February this year fell by 0.1% compared to January and increased by only 1.4% compared to the same year. Economists had forecast that the index for February would remain unchanged and grow by 1.4% year-on-year. As for the EU-harmonized index, it added 1.6% per annum in February after 1.7% in January. A reduction in consumer spending in the eurozone's second-largest economy is also a bad signal for investors. The report indicated that consumers were reducing their spending and there was a drop of 1.1% at once in January. Compared to January 2019, expenses decreased by 0.9%. Economists had forecast a rate of 0.2% and 0.6%, respectively. Data for the 4th quarter on GDP growth only confirmed the concerns. The Italian economy declined by 0.1% compared to the 3rd quarter of 2019 and grew by only 0.8% per annum. In Italy, where the coronavirus is raging, the situation with inflation is not much better. According to the data, the preliminary consumer price index in February rose by 0.5% compared to January, however, the annual growth was only 0.4%, which is very far from the target value of about 2.0%. Economists had forecast that inflation would remain unchanged in February. Good indicators on the state of the German labor market leave hope for economic recovery in the 1st quarter of this year. According to the report, the market has shown resilience in the face of the spreading coronavirus, and the number of applications for unemployment benefits in Germany in February 2020 fell by 10,000 after falling by 4,000 in January (revised estimate). Economists had expected a 5,000 increase in the number of unemployed in February. Unemployment remained at 5.0%. The total number of vacancies was 690,000. As for the technical picture of the EURUSD pair, the next jump of EURUSD to the resistance area of 1.1050 resulted in the closing of long positions and the return of the pair to a more neutral level of 1.0990, where trading is currently taking place. Most likely, the data on the US economy will not have a serious significance, and the month will end in the range of 1.0965-1.1015. The material has been provided by InstaForex Company - www.instaforex.com |
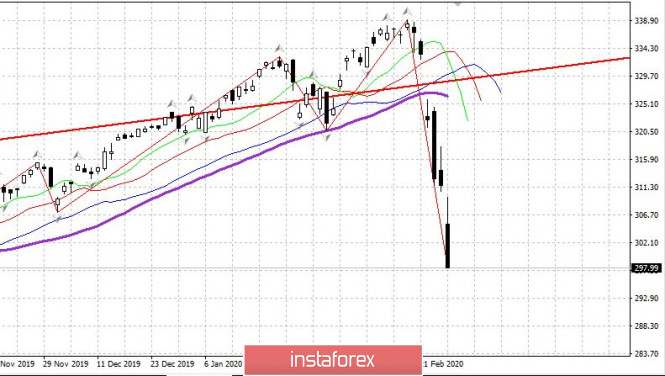
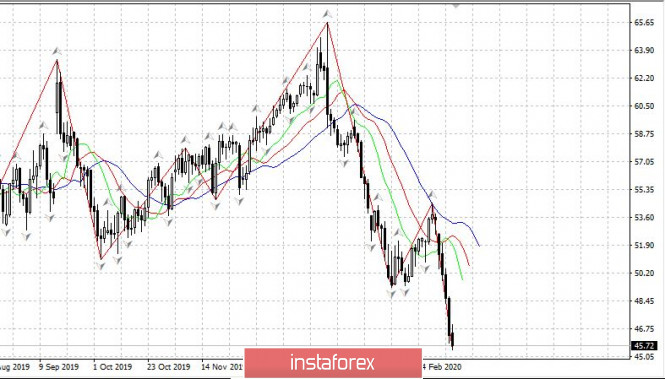
| Outlook for EUR/USD on February 28, 2020: EUR trading in tight range Posted: 28 Feb 2020 05:26 AM PST Here is what I wrote about in my previous reviews: The American stock market has been falling throught the week. In total, in plunged by 13% on major indexes. Probably, a slight rebound can occur on Firday. As seen on the daily chart above, oil prices also took a nosedive. There is one reason behind these falls - it is the coronavirus epidemic that is spreading across the world rapidly. So far, 2,000 people have been infected in South Korea, and there are 650 cases in Italy. The Russian ruble plunged against the US dollar and the euro (see the daily chart below): The markets are on verge of a panic. The news about the epidemic is of the major importance while other reports and statistics took a back seat. EURUSD: euro enters the range The upper boundary is still at 1.1100 However, if the price is unable to break the current high at 1.1055 until Monday, this level may serve as a good entry point for opening buy deals. As for me, I prefer to wait for the updates on the virus on Monday morning. The material has been provided by InstaForex Company - www.instaforex.com |
| Trading plan for WTI Crude for February 28, 2020 Posted: 28 Feb 2020 04:59 AM PST
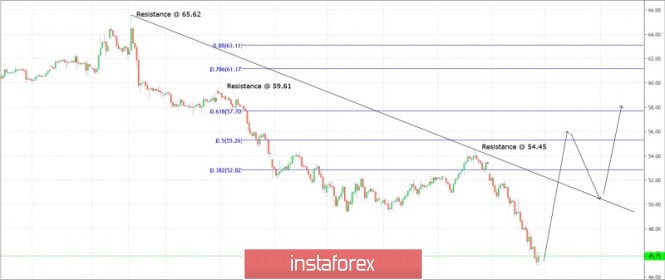
Technical outlook: WTI Crude dropped from the 65.62 level forming a sequence of lower highs and lower lows as it is shown on the 4H chart. It seems that the drop is completed with a major boundary to be worked upon. We have presented the retracement levels here for the next level to go short again. Traders who have already opened short positions, can decide to take profits and get ready for a pullback rally. Please note that the Fibonacci 0.618 retracement is around the 57.70/58.00 levels. A counter trend rally can reach these levels before turning lower again. It is too early to confirm that the counter trend rally has resumed but one should remain cautious and avoid opening fresh short positions. Aggressive traders might want to initiate risk positions on the long side with a stop just below 44.00 and the upside target towards 52.00. Trading plan: Aggressive traders can open long postions below 44.00 with target at 52.00. Good luck! The material has been provided by InstaForex Company - www.instaforex.com |
| Posted: 28 Feb 2020 04:57 AM PST Industry news:
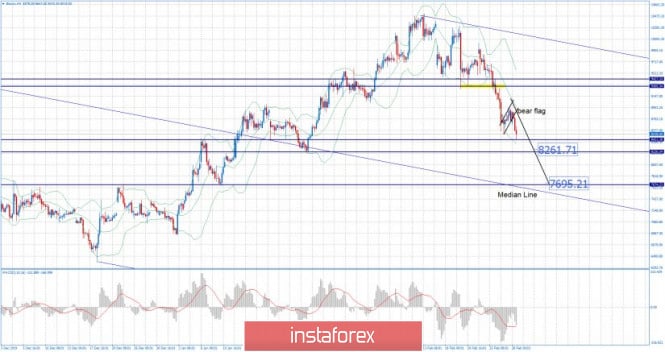
Two of the largest cryptocurrency trading venues are experiencing issues. Friday saw both OKEx and Bitfinex take unexpected downtime following what are suspected to be DDoS attacks. Whilst there is no evidence to actually confirm it, the fact that the two attacks occurred in a matter of hours suggests they are related. The CEO of OKEx is now offering to double the pay of anyone behind the DDoS attacks that is willing to provide information to the exchange. Technical analysis: BTC has been trading downwards as I expected. BTC did hit our first downward target from yesterday at the price of $8.421. Anyway, I still expect more downside and potential testing of $8.261 and $7.695. The most recent drop did start after the BTC breakdown of the bear flag that we mentioned yesterday. Watch for selling opportunities on the rallies using the intraday frames like 15/30 minutes... MACD oscillator is showing strong momentum to the downside with the slow line turned to the bear. Support levels and downward targets are set at the price of $8.260 and $7.695 Resistance levels are set at $8.515 and $8.925. The material has been provided by InstaForex Company - www.instaforex.com |
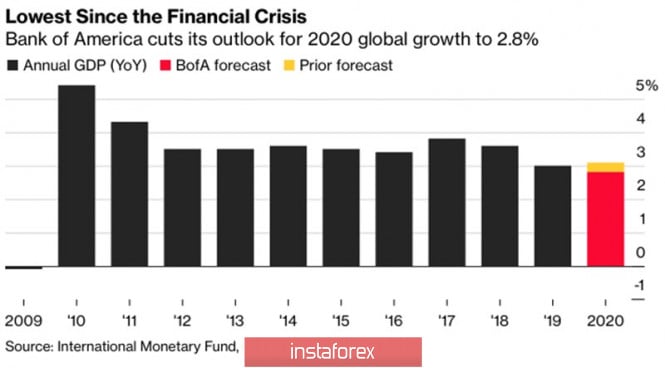
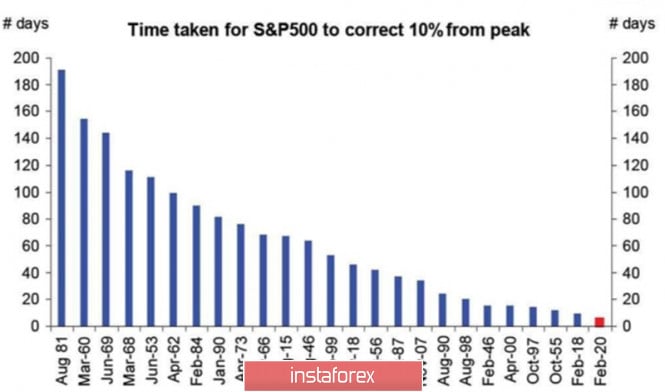
| The dollar returned to the red line Posted: 28 Feb 2020 04:40 AM PST In 2020, traders working with EUR/USD are thrown into heat and cold. The pair falls to the lowest levels since the spring of 2017 and then recoups most of the losses within a few days. Curiously, in both cases, it was not without disappointment. The collapse of the euro in the first month and a half was associated with lost illusions about its growth to $1.16 by the end of the year. The rise of the single European currency at the end of February - with the mass closing of positions on risky assets. Let's go back to the beginning of 2020. Investors are preparing for the signing of a phase 1 trade agreement between the US and China and are seriously counting on the ceasefire to help restore the European and global economies. If we add to this the potential slowdown in US GDP due to Boeing's problems, then the narrowing of divergence in economic growth in the US and the eurozone is a strong argument in favor of buying EUR/USD. Of course, this is not the end of investment ideas. Accelerating global GDP, low borrowing rates, and volatility are creating a Goldilocks regime for developing countries' monetary units. Ideal conditions for the carry trade. Players on the difference start looking for the best funding currencies. And they find them in Japan and Germany, where debt rates are negative. Until the S&P 500 rewrote historical highs, everything was going well. However, the fastest 10% correction of the stock index in history forced carry traders to sell the Mexican peso, Russian ruble, Indian rupee, and other EM monetary units and return to the euro and yen. The difference game has stopped working, especially as BofA Merrill has spooked investors by lowering global GDP forecasts to the lowest level since the global financial crisis. Dynamics of global GDP
10% correction of the US stock market
The main factors of the EUR/USD spike in January and the first half of February were the divergence in economic growth in the US and the eurozone, the inflow of foreign capital to the US equity market, the higher yield of treasuries compared to foreign counterparts, and the use of the euro as a funding currency. At the end of the winter, the S&P 500 corrections turned everything upside down. The report of the US health system about the transmission of coronavirus from person to person in the United States, control of thousands of potentially infected in California makes it doubtful that the American economy will remain resistant to the epidemic. The US stock market is facing a serious outflow of capital, funding currencies, including due to the growth of the euro volatility to annual peaks in favor, and the high rates of the US debt market play against the dollar. Investors believe that the Fed has more options to reduce the rate by 75 bps than the ECB - by 10 bps. Technically, the daily EUR/USD chart has a transformation of the "Shark" pattern to 5-0. If the "bears" manage to keep the pair's quotes below 1.1 (50% of the wave from the "Shark" model) and storm the support at 1.098, the risks of the euro falling to 1.095 and 1.0885 will increase. On the contrary, if the bulls regain control of 1.1, the road north to 1.1065 and 1.114 will be opened. EUR/USD, the daily chart
|
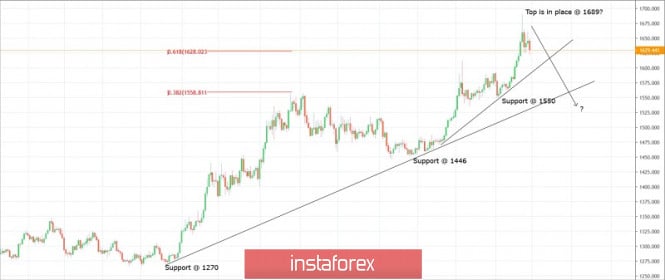
| Trading plan for Gold for February 28, 2020 Posted: 28 Feb 2020 04:36 AM PST
Technical outlook: Gold might have formed a potential meaningful top at $1,689 levels or could push higher one last time before reversing lower again. We are more confident of the fact that a top might be in place since the fibonacci extensions have been met at $1,620/30 levels as seen here. The rally that began from May 2019, might have completed at $1,689, and the yellow metal might be on its way much lower ahead. It is seen to be trading around $1,623 at this point in writing. It should come as no surprise if it breaks below $1,600 levels. Immediate support is seen at $1,550 and a break below will be a confirmation that Gold has topped out. Even at this moment, it is good to sell on rallies towards $1,665/70 levels with a protective stop above $1,689. Also note that the immediate trend support would also break if prices drop to $1,550 going forward. Aggressive traders might want to sell now or on rallies. Trading plan: Short @ 1620/25 and add more around $1660/70, stop @ $1695, target is open Good luck! The material has been provided by InstaForex Company - www.instaforex.com |
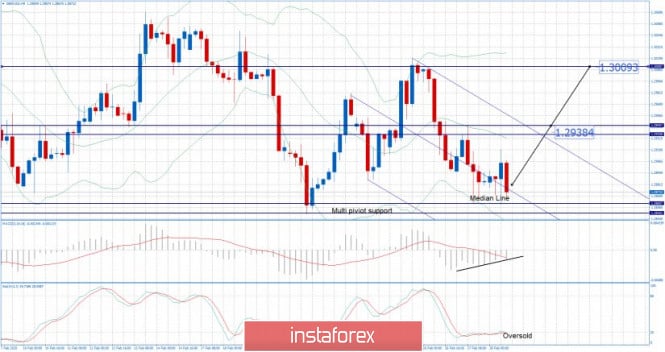
| Posted: 28 Feb 2020 04:29 AM PST Technical analysis:
GBP/USD has been trading sideways at the price of 1.2867. The GBP is near multi pivot support at the price of 1.2850. As long as this support is holding, the potential for the rally is possible towards the 1.2938 and 1.3009. GBP is making multi-pivots around the most recent Pitchfork channel, which is confirmation of the confluence and indecision. MACD oscillator is showing bullish divergence on the 4 H time-frames, which adds the potential for the rally to happen. Major support level is set at the price of 1.2850 Resistance levels and upward targets are set at the price of 1.2938 and 1.3010 The material has been provided by InstaForex Company - www.instaforex.com |
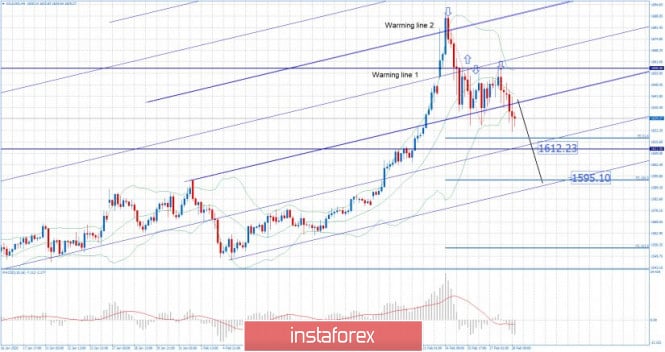
| Gold 02.28.2020 - The drop started as I expected, potential for test of $1.612 and $1.595 Posted: 28 Feb 2020 04:17 AM PST Technical analysis:
Gold has been trading downwards as I expected yesterday. The rejection of the resistance Warning line 1 was the key for the most recent drop. I found the breakout of the support at $1.624and my advice is to watch for selling opportunities and potential downside movement towards the $1.612 (Pitchfork median line) and $1.595 (Pitchfork Lower Parallel line). MACD oscillator is showing increasing downside momentum, which adds confirmation for further downside. Resistance is not previous swing low at $1.632. Support levels and downward targets are set at the price of $1.612 and $1.595The material has been provided by InstaForex Company - www.instaforex.com |
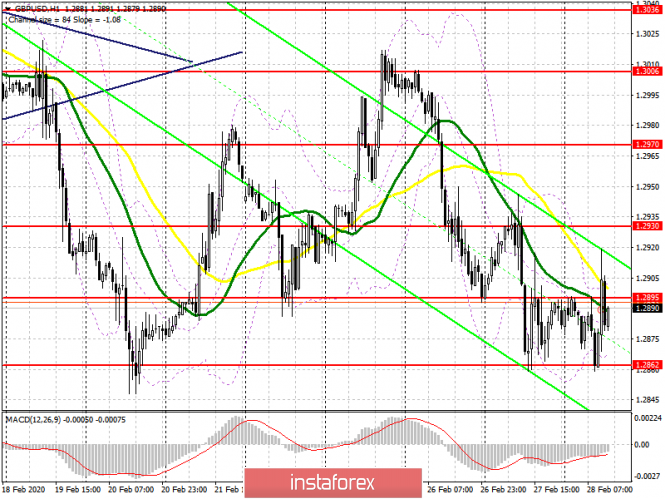
| Posted: 28 Feb 2020 04:04 AM PST To open long positions on GBPUSD, you need: In the morning forecast, I paid attention to the formation of a false breakdown in the support area of 1.2862 and purchases from this level, as well as the need to break through the resistance of 1.2895, which the bulls tried to arrange. However, it was not possible to stay above this range and the trade returned to the side channel. The goals and objectives of buyers are the same. The first is to hold the level of 1.2862. Only poor data on income and spending by Americans will lead to another false breakdown in this range, which will be a signal to buy the pound. The second no less important goal is to consolidate above the resistance of 1.2895, which will open a direct road to the highs of 1.2930 and 1.2970, where I recommend fixing the profits. In the scenario of GBP/USD falling below the level of 1.2862, the pound will resume falling. The nearest levels for the scenario of long positions will be the lows of 1.2830 and 1.2799. To open short positions on GBPUSD, you need: Sellers achieved their goal and returned the pound to the level of 1.2895, which discouraged buyers from trying to turn the market around. As long as trading is below this range, the pressure on GBP/USD will remain. Now the focus is reduced to the support of 1.2862, the breakdown of which will lead to the continuation of the downward trend in the area of the lows of 1.2830 and 1.2799, where I recommend fixing the profits. If there are no active sales in the second half of the day in the area of 1.2862, then it is best to postpone short positions until the highs of 1.2930 and 1.2970 are updated. Signals of indicators: Moving averages Trading is conducted below the 30 and 50 daily averages, which indicates a slight advantage on the part of sellers of the pound. Bollinger Bands A break in either side of the indicator's borders will determine the pair's further short-term direction.
Description of indicators
|
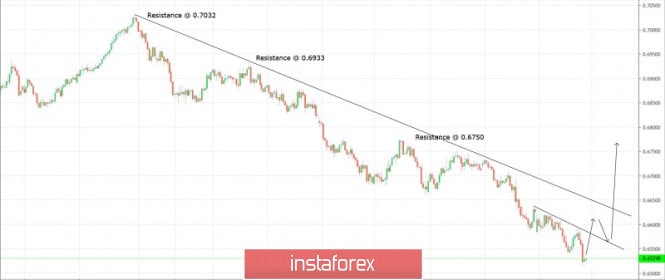
| Trading plan for NZDUSD for February 28, 2020 Posted: 28 Feb 2020 03:59 AM PST
Technical outlook: NZDUSD is seen to be dropping from 0.6750 levels as seen here. The single currency pair has been clearly trading inside the sell zone of both trend lines and we need to see a clear break above the immediate resistance line to confirm that a potential bullish reversal could be underway. Immediate short-term price resistance is seen around 0.6350 levels for now and a break above that should be encouraging for bulls. Going further, a break above 0.6750 would confirm a bullish reversal and it could be a safe trading strategy to remain flat for now. Besides, note that the 4H RSI has been showing bullish divergence for long and it is just a matter of time before bulls are back in control. Traders should be prepared to buy after a break above 0.6350 levels with a stop below the swing low (0.6230) for now. Trading plan Remain fat for now and buy on a break above 0.6350. Good luck! The material has been provided by InstaForex Company - www.instaforex.com |
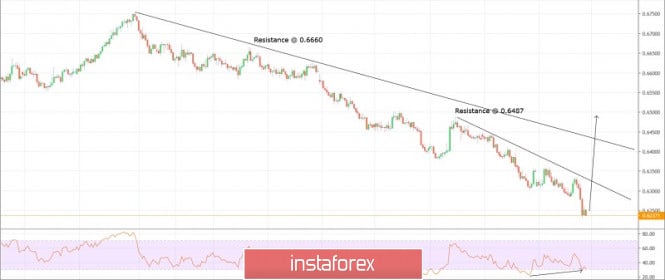
| Trading plan for AUD/USD for February 28, 2020 Posted: 28 Feb 2020 03:26 AM PST
Technical outlook: AUD/USD has been steadily dropping lower since the 0.7030 levels. Immediate price resistance on the 4 H time frame is seen at 0.6750 levels and a price break above that would confirm that a meaningful bottom is in place. The currency pair is seen to be trading close to 0.6510 levels at this point in writing and bulls should remain poised to reverse from here. A break above 0.6600 levels would also be extremely constructive for bulls to continue further. It is not shown here but a great deal of bullish convergence is seen around the ongoing price action. It should be a matter of time before a bullish reversal is seen from the current price around 0.6500. Trading point of view, it could be considered safe to remain flat for now and allow AUD/USD to break above the 0.6600 mark and then enter buying on dips. Trading plan: Remain flat for now. Look to buy on a break above 0.6600 levels. Good luck! The material has been provided by InstaForex Company - www.instaforex.com |
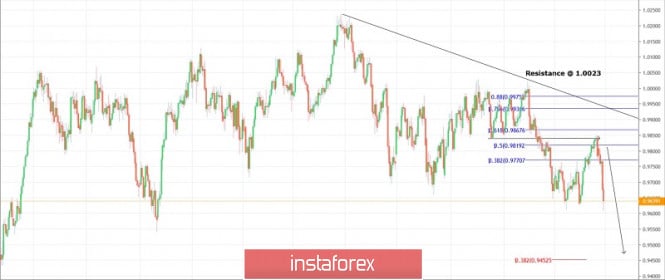
| Trading plan for USD/CHF for February 28, 2020 Posted: 28 Feb 2020 03:14 AM PST
Technical outlook: USD/CHF remains bearish until resistance at 1.0023 stays intact. Bears are holding the upper hand over the currency pair for now. The pair is expected to drop below 0.9500 levels and even deeper. Looking at the earlier wave structure, the USD/CHF pair had dropped from 1.0023 towards 0.9659. The recent boundary to be worked upon was between 1.0023 and 0.9615 respectively. As seen here, USD/CHF had staged a counter trend rally towards the 0.9850 levels. A bearish reaction was expected to appear around the 0.9850 zone and resume lower again. Since then, USD/CHF has dropped more than 250 pips and should be on its way to dig even further. Traders should position themselves on the short side with a stop around 0.9860 levels and a projected target below 0.9500 levels, going further. Trading plan: Remain short with stop at 0.9860 target is 0.9500 Good luck! The material has been provided by InstaForex Company - www.instaforex.com |
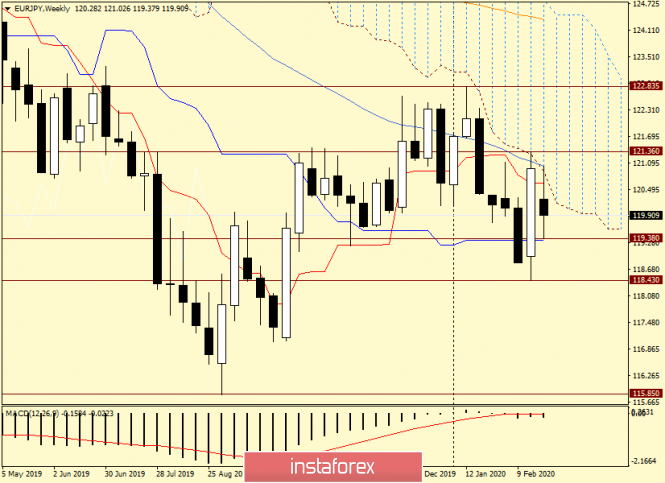
| Analysis and trading ideas for EUR/JPY on February 28, 2020 Posted: 28 Feb 2020 03:11 AM PST Good day! I haven't looked at the euro/yen cross rate charts for a long time. Maybe this is a plus since the most significant technical nuances immediately catch your eye. As I wrote in a previous article, today is a triple closure. The market will finish trading for the month, week and today. Let's see how well EUR/JPY approaches this event. Let's start with a weekly chart to determine the options for closing the session on February 24-28, and try to predict the future direction of this interesting cross-rate. Weekly
The weekly chart shows a rather unusual picture. After the previous huge white candle, the current week's trades opened with a bearish gap, and at the time of writing, this week's candle is inside the body of the previous one. In its form, this model is called "Harami" and often turns the price movement. However, the strength and chances of working out appear when this model occurs at the end of an upward or downward movement. In addition, it requires confirmation. At the moment, the market went down to the level of 119.38 and rose up to 121.02. As a result, the euro/yen is now trading near the key psychological and technical level of 120.00. I dare to assume that it is around this mark that the struggle for the closing price will unfold. The shadows at the top and bottom are approximately equidistant from the opening price. The growth was stopped by the Tenkan line, the lower border of the Ichimoku indicator cloud, and the 50 simple moving average, which together represent quite a serious resistance for players to increase the rate. At the bottom, support was found at 119.38, just below the Kijun line of the Ichimoku indicator. Judging by the weekly chart, it is difficult to assume the further direction of the euro/yen. I will only note that in my personal opinion, it will be more problematic to break through due to the greater number of resistances. Let's move to smaller time intervals in the hope of finding at least some signals for opening positions on EUR/JPY. I would like to immediately recommend that those who are new to the market, do not get into such volatile crosses, which include the euro/yen. Here you can get a decent profit, but also incur huge losses, up to the drain of the entire deposit. Daily
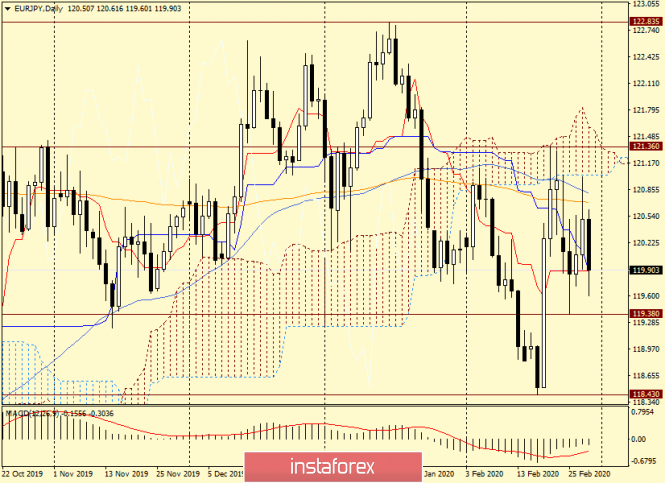
On this chart, we see that the situation is controlled by bears who are trying to lower the rate below the Tenkan and Kijun lines. These lines try to provide support, but we will be able to see and understand what will come out of all this only after the end of the trading session. At the top, the resistance is represented by 144 exponential and 50 simple moving averages, just above where the lower boundary of the Ichimoku cloud passes. On this chart, the situation is also far from clear. I can only assume that the breakdown of Tenkan and Kijun will send the pair to the support level of 119.38, the breakdown or non-breakdown of which the further direction of the euro/yen will depend. If the indicated level is broken, the next target for the bears will be 118.43, where the minimum trading values were shown on February 18. Now about the bullish scenario, which also needs to be considered and taken into account. To confirm their ambitions and control over the pair, the bulls will have to break through 144 EMA, 50 MA, enter the limits of the Ichimoku cloud, break through the resistance of sellers at 121.36 and bring the price up their cloud. In my personal opinion, this is a very complex and large-scale task that will require a strong driver to solve. Let's see if the market can find it. I will add that the area near 121.30 is very strong, and those who like to dig into history can see this. In my opinion, the top-down scenario has the highest priority. Moreover, we should not forget that the yen is a safe haven currency, and in a situation with the spread of the ill-fated coronavirus around the world, it can receive additional preferences in the form of strong demand during the flight from risks. Have a nice weekend! The material has been provided by InstaForex Company - www.instaforex.com |
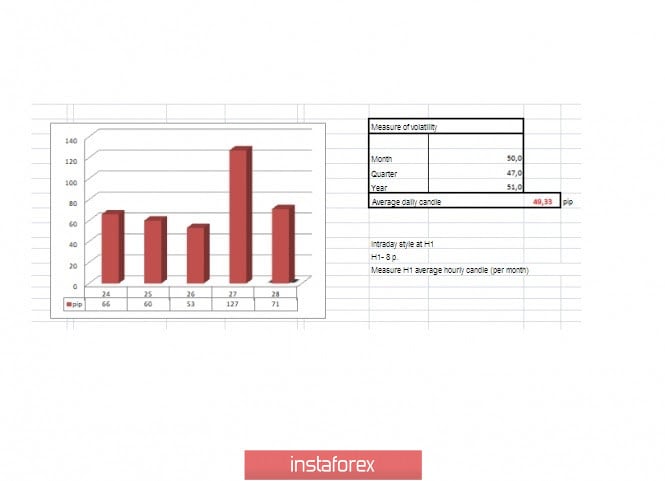
| Trading recommendations for EUR USD pair on February 28 Posted: 28 Feb 2020 03:05 AM PST From a comprehensive analysis, we see extremely high activity, where the inertial course can not be completed in any way. Now, about the details. Sellers' dreams are collapsing along with an unquenchable inertia move that has seriously diverged, generating more than half of the entire downward movement for February. Frankly speaking, we did not expect such a turn in development, the points of interaction where slowdowns with a rebound could have occurred were passed without extra effort. If you refer to the hourly chart, the psychological level of 1.1000 was already broken today. Is the theory of top-down development a failure? It is not necessary to jump to conclusions. The reasons for such a sharp growth are now being carefully considered, where they reduce the existing behavior to the collapse of the US stock market. There is something to think about. If you switch to the stock market, we see disastrous numbers - the S&P 500 index fell by 13% in six days, losing $ 3.5 trillion in capitalization. While the Dow Jones fell by 4.4%; Nasdaq forecast -4.6%; the yield on 10-year US Treasury bonds fell to 1.28%, while the yield on 30-year US Treasury bonds fell to 1.78%. Everything that happened was immediately compared to the great depression, as well as to the crisis of 2008. In this situation, another point looks interesting: before this "colossal" collapse, we had such a strong growth relative to all indices that it was as if everyone completely ignored the possible risk. The conclusion is a collapse with a small rustle. Now back to our rams, the dollar is losing ground at a lightning speed, against the background of panic developing in the stock market. Whether this is a local phenomenon is probably true, but now we need confirmation of whether the bears will be able to return to the initial phase after such a strong defeat. In terms of volatility, we see the first significant acceleration of 127 points this year, which exceeded the daily average by 159%. Such activity can easily lead to FOMO (lost profit syndrome), which will not bring anything good to the theory of top-down development. Analyzing the past day by the minute, we see a distinct inertial move that was set conditionally at 00:00 hours and lasted until the end of the trading day. Whether this movement is a sign of overheating of long positions is certainly true, unless there is FOMO syndrome. As discussed in the previous review, many traders were waiting for a reversal, referring to the point of variable resistance of 1.0950, where the Fibo level of 38.2 was located. However, the upward move remained. The recommendation from Thursday regarding the possible resumption of the upward move coincided, with a small profit. (Buy positions will be considered if the price is fixed higher than 1.0960, with the prospect of a move to 1.1000.) Looking at the trading chart in general terms (the daily period), we see a return of the price to the area of the four-month oblong correction, where the quote wavered for a painfully long period earlier. The news background of the previous day included the second preliminary estimate of the United States GDP for the fourth quarter, where economic growth was expected to accelerate to 2.3%. However, the forecasts did not match and the GDP level remained at 2.1%. At the same time, data was published on applications for unemployment benefits in the United States, where there were almost no changes -1,000 (Repeated: -9,000; Primary +8,000). The market reaction to the statistics was somewhere in the depth of all the noise and the dollar was losing its position. In terms of the general information background, we have news that Britain has published the mandate of the negotiating position on the future trade agreement with the European Union after Brexit. The main areas of negotiations were the topics of access to the free market, cooperation in the field of aviation, fisheries, financial services, transport and telecommunications. In the context of the "black and white" document, the British indicated that they would not accept any obligation to bring laws into line with EU law. In turn, the European side took note of the mandate of the United Kingdom and will discuss its terms for further relations between London and Brussels on March 2. "We have taken into account the UK mandate published today (February 27) and will discuss our respective positions on Monday. We will adhere to the priority agreements in the framework of the political declaration on the relationship of the parties. We want an ambitious and honest partnership with the UK in the future," EU chief negotiator Michel Barnier tweeted An interesting point in the British mandate and subsequent comments was that the UK government does not rule out leaving the EU without an agreement if the main directions are not agreed by June (2020). Now we understand that the risk of noise growth in the upcoming negotiations is extremely high and it can lead to a decline in the single currency. Today, in terms of the economic calendar, we had preliminary data on inflation for a number of EU countries, where the expected indicators did not come out in the best light. In the second half of the day, data on income/expenses of US individuals are published, where significant changes are not expected. The upcoming trading week is very busy in terms of the economic calendar. So, the beginning of the week is highlighted by PMI data and preliminary data on inflation in Europe. The middle of the week gives the ADP report on the level of employment, and then the report of the United States Department of Labor. And this is not all. Next week, the negotiations between England and Brussels on the Brexit agreement will start. The most interesting events displayed below: On Monday, March 2 EU 10:00 London time - manufacturing business activity index (PMI) (Feb): Prev 47.9 -> Forecast 47.8 USA 16:30 London time - the index of business activity in the manufacturing sector (PMI) from ISM (Feb): Prev 47.2 -> Forecast 50.2 On Tuesday, March 3 EU 11:00 London time - preliminary inflation data: Prev 1.4% -> Forecast 1.3% On Wednesday, March 4 EU 10:00 London time - business activity index in the service sector (Feb): Prev 52.5 -> Forecast 52.8 EU 11:00 London time - retail sales (y/y) (Jan): Prev 2.4% -> Forecast 1.3% USA 14:15 London time - ADP report on the level of employment in the private sector (Feb): Prev 291.1K -> Forecast 191K On Thursday, March 5 USA 14:30 London time - applications for unemployment benefits On Friday, March 6 USA 14:30 London time - report of the United States Department of Labor Further development Analyzing the current trading chart, we see a characteristic surge in activity, where the psychological level of 1.1000 was passed with the start of the European session. In fact, the same background of panic that came to us from the West, paired with the FOMO syndrome, leads to further growth, although overbought has already reached its limit. The risk of a reversal is extremely high, and it is worth taking this into account in your analysis. Detailing the available time interval every minute, we see that the round of rising candles appeared at 10:00 and we had a narrow flat of 1.0980/1.1005 before the jump. In turn, intraday traders are now either in further long positions directed towards the next level of 1.1080 or out of the market altogether, which is also good. Speculators work on jumps on the market. It is likely to assume that a technical correction relative to this entire upward rally should occur, so you can try to make money on it. Regarding the theory of downward development, we will return to this topic again after fixing the price below 1.0980. Based on the above information, we will output trading recommendations: - Buy positions can be considered higher than 1.1065 with a move to 1.1080 and the risk is high due to overheating. - Positions for sale in the form of a technical correction are considered relative to the available values in the direction of 1.1000. Indicator analysis Analyzing different sectors of timeframes (TF), we see that the indicators of technical instruments unanimously signal purchases due to the existing rally. It is worth taking into account that during the technical correction, the indicators on the minute and hour periods will quickly change their values. Volatility for the week / Volatility Measurement: Month; Quarter; Year. The volatility measurement reflects the average daily fluctuation from the calculation for the Month / Quarter / Year. (February 28 was based on the time of publication of the article) The current time volatility is 71 points, which is already 44% higher than the daily average. It is likely to assume that if the noise and FOMO persist, volatility may increase. Key levels Resistance zones: 1.0950**; 1.1000***; 1.1080**; 1.1180; 1.1300**; 1.1450; 1.1550; 1.1650*; 1.1720**; 1.1850**; 1.2100. Support zones: 1.0850**; 1.0775*; 1.0700; 1.0500***; 1.0350**; 1.0000***. * Periodic level ** Range level *** Psychological level ***** The article is based on the principle of conducting a transaction, with daily adjustments. The material has been provided by InstaForex Company - www.instaforex.com |
| Trading plan for USD/JPY for February 28, 2020 Posted: 28 Feb 2020 03:02 AM PST
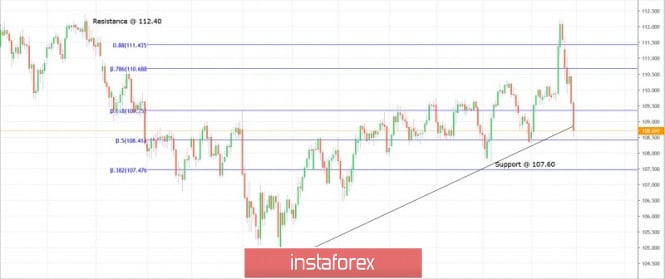
Technical outlook: USD/JPY reversed sharply after being just shy of breaking above 112.40 levels. This was discussed earlier here that USD/JPY outlook remains bearish until the price is trading firmly below 112.40 levels. The USD/JPY pair retreated from 112.22 levels last Friday. Since then, the pair has given almost 350 pips. It is still expected to dip lower but we can expect counter trend rallies once it breaks below support at 107.50 levels as displayed on the chart here. Traders who maintained short positions from higher levels can book profits around 107.50 levels and wait for a pullback to materialize. Even if the trend has turned higher and this is just a pullback, USD/JPY is expected to drop until 107.50 levels if not deeper. It is advisable to exit short positions there and wait for the next price action to unfold. Selling on rallies could be a safe trading strategy, going forward. Trading plan: Remain short for now and take profits around 107.50 levels. Good luck! The material has been provided by InstaForex Company - www.instaforex.com |
| Trading plan for GBP/USD for February 28, 2020 Posted: 28 Feb 2020 02:54 AM PST
Technical outlook: GBPUSD is seen to be trading around 1.2900 levels at this point in writing and might be looking to drop towards 1.2550/1.2750 levels before turning higher again. Also please note that the single currency pair might have already formed a bottom around 1.2850 last week and it could resume rally from here. Looking into the price action, GBP/USD has only retraced 38% of its previous rally between 1.1950 and 1.3515 levels respectively. A drop towards 50% retracement at 1.2750 or even lower towards 1.2550 would be extremely encouraging for bulls to resume its next rally. Besides note that 1.2550 is a convergence of fibonacci 0.618 retracement, past resistance which turned into future support and fibonacci 0.618 extension of the corrective drop. A bullish bounce from there should be bought with a stop below 1.2950 and potential targets remain through 1.4200/1.4500 levels going forward. Trading plan: Buy @ 1.2550/1.2750 levels, stop @ 1.1950, target is 1.4200/1.4500. Good luck! The material has been provided by InstaForex Company - www.instaforex.com |
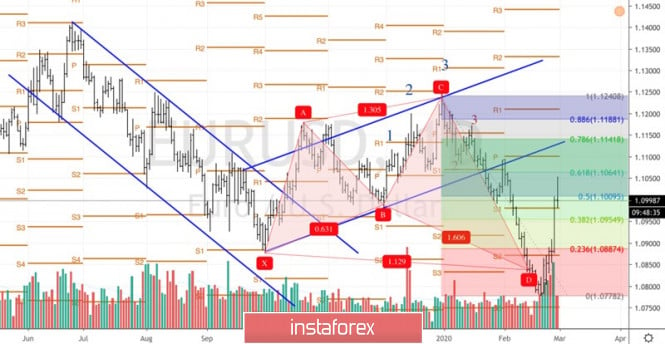
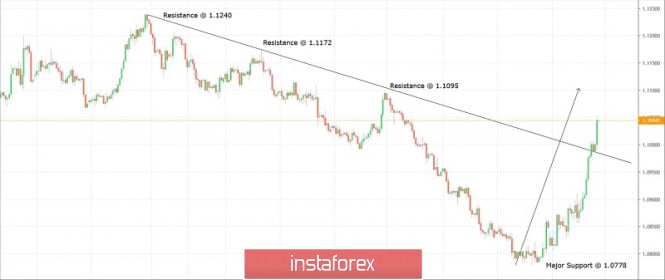
| Trading plan for EUR/USD for February 28, 2020 Posted: 28 Feb 2020 02:40 AM PST
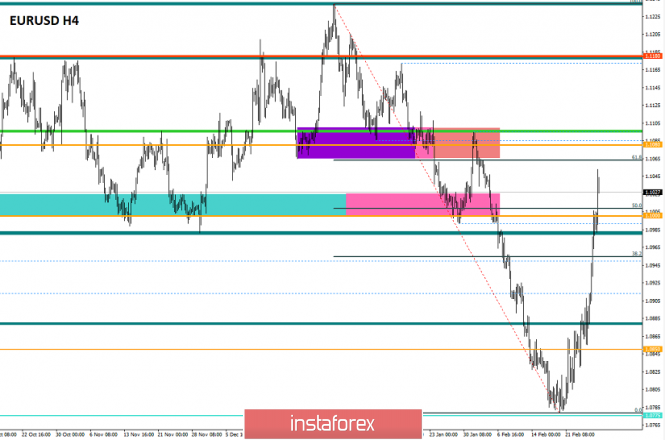
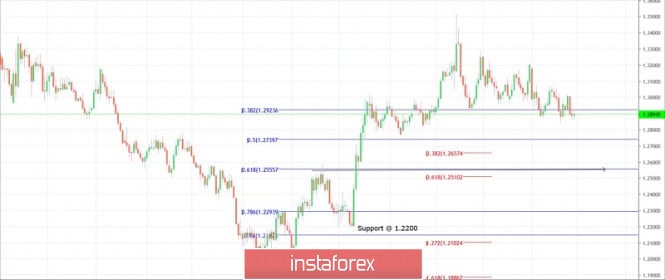
Technical outlook: EUR/USD finally breaks into the buy zone of the intermediary resistance trend line. It is seen to be trading around 1.1028/30 levels at this point in writing. The pair seems to be poised to target 1.1095 immediately from here. Please note that a break of the trend line also suggests that a meaningful bottom is in place at 1.0778 for now and that bulls are in control. A break above 1.1095 proves that bulls are here to remain, and this rally is not corrective. The EUR/USD pair has also formed a huge Morning Star candlestick pattern on the weekly chart (not shown here) indicating a potential trend reversal ahead. Those traders who initiated long positions earlier can take partial profits above 1.1095 levels and wait for a pullback lower again. A long-awaited bull run might be at its early stages and has got enough room to rally above 1.1500/1.1800 and higher respectively. Trading plan: Remain long stop @ 1.0770, target is open. Good luck! The material has been provided by InstaForex Company - www.instaforex.com |
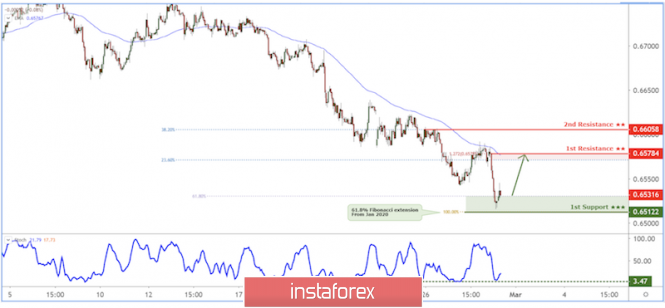
| AUD/USD further push up above support Posted: 28 Feb 2020 02:18 AM PST
Trading Recommendation Entry:0.65310 Reason for Entry: Graphical swing low zone. Take Profit : 0.65784 Reason for Take Profit: 127.2% Fibonacci extension and 23.6% Fibonacci retracement Stop Loss: 0.65122 Reason for Stop loss: 61.8% and 100% Fibonacci extension The material has been provided by InstaForex Company - www.instaforex.com |
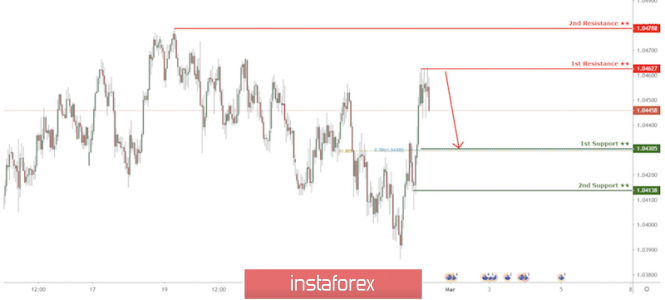
| AUD/NZD approaching resistance, potential drop! Posted: 28 Feb 2020 02:17 AM PST
Trading Recommendation Entry: 1.0462 Reason for Entry: Horizontal swing high Take Profit :1.0430 Reason for Take Profit: 61.8% Fibo retracement 7.6% Fibo extension Stop Loss:1.0478 Reason for Stop loss: Horizontal swing high resistance The material has been provided by InstaForex Company - www.instaforex.com |
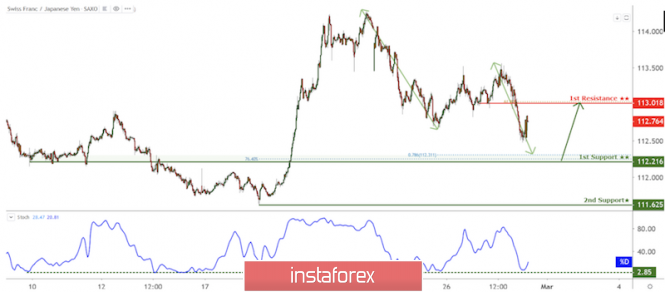
| CHF/JPY approaching support, potential bounce! Posted: 28 Feb 2020 02:14 AM PST
Trading Recommendation Entry: 112.216 Reason for Entry: 78.6% fibonacci extension, horizontal overlap support, 78.6% fibonacci retracement Take Profit : 113.018 Reason for Take Profit: 61.8% Fibonacci retracement, Horizontal pullback resistance Stop Loss: 111.625 Reason for Stop loss: Horizontal swing low support The material has been provided by InstaForex Company - www.instaforex.com |
| Instaforex Daily Analysis - 28th Feb 2020 Posted: 28 Feb 2020 02:10 AM PST Today we take a look at EURUSD and how we can use Fibonacci retracements, Fibonacci extensions, market momentum, trend lines and support/resistance to play this move. The material has been provided by InstaForex Company - www.instaforex.com |
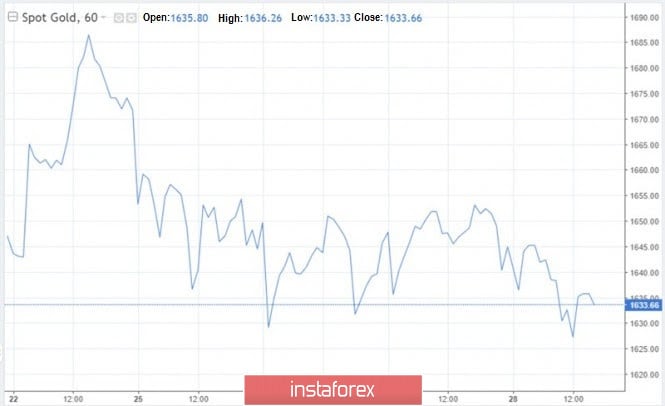
| Posted: 28 Feb 2020 02:06 AM PST Players in the US stock index are not the only ones celebrating the failure of gold. It is one thing when the stock market, which has been booming for more than a decade, declines out of fear of the spread of coronavirus in the United States. Another, when we see one of the most popular hedging tools used by investors to protect capitals from crisis, falls in parallel with other markets, even though logic suggests that it should grow. It seems that the precious metal is being dumped as a normal risk asset. After gold soared to its seven-year highs on Monday, experts from TD Securities warned that long positions on the precious metal had entered new uncharted positioning territory, which could cause a reversal. "Many people bought gold and want to sell it. This holds back quotes from further rallies, despite the fact that sales are continuing on the stock markets," they said. Some experts consider the current rollback of quotes to be a search for the necessary point of support. Having strengthened technically, the precious metal will be ready to achieve the goal that really matters for the remaining long positions in the market - $1,700. The decline in quotes shocked many. During its rise, a large amount of quick money was invested in buying the precious metal. However, it was replaced by a subsequent fall. We may be seeing local lows right now, but the environment undoubtedly remains favorable for gold, as stocks and bonds fall, and concerns about global growth remains. Currently, the precious metal is trying to find support around $1,630. The immediate obstacle to the quotes' growth is the resistance level of $1,660. If gold manages to break through it, the precious metal may rise to $1,700, and target the highs of 2012. Strategists from Goldman Sachs predict that gold may reach $1,800 in the next three months. They gave three reasons for the increase: 1. Investment demand associated with the flight of investors from risky assets. 2. Accumulation of large amount of free savings. 3. The growing popularity of Bernie Sanders, who may become the candidate of the Democratic Party in the US presidential election. "Recently, gold has shown better dynamics than traditional assets such as the franc or the yen. This suggests that all currencies are somehow vulnerable to the coronavirus, while gold is not," the experts said. "We see the risks of a further decline in the stock market, which will keep demand for the precious metal high. As for household savings, they are at historically high levels in developed countries, which creates prerequisites for further capital inflows into gold ETFs," they added. The bank believes that the increased attention in the US presidential election will also stimulate the demand for gold as a safe haven asset. "Bernie Sanders proposes raising the taxes, which creates risks for the stock market, as well as sharply increase the government spending. The last time that this happened (apart from the recessions) was during the Reagan presidency in the 1980s, where back then, the price of gold soared, due to the fears of rising inflation. In addition, the tax on wealth proposed by B. Sanders may encourage wealthy Americans to buy physical gold and keep it in storage, where the government will find it difficult to reach," the analysts from Goldman Sachs said. The material has been provided by InstaForex Company - www.instaforex.com |
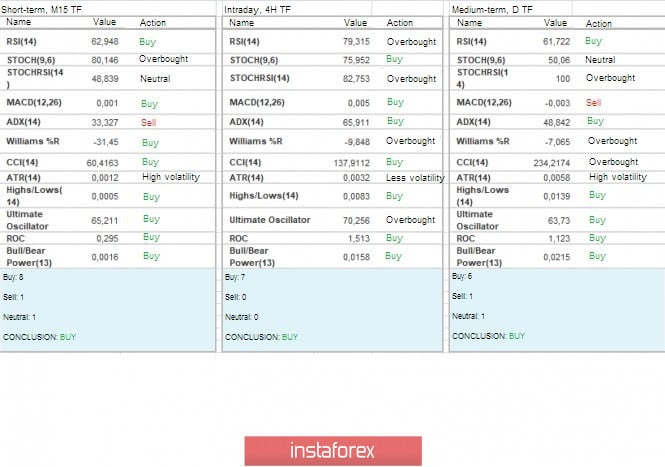
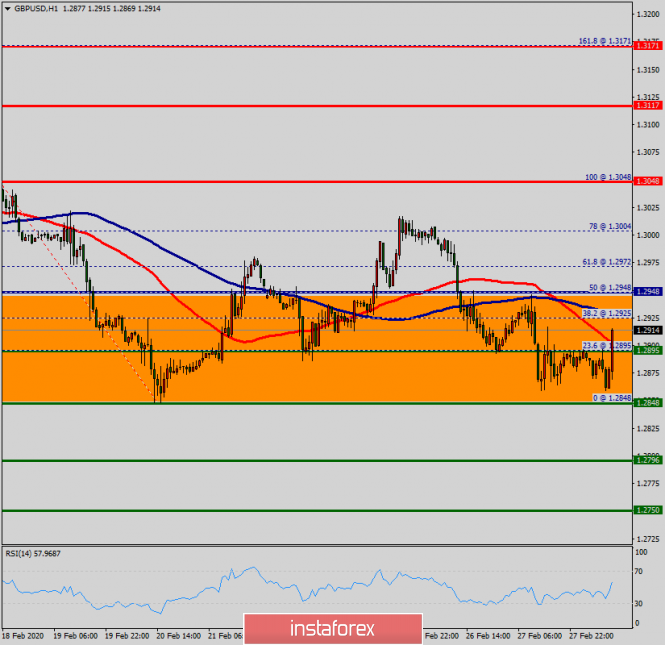
| Technical analysis of GBP/USD for February 28, 2020 Posted: 28 Feb 2020 02:04 AM PST Overview: Pivot : 0.2948. Currntly price : 1.2911. Trend : uptrend. There are no changes in my technical outlook. The bias remains bullish in the nearest term testing 1.3117 or higher. The GBP/USD pair will continue rising from the level of 1.2948 today. So, the support is found at the level of 1.2825, which represents the 23.6% Fibonacci retracement level in the H1 time frame. Since the trend is above the 23.6% Fibonacci level, the market is still in an uptrend. Therefore, the GBP/USD pair is continuing with a bullish trend from the new support of 1.2825. The current price is set at the level of 1.2962 that acts as a daily pivot point seen at 1.2948. Equally important, the price is in a bullish channel. According to the previous events, we expect the GBP/USD pair to move between 1.2825 and 1.3048. Therefore, strong support will be formed at the level of 1.2825 providing a clear signal to buy with the targets seen at 1.3048. If the trend breaks the first resistance at 1.3048, the pair will move upwards continuing the development of the bullish trend to the level 1.3117 in order to test the daily resistance 2. In the same time frame, resistance is seen at the levels of 1.3048 and 1.3117. The stop loss should always be taken into account for that it will be reasonable to set your stop loss at the level of 1.2848. The material has been provided by InstaForex Company - www.instaforex.com |


| You are subscribed to email updates from Forex analysis review. To stop receiving these emails, you may unsubscribe now. | Email delivery powered by Google |
| Google, 1600 Amphitheatre Parkway, Mountain View, CA 94043, United States | |
No comments:
Post a Comment