
Forex analysis review |
- Elliott wave analysis on GBPUSD
- March 6, 2020 : GBP/USD Intraday technical analysis and trade recommendations.
- March 6, 2020 : EUR/USD Intraday technical analysis and trade recommendations.
- Fractal analysis for major currency pairs on March 6
- Will the ECB stop the "bulls" on the euro?
- BTC analysis for 03.06.2020 - The end of the upward correction ? Possible drop and test of $8.210
- EUR/USD analysis for 03.06.2020 - Extended run to the upside, watch for buying on the dips with the main target at 1.1400
- Analysis of EUR/USD and GBP/USD on March 6. The "unstoppable" euro. Coronavirus continues to cause the markets to panic
- Trading recommendations for EURUSD pair on March 6
- Analysis for Gold 03.06.2020 - Multi pivot level at the price of $1.690, the breakout to the upside would ocnfirm test of
- No one wants to fly
- Evening review on EUR/USD on March 6, 2020. The euro is rising, whereas the dollar is falling
- Market review. Trading ideas. Q&A
- Trading recommendations for GBP/USD pair - prospects for further movement
- AUD/USD trendline breakout with pullback completed. Drop now imminent!
- GBP/CAD approaching resistance, potential drop!
- Technical analysis of GBP/USD for March 06, 2020
- EUR/JPY bouncing nicely off support, potential for further rise!
- Instaforex Daily Analysis - 6th Mar 2020
- Simplified wave analysis of GBP/USD, USD/JPY, and USD/CHF on March 6
- EUR/USD. March 6. The key breakthrough of the euro. The pair indicated its intention to grow to 1.1600
- Whatever happens (EUR/USD and GBP/USD review on 03/06/2020)
- Strength test: pound does not intend to stop
- GBP/USD. March 6. Will statistics from America stop the growth of the pound?
- Technical analysis for EUR/GBP on March 6, 2020
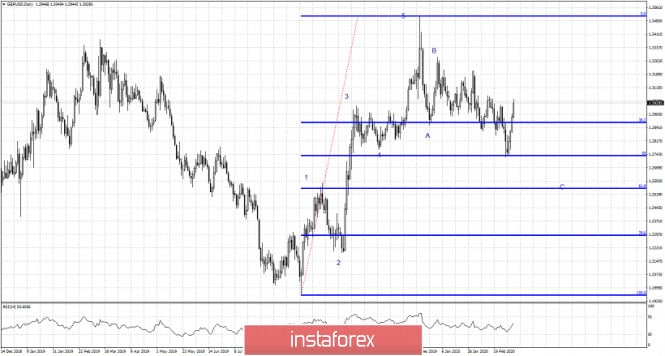
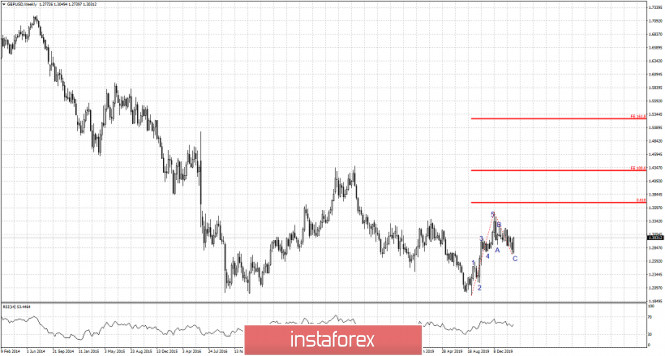
| Elliott wave analysis on GBPUSD Posted: 06 Mar 2020 01:03 PM PST GBPUSD is bouncing strongly above 1.30 breaking the sequence of lower lows and lower highs. Price has reversed off the 50% Fibonacci retracement of the first leg up and according to our analysis there are many chances that the corrective wave C and the entire pull back from 1.35 is over. Since mid-December price has showed us that a corrective phase was starting and that is why in our analysis we noted that a three wave correction should follow. Price has now reached the area of wave 4 of lesser degree and the 50% retracement. Price is bouncing higher.
|
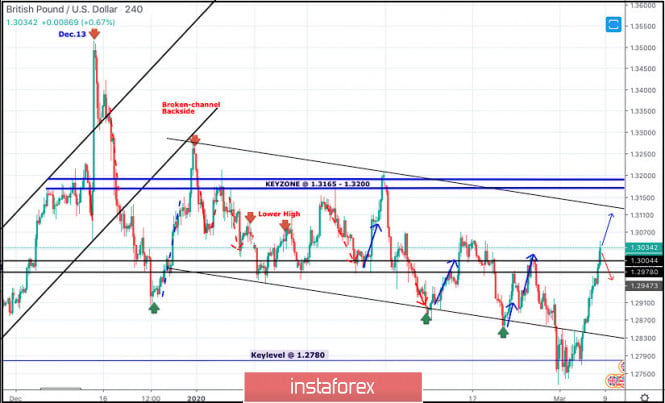
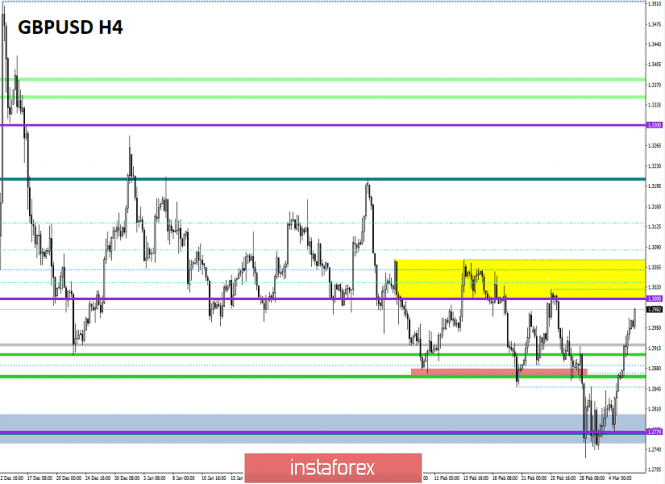
| March 6, 2020 : GBP/USD Intraday technical analysis and trade recommendations. Posted: 06 Mar 2020 08:16 AM PST
In the period between December 18th - 23rd, bearish breakout below the depicted previous bullish channel followed by quick bearish decline below 1.3000 were demonstrated on the H4 chart. However, immediate bullish recovery (around 1.2900) brought the pair back above 1.3000. Bullish breakout above 1.3000 allowed the mentioned Intraday bullish pullback to pursue towards 1.3250 (the backside of the broken channel) where the current wide-ranged movement channel was established between (1.3200-1.2980). Since January 13, progressive bearish pressure has been built over the price zone of 1.2980-1.3000 until February 5. On February 6, recent bearish breakdown below 1.2980 enhanced further bearish decline towards 1.2890 (the lower limit of the movement channel) where two episodes of bullish rejection were manifested on February 10th and 20th. This was followed by the recent bullish pullback towards the price zone of 1.2980-1.3000 which has offered considerable bearish rejection. On the other hand, the lower limit of the channel around 1.2850 has failed to provide enough bullish Support for the pair. That's why, a quick bearish decline was expressed towards the nearest DEMAND level around 1.2780 where significant bullish rejection and an inverted Head & Shoulders reversal pattern was recently demonstrated. Quick bullish movement was demonstrated towards the price zone of 1.2980-1.3000 which is failing to offer enough bearish pressure on the GBPUSD pair. The current Bullish recovery is expected to pursue towards 1.3130-1.3150 provided that the ongoing bullish breakout above 1.3000 is maintained on a daily basis. Bearish rejection and bearish pullback is expected to exist around 1.3130 unless bullish breakout above 1.3165 is achieved soon enough. The material has been provided by InstaForex Company - www.instaforex.com |
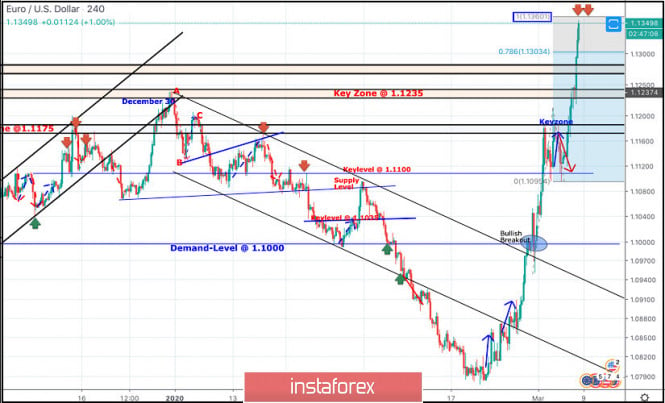
| March 6, 2020 : EUR/USD Intraday technical analysis and trade recommendations. Posted: 06 Mar 2020 07:46 AM PST
On December 30, a bearish ABC reversal pattern was initiated around 1.1235 (Previous Key-zone) just before another bearish movement could take place towards 1.1100 (In the meanwhile, the EURUSD pair was losing much of its bearish momentum). One more bullish pullback was executed towards 1.1175 where the depicted key-zone as well as the recently-broken uptrend were located. Since then, the pair has trended-down within the depicted bearish channel until two weeks ago, when extensive bearish decline established a new low around 1.0790. This was where the EUR/USD pair looked oversold after such a long bearish decline. Hence, Intraday traders were advised to look for signs of bullish recovery around the price levels of (1.0790). On February 20, recent signs of bullish recovery were demonstrated around 1.0790 leading to the current bullish movement towards 1.1000, 1.1175 and 1.1235. The price level of (1.1175) constituted a temporary SUPPLY level in confluence with the origin of the previously-mentioned ABC pattern. That's why, transient congestion-zone was established down to 1.1100-1.1095 where another bullish swing was initiated towards 1.1300 and 1.1360. Currently, the EURUSD pair is testing the price-Level of (1.1360) which corresponds to 100% Fibonacci Expansion Level of the most recent bullish swing. That's why, bearish rejection is anticipated around this price level of 1.1360 (Supported with being OVERBOUGHT) with bearish targets around 1.1300 and 1.1235. Otherwise, Bullish Breakout above 1.1360 enables further upward movement towards a more dependable Supply-Zone. The material has been provided by InstaForex Company - www.instaforex.com |
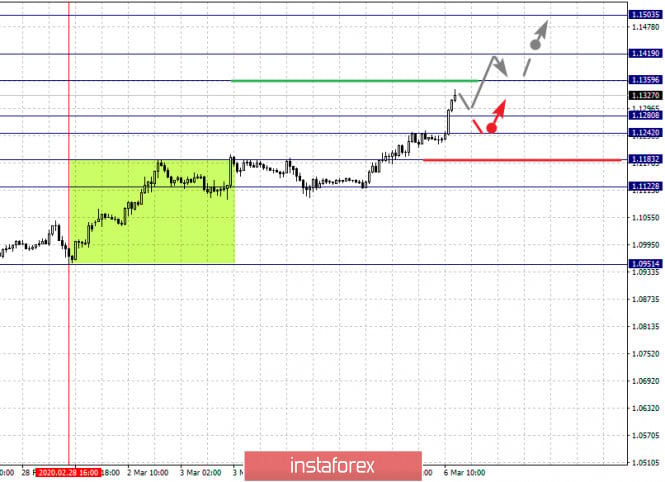
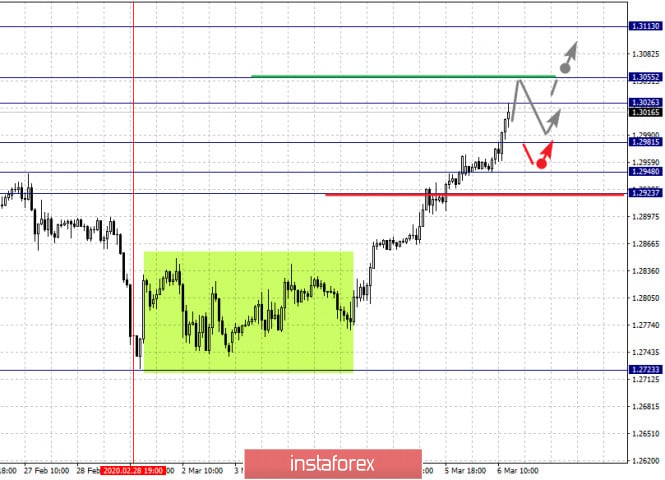
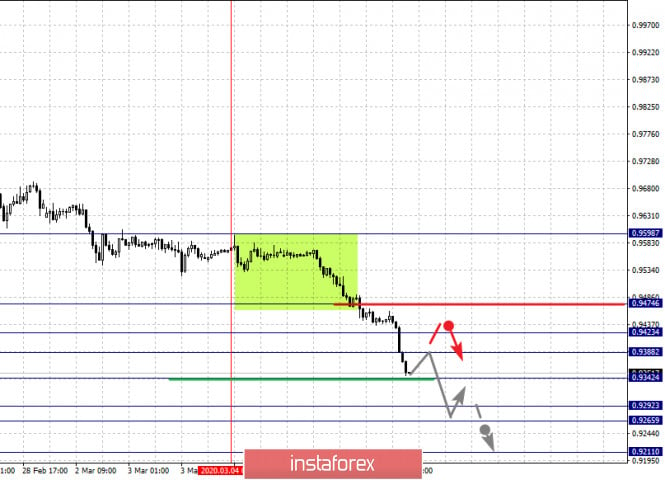
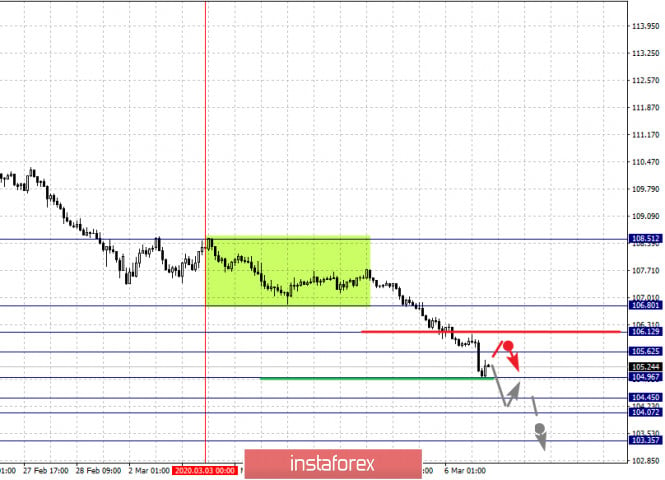
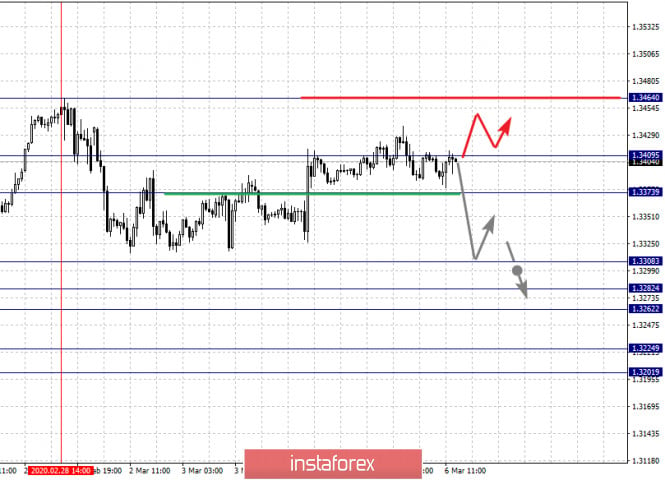
| Fractal analysis for major currency pairs on March 6 Posted: 06 Mar 2020 04:44 AM PST Hello, colleagues. For the Euro/Dollar pair, we follow the local upward structure from February 28 and we expect the upward movement to continue after the breakdown of 1.1360. For the Pound/Dollar pair, we follow the development of the upward cycle from February 28 and the level of 1.2923 is the key support. For the Dollar/Franc pair, the following targets for the bottom were determined from the local descending structure on March 4 and the level of 0.9342 is the key resistance. For the Dollar/Yen pair, we follow the development of the local downward cycle from March 3 and the level of 104.96 is the key resistance. For the Euro/Yen pair, we follow the development of the downward structure from March 3; the level of 118.54 is the key resistance and the level of 120.02 is the key support. For the Pound/Yen pair, the price formed a local downward structure from March 2. Forecast for March 6: Analytical review of currency pairs on the H1 scale:
For the Euro/Dollar pair, the key levels on the H1 scale are: 1.1503, 1.1419, 1.1359, 1.1280, 1.1242, 1.1183, and 1.1122. Here, we follow the local upward cycle from February 28. A short-term upward movement is expected in the area of 1.1359-1.1419 and the breakdown of the last value will lead to a pronounced movement. Here, the target is 1.1503 and we expect a pullback to the bottom from this level. A short-term downward movement is expected in the range of 1.1280-1.1242 and the breakdown of the last value will lead to a deep correction. Here, the target is 1.1183 and this level is the key support for the top. Its passage by the price will lead to the formation of initial conditions for the downward cycle. In this case, the target is 1.122. The main trend is the local upward cycle from February 28. Trading recommendations: Buy: 1.1360 Take profit: 1.1417 Buy: 1.1421 Take profit: 1.1503 Sell: 1.1280 Take profit: 1.1243 Sell: 1.1241 Take profit: 1.1184
For the Pound/Dollar pair, the key levels on the H1 scale are: 1.3113, 1.3055, 1.3026, 1.2981, 1.2948, and 1.2923. Here, we follow the development of the ascending structure from February 28. A short-term upward movement is expected in the range of 1.3026-1.3055 and the breakdown of the last value will lead to a movement to the potential target - 1.3113, consolidation is near this level, as well as a pullback to the bottom. Going into correction is possible after the breakdown of 1.2981. Here, the target is 1.2948. The range of 1.2948-1.2923 is the key support for the top. The main trend is the upward cycle from February 28. Trading recommendations: Buy: 1.3026 Take profit: 1.3053 Buy: 1.3056 Take profit: 1.3111 Sell: 1.2980 Take profit: 1.2948 Sell: 1.2946 Take profit: 1.2924
For the Dollar/Franc pair, the key levels on the H1 scale are: 0.9474, 0.9423, 0.9388, 0.9342, 0.9292, 0.9265, and 0.9211. Here, we follow the local descending structure from March 4. We expect a continuation of the downward movement after the breakdown of 0.9342. In this case, the target is 0.9292 and in the area of 0.9292-0.9265 is the consolidation. We consider the level of 0.9211 as a potential value for the bottom, and when this value is reached, we expect a pullback to the top. A short-term upward movement is possible in the area of 0.9388-0.9423 and the breakdown of the last value will lead to a deep correction. Here, the target is 0.9474 and this level is the key support for the top. The main trend is the local downward structure from March 4. Trading recommendations: Buy: 0.9388 Take profit: 0.9421 Buy: 0.9424 Take profit: 0.9474 Sell: 0.9341 Take profit: 0.9292 Sell: 0.9265 Take profit: 0.9211
For the Dollar/Yen pair, the key levels in the H1 scale are: 106.80, 106.12, 105.62, 104.96, 104.45, 104.07, and 103.35. Here, we follow the development of the local descending structure from March 3. We expect a continuation of the downward movement after the breakdown of 104.96. In this case, the target is 104.45 and in the area of 104.45-104.07 is the consolidation. We consider the level 103.35 as a potential value for the bottom, after reaching this value, we expect a rollback to the correction. A short-term upward movement is possible in the area of 1105.62-106.12 and the breakdown of the last value will lead to a deep correction. In this case, the target is 106.80 and this level is the key support for the descending structure. The main trend is the local downward structure from March 3. Trading recommendations: Buy: 105.62 Take profit: 106.11 Buy: 106.13 Take profit: 106.80 Sell: 104.94 Take profit: 104.45 Sell: 104.05 Take profit: 103.35
For the Canadian dollar/Dollar pair, the key levels on the H1 scale are: 1.3409, 1.3373, 1.3350, 1.3308, 1.3282, 1.3262, 1.3224, and 1.3201. Here, we follow the formation of the descending structure from February 28. We expect a continuation of the downward movement after the breakdown of 1.3308. In this case, the target is 1.3282, and consolidation is near this level. The passage at the price of the range of 1.3282-1.3262 should be accompanied by a pronounced downward movement. Here, the target is 1.3224. We consider the level of 1.3201 to be a potential value for the bottom, after which we expect consolidation, as well as a pullback to the top. A consolidated movement is possible in the area of 1.3373-1.3409. From this range, there is a high probability of a reversal to the bottom and a breakdown of the level of 1.3410 will lead to the formation of initial conditions for an upward cycle. In this case, the target is 1.3464. The main trend is the formation of a downward structure from February 28. Trading recommendations: Buy: 1.3375 Take profit: 1.3409 Buy: 1.3412 Take profit: 1.3460 Sell: 1.3308 Take profit: 1.3282 Sell: 1.3260 Take profit: 1.3225
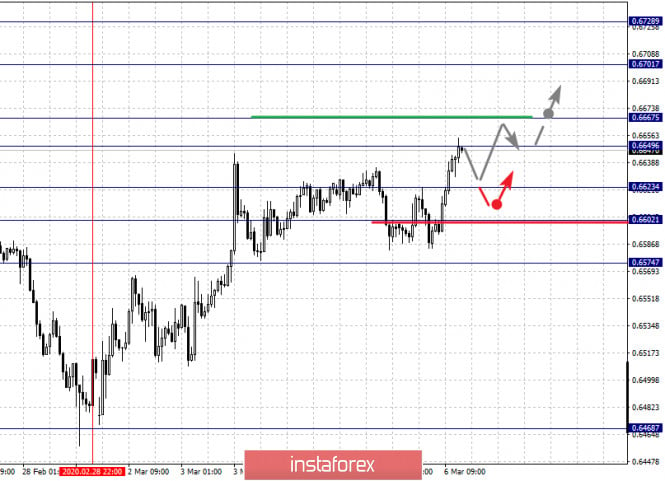
For the Australian dollar/Dollar pair, the key levels on the H1 scale are: 0.6728, 0.6701, 0.6667, 0.6649, 0.6623, 0.6602, and 0.6574. Here, we follow the development of the upward cycle from February 28. A short-term upward movement is expected in the area of 0.6649-0.6667 and the breakdown of the last value will lead to a pronounced movement. Here, the target is 0.6701 and consolidation is near this level. We consider the level of 0.6728 as a potential value for the top, after which we expect a rollback to the bottom. A short-term downward movement is possible in the area of 0.6623-0.6602 and the breakdown of the last value will lead to a deep correction. Here, the target is 0.6574 and this level is the key support for the top. The main trend is the upward cycle from February 28. Trading recommendations: Buy: 0.6650 Take profit: 0.6665 Buy: 0.6668 Take profit: 0.6701 Sell: 0.6623 Take profit: 0.6604 Sell: 0.6601 Take profit: 0.6576
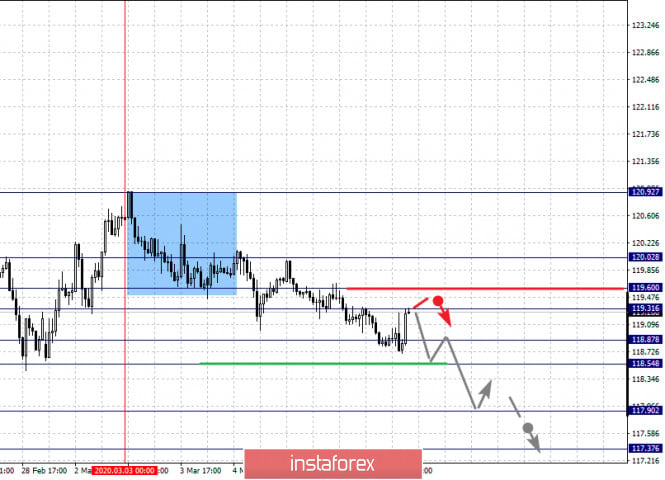
For the Euro/Yen pair, the key levels on the H1 scale are: 120.02, 119.60, 119.31, 118.87, 118.54, 117.90, and 117.37. Here, we follow the downward structure from March 3. A short-term downward movement is possible in the area of 118.87-118.54 and the breakdown of the last value will lead to a pronounced movement. Here, the target is 117.90 and consolidation is near this level. We consider the level of 117.37 as a potential value for the bottom, after which we expect a rollback to the top. A short-term upward movement is possible in the area of 119.31-119.60 and the breakdown of the last value will lead to a deep correction. Here, the target is 120.02 and this level is the key support for the descending structure. The main trend is the downward structure from March 3. Trading recommendations: Buy: 119.31 Take profit: 119.60 Buy: 119.62 Take profit: 120.00 Sell: 118.86 Take profit: 118.55 Sell: 118.52 Take profit: 117.92
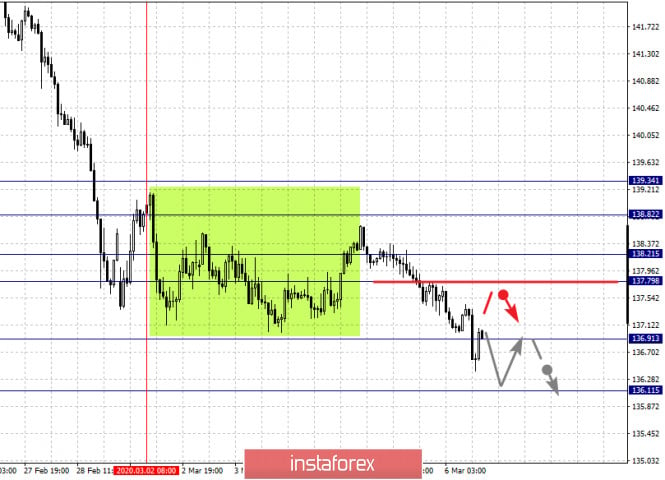
For the Pound/Yen pair, the key levels on the H1 scale are: 139.34, 138.82, 138.21, 137.79, 136.91, and 136.11. Here, the price formed a local structure for the downward trend from March 2. We expect a continuation of the downward movement after the breakdown of 136.90. In this case, the target is 136.11, after reaching this level, we expect a pullback to the correction. A short-term upward movement is possible in the area of 137.79-138.21 and the breakdown of the last value will lead to a deeper correction. Here, the target is 138.82 and this level is the key support for the downward cycle. Its breakdown will lead to the formation of an upward structure. In this case, the target is 139.34. The main trend is the local downward structure from March 2. Trading recommendations: Buy: 137.80 Take profit: 138.20 Buy: 138.25 Take profit: 138.80 Sell: 136.90 Take profit: 136.11 Sell: Take profit: The material has been provided by InstaForex Company - www.instaforex.com |
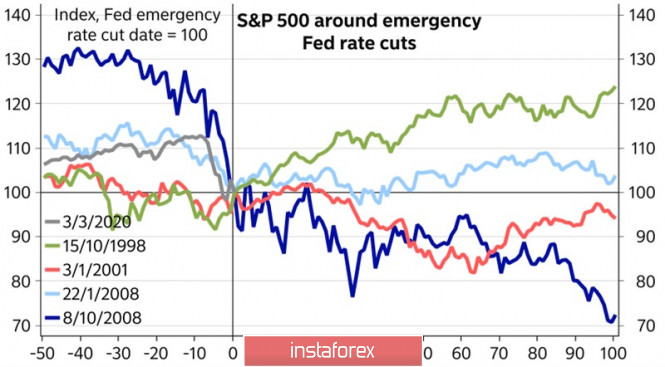
| Will the ECB stop the "bulls" on the euro? Posted: 06 Mar 2020 04:44 AM PST The key event of the first week of March was an extraordinary reduction in the Federal funds rate from 1.75% to 1.25%. Back in late winter, FOMC officials said that it was too early to assess the impact of coronavirus on US GDP and assured of the strength of the US economy. In early spring, they unanimously reduced borrowing costs by 50 bps at once. As history shows, the Fed will not stop there: since 1989, after each of the 6 unscheduled acts of monetary expansion, the central bank continued what it started at the scheduled meeting. However, this did not always help save the stock market. At the end of 2008, aggressive monetary easing did not prevent the S&P 500 from sales, but in 1998, 2001, and early 2008, the Fed was able to stabilize the market. What can we expect now? Impact of the Fed's aggressive monetary expansion on the S&P 500
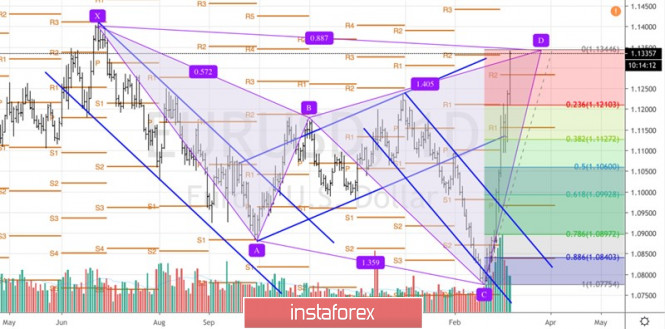
Judging by the initial reaction of US stock indices, which sank by more than 3%, we can assume that 50 bps is not enough for investors. CME derivatives believe that the Federal funds rate may drop to 0.25% at the end of the year, so the Fed has a margin of safety. Will it take so much aggression? We will get an answer to this question in the next few weeks. For now, we can say that the depth of monetary policy easing is a key bullish driver for EUR/USD. The euro seems to have forgotten about the weakness of the eurozone economy, the problems in the EU-Britain negotiations, and the risks of a trade war between the European Union and the United States hanging like a sword of Damocles over its head. US bond yields are falling significantly faster than their German counterparts, and the spread has narrowed to the lowest level since 2017, which has deprived the dollar of its main trump card - playing on the difference. Carry traders close deals and return to the funding currencies represented by the euro and yen. At the same time, the collapse of the S&P 500 contributes to the outflow of capital from the States and the weakness of the US dollar. Will anything change in the week of March 13? At first glance, the rich economic calendar for the eurozone, taking into account its internal weakness, increases the risks of a EUR/USD pullback. Indeed, the forecasts for German foreign trade and European industrial production are by no means comforting, which, paired with the ECB's intention to ease monetary policy, makes euro fans hold their horses. The money market is absolutely confident of reducing the deposit rate by 10 bps in March and another 10 bps by the end of the year. There are rumors of an expansion of QE and another round of cheap loans in the form of LTRO. Christine Lagarde and her colleagues are interested in cooling the EUR/USD bulls, as revaluation slows inflation. Will it work? I believe that little will depend on frankfurt alone. Investors will continue to react to the behavior of US stock indices and to changes in the probability of the Fed's monetary expansion. Technically, the main currency pair very quickly reached the target of 88.6% on the "Shark" pattern. A break in the resistance at 1.134 is fraught with a continuation of the rally, at least to the next target of 113%. On the contrary, the rebound will increase the risks of correction to 1.12 and below. EUR/USD, the daily chart
|
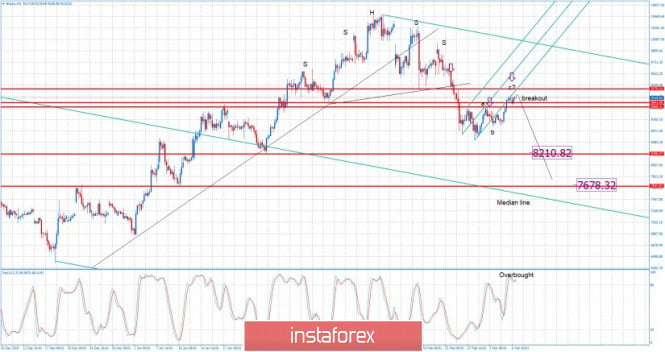
| BTC analysis for 03.06.2020 - The end of the upward correction ? Possible drop and test of $8.210 Posted: 06 Mar 2020 04:35 AM PST Industry news:
An important indication of the past and the future of any asset class is the derivatives market and based on the current Bitcoin trend, its market is showing signs of life.Since the beginning of the month, Bitcoin has surged by 8.5 percent, breaking the $9,000 mark after falling below amidst the global sell-off owing to Covid-19 fears. The drop in Bitcoin's price and the global market meltdown stopped derivatives traders from closing out their positions, but now it looks like they're back. According to data from Skew markets, the liquidity on top exchanges is increasing as volumes tend to stabilize. BitMEX, the veteran derivatives platform headquartered in Seychelles, has seen a massive drop in its $10 million Bid/Offer spread for its Bitcoin Futures contracts. Technical analysis: BTC been trading sideways at the prrrice of $9.116.The price reached the resistance at the $9.100 and its on the decision level. I found potential end of the upward correction and completed ABC pattern. I would watch for selling opportunities and downward tarrgets at the prrice of $8.210 and $7.678. Stochastic is in overbought zone and it is good confirmation that buying looks risky and selling preferable. Resistance level is set at the prie of $9.280 Support levels and downward targets are set at the price of $8.210 and $7.678 The material has been provided by InstaForex Company - www.instaforex.com |
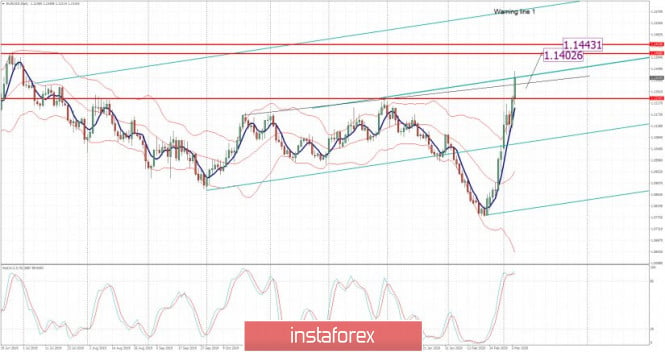
| Posted: 06 Mar 2020 04:28 AM PST Technical analysis:
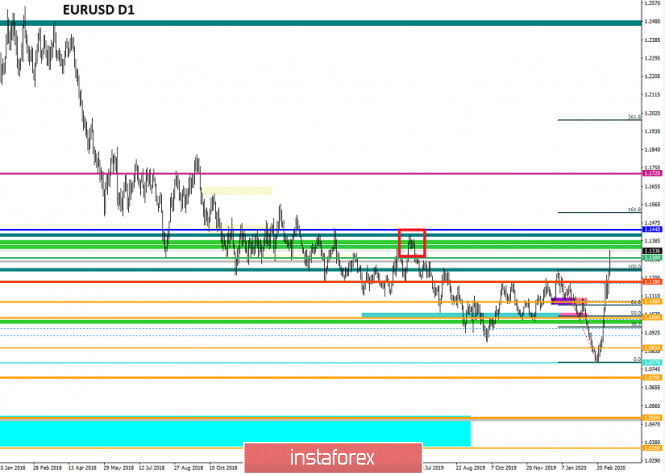
EUR has been trading strongly to the upside the we got the breakout of multi pivot resistance at 1.1234, whic is stong sign of the buyers dominance. Due to strrong momentum tot he upside, I would watch for the buying on the dips using the hourly or 4H time-frarme charts. Main daily upward targets are set at the price of 1.1402 and 1.1443. Stochastic oscillator is showing strong bull condition and the overbought zone. Major resistance is set at 1.1400. Support level is set at the price of 1.1234 The material has been provided by InstaForex Company - www.instaforex.com |
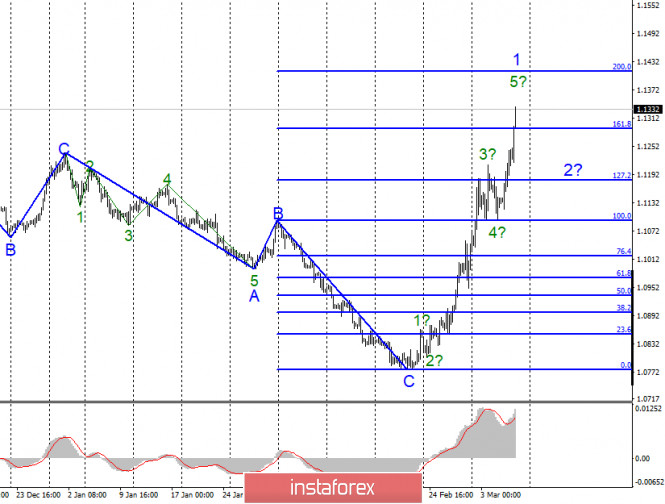
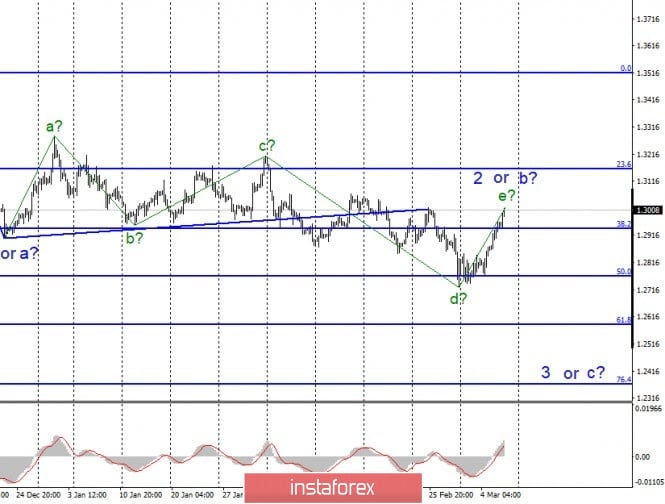
| Posted: 06 Mar 2020 04:24 AM PST EUR/USD On March 5, the EUR/USD pair gained about 100 base points and continues to build an upward wave as part of a new upward trend section. Presumably, wave 1. The current wave layout is complicated, as wave 1 becomes too extended. It is difficult to see 5 waves inside it, but even with this layout, wave 1 should end soon. However, along with the completion of its construction, I see a continued increase in the instrument's quotes. Today, the markets did not even need to wait for news to continue buying the euro. Fundamental component: There was no news background for the EUR/USD instrument on March 5. No particularly important news, no economic reports, no important speeches or comments. Thus, the market took a pause and a corrective wave 4 was built inside wave 1. However, today, on Friday, when several economic publications were scheduled in America, the markets did not even wait for them and again rushed up. At the moment, the tool has added another 90 points. I don't even think that this is the reaction of the markets to the expectations of the US reports. Most likely, the reports have nothing to do with it. Just a panic mood continues to remain in the markets, which leads to such movements. Nevertheless, the unemployment rate, Nonfarm Payrolls, and US payroll data will be released in a few hours. Given the amplitude of trading in the first half of the day, it is unlikely that the American news will be able to affect anything. However, the Nonfarm report is very important for the US government, the Fed, and currency markets. Thus, the dollar's chance in the second half of the day is a strong Nonfarm. If the report turns out to be weak, then the markets will have another reason to continue making purchases of the euro. Although without reason, the euro has already added more than 550 basis points since February 20. The absolutely unprecedented growth of the euro. General conclusions and recommendations: The euro/dollar pair is presumably continuing to build a new ascending section. Based on the current wave layout, wave 1 continues its construction. Thus, I still recommend waiting for wave 2 to be completed and buying the tool only after wave 3 starts building. GBP/USD The GBP/USD pair gained about 85 basis points on March 5. Thus, the current wave markup once again required adjustments and additions. Now the wave d is very complicated, and the instrument is presumably within the wave 2 or b. However, the wave pattern may become more complicated. If the current wave markup is correct, then after the completion of wave e, the decline will resume within the long-awaited wave 3 or C. However, given the news background, the wave markup may become more complex. Fundamental component: The news background for the GBP/USD instrument on Thursday was only in the speech of Bank of England Chairman Mark Carney, who will leave his post in 10 days. However, for now, it is Carney who runs the British Central Bank, so his comments would be extremely important and could affect the markets. However, Carney did not tell the markets anything interesting, although he was expected to comment on the Central Bank's plans for the next meeting. After all, everyone is interested in the answer to the question: will the Bank of England follow the example of the Fed? The UK economy has long felt weak due to Brexit. Now the raging coronavirus has had a strong impact on supply chains, tourism, and some other industries. The IMF lowered its forecasts for global economic growth. Thus, the economy needs help, and the Bank of England can lower the rate to give it this help. But the markets did not wait for any comments yesterday. And today we can't wait for American statistics and continued to buy the British after the euro. General conclusions and recommendations: The pound/dollar tool has complicated the current wave markup, which has now become even more extended. Thus, I recommend selling the instrument with targets located near the marks of 1.2584 and 1.2369, which corresponds to 61.8% and 76.4% for Fibonacci, using the new MACD signal "down" in the calculation of building a wave 3 or C. The material has been provided by InstaForex Company - www.instaforex.com |
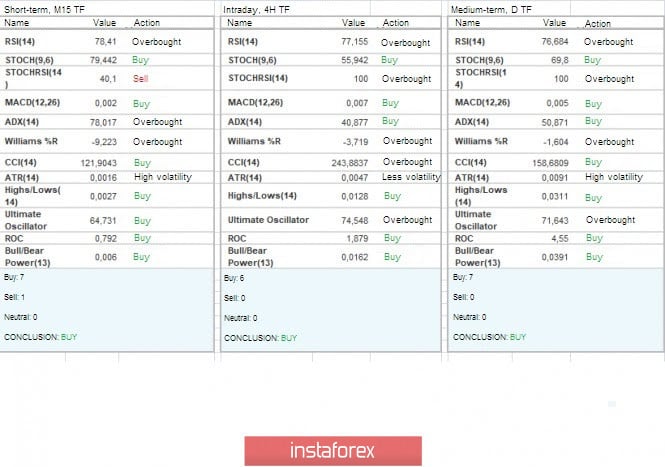
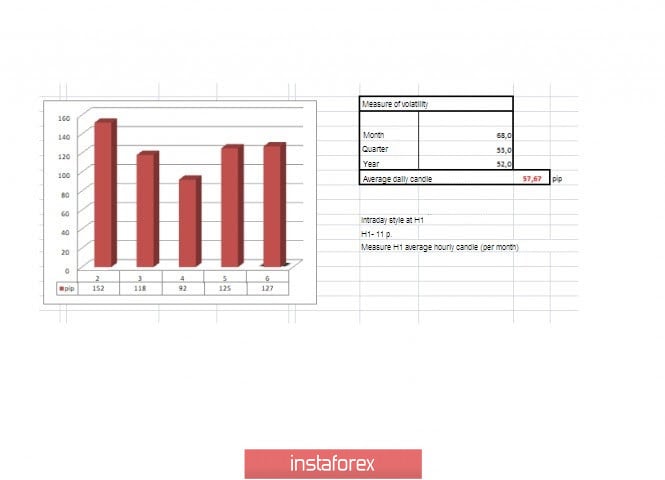
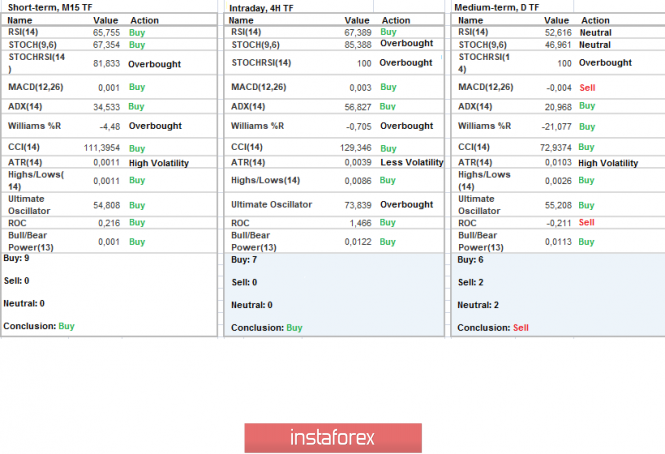
| Trading recommendations for EURUSD pair on March 6 Posted: 06 Mar 2020 04:19 AM PST From a comprehensive analysis, we see that inertia has resumed its upward course, where the status of the medium-term trend is at risk. Now about the details. The 60-hour stop was not in vain. The bulls or rather the FOMO dependent ones managed to resume the upward movement, which led to the price approaching the peak of the correction on December 31 (1.1239) and as a result, a breakdown. In fact, we received a signal of a possible change in the medium-term trend, where if the price passes higher than 1.1400, this signal will get real ground for discussion. In all this, it is striking that such a significant change, based on statistics, takes considerable time. In our case, everything happened in 11 trading days. If we have such a strong acceleration, then the movement has the appearance of inertia, but when we have such a high rate of change, we are faced not only with inertia, but also with FOMO, and with an external background that does not allow us to think sensibly. "Hamster fuss" – this is how you can describe everything that is happening at this time with the European currency, since the problems of the EU have not gone away, and the locomotive jerked without a driver. What should we do? First, do not give in to panic. Second, keep your finger on the pulse of the market. Third, prepare for an ice shower for hamsters that will lead to a reverse move. Now we are not talking about trends, we are in a maelstrom of events, and the most important thing is not to drown. In terms of volatility, we see activity that should not have been for the euro/dollar pair, with such a long hold. Thus, the fact of FOMO and excessive noise is once again confirmed in the market. Volatility details: Thursday-127 points; Friday-102 points; Monday-152 points; Tuesday-118 points; Wednesday-92 points; Thursday-125 points. The average daily indicator, relative to the dynamics of volatility - 57 points (see the volatility table at the end of the article). Analyzing the past day by the minute, we see that after the breakdown of the upper limit of the consolidation of 1.1120/ 1.1145, the upward movement resumes, which leads to inertia and convergence with the maximum of December 31. As discussed in the previous review, traders are faced with a return to the framework of the recent flat, but this did not happen. Working on the noise and panic in local buy positions is a more attractive idea. Looking at the trading chart in general terms (the daily period), we see just a vertical move. Without corrections and significant rollbacks, the value of all this is more than 500 points. If we switch to a weekly chart, similar activity was last seen in 2015. The news background of the previous day included data on applications for unemployment benefits in the United States, where they almost coincided. The growth of applications +4 thousand: Primary -3 thousand; Repeated +7 thousand. At the same time, data on US production orders were released, where they recorded a decline of 0.5%. The market's reaction to the statistics was somewhere inside the immense noise. In terms of the general information background, we have a kind of hysteria in the media, where they are already actively discussing another possible Fed rate cut at the upcoming meeting on March 17-18. The created background leaves no chance for market recovery when the ECB meeting is still on the nose, with big and fat questions in the regulator's action plan. In turn, the head of the Dallas Federal Reserve, Robert Kaplan, says that further rate cuts depend on the rate of spread of the coronavirus in the United States, which further alarms the market. "The number of new cases of coronavirus infection will be a key factor, which, at a minimum, I will use when making a decision on whether... should we lower the rate even further at the Fed meeting, which will take place from March 17 to 18. Kaplan added that the usual economic data, which the Fed usually relies on when deciding on the rate level, is not very useful in such a rapid development of the situation," said the head of the Dallas Fed We conclude the column with news from Brussels, where the EU's chief Brexit negotiator Michel Barnier summed up the first phase of negotiations between Europe and the UK. So he believes that the first round was successful, the goal to build a close partnership with Britain was set, as well as the launch of 11 negotiations in various areas. Of course, the process does not expect to be easy, there are differences. Now the second phase of Brexit negotiations has already started, says Michel Barnier. Today, in terms of the economic calendar, we have a report from the Department of Labor in the United States, where they expect that 165,000 new jobs will be created in the non-agricultural sector, compared with the previous period, where 225,000 were created. At the same time, we will get data on the unemployment rate, where no changes are expected, as well as indicators for the average hourly wage, with a possible slowdown from 3.1% to 2.9% This is not the best for the dollar, but due to the active growth of the euro, the confidence that with the release of statistical data for the US, the euro will fly into the stratosphere. The upcoming trading week in terms of the economic calendar has one of the most interesting events for Europe - the ECB meeting, where, in view of past events, you can expect everything and even more. In terms of macroeconomic data, we have the final data of EU GDP and inflation data from the United States. The most interesting events displayed below: On Tuesday, March 10 EU 11:00 London time - GDP: Prev 0.9% ---> Forecast 1.2% On Wednesday, March 11 USA 13:30 London time - inflation On Thursday, March 12 ECB meeting, followed by a press conference EU 11:00 London time - industrial output (y/y) (Jan) USA 14:30 London time - applications for unemployment benefits Further development Analyzing the current trading chart, we see FOMO in all its manifestations, where the quote has already managed to rise above the mark of 1.1300, and the volatility already exceeds the average daily norm by half. In fact, this is a kind of emotional move that does not pay attention to the technical factor, including the overheating of long positions. It is worth considering that ignoring overheating only leads to an aggravation of the consequences, and you need to be prepared for this. Now we still have the final peak on the way to the area of 1.1400/1.1440, which signals a possible change in the trend. In terms of emotional mood, we see that the lost profit syndrome has not gone away, and hamsters are still pouring positions into an emotional glass. Detailing the available period every minute, we see that the round of long positions was set at 10:00, where during this time we have already managed to touch the value of 1.1337. In turn, traders expected a similar development at the breakdown of the maximum on December 31. I am sure that many are sitting in long positions. The most important thing is not to sit in them. It is likely to assume that the emotional move will soon slow down, where a pullback below 1.1300 will be formed, which will signal the closing of long positions in this period. Until this happens, we should not rule out a further move towards 1.1400/1.1440. Based on the above information, we will output trading recommendations: - Buy positions are already underway, where the fixations were at the level of 1.1300, and subsequent interaction points are located in the area of 1.1400-1.1440. - Sell positions are considered when the trading interest changes, just at the time of fixing long positions. It all depends on where we are at the moment. For example, if this moment comes now, the entry is made lower than 1.1295. Indicator analysis Analyzing different sectors of timeframes (TF), we see that the indicators of technical instruments are subject to the same FOMO syndrome, where there is a buy signal relative to all the main time intervals. Volatility for the week / Volatility Measurement: Month; Quarter; Year. The volatility measurement reflects the average daily fluctuation from the calculation for the Month / Quarter / Year. (March 6 was based on the time of publication of the article) The volatility of the current time is 127 points, which is already higher than the daily average by 122%. It is likely to assume that a slowdown will occur soon, where the rest of the day will be expressed in a movement in the available amplitude. Key levels Resistance zones: 1.1440; 1.1550; 1.1650*; 1.1720**; 1.1850**; 1.2100. Support zones: 1.1300; 1.1180; 1.1080**; 1.1000***; 1.0950**; 1.0850**; 1.0775*; 1.0700; 1.0500***; 1.0350**; 1.0000***. * Periodic level ** Range level *** Psychological level ***** The article is based on the principle of conducting a transaction, with daily adjustments. The material has been provided by InstaForex Company - www.instaforex.com |
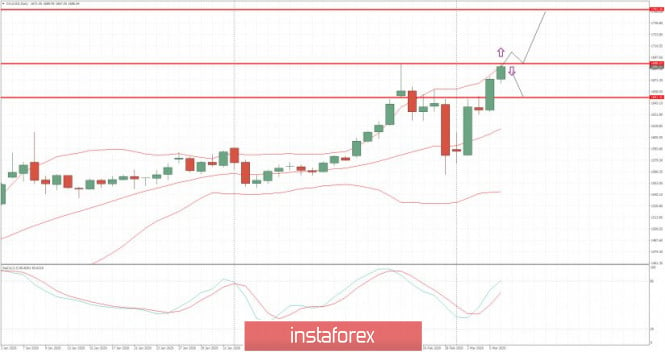
| Posted: 06 Mar 2020 04:13 AM PST Technical analysis:
Gold has been trading upwards towards the main resistance pivot at the price of $1.686. Due to strrong momentum tot he upside, I would watch for the breakout of $1.690 to confirm further upside movements towards $1.752. The eventual rejection of the pivot at $1.390 may lead us for test of $1.651. Stochastic oscillator is showing fresh bull cross, which is sign for the bullish condition. Major resistance is set at $1.690. Support level is set at the price of $1.651 The material has been provided by InstaForex Company - www.instaforex.com |
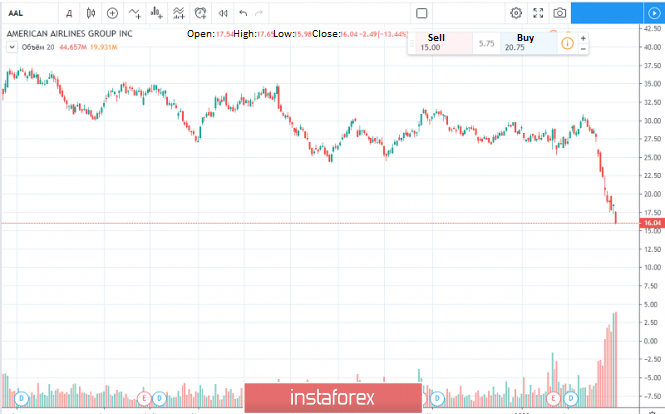
| Posted: 06 Mar 2020 03:14 AM PST As President Trump is considering travel bans to countries with high levels of coronavirus infection, Americans have found it difficult to stay close to their homes for spring and summer vacations. Even though the demand for booking tickets on American, JetBlue, Delta and Alaska Airlines has decreased, the ban has not taken effect yet. Kenny Dichter, CEO of Wheels Up, said that at the moment, the demand for private aviation has increased globally because of the coronavirus outbreak. "Wheels Up's individual demand, corporate demand, as well as interest in our program, have increased ever since the corona report was published," he stated. Of course, most people can't afford to use private planes. Moreover, the cost of Wheels Up flights varies depending on the type of aircraft, as well as on the duration of the flight. For example, according to Dichter, the cost of a trip of seven or eight businessmen from New York to Washington, D.C., will range from $ 400 to $ 500 per seat. For larger aircraft, the cost may increase to 9-12 thousand dollars per hour. Dichter also shared that Wheels Up's addressable market employs several million people, consisting mostly of companies that earn between $ 10 and $ 20 million a year. Nevertheless, most people refuse to travel by air. Along with the performance of America and the collapse of most stocks, European stocks are also declining due to the virus alert. Warren Buffett's Berkshire Hathaway investment holding has lost $3 billion because of the declining airline shares. Moreover, Air carrier Flybe has declared bankruptcy yesterday, amidst the declining demand for air travel. Shares of American Airlines also plummeted shares plummetted. Stock markets across Europe closed on Thursday, as concerns about the impact of the coronavirus outbreak persist, despite hopes that stimulus from governments and central banks could protect the global economy. The ECB will most likely lower its deposit rate next week, joining the other Central banks from US, Canada and Australia, to reduce borrowing costs. The DAX has 30 lost 183 points or 1.5%, and amounted to 11,945; The FTSE 100 has retreated 110 points, or 1.6%, and amounted to 6,705; The CAC 40 declined by 104 points, or 1.9%, and amounted to 5,361; The FTSE MIB index fell to 391 points, or 1.8%, and amounted to 21,555; The IBEX 35 dropped by 227 points, or 2.6%, and amounted to 8,683. The material has been provided by InstaForex Company - www.instaforex.com |
| Evening review on EUR/USD on March 6, 2020. The euro is rising, whereas the dollar is falling Posted: 06 Mar 2020 03:00 AM PST
EUR/USD. Daily chart. The euro has reached 1.1304. Obviously, stops above 1.1280 worked. This is a good bid for a trend against the dollar: the dollar is falling against the franc, the yen, and the pound. The situation is partly caused by the Fed's rate cut. Keep buying from 1.1100. Expect a strong pullback in the daily scale. The US employment report will be released at 14:30 London time. The material has been provided by InstaForex Company - www.instaforex.com |
| Market review. Trading ideas. Q&A Posted: 06 Mar 2020 02:06 AM PST Trading recommendations: USDCAD - sell deals are to 1.33 The material has been provided by InstaForex Company - www.instaforex.com |
| Trading recommendations for GBP/USD pair - prospects for further movement Posted: 06 Mar 2020 02:01 AM PST From the point of view of complex analysis, we see a movement within the range of 1.2770 // 1.2885 // 1.3000, and now let's talk about the details. The price development within the main borders has not gone away, the quote is still moving from one frame to another, while the activity is above average. If we make a reference to the laws of the past, then moving towards the frame of 1.3000 is no longer surprising, and the levels themselves have become floating, where minor corrections in their location are not exempted. In turn, focusing the price on the area of 1.2770 / 1.3000 confirms the fact that the proper volume of short positions has been maintained, and if we send it to the EUR/USD market counterpart, we will see how the correlation between trading instruments sharply subsided, which confirms the downward theory development once again. Thus, in order for the theory to fail, as it happened on the euro / dollar pair, we need to return at least to the area of 1.3200, and preferably higher. To confirm the theory of downward development and the transition to a new level, quotes need to overcome the range of 1.2770 // 1.2885 // 1.3000 in a downward direction and focus lower than 1.2725. In terms of volatility, we see a stable acceleration, which cannot but rejoice with speculators, since the average daily value is systematically exceeded by the daily candlestick, in this case by 11%. Details of volatility: Tuesday - 103 points; Wednesday - 115 points; Thursday - 86 points; Friday - 193 points; Monday - 110 points; Tuesday - 102 points; Wednesday - 102 points; Thursday - 107 points. The average daily indicator, relative to the dynamics of volatility is 96 points [see table of volatility at the end of the article]. Detailing minute by minute, we see that the round of upward movement came at the start of the European session and lasted until the end of the trading day. As discussed in the previous review, intraday traders worked at local long positions even at a breakdown of the 1.2850 flat border, fixation points were in the region of 1.2910–1.2945. Looking at the trading chart in general terms [the daily period], we see that the medium-term upward trend is still active. You should not forget that the recovery relative to this trend will come only after passing the level of 1.2725. Now, we are talking about changing the clock component relative to the period earlier at the end of last year. The news background of the past day contained data on applications for unemployment benefits in the United States, where the expectations were almost the same. They were waiting for the growth of applications by 5 thousand, received + 4 thousand: Primary -3 thousand; Repeated +7 thousand. At the same time, data were released on US production orders, where they recorded a decline of 0.5%. The reaction of the market to statistics was not in favor of the US dollar, as was the general market background. In terms of general informational background, we have to finish the first phase of negotiations on trade interactions after Brexit, which were quite ambitious. So, according to Michel Barnier, the EU's chief negotiator for Brexit, the first round of negotiations was very intense and aimed at completely restructuring the close cooperation between Europe and the United Kingdom on a new legal basis. "Our goal is to build a close partnership with the United Kingdom in the field of economy and security, to create a free trade zone covering all goods and services without duties and quotas. We launched 11 areas of negotiations with Great Britain in various areas, with the exception of foreign policy and defense, since the British side informed us that it does not want to discuss these topics. We will remain open to discuss them in the future, if the UK wants it." Michel Barnier said at a press conference on Thursday At the same time, Mr. Barnier outlined four main blocks of disagreement, which included issues such as legally binding general rules in the field of competition and business regulation; refusal to accept obligations to implement the European Convention on Human Rights; refusal of information on various fields of cooperation into one association agreement; fishing issues. As we see, the front of work is great and the parties are already moving to the second phase of negotiations on Brexit. Today, in terms of the economic calendar, we have a report from the Department of Labor in the United States, where it is expected that only 165,000 new jobs will be created in the non-agricultural sector compared to the previous period, where 225,000 were created. At the same time, we will receive data on unemployment rate, where no changes are expected, as well as hourly average wage indicators with a possible slowdown from 3.1% to 2.9% If the forecasts are confirmed, the dollar may come under pressure. The upcoming trading week does not have a wide flow of statistics, but, as practice has shown, unplanned noise can be much more interesting and useful. From the main events, we have the final inflation data in the United States, as well as the ECB meeting. The most interesting events displayed below ---> Wednesday, March 11 Great Britain 9:30 Universal time - Volume of industrial production (YoY) (Jan) USA 12:30 Universal time - Inflation: Prev 2.3% Thursday, March 12 ECB meeting, followed by a press conference USA 13:30 Universal time - applications for unemployment benefits Further development Analyzing the current trading chart, we see that the quote has almost reached the upper boundary of the range 1.2770 // 1.2885 // 1.3000, where it does not exclude a temporary passage of the frame, as we wrote above. In fact, the risk of violating the theory of downward development is still negligible, and so there is no need to worry. Now, the main point is how the quote will behave within the level of 1.3000 and how strong the puncture will be and when the reverse move will occur. All these issues will be analyzed gradually, along with the course of the market. From the point of view of the emotional mood, we see that the information background puts pressure on speculators, which leads to a surge in activity and, as a fact, to high volatility. By detailing the time interval we have, we see that the night slowdown of 1.2945 / 1.2967 was broken with the arrival of Europeans on the market, but activity is still low. In turn, intraday traders carefully analyze the behavior of quotes, considering the rise in price to the level of 1.3000. The next step will be to monitor fluctuations around the level of 1.3000, with a possible rebound from it. Having a general picture of actions, we see that external noise puts pressure on the American currency, which leads to its weakening on all fronts. The movement towards 1.3000 is now something normal, but the next steps will depend on the behavior of the quote and whether it will be able to return to the area of the range border with a move towards 1.2885–1.2770. Based on the above information, we derive trading recommendations: - Local purchase positions, if any, are directed towards 1.3000–1.3020. - Sales positions are considered later after a distinct slowdown, possibly within the level of 1.3000. Indicator analysis Analyzing a different sector of timeframes (TF), we see that the indicators of technical instruments relative to all the main periods signal purchases due to the return of the price to the area of the level of 1.3000. Volatility per week / Measurement of volatility: Month; Quarter; Year Measurement of volatility reflects the average daily fluctuation, calculated for Month / Quarter / Year. (March 6 was built taking into account the time of publication of the article) The current time volatility is 36 points, which is a low indicator for this time section. It is likely to assume that the market background and external noise will put pressure on speculators, which will result in increased activity. Key levels Resistance Zones: 1.3000; 1.3170 **; 1.3300 **; 1.3600; 1.3850; 1.4000 ***; 1.4350 **. Support Areas: 1.2885 *; 1.2770 **; 1.2700 *; 1.2620; 1.2580 *; 1.2500 **; 1.2350 **; 1.2205 (+/- 10p.) *; 1.2150 **; 1,2000 ***; 1.1700; 1.1475 **. * Periodic level ** Range Level *** Psychological level **** The article is built on the principle of conducting a transaction, with daily adjustment The material has been provided by InstaForex Company - www.instaforex.com |
| AUD/USD trendline breakout with pullback completed. Drop now imminent! Posted: 06 Mar 2020 01:45 AM PST
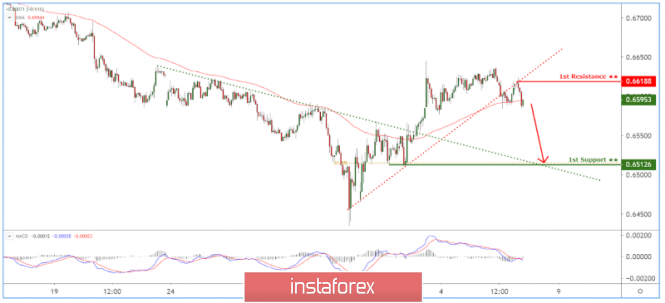
Trading Recommendation Entry: 0.65953 Reason for Entry: Moving average resistance Take Profit :0.65126 Reason for Take Profit: 61.8% Fibo retracement Stop Loss: 0.66188 Reason for Stop loss: Horizontal swing high The material has been provided by InstaForex Company - www.instaforex.com |
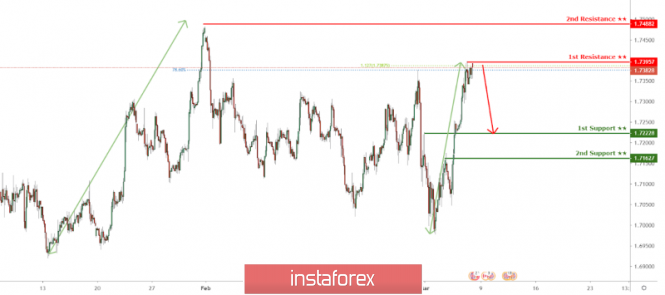
| GBP/CAD approaching resistance, potential drop! Posted: 06 Mar 2020 01:43 AM PST
Trading Recommendation Entry: 1.73957 Reason for Entry: Horizontal swing high,78.6% Fibonacci retracement,127% Fibonacci extension Take Profit : 1.7228 Reason for Take Profit: Horizontal pullback support Stop Loss: 1.74882 Reason for Stop loss: Horizontal swing high resistance The material has been provided by InstaForex Company - www.instaforex.com |
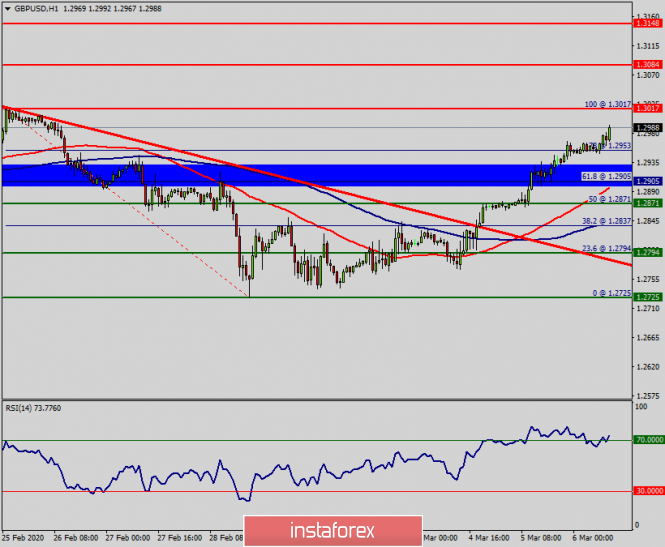
| Technical analysis of GBP/USD for March 06, 2020 Posted: 06 Mar 2020 01:43 AM PST Overview: The resistance of GBP/USD pair has broken; itturned to support around the price of 1.2905 yesterday. Thereby, forming a strong support at 1.2905. The level of 1.2905 coincides with the golden ratio (61.8% of Fibonacci retracement) whichis acting as major support today. Another thought; the Relative Strength Index (RSI) is considered overbought because it is above 70. At the same time, the RSI is still signaling an upward trend, as the trend is still showing strong above the moving average (100), this suggests the pair will probably go up in coming hours. Accordingly, the market will probably show the signs of a bullish trend. In other words, buy orders are recommended above 1.2905 level with the first target at the level of 1.3017. From this point, the pair is likely to begin an ascending movement to the point of 1.3084 and further to the level of 1.3103. The price of 1.3103 will act as a strong resistance and the double top has already set at the point of 1.3017. On the other hand, if a break happens at the support of 1.2905, then this scenario may become invalidated. The material has been provided by InstaForex Company - www.instaforex.com |
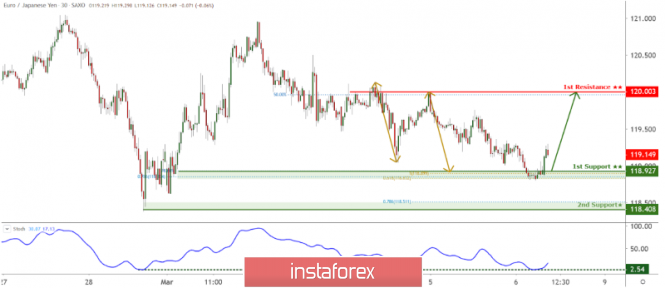
| EUR/JPY bouncing nicely off support, potential for further rise! Posted: 06 Mar 2020 01:41 AM PST
Trading Recommendation Entry: 118.927 Reason for Entry: 78.6% fibonacci retracement, 100% fibonacci extension Take Profit : 120.003 Reason for Take Profit: Horizontal swing high resistance, 50.0% fibonacci retracement Stop Loss: 118.408 Reason for Stop loss: Horizontal swing low support The material has been provided by InstaForex Company - www.instaforex.com |
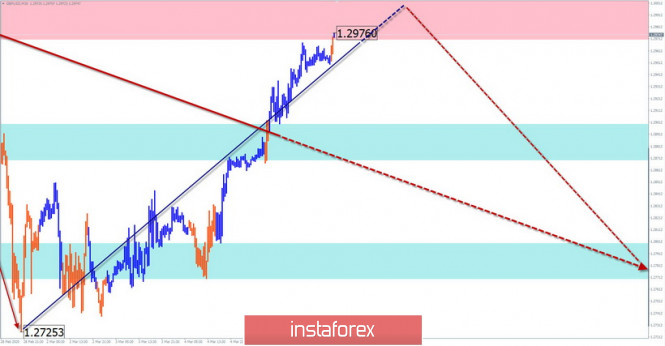
| Instaforex Daily Analysis - 6th Mar 2020 Posted: 06 Mar 2020 01:28 AM PST Today we take a look at GBPUSD and how we can use Fibonacci retracements, Fibonacci extensions, market momentum, trend lines and support/resistance to play this move. The material has been provided by InstaForex Company - www.instaforex.com |
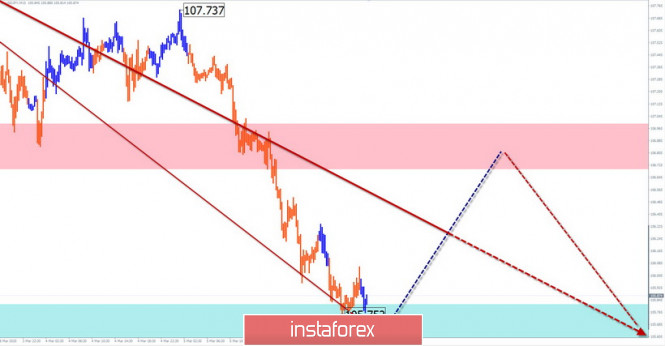
| Simplified wave analysis of GBP/USD, USD/JPY, and USD/CHF on March 6 Posted: 06 Mar 2020 01:18 AM PST GBP/USD Analysis: The direction of short-term fluctuations in the pound is set by the descending wave algorithm from December 13. The first parts (A-B) are formed in its structure. Over the past week, the price formed a correction in the last part (C). The lower limit of the preliminary zone of potential reversal has been reached. Forecast: In the coming trading sessions, it is expected that the price rise will be completed, a reversal will be formed, and the price decline will begin. The time of the reversal can be linked to the time of the release of important news blocks from the United States. A change in direction may be accompanied by a sharp increase in volatility. Potential reversal zones Resistance: - 1.2970/1.3000 Support: - 1.2900/1.2870 - 1.2800/1.2770 Recommendations: Purchases of the pound in the near future is not advisable. We recommend that you focus on finding sales signals.
USD/JPY Analysis: As a result of the rapid price decline of the main pair, the Japanese yen has significantly strengthened against the US currency over the past 2 weeks. The formed wave has a strong reversal potential. By now, the price has reached the upper limit of the strong support zone. Forecast: It is unlikely that the current support level can be broken without a correction. In the coming days, you can expect a rise in the price rate. Today, we expect the formation of a reversal and the beginning of the price move up. Potential reversal zones Resistance: - 106.70/107.00 Support: - 105.80/105.50 Recommendations: Selling the yen today can be risky. It is recommended to refrain from trading during the upward trend and look for sell signals at the end of it. Intraday supporters can make short-term purchases of the tool with a reduced lot.
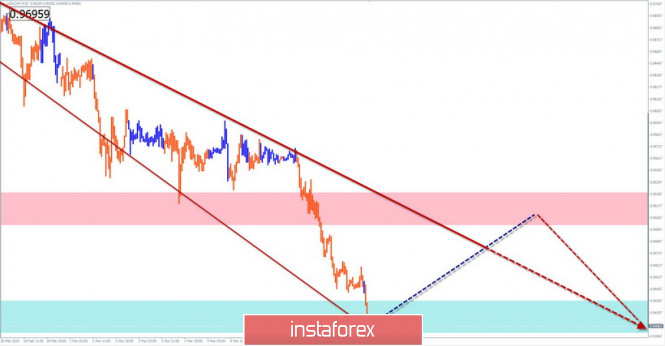
USD/CHF Analysis: The Swiss franc chart is dominated by a bearish trend sentiment. The wave started in April last year. Its last section started on February 20. The price has reached the upper limit of the intermediate support zone. Forecast: It is likely that the current zone can give rise to a counter price correction. The decline is expected to be completed in the next sessions. At least the pair expects a "sideways" today. An upward vector is possible. When changing the course, a puncture of the lower support zone is not excluded. Potential reversal zones Resistance: - 0.9500/0.9530 Support: - 0.9430/0.9400 Recommendations: The dominant trend direction makes the sale of the franc promising. In the coming day, trading on the pair's market can be very risky and lead to losses. It is wiser to refrain from entering into transactions. In the area of the resistance zone, it is recommended to track emerging sell signals.
Explanations: In the simplified wave analysis (UVA), waves consist of 3 parts (A-B-C). The last incomplete wave is analyzed. The solid background of the arrows shows the formed structure and the dotted background shows the expected movements. Note: The wave algorithm does not take into account the duration of the tool's movements in time! The material has been provided by InstaForex Company - www.instaforex.com |
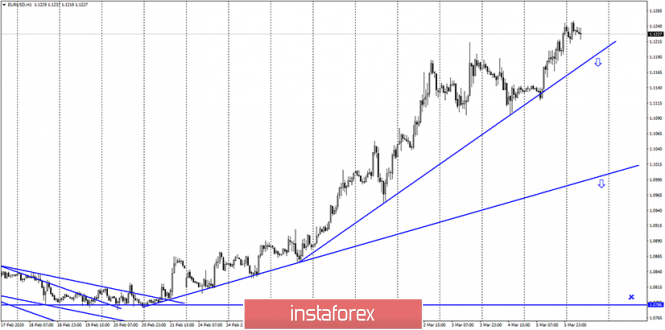
| Posted: 06 Mar 2020 01:18 AM PST EUR/USD – 1H.
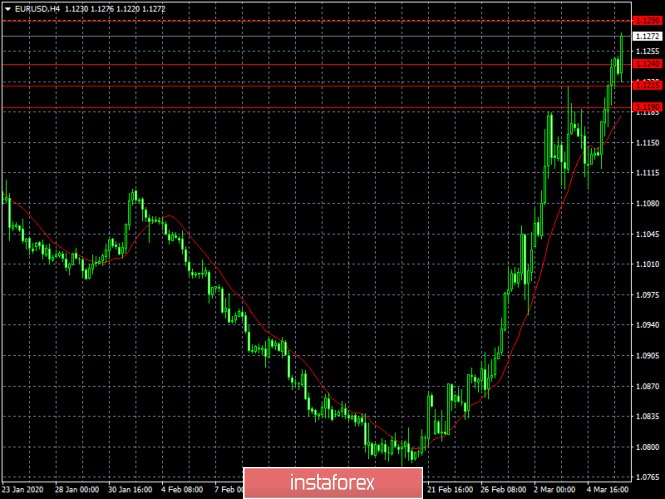
Hello, traders! The EUR/USD pair continues the growth process on the hourly chart. After performing a fall to the upward trend line, the pair's quotes performed a reversal in favor of the European currency and resumed growth. The second trend line continues to define the current mood of traders as "bullish". Closing the pair's rate below this line will work in favor of the US currency and some fall in the direction of the first upward trend line. EUR/USD – 4H.
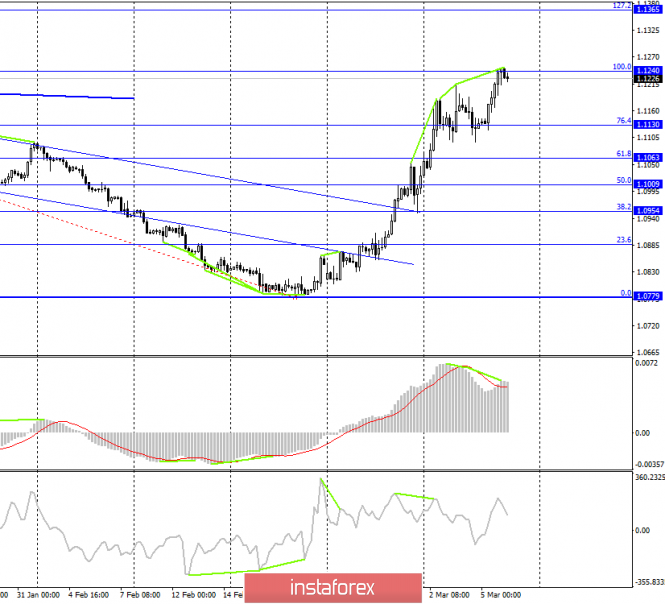
As seen on the 4-hour chart, quotes of the euro/dollar pair performed a reversal in favor of the euro after a release from the corrective level of 76.4% (1.1130) and renewed growth process, having worked out the Fibo level of 100.0% (1.1240) by the end of the day. The bearish divergence of the MACD indicator (the third in a row) again warns of a reversal of the pair in favor of the US dollar and some drop in quotes towards the level of 76.4%. Rebound of the pair from the level of 100.0% will similarly work in favor of the beginning of the fall. Closing the pair above the 100.0% Fibo level and passing the divergence peak will significantly increase the probability of continuing growth towards the next corrective level of 127.2% (1.1365). EUR/USD – Daily.
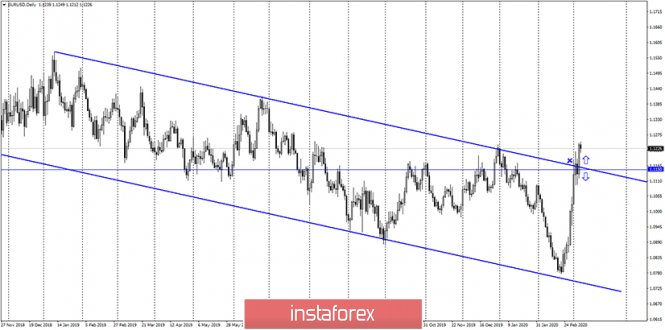
As seen on the daily chart, the euro/dollar pair performed a consolidation over the downward trend corridor. Thus, the global mood of traders has changed to "bullish". In the long term, we can now expect growth, and in this case, the daily and weekly charts are the same. However, on the hourly and 4-hour charts, sales signals may be formed in the near future, which also does not contradict the general picture of things, since traders need to start correcting the pair. EUR/USD – Weekly.
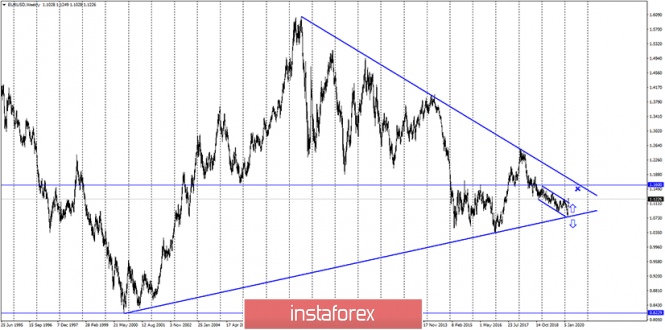
The weekly chart indicates that the potential for growth of the European currency is available, and quite strong, up to about the level of 1.1600. However, this is a weekly chart, meaning that goals can be worked on for months. The lower charts are in favor of a pullback of quotes down, after which it is quite possible to resume a more global growth of the euro. Overview of fundamentals: On March 5, one economic report was released in the US - changes in production orders, which showed a decrease of 0.5% in January. Thus, although traders had no particular reason to increase demand for the dollar, further strong growth of the euro was also not expected. Nevertheless, the pair continued to grow, despite the almost empty calendar. News calendar for the United States and the European Union: USA - unemployment rate (13:30 UTC+00). USA - change in the number of employees in the non-agricultural sector (Nonfarm Payrolls) (13:30 UTC+00). USA - change in average hourly earnings (13:30 UTC+00). Today, all the news will come from America. The most interesting report will be Nonfarm Payrolls, which predicts new jobs of 175,000. Thus, this report in the second half of the day will be the "engine" of the pair's growth or fall. COT survey (Commitments of traders):
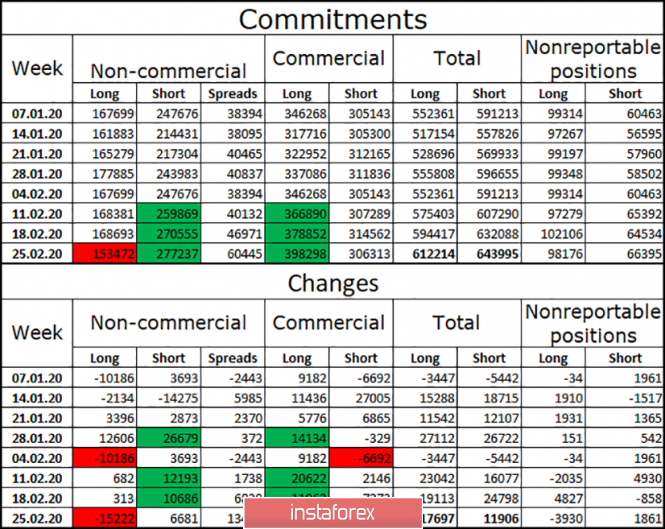
The latest COT report for the week of February 25 showed that long positions are being built up by major market players. At the same time, speculators prefer to get rid of long positions and hedgers – on the contrary, to increase them. I still conclude that the downward trend is complete. Thus, in the future, we can expect growth to 1.1600, as the weekly chart predicts. A new COT report will be released today, in which we are likely to see a new increase in long positions. At the same time, this report, combined with the background information, can help determine when to expect a correction. Forecast for EUR/USD and recommendations for traders: In this situation, even taking into account the closing of quotes above the descending corridor on the daily chart, I recommend considering closing long positions and not considering new purchases. From my point of view, this is dangerous. At the same time, the mood of traders is already "bullish", and any sales will be "against the trend". However, closing below the trend line on the hourly chart and rebounding from the level of 100.0% (1.1240) with a bearish divergence on the 4-hour chart will allow traders to expect some fall and work out these signals for sales. Terms: "Non-commercial" - major market players: banks, hedge funds, investment funds, private, large investors. "Commercial" - commercial enterprises, firms, banks, corporations, and companies that buy currency not for speculative profit, but for current operations or export-import operations. "Non-reportable positions" - small traders who do not have a significant impact on the price. The material has been provided by InstaForex Company - www.instaforex.com |
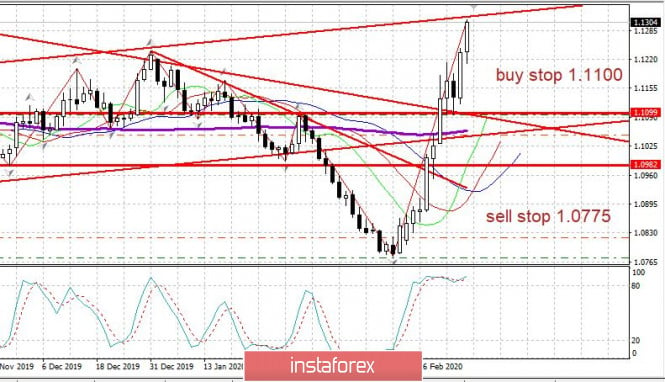
| Whatever happens (EUR/USD and GBP/USD review on 03/06/2020) Posted: 06 Mar 2020 01:18 AM PST The decision of the Federal Reserve System to urgently reduce the refinancing rate from 1.75% to 1.25% is forcing other central banks to follow suit which is primarily because of the influence that the Federal Reserve has on financial markets. And it was the understanding that other central banks would do exactly the same right now, initially and contributed to the strengthening of the dollar. However, the mood of investors somewhat changed yesterday, since the position of the European Central Bank is not entirely clear. Individual colleagues of Christine Lagarde only hint at the possibility of reducing the refinancing rate. But for the most part, the tone of argument is such that it seems that the European Central Bank will take a wait-and-see attitude and will not make hasty decisions. If we look at futures on the interest rate, then the refinancing rate of the European Central Bank should remain unchanged by the end of the year. Thus, the maximum that can now be expected from the European Central Bank is the next reduction in the deposit rate. And even then, there are still questions. In other words, one gets the feeling that the Federal Reserve has gone too far and given too much, and may be ignored. Indeed, if the European Central Bank does not reduce the refinancing rate, then the compression of the interest rate disparity makes the single European currency somewhat more interesting. And if we add to this the expectation that the Federal Reserve System will lower the refinancing rate again in the coming months to 1.00% this time, then the continued strengthening of the single European currency looks quite logical. Well, it also pulled a pound.
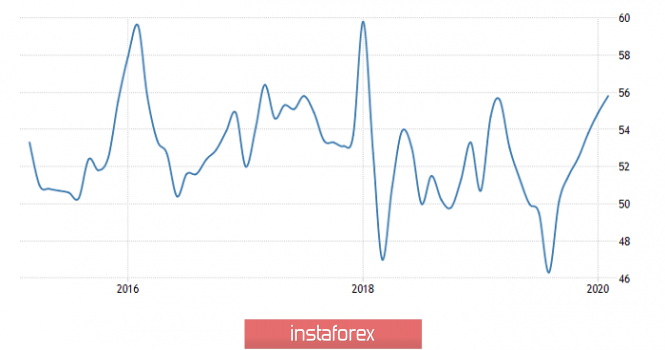
At the same time, macroeconomic statistics which were published yesterday in Europe look quite good. There is practically nothing published. However, the index of business activity in the construction sector in Germany increased from 54.9 to 55.8, although a decrease to 54.2 was predicted. Another thing is that the profitability of European government debt securities continues to go down, which still hints at a decrease in the refinancing rate of the European Central Bank. Thus, the yield on 10-year bonds in France declined from -0.11%, down to -0.32%. In Spain, the yield on 3-year bonds declined from -0.301% to -0.416%, 5-year bonds, from -0.103% to -0.260%, and for 10-year bonds, from 0.240% to 0.169%. Fortunately, 10-year papers still have a positive yield. Another thing is that the existing dynamics are clearly not encouraging, which means that investor interest in European debt securities will inevitably go down. Consequently, the observed growth of the single European currency is temporary. Construction PMI (Germany):
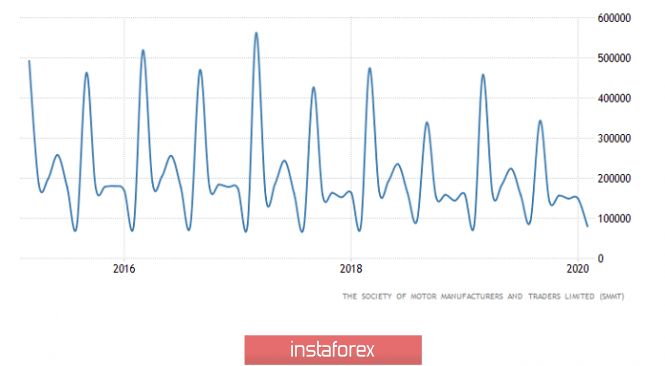
Great Britain also reported well, as the pace of decline in car sales slowed from -7.3% to -2.9%. Although it was a decline, there are still visible positive dynamics. Car Sales (UK):
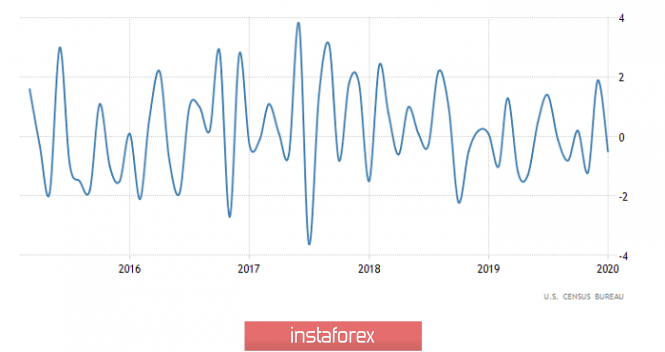
At the same time, American statistics clearly did not inspire optimism; although, the data on applications for unemployment benefits came out relatively neutral. Their total number increased by 4 thousand, which turned out to be exactly two times less than expected. But the scale of the changes, both planned and actual, are quite nice. Nevertheless, the number of initial applications for unemployment benefits decreased by 3 thousand instead of growing by 1 thousand. The number of repeated applications for unemployment benefits, which was supposed to increase by 6 thousand, increased by 7 thousand. From this picture, it must be understood that US statistics was purely negative in nature, since the volume of factory orders decreased by 0.5%, which was only expected to decrease by 0.3%. Well, since orders are reduced, then there is nothing for the industry to increase from. Factory Order Volume (United States):
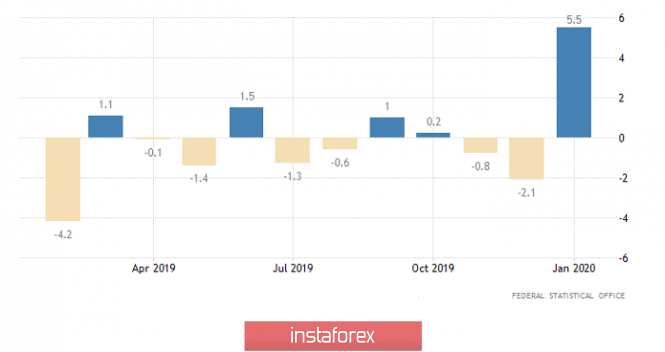
Europe has already begun to publish macroeconomic statistics, and if you look at Germany, then everything's just wonderful, because unlike the United States, the volume of factory orders increased by 5.5%. So in Germany, there is the prospect of industrial growth. But if you look at Germany's neighbors in the European Union, it becomes somehow sad. In particular, France's trade deficit increased from -4.1 billion euros to -5.9 billion euros. The situation is similar with the balance of payments, the deficit of which amounted to -2.8 billion euros against -0.3 billion euros in the previous month. Spain, which remained the only one of the largest countries in the euro area until recently, showing industrial production growth of 1.1%, reported a decline of -2.1%, and this is in annual terms. Only Italy remains retail sales growth rates in which may slow down from 0.9% to 0.7%. Thus, if you do not count Germany, then everything is bad. And you can talk as much as you like about the fact that Germany is a locomotive and everything depends only on it, but no locomotive can go somewhere if all the cars, as insane, are pulled by a stop-crane. This is exactly what is happening. Factory Orders (Germany):
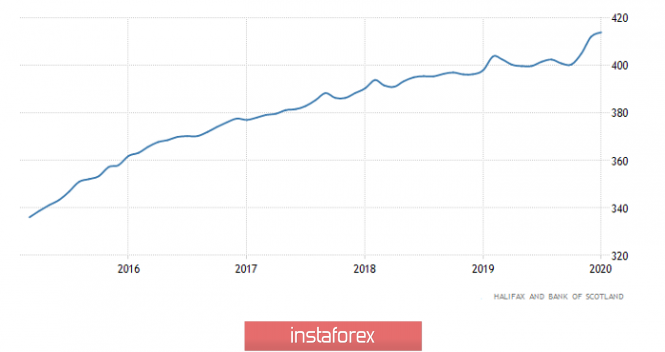
Honestly, there are about the same sad expectations for the UK, as Halifax data on housing prices should show a slowdown in their growth rates from 4.1% to 2.8%. Well, the real estate market is almost the main criterion for determining the investment attractiveness of the British economy. At the same time, if housing prices go down, then investor's interest follows. Housing prices from Halifax (United Kingdom):
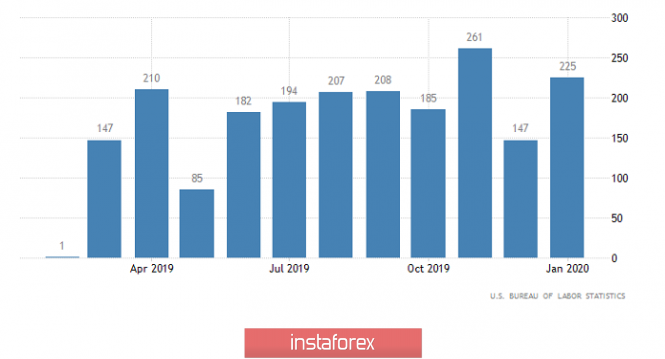
The main event of the day is the publication of a report by the United States Department of Labor, from which its content does not bring anything positive to the dollar. For this reason, both the pound and the single European currency are not rushing to decline in spite of weak macroeconomic data. True enough, the unemployment rate itself should remain unchanged, but 165 thousand new jobs will be created outside agriculture compared to 225 thousand in the previous month which is a slowdown in the creation of new jobs. Therefore, the probability of rising unemployment and a general deterioration in the situation on the labor market increases. An excellent illustration of this should be the data on average hourly wages, the growth rate of which may slow down from 3.1% to 2.9%. This fact will lead to a decrease in consumer activity and retail sales, which also reduces the prospects for the recovery of industrial production. Number of jobs created outside of agriculture (United States):
The single European currency continues to increase due to rumors and gossip. There are rumors that the Federal Reserve could repeat its recent focus and once again, lower the refinancing rate immediately by 0.5%. Nevertheless, this emotional and speculative surge can lead to the growth of the single European currency to the level of 1.1300, but just temporarily. After that, it will stabilize at 1.1250.
The pound simply ignores the rumors and gossip regarding the possible actions of the Federal Reserve System. However, the negativity of the contents of the report of the United States Department of Labor may well lead to an increase in the pound to the level of 1.3025. Nevertheless, it is noticeably overbought, and inevitably a subsequent decrease to 1.2950.
|
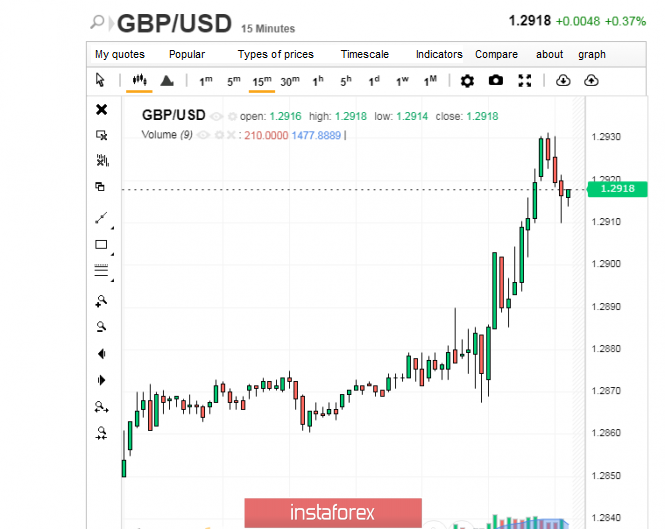
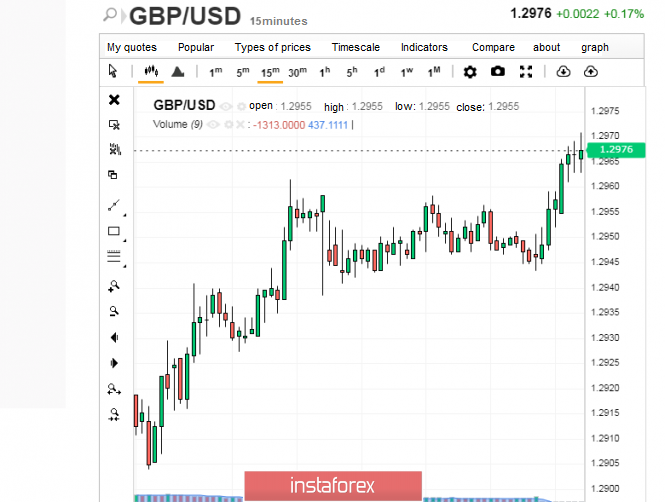
| Strength test: pound does not intend to stop Posted: 06 Mar 2020 01:10 AM PST According to analysts, the Bank of England involuntarily checks the pound for strength from time to time, offering it tests in the form of a rate reduction. However, this check was not needed this time: the regulator did not introduce incentive measures and soften the monetary policy once again, not seeing it as necessary. Thus, analysts say that this allowed the pound to continue to rise. On Thursday, March 5, the British currency strengthened against the US and European currencies. The reason for this was a weakening expectation of an immediate rate cut by the Bank of England. Many market participants feared that the regulator would follow the example of the Fed and drop rates to help the British economy counter the negative effects of the coronavirus COVID-19. The new head of the Bank of England, Andrew Bailey, admits a reduction in interest rates in the short-term, but now, he is not in a hurry to take incentive measures. He is sure that the regulator should wait to carefully analyze and evaluate the consequences of the economic blow from the COVID-19 epidemic. Thanks to the actions of A. Bailey, the pound, which dropped due to the expectation of a rate cut, was able to regain its position. On Thursday, the British currency showed steady growth after the statements of the new Governor of the Bank of England, and managed to gain a foothold in their positions. Yesterday, the pound added 0.4%, reaching 1.2918-1.2919 and ascending from the 4.5-month low of last Friday. This Friday, March 6, the GBP/USD pair is trading near the level of 1.2976. This level is considered to be a new high by the experts. The rise of the "British" currency was also facilitated by the current weakening of the dollar, which could not confidently respond to the Fed's decision. Analysts fear that if the Bank of England cuts rates further, the pound will share the fate of the dollar and will lose the track for a long time. On the other hand, experts warn that if the GBP / USD pair consolidates below the level of 1.2918, they will quickly slide to the support level of 1.2875, and if interest rates decrease, the pound will return to the lows of 1.2833 and 1.2799. The British currency may be tripped by the high probability of a trade failure between the UK and the European Union. The reason for this is the stubbornness of Boris Johnson, the British Prime Minister, who is ready to leave negotiations without a deal if Brussels will not compromise. At the same time, both sides are not opposed to concluding an agreement providing for zero tariffs. However, experts say that the deals of the EU may turn out to be unbearable for the UK. In this situation, analysts are sure that the pound will not be able to overcome the level of 1.3000. It is only possible to rise above this level when changing the position of all participants and reaching a compromise. At the moment, the pound is trading near the low of the last 4.5 months against the euro, responding to increased fears about difficult negotiations between London and Brussels. At the same time, experts do not exclude that quotes of the GBP / USD pair will be able to recover to the level of November – December 2019 by the end of March, and thus, the interest of the investors in pound will increase. The material has been provided by InstaForex Company - www.instaforex.com |
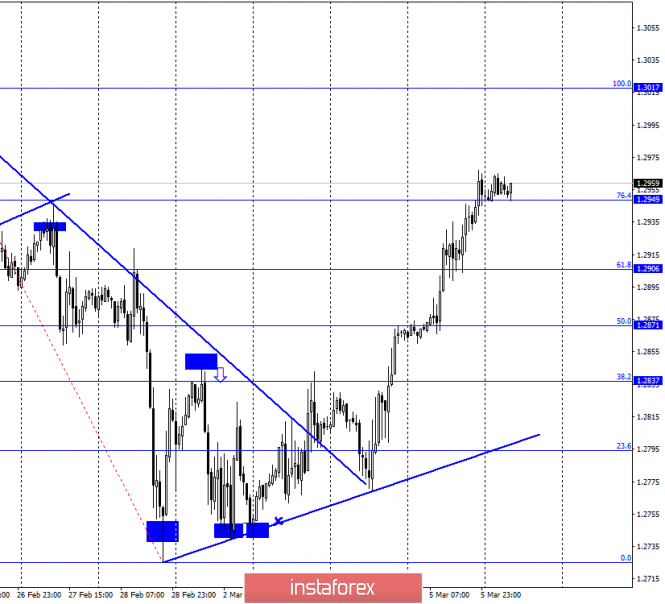
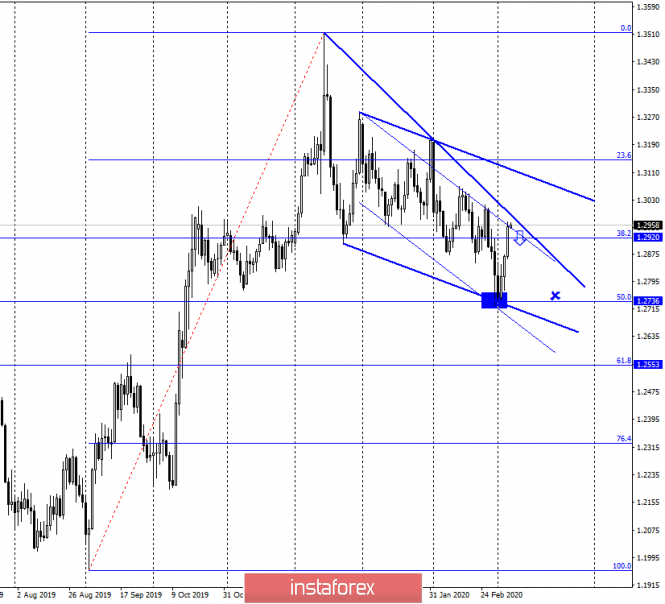
| GBP/USD. March 6. Will statistics from America stop the growth of the pound? Posted: 06 Mar 2020 01:07 AM PST GBP/USD – 1H.
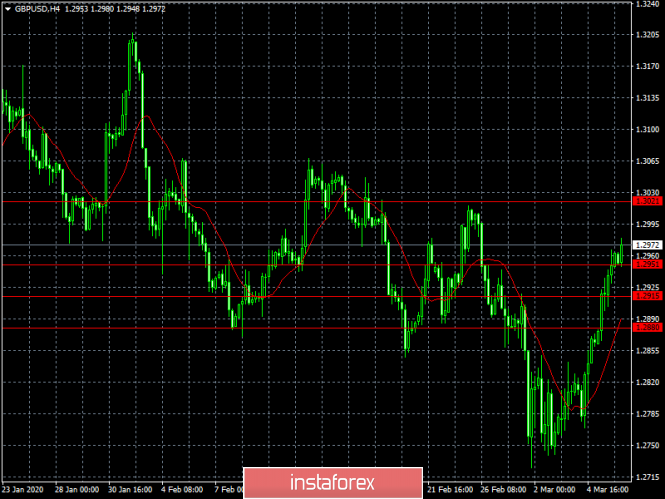
Hello, traders! According to the hourly chart, the GBP/USD pair continues the growth process and performed a consolidation above the corrective level of 76.4% (1.2949). Thus, on March 6, the growth of quotes can be continued in the direction of the next corrective level of 100.0% (1.3017). The new upward trend line continues to maintain the "bullish" mood of traders, however, the pound/dollar pair has moved away from it at a respectful distance. Fixing quotes below the Fibo level of 76.4% will work in favor of the US currency and some fall in the direction of the corrective level of 61.8% (1.2906). GBP/USD – 4H.
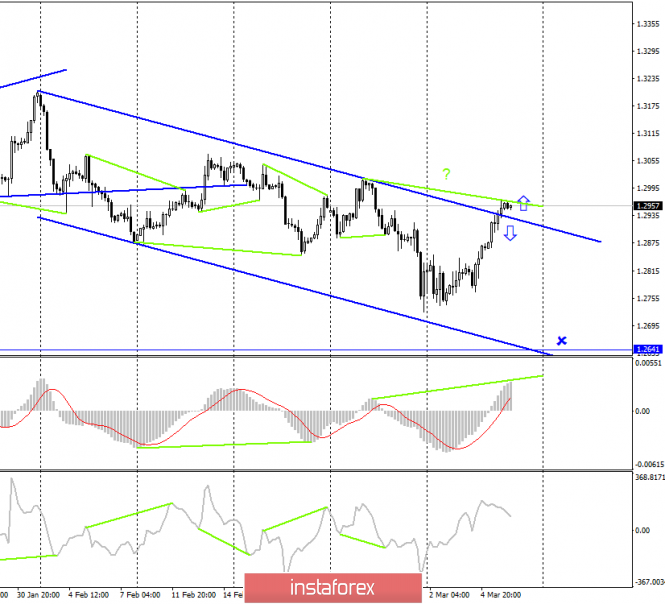
As seen on the 4-hour chart, the GBP/USD pair closed over the downward trend corridor. Thus, the expected rebound from the upper line of the corridor did not occur, and the mood of traders changed to "bullish". At the same time brewing bearish divergence at the MACD, which allows expecting a reversal in favor of the US dollar and the resumption of fall towards the level low at 1.2641. In general, I would say that the picture now on the lower charts is as ambiguous and confusing as possible. Especially, given the daily chart readings, where three graphical plots at once speak in favor of maintaining a "bearish" mood. GBP/USD – Daily.
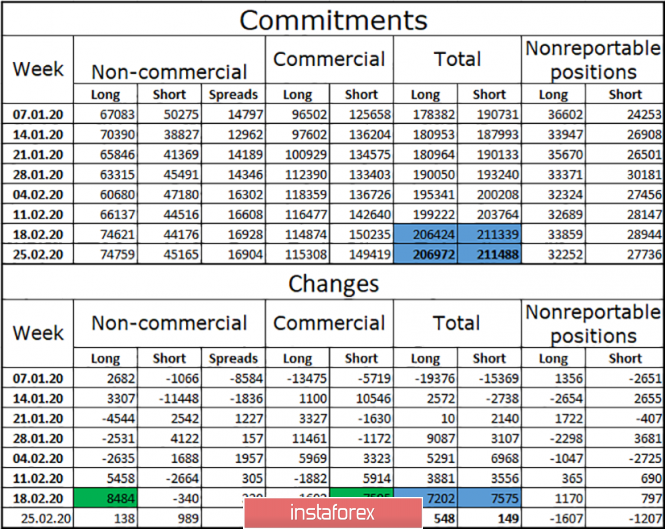
As seen on the daily chart, the graphic picture remains the most interesting. The quotes of the pound/dollar pair performed a consolidation above the corrective level of 38.2% (1.2920). Thus, the chances of continued growth increased. However, two descending trend of the corridor and the descending trend line continue to characterize the market mood as "bearish". Rebound from the upper line of the small trend corridor or trend line may work in favor of the US currency and resume the fall in the direction of the corrective level of 50.0% (1.2736). And in this case, the drop in quotes will resume on the lower charts, and the mood on them will again change to "bearish". Thus, in global terms, bears retain their leadership, so short positions look more attractive now. However, if the quotes close above the trend line, the growth process can continue in the direction of the level of 1.3086 (approximately). Overview of fundamentals: On Thursday, March 5, there was no news in the UK, except for information about the completion of the first round of negotiations under the future Brexit agreement. The parties positively noted the atmosphere and results of the negotiations, although they noted that "there is still a lot of work". The economic calendar for the US and the UK: USA - unemployment rate (13:30 UTC+00). USA - change in the number of employees in the non-agricultural sector (Nonfarm Payrolls) (13:30 UTC+00). USA - change in average hourly earnings (13:30 UTC+00). On March 6, traders will closely monitor data from America on unemployment, wages and the number of new jobs outside the agricultural sector. No news is expected from the UK. COT survey (Commitments of traders):
The latest report from February 25 shows that equality between major market participants remains. Thus, I still tend to believe that traders should not expect strong exchange rate changes from the GBP/USD pair at this time. Most likely, the auction will continue to be held in the style of "150 points up-200 down-250 up". Today, a new COT report is released, and the main intrigue is whether one or more groups will have a serious increase in long or short positions. The last report showed in principle the minimum changes for the week. Neither hedgers nor speculators had an advantage. Forecast for GBP/USD and recommendations for traders: The main trading idea is now waiting for the rebound from the trend line and the upper line of the small corridor on the daily chart. These rebounds will allow you to count on a slight drop in the pair in the direction of 1.2736 and allow traders to sell. Terms: "Non-commercial" - major market players: banks, hedge funds, investment funds, private, large investors. "Commercial" - commercial enterprises, firms, banks, corporations, and companies that buy currency not for speculative profit, but for current operations or export-import operations. "Non-reportable positions" - small traders who do not have a significant impact on the price. The material has been provided by InstaForex Company - www.instaforex.com |
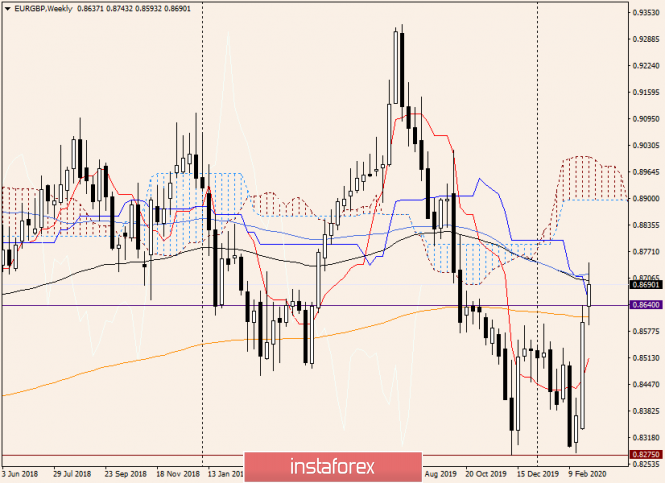
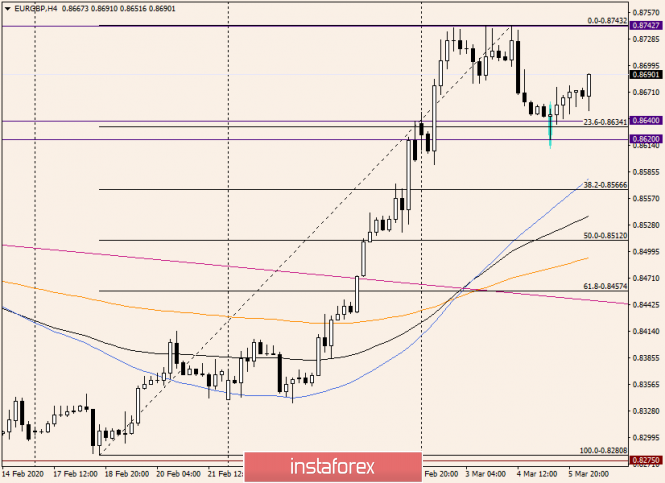
| Technical analysis for EUR/GBP on March 6, 2020 Posted: 06 Mar 2020 01:04 AM PST Good day! I decided to show you the euro/pound cross-rate, which is quite a curious picture. But first, let's briefly talk about macroeconomic indicators. No statistics are expected from Europe today, and reports on the Halifax house price index will be published from the UK at 09:30 (London time). The main event of the day, which will have an impact on all currency pairs of the Forex market, will be data on the US labor market. The publication of American labor reports for the month of February is scheduled for 14:30 (London time). Weekly
Having risen to 0.8743, the euro/pound cross-rate encountered very serious resistance. This was facilitated by the simple and 89 exponential moving averages located slightly below 50, as well as the Kijun line of the Ichimoku indicator. All the growth gained by the excessive labor of players to increase melts before our eyes. There is a long shadow at the top and the bull's body is rapidly decreasing. At the moment, the situation is such that a reversal bearish candle may be formed following the results of weekly trading. This will become real if the trades of the current five-day period close below the resistance level of 0.8640. In this scenario, you will have to state a false breakdown of this mark, and this very often leads to a change in the trend. If the week ends under the 200 exponential moving average, which runs at 0.8612, there will be little doubt about the reversal. However, it is unknown how EUR/GBP will behave after the release of American labor statistics. It is likely that the euro bulls will be able to compensate for the losses incurred from the level of 0.8743. Here, much will depend on the price dynamics of the majors: EUR/USD and GBP/USD. Daily
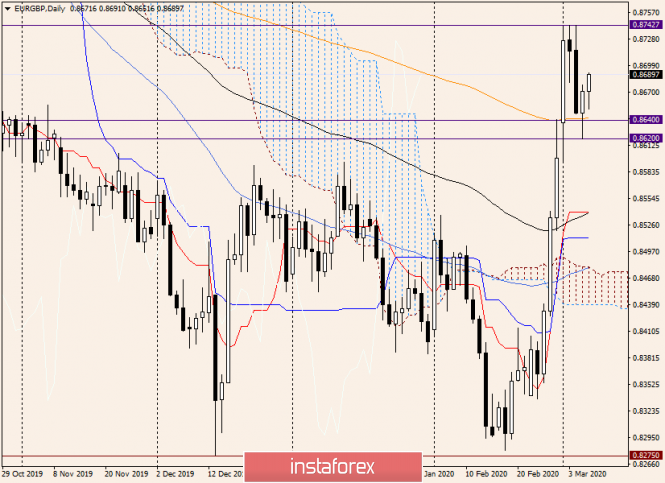
A bearish candle appeared on the daily chart following the results of trading on February 3, followed by a decrease in the cross to the area of 0.8620. As you can see, the 200 exponential and the breakdown resistance level of 0.8640 are slightly higher, which contributed to the support. Today's attempts by the bears to resume pressure on the pair were limited to the level of 0.8651, where the pair found support and is recovering. If the pair manages to rise to the opening price of today's trading 0.8671, most likely, the quote will move to positive territory. That is, it will start to grow, forming a bullish body of today's daily candle. If the support level of 0.8620 breaks, a bearish scenario for further trading on EUR/GBP will be indicated. A breakout means the closing of today's session below 0.8620. It is unlikely that the bulls on the instrument will be able to raise the quote to the resistance level of 0.8743, although who knows. Nothing is impossible in the market. In my opinion, closing today and the entire week above the strong and significant technical level of 0.8700 will already be a success for players to increase and a signal to retest the resistance of sellers at 0.8743. H4
After the bullish candlestick reversal pattern appeared on this chart, the euro/pound shows a tendency to strengthen. At the end of this article, the local resistance breaks through at 0.8677. If above this level it will be possible to gain a foothold, we are waiting for the continuation of the upward dynamics to the nearest targets at 0.8700, 0.8737, and 0.8743. In my opinion, further prospects for the price movement of the euro/pound will depend on the breakdown of the last mark. Given the current upward trend, the main trading idea for this tool is to make purchases that are better and safer to open after corrective rollbacks to 0.8677 and 0.8666. However, today is not the best day for opening new positions, but it is up to each of you, of course. Have a nice weekend! The material has been provided by InstaForex Company - www.instaforex.com |


| You are subscribed to email updates from Forex analysis review. To stop receiving these emails, you may unsubscribe now. | Email delivery powered by Google |
| Google, 1600 Amphitheatre Parkway, Mountain View, CA 94043, United States | |
No comments:
Post a Comment