
Forex analysis review |
- Control zones of GBP/USD on 03/10/20
- GBP/USD: plan for the European session on March 10. A commitment of traders (COT) report indicate the growth of long positions
- Control zones for EURUSD on 03/10/2020
- EUR/USD: plan for the European session on March 10. A commitment of traders (COT) report. Traders are reducing short positions
- Forecast for EUR/USD on March 10, 2020
- Forecast for GBP/USD on March 10, 2020
- Forecast for AUD/USD on March 10, 2020
- Forecast for USD/JPY on March 10, 2020
- Fractal analysis of the main currency pairs for March 10
- Comprehensive analysis of movement options of #USDX vs EUR/USD vs GBP/USD vs USD/JPY (DAILY) on March 10, 2020
- GBP/USD. March 9 results. Will the Fed and the Bank of England bring new surprises? Uncertainty in the market remains.
- EUR/USD. March 9 results. Currency market calmed down a bit, but it may explode again at any moment
- CAD is under pressure from oil's collapse, JPY targets level 100
- Finally, a real panic. Euro and pound rise due to expectations of Fed's unplanned moves
- March 9, 2020 : EUR/USD Intraday technical analysis and trade recommendations.
- March 9, 2020 : GBP/USD Intraday technical analysis and trade recommendations.
- EUR/USD analysis for 03.09.2020 - Watch forr the downside break towarrds the level of 1.1210
- EURUSD: the euro is storming due to rumors about eurozone interest rates. Growth in industrial output will not keep the German
- Analysis for Gold 03.09.2020 - End othe upward cycle ? Potential for the downside movement towards the level of $1.610
- BTC analysis for 03.09.2020 - Massive drop on the BTC and both downside tarrgets reached, still strong selling pressurre
- GBP/USD: plan for the US session on March 9. The pound returned to January's highs
- EUR/USD: plan for the US session on March 9. High volatility persists. Buyers are active in the area of 1.1364
- Market Overview, Trading Ideas
- Review for EUR/USD on March 09,2019. PIMCO: US and EU expected to plunge into recession in first six month of 2020
- Analysis of EUR/USD and GBP/USD for March 9. Coronavirus shocked currency stocks and commodity markets
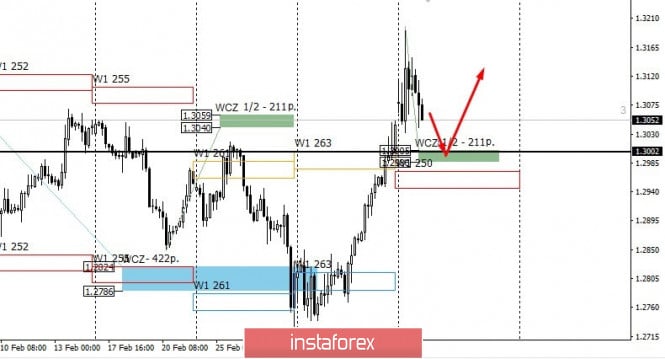
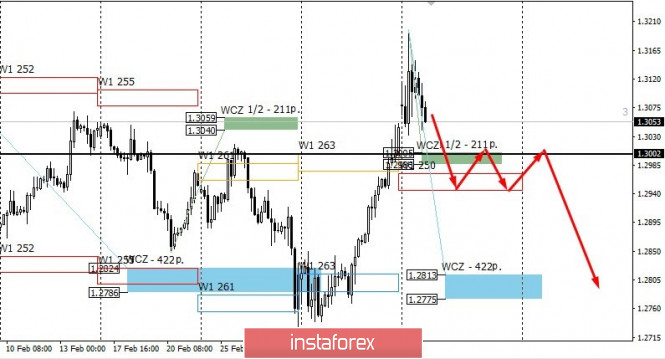
| Control zones of GBP/USD on 03/10/20 Posted: 09 Mar 2020 10:22 PM PDT Yesterday, the pair tested the upper monthly control zone and formed a pattern of "false breakdown". This allowed them to enter the sale. The first goal of the short position is the Weekly Control Zone 1/2 1.3005-1.2986. This zone coincides with the upper boundary of last week's average course. The probability of fixing part of the profit at this mark is very high. The test zone can be considered for demand. The development in the downward direction remains corrective. A further decline will be confirmed only if the pair consolidates below the Weekly Control Zone 1/2 at today's US session. This will lead to the formation of an alternative pattern that will allow to keep part of the sales opened yesterday. Moreover, additional sales will be available tomorrow. The next goal of the decline will be the weekly control zone 1.2813-1.2775. A little below the Weekly Control Zone 1/2 is the zone of the average weekly move, which can serve as an obstacle for the pair to decline this week. Daily CZ - daily control zone. The zone formed by important data from the futures market that changes several times a year. Weekly CZ - weekly control zone. The zone formed by the important marks of the futures market, which change several times a year. Monthly CZ - monthly control zone. The zone that reflects the average volatility over the past year. The material has been provided by InstaForex Company - www.instaforex.com |
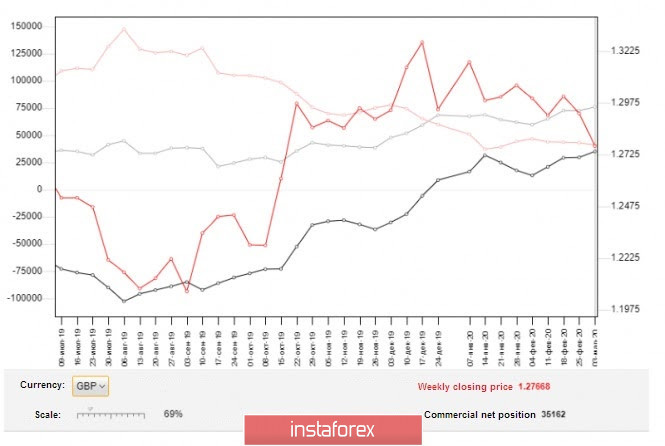
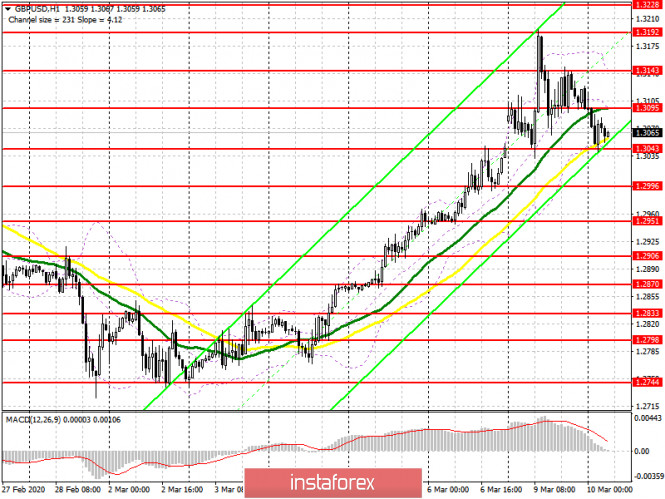
| Posted: 09 Mar 2020 10:14 PM PDT To open long positions on GBPUSD, you need: After yesterday's sharp rise in the pound and the update of annual highs, traders began to take profits, as the real prospects for further strengthening of the GBP/USD cause a lot of questions on the background of trade negotiations between the EU and the UK, which are still in a deadlock. However, players believe in the best, as evidenced by the COT report (Commitment of Traders) for March 3, where long non-profit positions increased from the level of 72,667 to 76,063, while short non-profit positions continued to decline and amounted to 40,901 against the level of 43,069 a week earlier. As a result, the non-profit net position also rose to 35,162 from 29,598, indicating the bullish market sentiment in the medium term. Given that important fundamental data is not published today on the UK economy, the market will continue to focus on the news on trade negotiations with the EU. Buyers of the pound in the first half of the day need to protect the support of 1.3043, and only the formation of a false breakdown on it will be the first signal to open long positions in the expectation of a return and consolidation above the resistance of 1.3095. Only after that, you can expect a second wave of growth of GBP/USD in the resistance area of 1.3143 and an update of the week's maximum in the area of 1.3192, where I recommend taking the profits. In the scenario of the pound falling under the support of 1.3043, which is likely, I recommend looking at long positions only after the test of the minimum of 1.2996 or buy the pound immediately for a rebound from the support of 1.2951. To open short positions on GBPUSD, you need: The bears face the task of breaking through and fixing below the support of 1.3043, which will increase the pressure on the pair and lead to an update of the lows of 1.2996 and 1.2951, where I recommend fixing profits since large buyers will start acting in these ranges. However, a more interesting scenario for selling GBP/USD is a false breakdown at the level of 1.3095 or short positions immediately rebound from the maximum of 1.3143, where it will be possible to build the upper border of a new ascending channel. Signals of indicators: Moving averages Trading is conducted in the area of 30 and 50 moving averages, which indicates small problems for bulls with building a new upward wave. Bollinger Bands A break of the lower border of the indicator at 1.3043 will lead to a larger decline in the pound. Growth will be limited by the upper level at 1.3143. Description of indicators
|
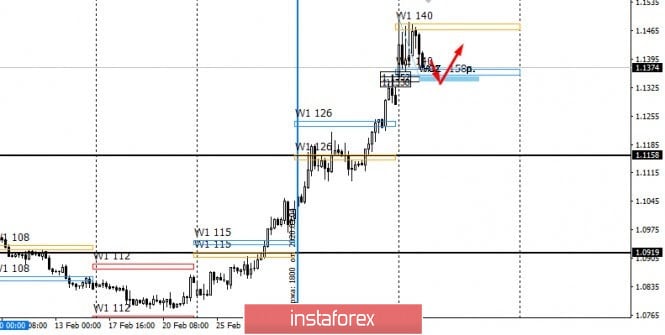
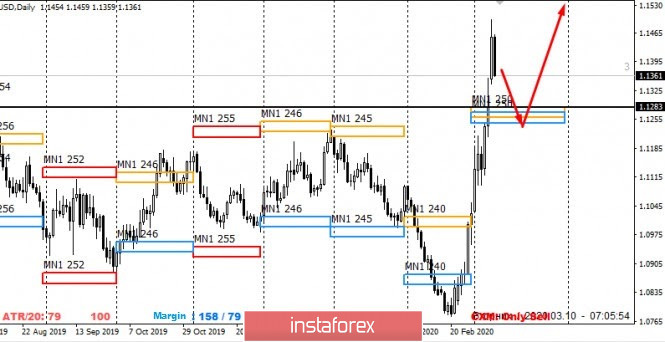
| Control zones for EURUSD on 03/10/2020 Posted: 09 Mar 2020 10:07 PM PDT Yesterday, the pair's dew stopped at the resistance zone of the WCZ 1/2 1.1462-1.1455. This made it possible to consider a sell pattern, as the pair reached an average weekly move. Today's declines have already led to a test of the lower midrange zone. Just below the average weekly range is the weekly CZ 1.1452-1.1338, which has a 75% test probability. Working towards the continuation of the medium-term bullish momentum is the main one, so the weekly short-term price test should be considered as an opportunity to fix sales and search for a buy pattern. An alternative model will be developed if the pair exits and gains a foothold below the weekly CZ. The current rate is far beyond the monthly CZ, which increases the probability of a return to it by up to 90%. The main target level is 1.1283. A return to this price will allow you to retain some of the sales that were opened yesterday and will allow you to get a favorable price for the purchase of the instrument in the future. Daily CZ - daily control zone. A zone formed by important data from the futures market that changes several times a year. Weekly CZ - weekly control zone. A zone formed by important marks of the futures market that change several times a year. Monthly CZ - monthly control zone. A zone that reflects the average volatility over the past year. The material has been provided by InstaForex Company - www.instaforex.com |
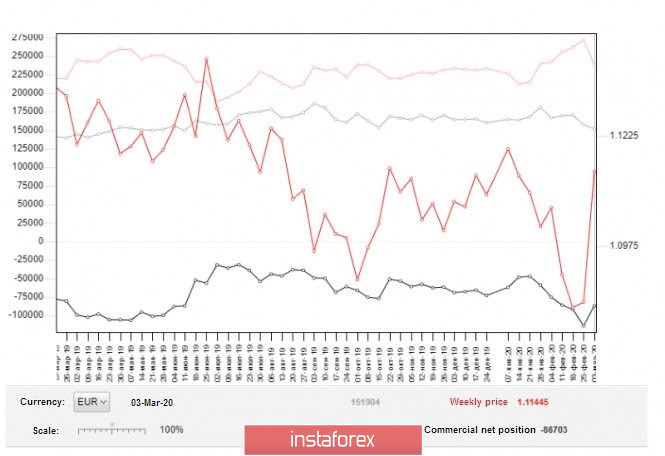
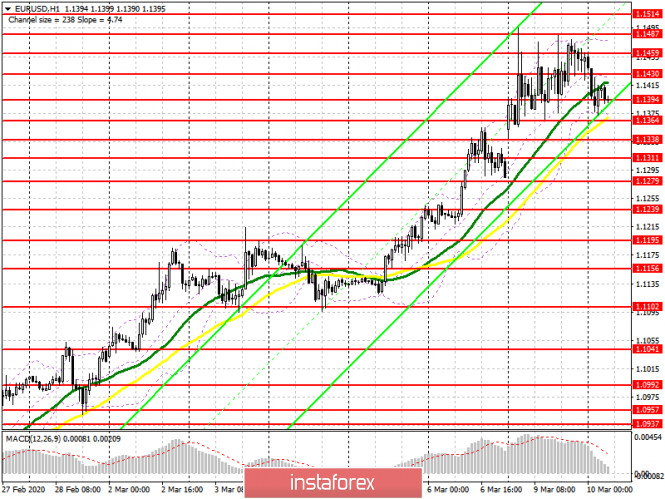
| Posted: 09 Mar 2020 10:01 PM PDT To open long positions on EURUSD, you need: Yesterday's surge in volatility, which led to the update of the 15th figure, is gradually decreasing, as the market is preparing for an important meeting of the European Central Bank and waiting for the next decisions of the Federal Reserve System. In the COT report (Commitment of Traders) for March 3, a sharp reduction in short positions for the euro was noted, but there was no strong growth in long positions. On the contrary, they also decreased, which indicates the caution of traders after such a large rise in the pair at the end of last month. The reduction in short non-profit positions occurred from the level of 271,608 to 238,607, while long non-profit positions decreased from the level of 157,587 to 151,904. As a result, the non-profit net position has grown significantly from its negative level of -114,021 to -86,703. All this suggests that speculative players are reconsidering their forecasts for the euro and it is likely that the market will turn in the longer term. At the moment, the bulls need to form a false breakdown in the support area of 1.1364, which will be a signal to open new long positions in the expectation of returning and fixing above the resistance of 1.1430, which will lead to a repeated update of the highs of 1.1459 and 1.1487, where I recommend fixing the profits. If there is a further downward correction in the first half of the day, it is best to look at long positions after testing the lows of 1.1338 and 1.1311. To open short positions on EURUSD, you need: Sellers coped with active pressure from buyers of the euro and did not let the pair above the resistance of 1.1487. At the moment, the calculation will be based on data on the volume of industrial production in France and Italy and on the report on the GDP of the eurozone. Poor statistics are unlikely to significantly harm the euro, but fixing below the support of 1.1364 will lead to a larger downward correction in the area of the lows of 1.1338 and 1.1311, where I recommend fixing the profits, as larger buyers will start to act from there. In the scenario of a re-growth of the euro, the bears will expect to form a false breakdown in the resistance area of 1.1430, but it is best to open new short positions immediately for a rebound after returning to the upper limits of the side channel of 1.1459 and 1.1487. However, it is worth remembering that their breakthrough will lead to a new upward wave, so do not forget about stop orders. Signals of indicators: Moving averages Trading is conducted in the area of 30 and 50 moving averages, but demand for the euro may return at any time. Bollinger Bands A break of the lower border of the indicator at 1.1364 will increase pressure on the euro. Growth will be limited by the upper level at 1.1480. Description of indicators
|
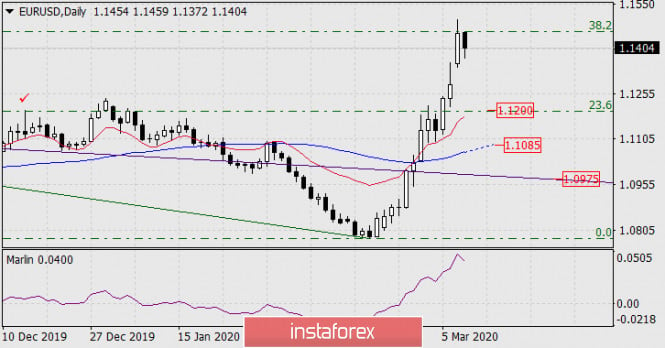
| Forecast for EUR/USD on March 10, 2020 Posted: 09 Mar 2020 09:02 PM PDT EUR/USD In the last three weeks of growth, the euro corrected 38.2% of the fall from February 2018 to February 2020. Today, in the Asian session, the euro's fall is more than 70 points, which shows the clear intention of the price to close the gap on Monday. Next, we are waiting for the testing of the Fibonacci level at the price of 1.1200, which coincides with the top on December 13 (marked with a tick).
Fixing the price below this level will direct the price to the support of the MACD line (1.1085). Fixing the price below it will confirm the market's intention to continue selling euros.
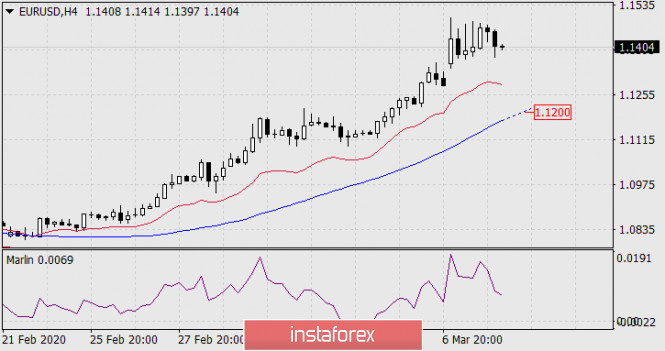
As seen on the four-hour chart, the signal line of the Marlin oscillator went down sharply. This is a sign of the market's intention to move down. The support for the MACD line at 1.1200 coincides with the 23.6% Fibonacci level on the higher-scale chart. Accordingly, the level is strong and requires increased care. The material has been provided by InstaForex Company - www.instaforex.com |
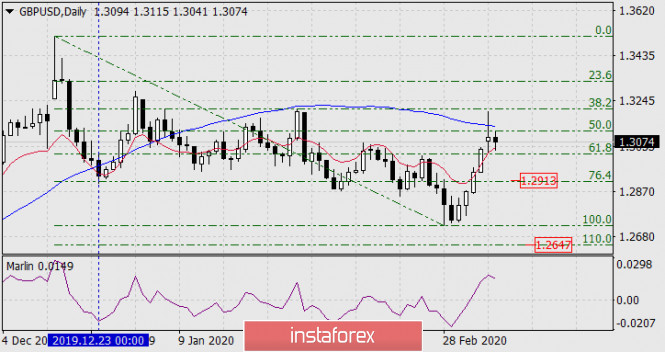
| Forecast for GBP/USD on March 10, 2020 Posted: 09 Mar 2020 09:02 PM PDT GBP/USD Over the past five days of growth, the British pound corrected almost 61.8% of the previous 11-week uneven decline. The price failed to gain a foothold above the MACD line (blue indicator) on the daily chart and now, with the agreed reversal of the Marlin oscillator, it is slowly restoring a return to the downward trend.
For a full recovery, the price must be fixed under the Fibonacci level of 76.4% (1.2913), which coincides with the minimum on December 23, then the price can reach the reaction level of 110.0% at the price of 1.2647.
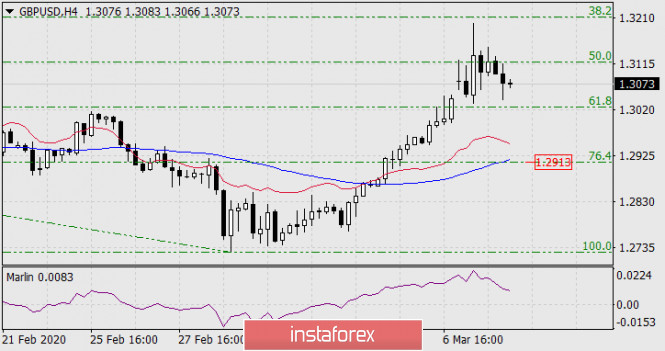
As seen on the four-hour chart, the MACD indicator line coincides with the Fibonacci level of 76.4% (actually 23.6%, since the grid is inverted). Anchoring it will confirm the market's ability to continue the decline. The material has been provided by InstaForex Company - www.instaforex.com |
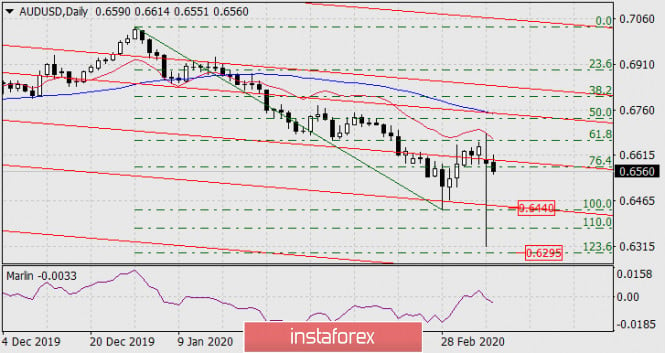
| Forecast for AUD/USD on March 10, 2020 Posted: 09 Mar 2020 09:02 PM PDT AUD/USD Yesterday's range of the Australian dollar was an incredible 370 points. After a collapse of 320 points in the four hours since the market opened, the price subsequently soared up, blocked the gap, and today in the Asian session it again shows its intention to decrease.
Computer indicators returned to normal. Yesterday's peak touched the balance line on the daily scale chart (red indicator). The Marlin oscillator is held in the zone of negative values – in the area of a decreasing trend. It is noteworthy that yesterday closed under the price channel line and today opened also under this line, near the corrective level of 76.4% (in fact, 23.6%, since the grid is inverted). We are waiting for a price drop to the lower embedded line of the price channel – in the area of the minimum of February 28 (0.6440).
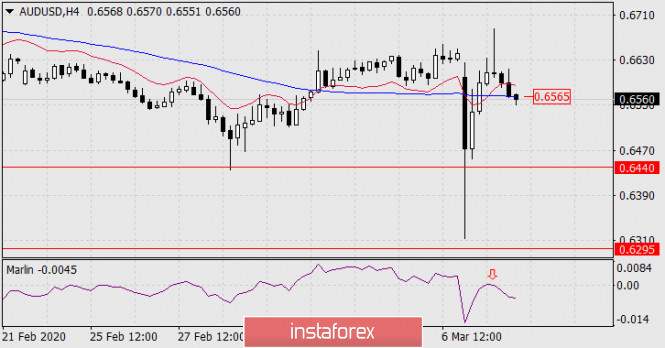
As seen on the four-hour scale chart, the price breaks under the MACD line (0.6565). Fixing below the level will serve as a signal for further decline. The signal line of the Marlin oscillator unfolds from the border with the growth territory. The material has been provided by InstaForex Company - www.instaforex.com |
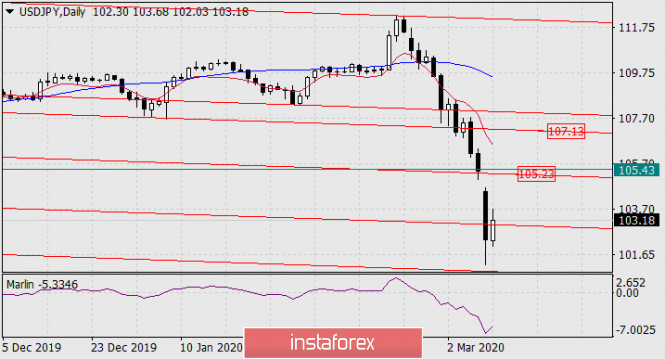
| Forecast for USD/JPY on March 10, 2020 Posted: 09 Mar 2020 09:02 PM PDT USD/JPY On Monday, the US stock index showed the largest daily collapse in the last 12 years: Dow Jones -7.79%, S&P500 -7.60%, Russell2000 -8.97%. But already this morning, Asian markets are recovering: Australia's S&P/ASX200 +1.27%, China's China A50 +0.02%, Japan's Nikkei225 -1.67%. S&P500 futures are up 2.17%. This means that the US market will open higher today.
The USD/JPY currency pair, which is sensitive to stock market movements, is also growing. The price is clearly headed for closing the gap, respectively, we expect the price to rise above the resistance of the embedded line of the price channel at 105.23, probably to 105.43 – by the top of January 2014. Fixing the price above the level of 105.43 will allow the price to continue the corrective growth to the embedded line of the price channel in the area of 107.13.
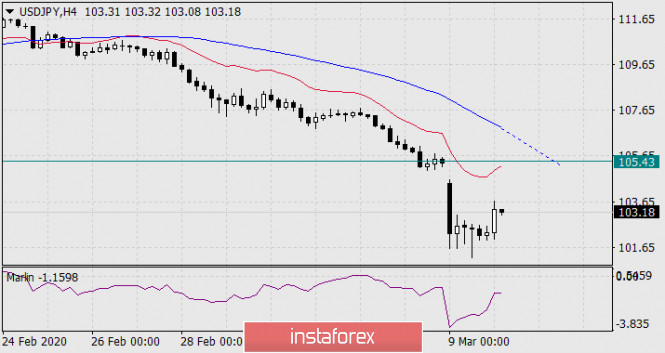
According to the four-hour chart, the Marlin oscillator exits the oversold zone, helping the price to complete the nearest task of closing the gap. The MACD line is approaching the level of 105.43, thus increasing its importance. Failure of the price to gain a foothold above the indicated level may return the USD/JPY pair to a downward trend. The material has been provided by InstaForex Company - www.instaforex.com |
| Fractal analysis of the main currency pairs for March 10 Posted: 09 Mar 2020 07:30 PM PDT Forecast for March 10: Analytical review of currency pairs on the scale of H1:
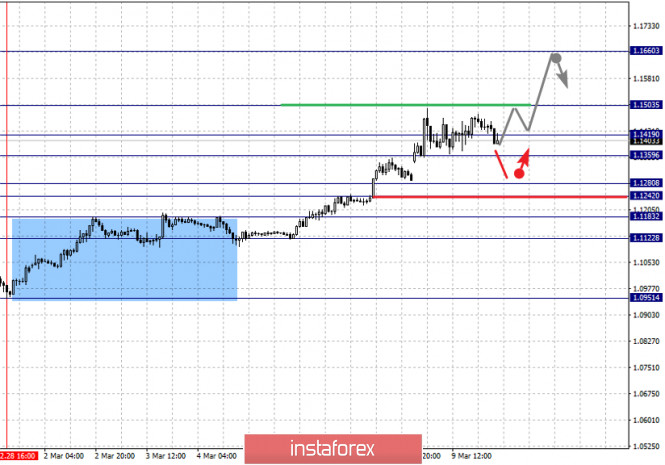
For the euro / dollar pair, the key levels on the H1 scale are: 1.1503, 1.1419, 1.1359, 1.1280, 1.1242, 1.1183 and 1.1122. Here, we are following the local upward cycle of February 28. Short-term upward movement is expected in the range of 1.1359 - 1.1419. The breakdown of the last value will lead to a pronounced movement. Here, the target is 1.1503. We expect a pullback to the bottom from this level. Short-term downward movement is expected in the range of 1.1280 - 1.1242. The breakdown of the last value will lead to an in-depth correction. Here, the goal is 1.1183. This level is a key support for the top. Its passage at the price will lead to the formation of initial conditions for the downward cycle. In this case, the goal is 1.1122. The main trend is the local upward cycle of February 28 Trading recommendations: Buy: 1.1421 Take profit: 1.1503 Buy: 1.1505 Take profit: 1.1660 Sell: 1.1280 Take profit: 1.1243 Sell: 1.1241 Take profit: 1.1184
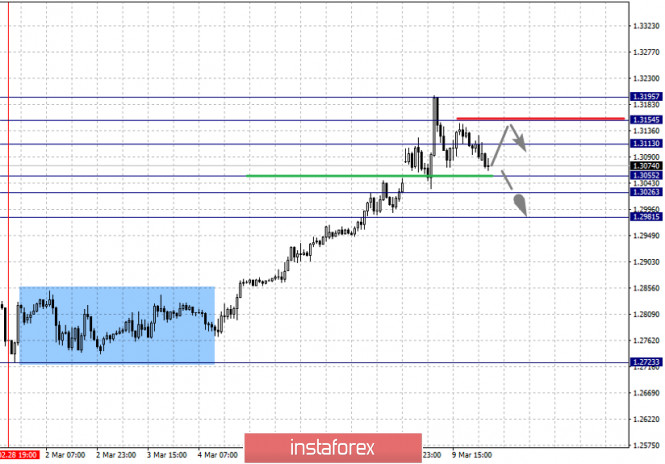
For the pound / dollar pair, the key levels on the H1 scale are: 1.3195, 1.3154, 1.3113, 1.3055, 1.3026 and 1.2981. Here, we are following the development of the ascending structure of February 28. At the moment, we are expecting a movement in correction. The continuation of the movement to the top is expected after the breakdown of the level of 1.3113. In this case, the target is 1.3154. Price consolidation is near this level. For the potential value for the top, we consider the level of 1.3195. Upon reaching which, we expect a pullback to the bottom. Short-term downward movement is possibly in the range of 1.3055 - 1.3026. The breakdown of the last value will lead to an in-depth correction. Here, the target is 1.2981. This level is a key support for the top. The main trend is the upward cycle of February 28, we expect a movement in the correction. Trading recommendations: Buy: 1.3113 Take profit: 1.3152 Buy: 1.3155 Take profit: 1.3193 Sell: 1.3055 Take profit: 1.3027 Sell: 1.3024 Take profit: 1.2981
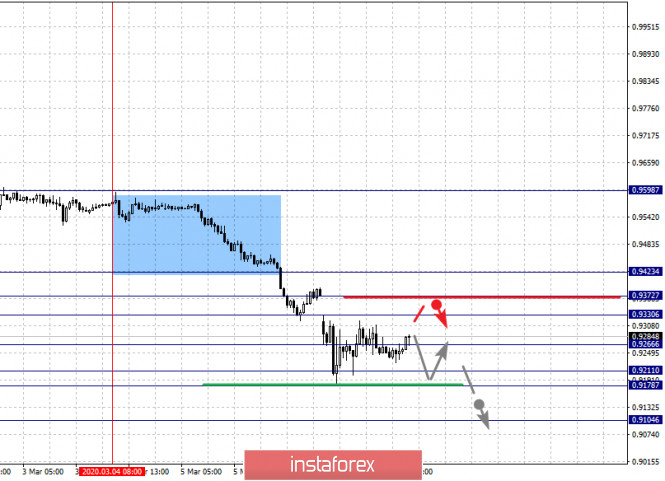
For the dollar / franc pair, the key levels on the H1 scale are: 0.9423, 0.9372, 0.9330, 0.9266, 0.9211, 0.9178 and 0.9104. Here, we are following the local descending structure of March 4. The continuation of movement to the bottom is expected after the breakdown of the level of 0.9266. In this case, the target is 0.9211. Price consolidation is in the range of 0.9211 - 0.9178. For the potential value for the bottom, we consider the level of 0.9104. Upon reaching this level, we expect a pullback to the top. Short-term upward movement is possibly in the range of 0.9330 - 0.9372. The breakdown of the latter value will lead to an in-depth correction. Here, the target is 0.9423. This level is a key support for the downward structure. The main trend is the local descending structure of March 4 Trading recommendations: Buy : 0.9330 Take profit: 0.9371 Buy : 0.9373 Take profit: 0.9421 Sell: 0.9264 Take profit: 0.9211 Sell: 0.9177 Take profit: 0.9105
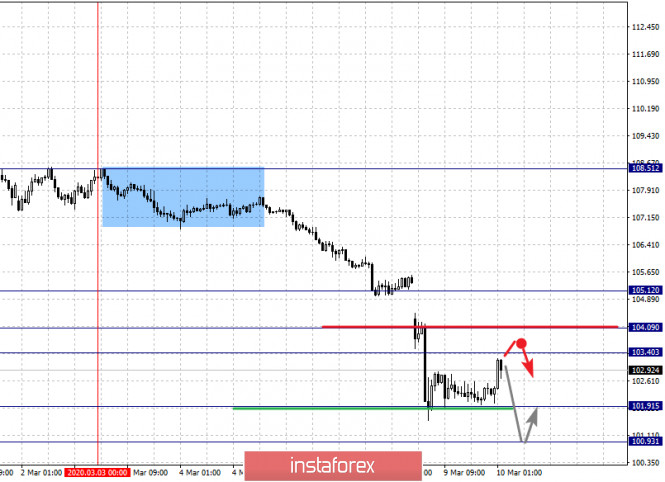
For the dollar / yen pair, the key levels on the scale are : 105.12, 104.09, 103.40, 101.91 and 100.93. Here, we are following the development of the local descending structure of March 3. The continuation of movement to the bottom is possibly after the breakdown of the level of 101.91. Here, the potential goal is 100.93. We expect a pullback in correction upon reaching this level. Short-term upward movement is possibly in the range of 103.40 - 104.09. The breakdown of the last value will lead to an in-depth correction. In this case, the goal is 105.12. This level is a key support for the downward structure. Main trend: local descending structure of March 3 Trading recommendations: Buy: 103.40 Take profit: 104.07 Buy : 104.12 Take profit: 105.12 Sell: 101.90 Take profit: 102.57 Sell: 102.53 Take profit: 100.95
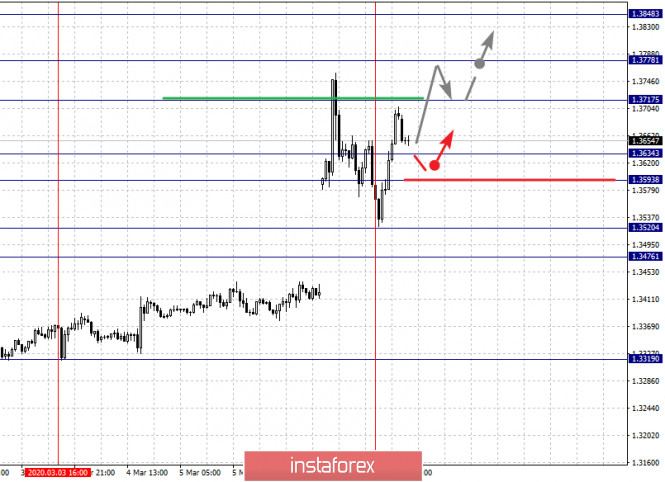
For the Canadian dollar / US dollar pair, the key levels on the H1 scale are: 1.3848, 1.3778, 1.3717, 1.3634, 1.3593, 1.3520 and 1.3476. Here, we determined the subsequent goals for the top from the local ascending structure on March 9. The continuation of the movement to the top is expected after the breakdown of the level of 1.3717. In this case, the target is 1.3778. Price consolidation is near this level. For the potential value for the top, we consider the level of 1.3848. Upon reaching which, we expect a pullback to the bottom. Short-term downward movement is possibly in the range of 1.3634 - 1.3593. The breakdown of the last value will lead to an in-depth correction. Here, the target is 1.3520. The range of 1.3520 - 1.3476 is a key support for the top, before which we expect the initial conditions for the downward cycle to be formed. The main trend is the local upward structure of March 9 Trading recommendations: Buy: 1.3717 Take profit: 1.3776 Buy : 1.3780 Take profit: 1.3846 Sell: 1.3632 Take profit: 1.3595 Sell: 1.3590 Take profit: 1.3525
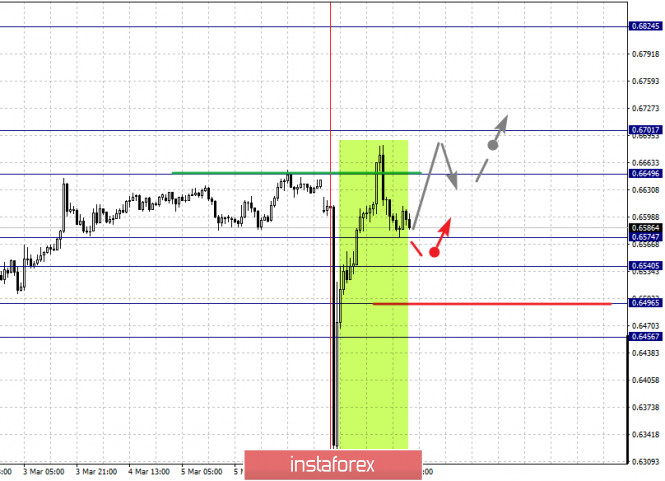
For the Australian dollar / US dollar pair, the key levels on the H1 scale are : 0.6824, 0.6701, 0.6649, 0.6574, 0.6540, 0.6496 and 0.6456. Here, we are following the formation of a medium-term upward structure from March 9. Short-term upward movement is expected in the range of 0.6649 - 0.6701. The breakdown of the last value should be accompanied by a pronounced upward movement. Here, the potential target is 0.6824. We expect consolidation, as well as a pullback to the bottom near this level. Short-term downward movement is possibly in the range of 0.6574 - 0.6540. The breakdown of the latter value will lead to an in-depth correction. Here, the target is 0.6496. The range of 0.6496 - 0.6456 is a key support for the top. The main trend is the formation of the rising structure of March 9 Trading recommendations: Buy: 0.6650 Take profit: 0.6700 Buy: 0.6704 Take profit: 0.6820 Sell : 0.6574 Take profit : 0.6540 Sell: 0.6538 Take profit: 0.6496
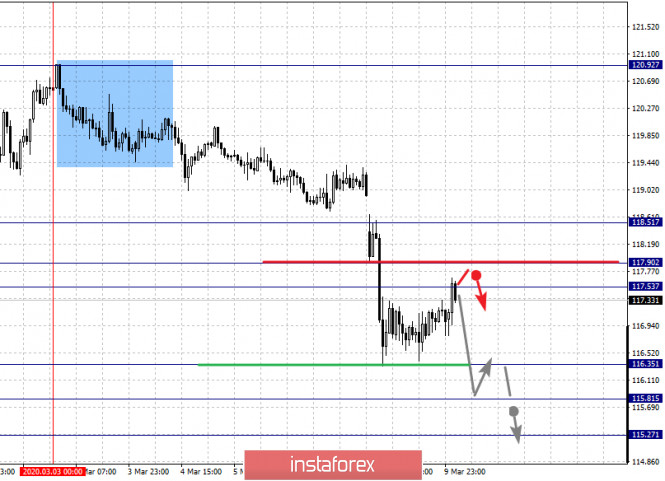
For the euro / yen pair, the key levels on the H1 scale are: 118.51, 117.90, 117.53, 116.35, 115.81 and 115.27. Here, we are following the descending structure of March 3. The continuation of movement to the bottom is expected after the breakdown of the level of 116.35. In this case, the target is 115.81. Price consolidation is near this level. For the potential value for the bottom, we consider the level of 115.27. Upon reaching which, we expect a pullback to the top. Short-term upward movement is possibly in the range of 117.53 - 117.90. The breakdown of the last value will lead to an in-depth correction. Here, the goal is 118.50. We expect the initial conditions for the upward cycle to be formed to this level. The main trend is the descending structure of March 3 Trading recommendations: Buy: 117.53 Take profit: 117.90 Buy: 117.93 Take profit: 118.50 Sell: 116.35 Take profit: 115.84 Sell: 115.78 Take profit: 115.30
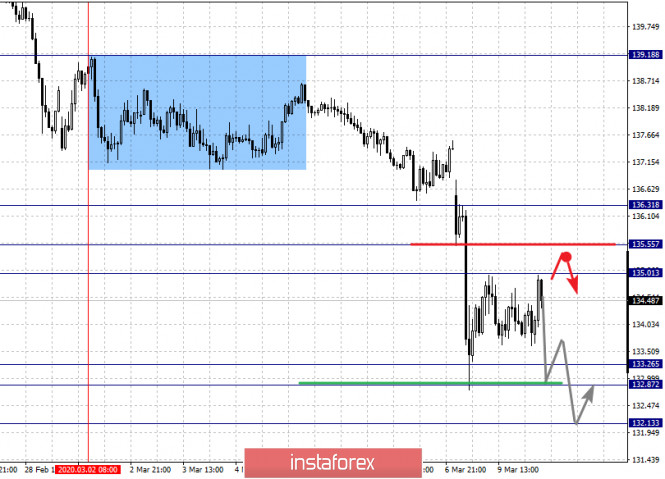
For the pound / yen pair, the key levels on the H1 scale are : 136.31, 135.55, 135.01, 133.26, 132.87 and 132.13. Here, we are following the local descending structure of March 2. Short-term downward movement is expected in the range 133.26 - 132.87. The breakdown of the last value will lead to movement to a potential target - 132.13. We expect a key reversal to the top from this level. Short-term upward movement is possibly in the range of 135.01 - 135.55. The breakdown of the latter value will lead to the development of an in-depth correction. Here, the goal is 136.31. This level is a key support for the downward cycle. The main trend is the local descending structure of March 2 Trading recommendations: Buy: 135.01 Take profit: 135.53 Buy: 135.57 Take profit: 136.30 Sell: 133.26 Take profit: 132.88 Sell: 132.84 Take profit: 132.15 The material has been provided by InstaForex Company - www.instaforex.com |
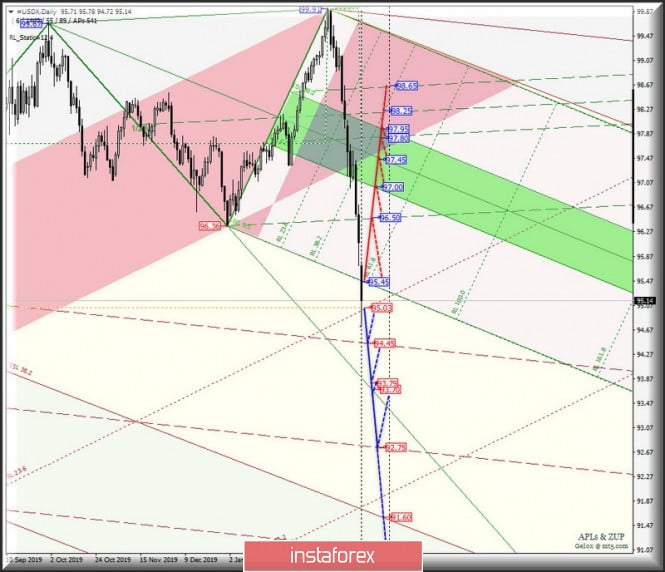
| Posted: 09 Mar 2020 06:42 PM PDT Will the decline of the dollar continue? Here's a comprehensive analysis of movement options of #USDX vs EUR/USD vs GBP/USD vs USD/JPY (DAILY) on March 10, 2020 Minor operational scale (daily time frame) ____________________ US dollar Index The movement of the dollar index #USDXfrom March 10, 2020 will continue depending on the development and direction of the breakdown range:
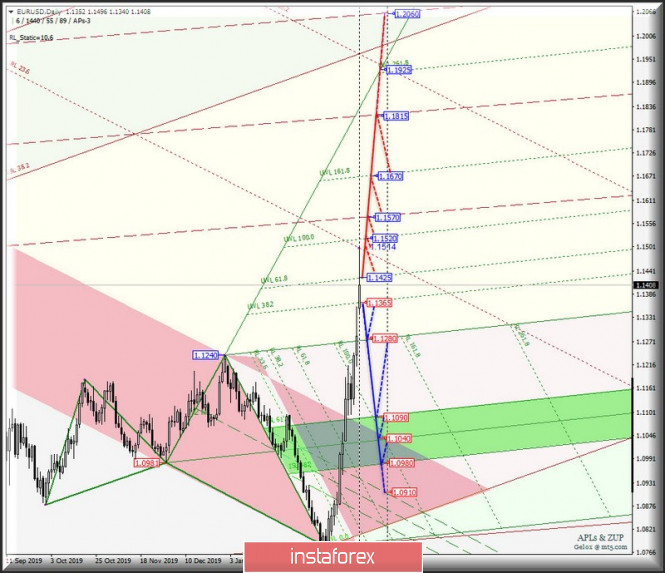
If the FSL terminal line (resistance level of 95.45) of the Minuette operational scale forks is broken down, it will become possible to develop an upward movement of the dollar index to the final Schiff Line (96.50) and the equilibrium zone (97.00 - 97.45 - 97.95) of the Minuette operational scale forks. In the event of a breakdown of the minimum update of January 10, 2019 - support level of 95.03 - the downward movement of #USDX can be continued to the goals: - the upper boundary of the channel 1/2 Median Line ( 94.45 ) of the Minor operational scale forks; - control line LTL (93.79) of the Minuette operational scale forks; - 1/2 Median Line Minor (92.75). The markup of the #USDX movement options on March 10, 2020 is shown on the animated chart. ____________________ Euro vs US dollar The single European currency EUR/USD was not able to break the maximum 1.1514 of January 31, 2019:
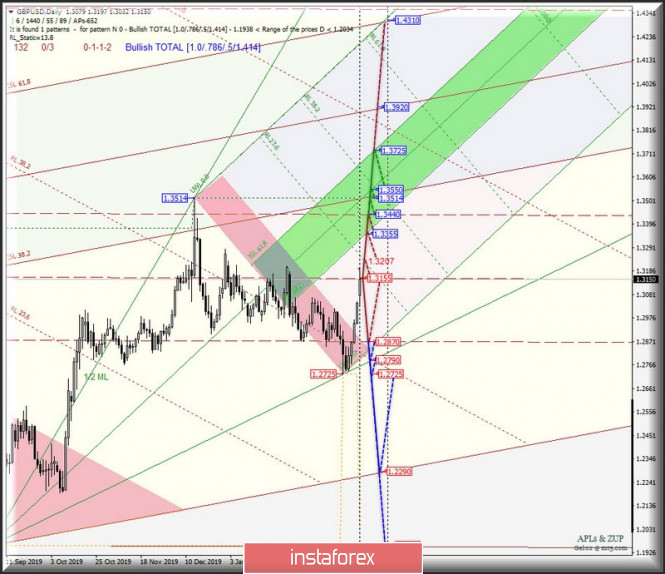
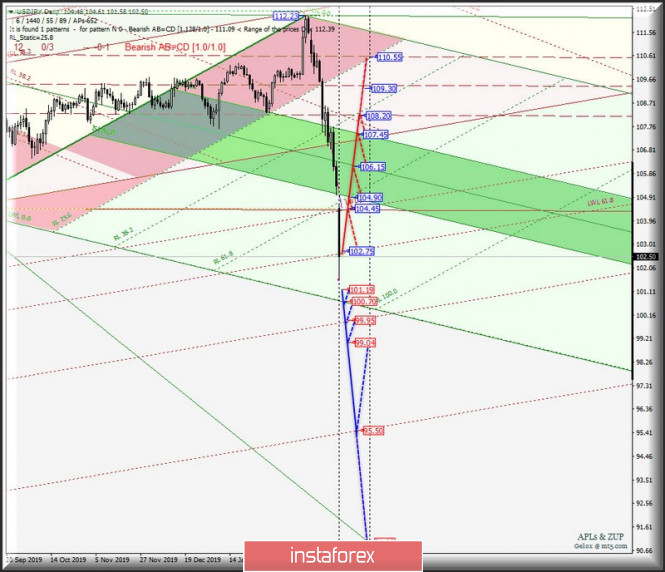
The development and direction of the breakdown of which will determine the development of the movement of this instrument from March 10, 2020. On the other hand, returning below the support level of 1.1365 on the warning line UWL38.2 Minute will determine the development of the downward movement of EUR / USD to the targets: - the final line FSL Minuette (1.1280); - equilibrium zones (1.1090 - 1.1040 - 1.0980) of the Minuette operational scale forks. Alternatively, in case of a breakdown of the resistance level of 1.1425 on the warning line UWL61.8 of the Minuette operational scale forks, it will be relevant to resume the upward movement of the single European currency to the goals: - maximum 1.1514 of January 31, 2019; - warning line UWL100.0 Minuette (1.1520); - the lower boundary of the 1/2 Median Line channel (1.1570) of the Minor operational scale forks; - warning line UWL161.8 Minuette (1.1670); - 1/2 Median Line Minor (1.1815). The details of the EUR/USD movement options from March 10, 2020 are shown in the animated chart. ____________________ Great Britain pound vs US dollar Her Majesty's currency was unable to update the maximum of 1.3207 of January 31, 2020 and continues to remain in the 1/2 Median Line (1.2870 - 1.3155 - 1.3440) of the Minor operational scale forks. The development of the GBP/USD movement will become determined by the development and breakdown direction of this channel - the movement details within the 1/2 Median Line Minor channel are presented on the animated chart. The breakdown of the lower boundary (support level of 1.2870) of the 1/2 Median Line Minor channel will make it possible to continue the downward movement of Her Majesty's Currency towards the goals: - control line LTL (1.2790) of the Minuette operational scale forks; - local minimum 1.2725; - SSL start line (1.2290) of the Minor operational scale forks. On the contrary, the breakdown of the upper boundary (resistance level of 1.3440) of the 1/2 Median Line channel of the Minor operational scale forks will determine the further development of the GBP / USD movement in the equilibrium zone (1.3355 - 1.3550 - 1.3725) of the Minuette operational scale forks. The details of the GBP/USD movement on March 10, 2020 is presented on the animated chart. ____________________ US dollar vs Japanese yen The development of the currency movement of the "country of the rising sun" USD / JPY from March 10, 2020 will be determined by the development and the direction of the breakdown of the range:
The breakdown of the warning line LWL61.8 (resistance level of 102.75) of the Minor operational scale forks will direct the development of the currency of the country of the rising sun to the control line LTL (104.45) of the Minor operational scale forks and the equilibrium zone (104.90 - 106.15 - 107.45) of the Minuette operational scale forks. In the event of a breakdown of the minimum update (support level of 101.19) of November 9, 2016, the downward movement of USD / JPY can be continued to the goals: - the final line FSL Minuette (100.70); - warning line LWL100.0 (99.95) of the Minor operational scale forks; -minimum 99.04 on June 24, 2016; - warning line LWL161.8 Minor (95.50). The details of the USD/JPY movement on March 10, 2020 is presented on the animated chart. ____________________ The review was compiled without taking into account the news background. Thus, the opening trading sessions of major financial centers does not serve as a guide to action (placing orders "sell" or "buy"). The formula for calculating the dollar index : USDX = 50.14348112 * USDEUR0.576 * USDJPY0.136 * USDGBP0.119 * USDCAD0.091 * USDSEK0.042 * USDCHF0.036. where the power coefficients correspond to the weights of the currencies in the basket: Euro - 57.6% ; Yen - 13.6% ; Pound Sterling - 11.9% ; Canadian dollar - 9.1%; Swedish krona - 4.2%; Swiss franc - 3.6%. The first coefficient in the formula leads the index to 100 at the start date of the countdown - March 1973, when the main currencies began to be freely quoted relative to each other. The material has been provided by InstaForex Company - www.instaforex.com |
| Posted: 09 Mar 2020 04:28 PM PDT 4-hour time frame Amplitude of the last 5 days (high-low): 194p - 111p - 103p - 107p - 103p. Average volatility over the past 5 days: 106p (high). The British pound began the new trading week with a gap. During the day, the GBP / USD quotes still increased, so the upward movement has remained and there is still no sign of the beginning of the correctional movement. Although the pound sterling does not rise in price against the dollar for as long or as much as the Euro currency, this movement also falls under the definition of "panic". It can't be otherwise, because the fundamental reasons for the growth of the pound sterling are now the same as the Euro. Thus, in general, nothing has changed on Monday, March 9. The pair continues to grow, traders continue to panic and get rid of the American currency, and there were no macroeconomic statistics on that day. And of course, the coronavirus is also a key topic of the day in the UK. According to the latest data from the Ministry of Health, the number of cases increased to 319, with 3 casualties. The British government, led by Boris Johnson, is already preparing a bill in case of further spread of the epidemic. However, the key issue remaining on the agenda is: what actions will the Bank of England take at the next meeting? It can be recalled that most of the world Central Banks decided to lower their key rates. Regarding the Fed, there are rumors that monetary policy may be weakened even more, and at an emergency meeting again, without waiting for the planned one. If this happens, then the US dollar will have reason for an even greater collapse and will come close to the strength of monetary policy in time for Great Britain. Thus, formally, the dollar will lose the strongest support factor in the confrontation with the British pound. Who would have thought that such a situation would become a reality in 2020? Who could have imagined that an epidemic would start that would put so much pressure on the US currency? Now, returning to the British regulator. We believe that the Bank of England cannot remain distant, especially since there were enough reasons for lowering the rate even before the appearance and spread of coronavirus. The easing of monetary policy may provide temporary support for the US currency. However, first, the meeting of the British Central Bank will not take place soon, and secondly, it may be ahead of the fed, lowering rates even more. Due to this, we believe that the pound/dollar pair remains completely uncertain. In this situation, it is best to pay special attention to technical factors that clearly indicate the direction of the current trend and the absence of a correction. However, there is a danger here. Sharp reversals are possible, strong jumps up and down are possible. In general, now is not the best time to trade. Against the background of what is happening, negotiations between the EU and the UK regarding an agreement on Brexit faded into the background. Although, this topic remains extremely important for the future of the country and its economy. However, all other problems will be considered secondary until the problem with coronavirus is resolved. From a technical point of view, the GBP/USD pair has completed working up the first resistance level of 1.3150 today. Thus, a rebound from this target may trigger a round of downward correction. I could have, if not for the panic in world markets and complete uncertainty. A reversal of the MACD indicator can also indicate the beginning of a corrective movement, but at the same time, this requires a parallel price drop, since the indicator can simply be discharged. Recommendations for short positions: In the 4-hour time frame, the pound/dollar continues to move up. Therefore, traders are suggested to stay in longs with the goal of the resistance level of 1.3257 until the MACD turns down or other signs of a correction start appear. Recommendations for long positions: It is recommended to sell British currency no earlier than fixing the pair below the Kijun-sen critical line. It is this moment that will allow us to conclude that the trend is changing to a downward one. However, given the range of the price from this line, it is unlikely that this will be overcome in the near future. Explanation of the illustration: Ichimoku indicator: Tenkan-sen is the red line. Kijun-sen is the blue line. Senkou Span A - light brown dotted line. Senkou Span B - light purple dashed line. Chikou Span - green line. Bollinger Bands Indicator: 3 yellow lines. MACD indicator: Red line and bar graph with white bars in the indicators window. Support / Resistance Classic Levels: Red and gray dashed lines with price symbols. Pivot Level: Yellow solid line. Volatility Support / Resistance Levels: Gray dotted lines without price designations. Possible price movements: Red and green arrows. The material has been provided by InstaForex Company - www.instaforex.com |
| EUR/USD. March 9 results. Currency market calmed down a bit, but it may explode again at any moment Posted: 09 Mar 2020 04:28 PM PDT 4-hour time frame Amplitude of the last 5 days (high-low): 157p - 119p - 92p - 125p - 143p. Average volatility over the past 5 days: 128p (high). If you try to describe everything that is happening now in the currency market in one word, then "panic" is best. However, we talked about this in recent days. There is panic (in the literal sense of the word) in the markets, respectively, there is currently no logic in the movement of the EUR/USD currency pair. It is impossible to predict how long the collapse of the US currency will last. Moreover, it's impossible to even say exactly why the collapse of the quotes of the dollar continues. We have already said that the collapse of the US stock market cannot be considered the only reason for the decline in the US currency. In the same way, it is impossible to consider the reason for such a strong decline in the dollar and a decrease in the key Fed rate. It can be recalled that rates remain much lower in the European Union, and moreover, the threat of the spread of the "coronavirus" is likely to lead to that the ECB will also cut the key rate in March. However, the European Central Bank has much less room for activity than the US Fed. Thus, we believe that the ECB will not be able to stimulate the economy as well as the Fed. This means that the European economy will continue to slow down at a much faster pace than the American one. And all these factors play again in favor of the US dollar. In addition, the collapsed oil market cannot be considered the reason for the decline in the dollar and vice versa too, since the price of oil is denominated just in dollars. And accordingly, if the dollar becomes cheaper, then oil should rise in price. However, we see that the dollar and oil collapsed simultaneously with the US stock indices. All this speaks only of what we have been repeating for the last few days. Panic. And that's it. Meanwhile, "storm" continues not only in the United States, but also the European Union. Firstly, it is in the European Union that there are much more people infected with the Chinese virus than in the United States. Secondly, the EU economy is already much weaker than the US and no less tied to the Chinese, which so far suffers the most. Thirdly, in the European Union, particularly in Italy, the entire regions are already in quarantine. At the same time, according to recent reports, the ECB is considering whether to reduce the key rate. If this information is true, then we have a number of questions. First, is the ECB even able to somehow influence the rapidly approaching crisis and recession? Secondly, if the ECB does not see any reason to reduce the key rate due to 10,000 infected people, then perhaps, the US did not need to soften its monetary policy immediately by 0.5%? As we said before so far, no negative effects on the US economy have been observed. Moreover, recent macroeconomic reports suggest that everything is in order. The economy continues to grow, the labor market is growing, and inflation is above 2%. Here's also a very interesting question: if the ECB still lowers the rate, will the euro collapse after this? Logically, this is exactly what should happen. But at the same time, traders are now ignoring absolutely all reports and events related to macroeconomics. Thus, such a decision by the ECB can be completely ignored. Further, we have the oil market. On the one hand, the collapse in prices indicates a sharp decline in demand due to the fact that global business activity is declining, due to quarantine as well as fears of an even stronger spread of the virus. At the same time, the virus is not fatal in 80-90% of cases. That is, even with the current set of drugs, it is quite possible to do without serious losses. The main thing is to localize the epidemic itself and prevent its further spread. For example, much more people die from AIDS every year, there is no cure for this disease, just like vaccinations. However, because of it, quarantine is not declared, stock markets do not fall, and panic does not prevail in the markets. Moreover, AIDS in 100% of cases leads to death. And if we look in more detail at all the most common diseases that end fatally, it becomes clear that coronavirus is not the main problem of mankind. Sooner or later, a cure will be found, a vaccine will be opened, and everything will return to normal. Meanwhile, industrial production began to revive in Germany. In February, the increase in monthly terms was 3%, and the decrease in annual terms was -1.3%. Both indicators were higher than forecasted values. However, who is now interested in statistics from Germany? There were no more important publications during the first trading day of the week. From a technical point of view, there are still no signs of the beginning of correction. Thus, at any moment, uncontrolled upward movement can continue. The MACD indicator may begin to discharge. As a result, traders are still encouraged to follow the trend or stay out of the market. Recommendations for short positions: For eurocurrency sales, we recommend waiting for quotes to fix below the critical line. This is the minimum condition for shorts with minimum volumes with the goal of a support level of 1.1090. Recommendations for long positions: Eurocurrency purchases with the goal of the resistance level of 1.1470 can be held until the MACD indicator turns down (with a parallel decrease in the price). A reversal down can occur at any time, so you should be as careful as possible with any positions. Explanation of the illustration: Ichimoku indicator: Tenkan-sen is the red line. Kijun-sen is the blue line. Senkou Span A - light brown dotted line. Senkou Span B - light purple dashed line. Chikou Span - green line. Bollinger Bands Indicator: 3 yellow lines. MACD indicator: Red line and bar graph with white bars in the indicators window. Support / Resistance Classic Levels: Red and gray dashed lines with price symbols. Pivot Level: Yellow solid line. Volatility Support / Resistance Levels: Gray dotted lines without price designations. Possible price movements: Red and green arrows. The material has been provided by InstaForex Company - www.instaforex.com |
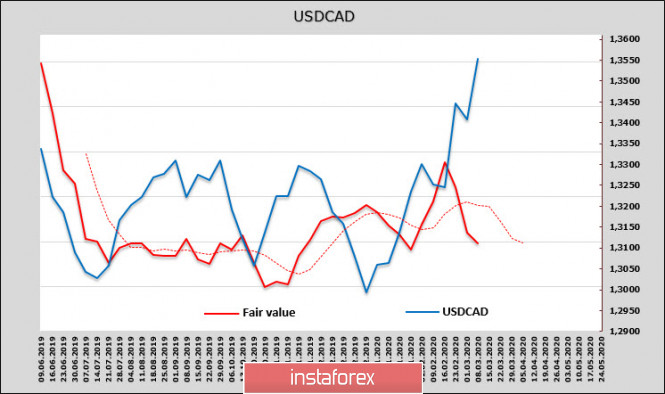
| CAD is under pressure from oil's collapse, JPY targets level 100 Posted: 09 Mar 2020 04:28 PM PDT The US employment report in February turned out to be unexpectedly strong and contained a further decline in the dollar, but the Fed is forced to respond to completely different factors. The collapse of the market will likely lead to a quick reaction of the majority of the Central Banks, which will be forced to introduce emergency measures. However, forecasts remain negative. The main negative effect of the spread of COVID-19 has not shown itself yet; expectations on lowering the Fed rate at the March 18 meeting, since stopping the decline in inflationary expectations remains the main goal at this stage. The dollar will not be able to reverse the trend of weakening this week, the favorites will be traditional protective assets - gold, yen, franc and bonds. USD/CAD The CFTC report turned out to be neutral for the Canadian currency in general, as the majority of long contracts decreased slightly, but still exists, and as a result, the estimated fair price is still significantly lower than the current one. This means a rather unexpected forecast for the CAD - despite the fact that the Canadian dollar is a recognized commodity currency, its reaction to the massive collapse of the market is surprisingly restrained.
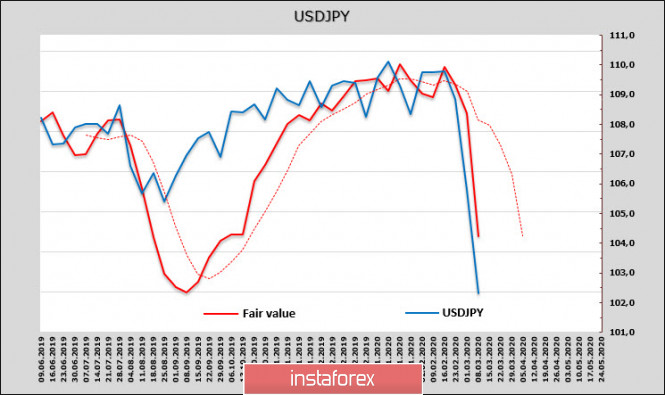
Given that both the Bank of Canada and the Fed cut the rate almost simultaneously and by one amount, we must admit that the loonie does not look like a loser based on the results of the steps taken. The domestic indicators of the Canadian economy are noticeably better than those of the United States, the Ivey business activity index declined slightly in February to 54.1p, that is, it remains in a confident expansion zone, the average hourly wage growth is 4.33% y / y, which means that inflation expectations higher than in the USA. Apparently, the market is starting to form the opinion that the Fed will act more aggressively this year than the Bank of Canada. The US dollar has noticeably weakened, Treasury yields have collapsed, stock market trends are negative, and the fact that yields in Canada are usually higher compared to the US suggests that the Canadian premium on the bond market will continue. After USD/CAD went above the resistance line 1.3381, the trend became frankly bullish and technically attempts to develop growth are justified. At the same time, the estimated fair price is directed down and is at about 1.3120. Therefore, the chances of a technical correction look high and only the oil's collapse does not allow the Canadian currency to win back the massive weakening of the dollar. USD/JPY The yen is an obvious favorite when paired with the dollar, as its protective currency status has finally come forward. The collapse of oil and stock indices makes commodity currencies vulnerable, while countries that depend on imports of raw materials get a clear win, and the yen reacts as it should with an increase. Despite the fact that quotes declined to the level of 101.20, the chances of the pair developing lower remain high, since the estimated price is also falling steadily down, and you can only rely on consolidation near the lows with a look on another wave down.
The situation is starting to put pressure on the Bank of Japan, and despite the fact that the measures taken by central banks in connection with the spread of coronavirus are temporary, we know that there is nothing more permanent than temporary measures. During the crisis of 2008/09, many "temporary" measures were also taken, which they did not manage to cancel. The head of BoJ, Kuroda, made a speech on March 2. He promised to ensure sufficient liquidity and ensure stability in the financial markets through appropriate market operations and the purchase of assets. The conditions for a powerful monetary easing have already taken form, but they need to be formalized. In addition, the accelerating strengthening of the yen may require a quick reaction. As a result, one should expect the announcement of specific mitigation options by the meeting of the Bank of Japan on March 18-19. For example, expanding the purchase of ETFs, increasing lending to enterprises and expanding purchases of commercial bonds. The yen is targeted at level 100, which may force the Bank of Japan to take decisive actions, for example, to intervene in order to restrain the strengthening of the yen. Meanwhile, correction to today's broken support level of 104.4 seems unlikely. The material has been provided by InstaForex Company - www.instaforex.com |
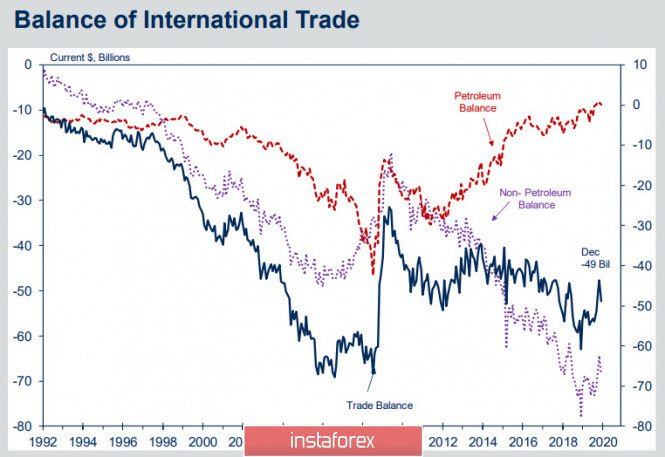
| Finally, a real panic. Euro and pound rise due to expectations of Fed's unplanned moves Posted: 09 Mar 2020 04:28 PM PDT Russia's decision to turn down the deal's extension to reduce oil production under the OPEC + agreement caused a real blow in the financial markets. Such a violent reaction in response to generally an insignificant event indicates that global markets have reached a division point. Thus, the containment of a rapidly developing crisis is becoming unlikely. The most obvious reason is a clear threat to the US oil and gas industry, which accounts for 7.6% of GDP. A sharp decline in the trade balance will be superimposed on the progressive budget crisis. According to the US Congressional Budget Committee, the budget deficit amounted to $ 625 billion for the first 5 months of fiscal year 2020, and there will be nothing to cover the deficit with the Trump government. There is certainly some truth in such an interpretation. As can be understood from the graph below, the negative trade balance of the United States, by the 2008 crisis, increased to $ 70 billion per month. Following this, the negative balance decreased noticeably by 2010 after Obama began an attempt to implement a plan to create competitive advantages for producers in the USA at the expense of cheap energy resources.
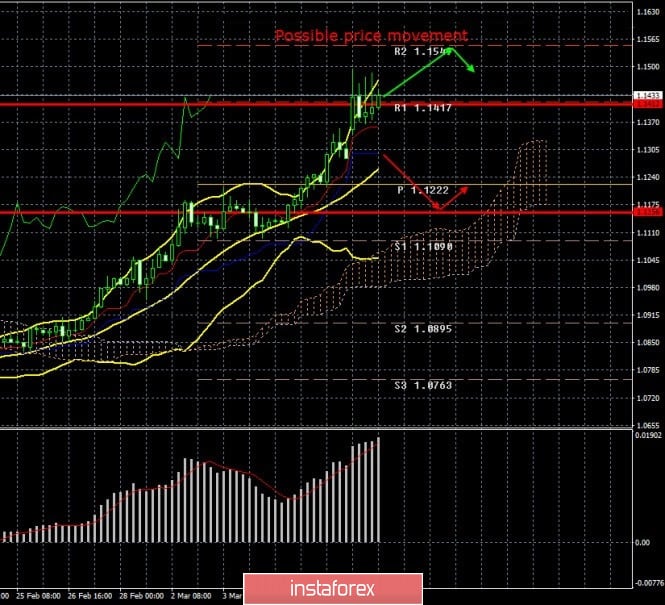
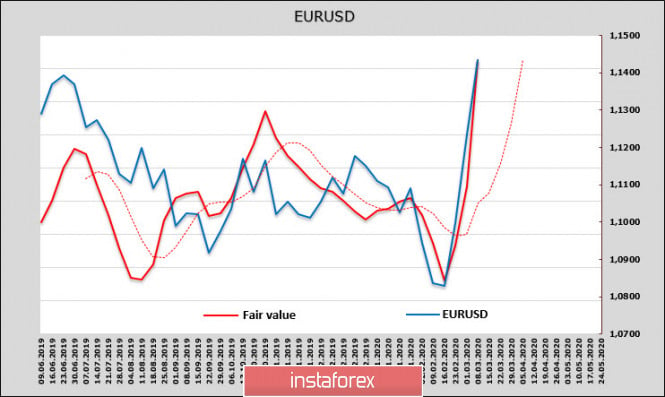
In 2012, there was a separation of real US production from hydrocarbon consumption. While domestic production was growing rapidly, the trade balance for other types of goods and services continued to decline further into negative. It is clear that the trade balance will go deep down and update records for 2006/08 if a drop in oil prices leads to massive bankruptcies of oil shale companies. The situation repeated with the exception of one "but" - the Fed has run out of legitimate tools to influence the situation. The traditional methods have been used up – three waves of quantitative easing remained hanging on the balance sheet of the Fed, lowering the rate by half a percent will not give the desired effect. The Fed's reaction to the collapse of the markets followed quickly - the New York Federal Reserve made a special statement even before the start of the working day, from which it follows that overnight liquidity will be increased from 100 to 150 billion, weekly repo operations from 20 up to 45 billion. It will be possible to reduce the volatility, but it is unlikely to stop the decline. EUR/USD The euro reached a 12-month high, as panic sales led to a mass exodus from the carry trade, net shorts on CME. According to the CFTC Friday's report, it drop 3.4 billion, and the estimated price at the opening of the US market on Monday is almost the same with spot.
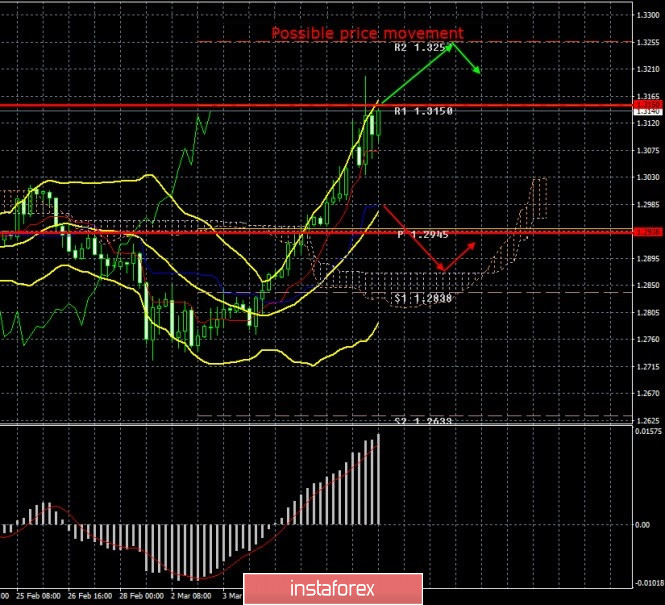
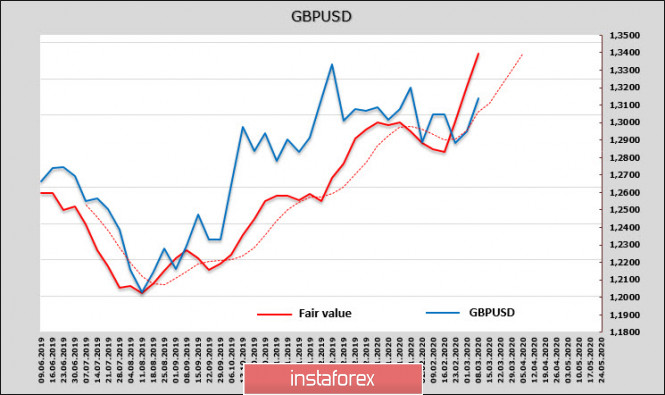
All this despite the fact that the Sentix indicator of investor confidence fell in March from 5.2p to -17.1p, which reflects a clear increase in panic regarding the prospects for the European economy. The euro growth was supported, among other things, by a positive report on industrial production in Germany, in January the growth was 3%, year-on-year the decline slowed from -5.3% to -1.3%. Despite the obvious overboughtness of the euro, as follows from the chart, the impulse is very strong and, apparently, reflects not so much the strength of the euro as the growing danger to the dollar. Overbought may cause a correction, but deep correction requires strong steps on the part of the US financial authorities. In the meantime, we need to proceed from the fact that EUR/USD will try to develop success and will strive for 1.1570 in the long term. GBP/USD The pound is not growing as clearly as the euro. Nevertheless, it managed to get to the calculated level of 1.32 on Monday, which we designated as the possible target in the previous review. At the same time, the estimated price went to 1.34, and now, the benchmark is shifting to this level. The impulse is still strong, so a reversal is unlikely.
Volatility may increase on Wednesday when several quite important releases are published. Unlike the Fed, an emergency meeting of the Bank of England is not yet expected, although everything may be – the yield on 10-year bonds declined today to 0.072%, i.e. more than 50% relative to Friday's level. Strong bond demand may reflect an unrealized distrust of the pound. The probability of the decline of the nearest resistance 1.3200 and 1.3266 looks high in the coming days. The material has been provided by InstaForex Company - www.instaforex.com |
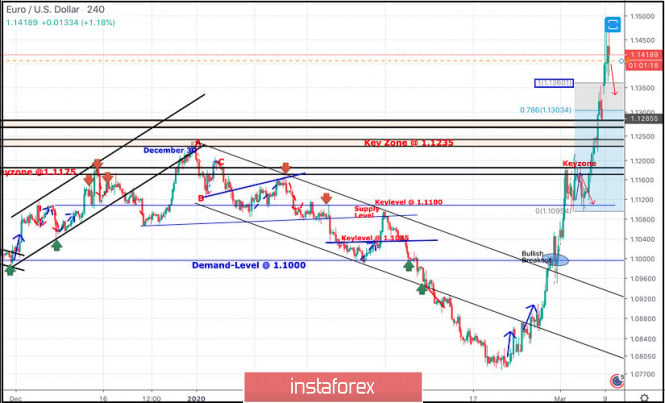
| March 9, 2020 : EUR/USD Intraday technical analysis and trade recommendations. Posted: 09 Mar 2020 09:10 AM PDT
On December 30, a bearish ABC reversal pattern was initiated around 1.1235 (Previous Key-zone) just before another bearish movement could take place towards 1.1100 (In the meanwhile, the EURUSD pair was losing much of its bearish momentum). One more bullish pullback was executed towards 1.1175 where the depicted key-zone as well as the recently-broken uptrend were located. Since then, the pair has trended-down within the depicted bearish channel until two weeks ago, when extensive bearish decline established a new low around 1.0790. This was where the EUR/USD pair looked oversold after such a long bearish decline. Hence, Intraday traders were advised to look for signs of bullish recovery around the price levels of (1.0790). On February 20, recent signs of bullish recovery were demonstrated around 1.0790 leading to the current bullish movement towards 1.1000, 1.1175 and 1.1235. The price level of (1.1175) constituted a temporary SUPPLY level in confluence with the origin of the previously-mentioned ABC pattern. That's why, transient congestion-zone was established down to 1.1100-1.1095 where another bullish swing was initiated towards 1.1300, 1.1360 and 1.1480. Currently, the price-Level of 1.1360 (100% Fibo Expansion) is being breached to the upside by the EURUSD pair. That's why, bearish rejection is anticipated around the current price level of 1.1480 (Supported with being OVERBOUGHT) with bearish targets around 1.1360, 1.1300 and 1.1235. Otherwise, Bullish Breakout above 1.1480 enables further upward movement towards a more dependable Supply-Zone. The material has been provided by InstaForex Company - www.instaforex.com |
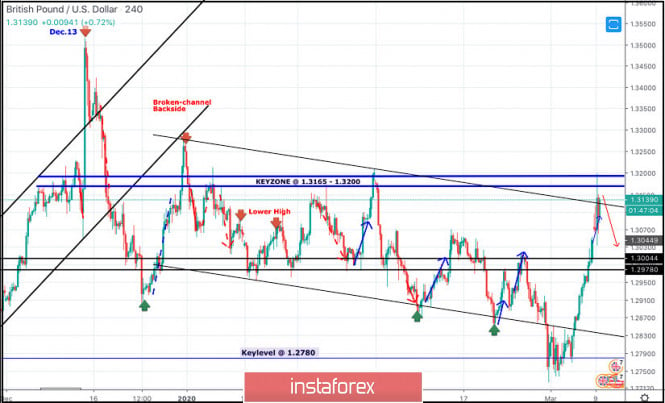
| March 9, 2020 : GBP/USD Intraday technical analysis and trade recommendations. Posted: 09 Mar 2020 08:34 AM PDT
In the period between December 18th - 23rd, bearish breakout below the depicted previous bullish channel followed by quick bearish decline below 1.3000 were demonstrated on the H4 chart. However, Immediate bullish recovery (around 1.2900) brought the pair back towards 1.3250 (backside of the broken channel) where the current wide-ranged movement channel was established below 1.3200. Since January 13, progressive bearish pressure has been built over the price zone of 1.2980-1.3000 until February 5. On February 6, recent bearish breakdown below 1.2980 enhanced further bearish decline towards 1.2890 (the lower limit of the movement channel) where two episodes of bullish rejection were manifested on February 10th and 20th. Shortly after, the lower limit of the channel around 1.2850 has failed to provide enough bullish Support for the GBPUSD pair. That's why, further bearish decline was expressed towards the nearest DEMAND level around 1.2780 where significant bullish rejection and an inverted Head & Shoulders reversal pattern was demonstrated in the period between Feb. 28 - March 4. Hence, a quick bullish movement was demonstrated towards the price zone of 1.2980-1.3000 which is failing to offer enough bearish pressure on the GBPUSD pair. The current bullish recovery was expected to pursue towards 1.3150-1.3200 where bearish rejection and bearish pullback is expected to exist. Early signs of bearish rejection are currently manifested indicating a high-probability bearish pullback opportunity towards 1.2980. On the other hand, bullish persistence above 1.3200 enhances the bullish side of the market and invalidates the previously-mentioned bearish scenario. The material has been provided by InstaForex Company - www.instaforex.com |
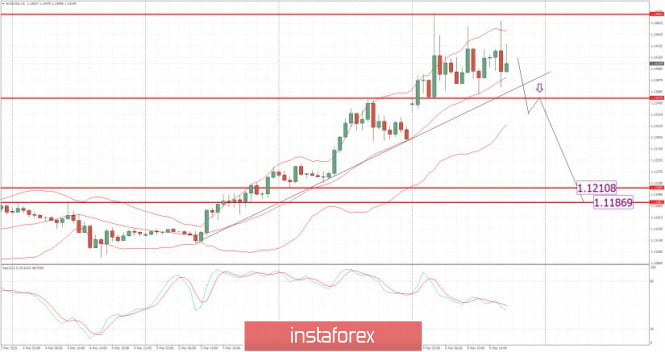
| EUR/USD analysis for 03.09.2020 - Watch forr the downside break towarrds the level of 1.1210 Posted: 09 Mar 2020 07:47 AM PDT Technical analysis:
EUR been trading sideways at the prrice of 1.1415.In my opinion, the price went to fat too far and downside rotation is very likely to happen. My advice is to watch for potential breakout of the support at 1.1357 to confirm downside movement towards the levels at 1.1210 and 1.1186. Major resistance is set at the price of 1.1500 Support levels are set at the prrice of 1.1357, 1.1288 and 1.1210 Stochastic oscillator is showing downside cycle. The material has been provided by InstaForex Company - www.instaforex.com |
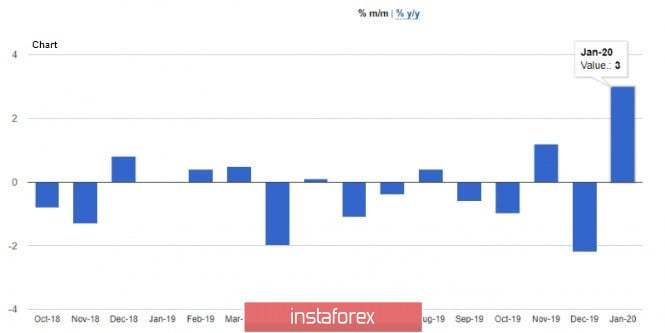
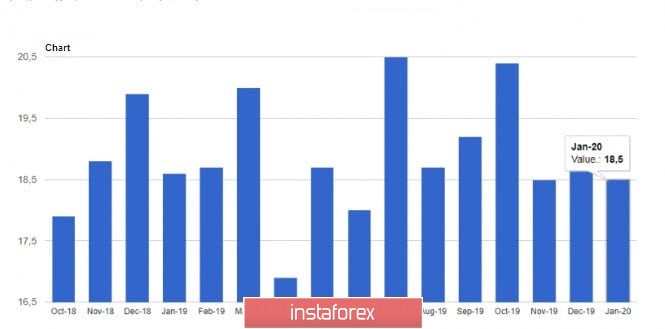
| Posted: 09 Mar 2020 07:43 AM PDT The euro strengthened against the US dollar amid rumors that the European Central Bank may leave interest rates unchanged during this week's meeting. Good data on growth in industrial production and the decision of the German government to support companies that may suffer from the spread of coronavirus also provide good support for risky assets, including the euro, which returned to its local highs in the area of 1.1490 with the US dollar. As mentioned above, the German government decided to return to the method already tried in 2008-2009, which consists of a package of measures aimed at supporting companies. First of all, we are talking about companies that have suffered from the spread of the coronavirus epidemic. As announced by German Chancellor Angela Merkel, assistance will be provided to those companies that, in times of crisis, transfer employees to a reduced working day instead of their full dismissal, or sending them on temporary leave at their own expense. The requirements that will be imposed on applicants applying for such subsidies have also been relaxed. The government promised to make full payments for employees who were paid social security contributions. However, not all experts believe in the effectiveness of such measures. There is an opinion that such a package will be able to provide short-term support to companies and will only delay the economic shock from the coronavirus, especially since the deterioration of the economic situation is obvious, and the data for February do not show the whole problem that Germany found itself in after the virus spread. Data was released today that indicated a sharp increase in industrial production in Germany in January this year and a recovery in the manufacturing sector, but this trend is unlikely to continue in February and March. According to the report, industrial production in Germany increased significantly in January this year and was much better than economists' forecasts. The German Bureau of Statistics Destatis said that total industrial production in January increased by 3.0% compared to the previous month, while economists had forecast it to grow by 1.8%. Compared to January 2019, production decreased by 1.3%. For December, the data was revised for the better. Initially, it was reported that industrial production fell by 3.5% in December, while the revised report shows a figure of -2.2%. Let me remind you that last Friday a report was released on orders in the industrial sector, which also grew by 5.5%. But the report on the foreign trade balance was not as positive as many expected. According to Destatis data, German exports remained unchanged in January 2020, while the growth of 0.9% was expected. Imports increased. Germany's trade surplus in January was 18.5 billion euros, while economists had forecast 18.0 billion euros. Imports increased by 0.5% compared to January. In figures, exports in January amounted to 106.5 billion euros and imports - 92.7 billion euros. The euphoria for the euro could end quickly if Germany's recession turns out to be deeper than expected. Many economic agencies are already revising their forecasts, even though the data is positive. The country's GDP is expected to decrease by 0.2% in the 1st quarter of this year and by 0.6% in the 2nd quarter. Previously, many experts predicted zero growth or a reduction to a maximum of 0.1%. And if the manufacturing sector has long been dismantling cuts, then problems are expected in the service sector, which will be severely affected by the coronavirus epidemic. This Thursday, the European Central Bank will hold a meeting where the ECB's key rate is expected to be lowered by 10 basis points, but the deposit rate may be kept at -0.50%. If the key rate remains unchanged, and this option is currently being considered by some experts, in any case, the Central Bank will announce a target allocation of liquidity to support small and medium-sized businesses, as well as resort to changing the terms of the asset purchase program. As for the current technical picture of the EURUSD pair, the outlines of a side-channel in which the euro may get stuck are already visible. The upper border of this channel passes at a maximum of 1.1460, while the lower one is clearly traced in the range of 1.1370. A breakthrough in these areas will determine the future direction of the euro. When growing, the highs of 1.1540 and 1.1605 can be considered as major resistances. While the lows of 1.1330 and 1.1280 will act as support for the correction of the trading instrument. The material has been provided by InstaForex Company - www.instaforex.com |
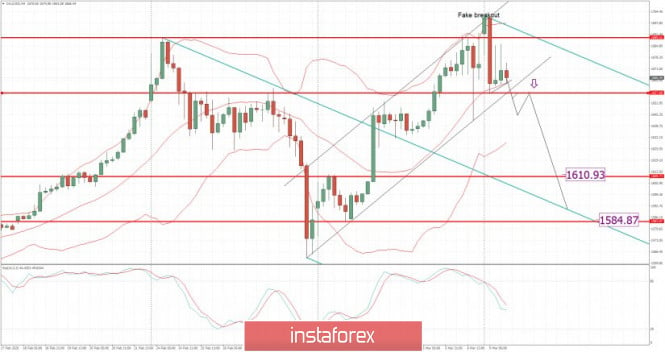
| Posted: 09 Mar 2020 07:29 AM PDT Technical analysis:
Gold been trading downwrads.The price made fake breakout of the main pivot resistance at $1.689, which is strong sign that buying looks risky and that sellers are present.I would watch for potential breakout of the well-defined upward channel at $1.657 and then watch for selling opportunities with the main targets at $1.610 and $1.584 (Pitchfork median line). Stochastic oscillator is showing downside cycle .Resistance levels are set at the prrice of $1.689 and $1.702. Support levels are set at $1.657, $1.641 and $1.610 The material has been provided by InstaForex Company - www.instaforex.com |
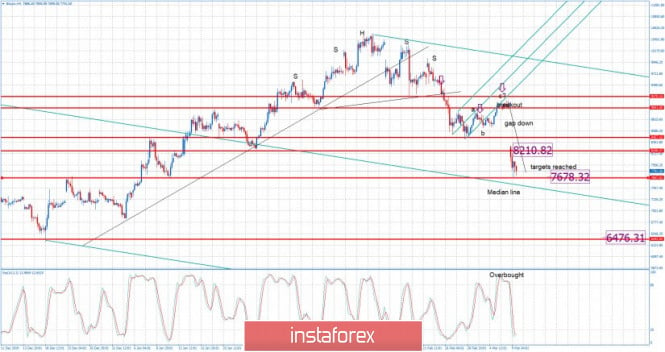
| Posted: 09 Mar 2020 07:19 AM PDT Industry news:
As Bitcoin (BTC) mining difficulty and hashrate hit new highs, less efficient miners, hurt by the virus outbreak, new-generation rigs, and falling BTC prices, may be out of business.Bitcoin mining difficulty, a measure that shows how hard it is to compete for mining rewards, has hit yet another record. According to the major Bitcoin mining pool BTC.com, it climbed to 16.55 T today, never being outside the 15 T range before.This was a rise of 6.88%. It follows a 0.38% drop in mining difficulty two weeks ago, which was the first drop this year. That said, it took BTC mining difficulty just half a year to climb from 10 T to 16 T, making validating new blocks harder.Technical analysis: BTC been trading downwards as I expected.The price reached both of our Friday's targets at $8.210 and $7.680. Anyway, there is still strong selling pressure together with the gap down, which is indication for the further downside movement. I would watch for selling opportunities in case of the breakout of the Pitchfork median line.Next major downward target is set at the price of $6.475. Stochastic is in oversold zone but with new momentum to the downside. Resitance is set at $8.457 (bottom of the gap) Support level is set at the price of $7.678 The material has been provided by InstaForex Company - www.instaforex.com |
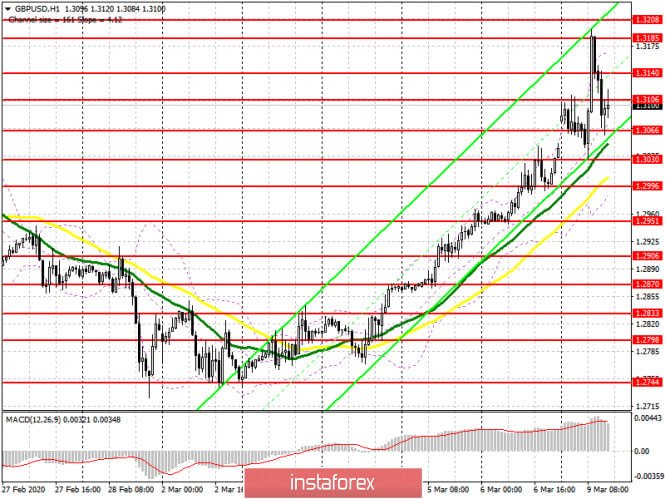
| GBP/USD: plan for the US session on March 9. The pound returned to January's highs Posted: 09 Mar 2020 06:28 AM PDT To open long positions on GBPUSD, you need: The British pound made a sharp jump of more than 100 points in the European session, but after reaching the maximum of January this year, traders began to take profits, which led to the return of market equilibrium and the pair's decline in the range of 1.3066-1.3106. Pressure on the pound remains due to trade negotiations with the EU. Last week, the EU's negotiator for dialogue with the UK, Michel Barnier, noted the existence of serious disagreements on a number of issues following the first round. At the moment, the bulls are focused on breaking the resistance of 1.3106, which may lead to the second wave of growth of the pound to the highs of 1.3140 and 1.3185, where I recommend taking the profits. In the scenario of a decline in the area of the minimum of 1.3006, it is best to return to long positions only on a false breakdown or buy GBP/USD from the lows of 1.3030 and 1.2996. To open short positions on GBPUSD, you need: Sellers got everything they wanted from this year's highs today, and now the situation on the market is stabilizing after a serious surge in volatility. Bears need to form a false break in the resistance area of 1.3106 in the second half of the day, which will increase the pressure on the pair and lead to a downward correction and a repeat test of the area of 1.3066. However, only its breakthrough will collapse GBP/USD to the lows of 1.3030 and 1.2996, where I recommend fixing the profits. If the growth wave is repeated in the US session, it is best to return to short positions at the test of the maximum of 1.3140 or sell the pound immediately on a rebound from the annual resistances of 1.3185 and 1.3228. Signals of indicators: Moving averages Trading is conducted above the 30 and 50 daily averages, which indicates the continued growth of the pound. Bollinger Bands Growth will be limited to the upper level of the indicator around 1.3170. If the pair declines, the lower border of the indicator around 1.2996 will provide support.
Description of indicators
|
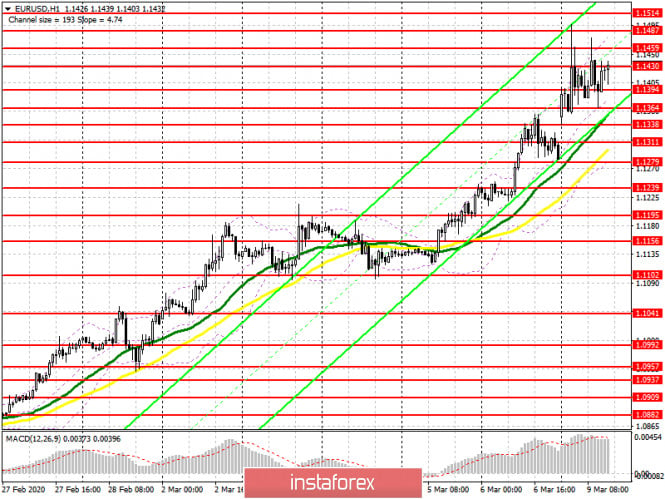
| Posted: 09 Mar 2020 06:16 AM PDT To open long positions on EURUSD, you need: Even a sharp increase in industrial output in Germany did not allow buyers of the euro to break above the resistance of 1.1459, which remains under their sight. In my morning review, I paid attention to the support in the area of 1.1394 and 1.1364, where after a small correction, buyers returned to the market in the hope of breaking the resistance of 1.1430, which was not possible to do in the first half of the day. At the moment, the bulls will try to regain this area, which will lead to the continued growth of EUR/USD in the area of the highs of 1.1459 and 1.1487, and it is likely to test the resistance of 1.1514, where I recommend taking the profits. In the scenario of a decline in the euro in the second half of the day, the same areas of 1.1364 and 1.1338 will provide support. You can open long positions immediately on a rebound from the lows of 1.1311 and 1.1239. To open short positions on EURUSD, you need: There are not many people willing to open short positions on the euro, but sellers continue to form the upper border of the side correction channel in the area of 1.1459-1.1487, from where traders recorded profits on long positions in the first half of the day. At the moment, sellers again need to protect this range, and only the formation of a false breakdown there will be a signal to open short positions, which will lead to a downward movement to the area of the lows of 1.1394 and 1.1364, where the lower border of the above channel already passes. If the euro continues to grow in the North American session above the resistance of 1.1487, it is best to return to short positions only after updating the local levels around 1.1539 and 1.1569. Signals of indicators: Moving averages Trading is conducted above the 30 and 50 moving averages, which indicates the continued growth of the euro. Bollinger Bands A break of the upper border of the indicator in the area of 1.1487 will lead to a new growth wave. In the case of a downward correction, purchases can only be returned to a rebound from the lower border of 1.1311.
Description of indicators
|
| Market Overview, Trading Ideas Posted: 09 Mar 2020 05:31 AM PDT Trading recommendations: EURUSD - neutral GBPUSD - Neutral USDCAD - Neutral CL - Neutral GOLD - lowering scalping at the American session The material has been provided by InstaForex Company - www.instaforex.com |
| Posted: 09 Mar 2020 04:45 AM PDT
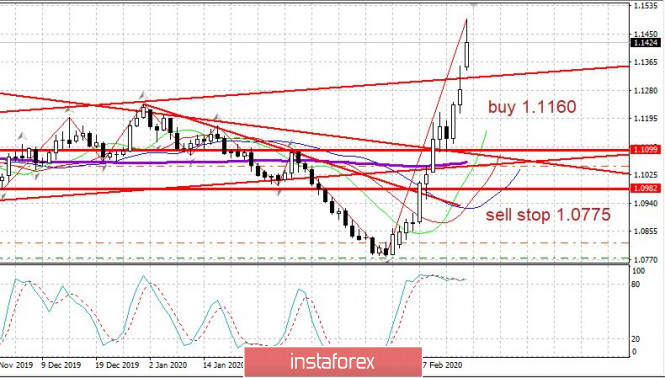
At the beginning of the week, global markets crashed in early trading amid the coronavirus. The coronavirus is spreading fast across the world. At the moment, the number of infected people outside China is 28 thousand. The virus has spread to 99 countries. Three main regions affected by the disease are South Korea, Italy (7.5 thousand cases), and Iran (6.5 thousand cases) followed by France (1000 cases) and Germany (900 cases). The US declared an emergency situation in New York. Authorities of major countries are likely to stop their attempts to block the coronavirus as it can paralyze life in many cities. According to PIMCO, the US and the EU are expected to plunge into recession in the first half of 2020 due to a decrease in demand amid the coronavirus. I hold my buy deals on EUR/USD opened at 1.1100. Correction is likely to occur on a daily chart. Buy deals can be opened at 1.1160. The material has been provided by InstaForex Company - www.instaforex.com |
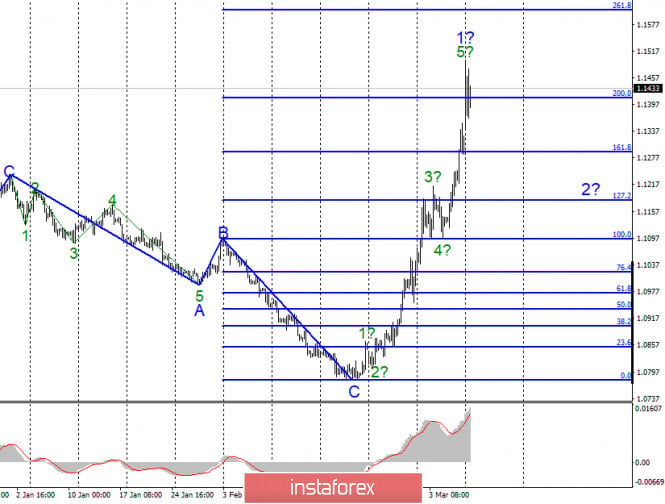
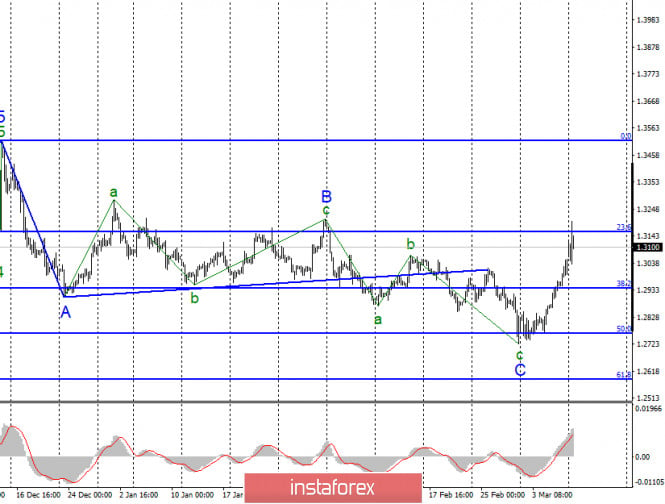
| Posted: 09 Mar 2020 04:19 AM PDT EUR / USD On March 6, the EUR/USD pair gained just 40 base points. However, Monday opened with a gap of another 70 points up and during the first day of the week, the euro has already managed to gain about 70 points. Thus, the uncontrolled increase in the euro-dollar instrument continues, and now, it is very difficult to imagine when it will end and what can stop it. I think no one doubts that the reasons for such a strong increase in the quotes of the instrument do not lie in the plane of economic news or reports or wave analysis. The new COVID-2019 virus, which throws all markets into shock and panic without exception, is to blame. Thus, the alleged wave 1 of the new upward trend section can take on a theoretically arbitrarily extended form, like its internal wave 5. Fundamental component: The news background for the EUR / USD instrument on March 6 was very important and interesting. However, it was completely ignored. The markets did not pay attention either to the US unemployment rate, which returned to many-year lows, to Nonfarm Payrolls. The number of which exceeded all market expectations, or to the wage level, which increased by 3%. That is, with such a news background, one could only expect a decline in the quotes of the instrument. Nevertheless, the markets continued to panic on Friday, and continue to panic today. Moreover, both currency markets, stock markets, and commodity markets – all this leaves the prospects of any currency, any commodity, or any stock index in complete uncertainty. At the same time, the Coronavirus can cause truly full-scale quarantines in many countries, which will lower business activity to negative values. Thus, the world economy will slow down, and the economies of the EU and many other countries of the world will slide into recession. So, what will happen to the oil, gas and stock markets is even hard to imagine. Thus, at this time, all economic news can be ignored, paying attention only to the actions of central banks and news about the coronavirus and the fight against it. General conclusions and recommendations: The euro/dollar pair is supposedly continuing the construction of a new ascending section. Based on the current wave marking, wave 1 continues its construction. Thus, I still recommend waiting for the completion of the construction of wave 2 and buying the instrument only later, when the construction of wave 3 begins. At the same time, any transactions are now extremely dangerous due to panic and complete uncertainty prevailing in the market. GBP / USD On March 6, the GBP/USD pair gained about 90 base points. Thus, the current wave counting required corrections and additions once again. Now, the entire trend section, which dates back to December 13, is considered completed and has taken a three-wave form and form. If this is true, then a new upward trend section has begun to be built, which is completely unclear what form it will take and how long it will be. The current news background allows for completely different build options. Fundamental component: The news background for the GBP / USD instrument on Friday was in the same economic reports from America that were ignored by the markets with the same degree of ease. The same reasons that pushed the euro-dollar instrument upward, pounded in the same direction and the Pound-Dollar. Thus, pushed the pound-dollar in the same direction. Thus, it doesn't even make sense to look at economic news, analyze reports, or wait for information about negotiations on a trade deal with the European Union. All this does not matter now. The only thing that matters is the news from the central banks of the UK, USA, EU, as well as news about the spread of the coronavirus and the fight against it. General conclusions and recommendations: The pound/dollar instrument has complicated the current wave count. Thus, I do not recommend trading now, as the situation in the markets is very unstable and frankly shocking. The material has been provided by InstaForex Company - www.instaforex.com |

| You are subscribed to email updates from Forex analysis review. To stop receiving these emails, you may unsubscribe now. | Email delivery powered by Google |
| Google, 1600 Amphitheatre Parkway, Mountain View, CA 94043, United States | |
No comments:
Post a Comment