Forex analysis review |
- July 10, 2020 : EUR/USD Intraday technical analysis and trade recommendations.
- July 10, 2020 : GBP/USD Intraday technical analysis and trade recommendations.
- EUR/USD and GBP/USD forecast for July 10. No important news is expected today. EUR and GBP trade opposite, while COVID-10
- Comprehensive analysis of movement options for #USDX vs EUR/USD & GBP/USD & USD/JPY (H4) on July 13, 2020
- Unjustified rally over: Forex again going through downward correction
- EUR / USD: Expect a warm week ahead for euro
- Evening review on EURUSD for July 10, 2020
- Bitcoin to hit $100,000
- GBP/USD: plan for the American session on July 10
- EUR/USD: plan for the American session on July 10
- Chinese yuan to hardly replace US dollar as reserve currency
- US and Asian stock indices sagged
- BTC analysis for July 10,.2020 - Fake breakout of the supply trendline and potential for the bigger drop towards the $7.800
- Dollar: don't go against Trump!
- Analysis of Gold for July 10,.2020 - Potential for the another drop towards the $1.790
- EUR/USD analysis for July 10 2020 - EUR started the drop as I expected. Potential for furher drop towards the 1.1200
- Oil prices fell once again
- Trading recommendations for the EUR/USD pair on July 10, 2020
- EUR/USD Upside In Danger!
- Technical analysis of AUD/USD for July 10, 2020
- Trading idea for gold
- GBP/USD: between Sunak and Brexit
- Is GOLD Retreat Over?
- Trading plan for EUR/USD on July 10, 2020. The escalation of coronavirus infection has decreased the demand for risky assets.
- Technical analysis recommendations for EUR/USD and GBP/USD on July 10
| July 10, 2020 : EUR/USD Intraday technical analysis and trade recommendations. Posted: 10 Jul 2020 09:29 AM PDT
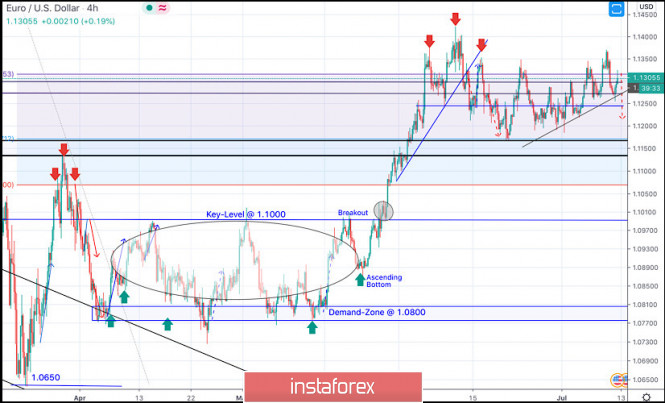
On March 20, the EURUSD pair has expressed remarkable bullish recovery around the newly-established bottom around 1.0650. Shortly after, a sideway consolidation range was established in the price range extending between 1.0770 - 1.1000. On May 14, evident signs of Bullish rejection as well as a recent ascending bottom have been manifested around the price zone of (1.0815 - 1.0775), which enhances the bullish side of the market in the short-term. Bullish breakout above 1.1000 has enhanced further bullish advancement towards 1.1175 (61.8% Fibonacci Level) then 1.1315 (78.6% Fibonacci Level) where bearish rejection was anticipated. Although the EUR/USD pair has temporarily expressed a bullish breakout above 1.1315 (78.6% Fibonacci Level), bearish rejection was being demonstrated in the period between June 10th- June 12th. This suggested a probable bearish reversal around the Recent Price Zone of (1.1270-1.1315) to be watched by Intraday traders. Hence, Bearish persistence below 1.1250-1.1240 (Head & Shoulders Pattern neckline) was needed to confirm the pattern & to enhance further bearish decline towards 1.1150. Moreover, bearish breakdown below the depicted keyzone around 1.1150 is mandatory to ensure further bearish decline towards 1.1070 and 1.0990 if enough bearish pressure is maintained. Trade recommendations : The current bullish movement towards the price zone around 1.1300-1.1330 (recently-established supply zone) should be followed by Intraday Traders as a valid SELL Signal.T/P levels to be located around 1.1175 then 1.1100 while S/L to be placed above 1.1350. The material has been provided by InstaForex Company - www.instaforex.com |
| July 10, 2020 : GBP/USD Intraday technical analysis and trade recommendations. Posted: 10 Jul 2020 09:24 AM PDT
Recently, Bullish breakout above 1.2265 has enhanced many bullish movements up to the price levels of 1.2520-1.2590 where temporary bearish rejection as well as a sideway consolidation range were established (In the period between March 27- May 12). Shortly after, transient bearish breakout below 1.2265 (Consolidation Range Lower Limit) was demonstrated in the period between May 13 - May 26. However, immediate bullish rebound has been expressed around the price level of 1.2080. This brought the GBPUSD back above the depicted price zone of 1.2520-1.2600 which failed to offer sufficient bearish rejection. Hence, short-term technical outlook has turned into bullish as well, further bullish advancement was expressed towards 1.2780 (Previous Key-Level) where signs of bearish rejection were expressed. Short-term bearish pullback was expressed, initial bearish destination was located around 1.2600 and 1.2520. Moreover, a bearish Head & Shoulders pattern (with potential bearish target around 1.2265) was recently demonstrated on the chart. That's why, bearish persistence below 1.2500 ( neckline of the reversal pattern ) paused the bullish outlook for sometime & enabled further bearish decline towards 1.1265. However, significant bullish rejection around 1.2265 brought the GBP/USD pair back towards 1.2600 - 1.2620 where a cluster of resistance levels are located. Signs of bearish rejection should be watched around the current price zone of 1.2550-1.2620 (recent supply zone) as it indicates a high probability of bearish reversal. Trade recommendations : Intraday traders can consider the current bullish pullback towards the depicted Supply Zone (1.2550-1.2620) for a valid SELL Entry. Stop Loss should be placed above 1.2650 while T/P level to be located around 1.2450 & 1.2265. The material has been provided by InstaForex Company - www.instaforex.com |
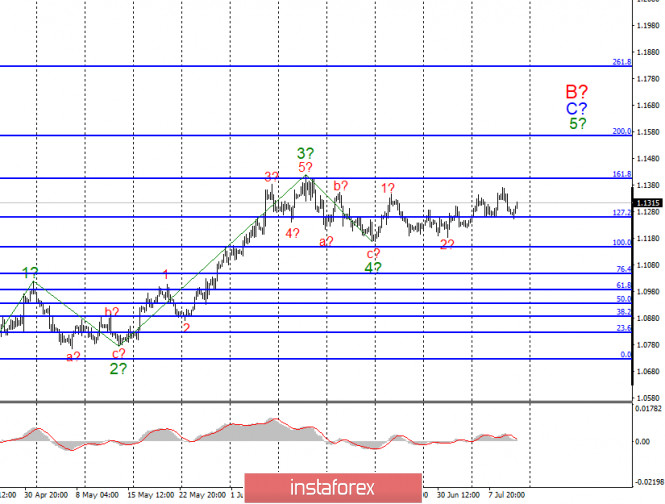
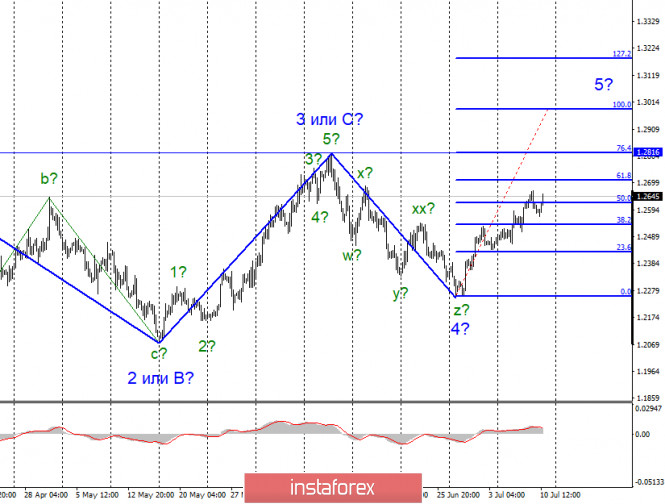
| Posted: 10 Jul 2020 08:30 AM PDT EUR/USD On July 9, the EUR/USD pair lost about 45 basis points and made an unsuccessful attempt to break through the 127.2% Fibonacci level. Thus, the current wave marking remains unchanged and is still set to form an upward wave 5 in C and B. If this scenario is true, then the price will rise further to the targets located at 161.8% and 200.0% Fibonacci. So, the wave 5 in C and B is likely to take a very complex and extended form. Fundamental factors: No important economic reports were expected today and yesterday both in Europe and the US. I did not pay any attention to the data on jobless claims in the US since it does not seem to influence the markets any longer. Investors were terrified by its huge numbers only at the beginning of the COVID-19 outbreak. However, today the reaction is rather calm. Other news was not of big importance as well. Yesterday, during the video conference, the Eurogroup elected its new president Paschal Donohoe, the Irish minister of finance.Yet, the markets are more willing to know when the EU will approve the EU Economic Recovery Fund of 750 billion euros. This is especially important now after US Treasury Secretary Steven Mnuchin said that the next stimulus package could be approved and implemented by the Congress as soon as in late July. Amid this news, the EUR/USD pair was trading mixed showing that neither bulls nor bears have gained momentum. It turns out that the coronavirus spread in the US remains the most worrisome factor for the markets. The virus is rapidly spreading across the country, and the White House seems unable to do anything about it. So far, the US president has not made any statements regarding the measures to combat the second wave of the pandemic. I think that this may lead to Donald Trump's lower rating ahead of the election. What is more, his opponent Joe Biden has now more reasons to criticize him. And there is a real reason for criticism since the US has almost completely lost its fight against the pandemic. Those countries that managed to control the virus are now lifting the lockdowns and returning back to normal life. In the US, however, the quarantine lockdown has been removed too early, and the virus continues to infect nearly 50-60 thousand Americans every day. Conclusion and recommendations: The euro/dollar pair is expected to continue the formation of the upward wave C in B. Thus, I recommend opening long deals on the pair with the targets at 1.1406 and 1.1570. These levels correspond to 161.8% and 200.0% Fibonacci for every MACD signal for the uptrend calculated on the formation of wave 5 in C and B. GBP/USD On July 9, the GBP/USD pair advanced by only several basis points. So, the current wave marking remained almost unchanged. I still expect the formation of an upward wave 5 as part of the uptrend. For this wave, the closest target is located near the peak of wave 3 or C. A successful attempt to break through the 1.2816 mark will indicate more long deals on the pound. Fundamental factors: No significant news was released in the UK on Thursday. UK Chancellor Rishi Sunak unveiled the government's plan to adopt a stimulus package worth £30 billion. The rescue program is aimed at those employers who kept their employees during the pandemic and the lockdown. It was also speculated this week that the EU is ready to find a compromise with the UK regarding the future Brexit trade agreement. However, this information is not confirmed. Conclusion and recommendations: The changes in the pound/dollar pair trajectory have made the current wave marking more complex. This is sure to lead to the formation of a new upward wave. Therefore, I recommend placing long positions on the pair with the targets at 1.2816 and 1.2990, which corresponds to the peak of the wave 3 or C and 100.0% Fibonacci. The material has been provided by InstaForex Company - www.instaforex.com |
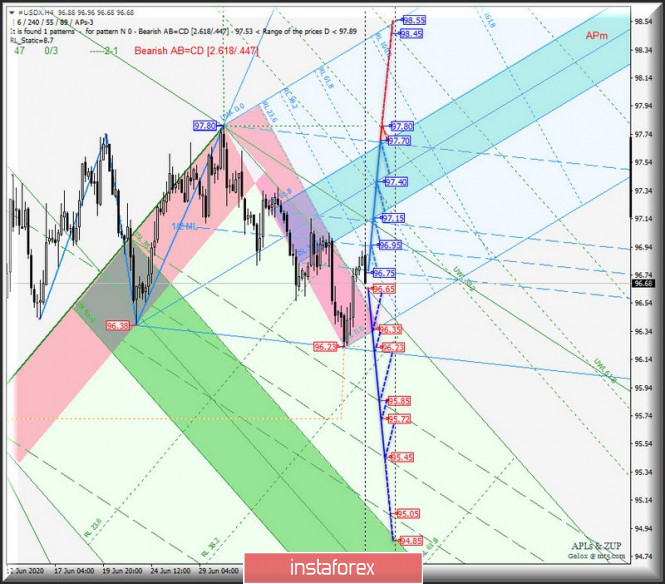
| Posted: 10 Jul 2020 08:20 AM PDT Minute operational scale (H4) Who will be happy with the number 13 - for the "bulls" or for the "bears"? Development options for the movement of #USDX vs EUR/USD & GBP/USD & USD/JPY (H4) on July 13, 2020. ____________________ US dollar index From 13 July 2020, the movement of the dollar index #USDX will be due to the training and direction of a breakout of the range:
In case of breakdown of the resistance level of 96.75, #USDX movement will continue in the 1/2 channel Median Line Minuette (96.75 - 96.95 - 97.15) with the prospect of continuing it already in the equilibrium zone (97.15 - 97.40 - 97.70) of the Minuette operational scale fork. When the support level of 96.65 is broken on the initial SSL line of the Minute operational scale fork, followed by the update of the local minimum 96.23, the downward movement of the dollar index may continue to the borders of the channel 1/2 Median Line Minute (95.85 - 95.45 - 95.05). The layout of the #USDX movement options from July 13, 2020 is shown on the animated chart.
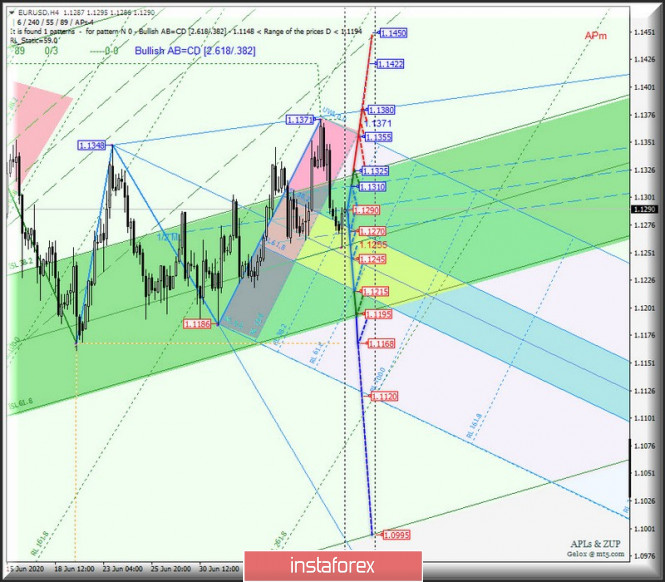
___________________ Euro vs US dollar The development of the movement of the single European currency EUR/USD from July 13, 2020 will be determined by the development and direction of the breakdown of the borders of the 1/2 Median Line channel (1.1310 - 1.1290 - 1.1270) of the Minuette operational scale fork - see details on the animated chart. If the support level of 1.1270 breaks at the lower border of the channel 1/2 Median Line Minuette, the single European currency will continue its movement inside the equilibrium zone (1.1270 - 1.1245 - 1.1215) of the Minuette operational scale fork with the prospect of reaching the lower bound of ISL61.8 (1.195) of the Minute operational scale fork and updating the local minimum of 1.168. When the upper limit of the channel 1/2 Median Line is broken, the Minuette operational scale fork - the resistance level of 1.1310 - the movement of EUR/USD can be directed to the goals:
The EUR/USD movement options from July 13, 2020 are shown on the animated chart.
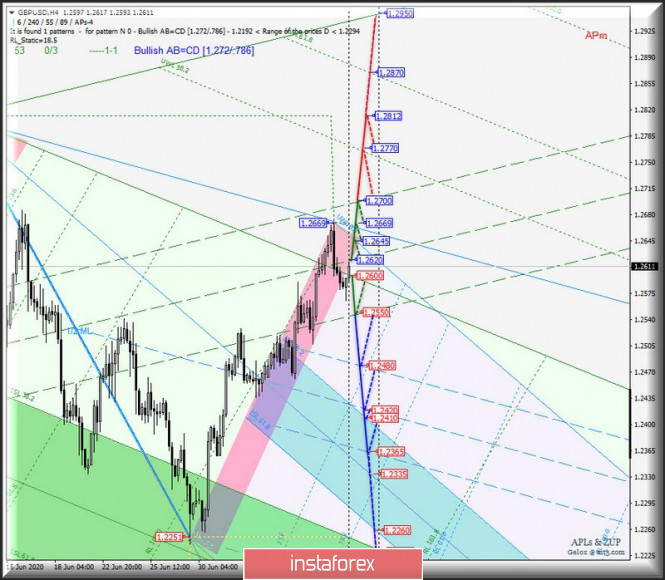
____________________ Great Britain pound vs US dollar The movement of Her Majesty's currency GBP/USD from July 13, 2020 will continue in the 1/2 medium Line channel (1.2700 - 1.2610 - 1.2550) of the Minute operational scale fork, taking into account the direction of the breakdown of the range:
Details of movement within this channel are shown on the animated chart. If the support level of 1.2600 on the starting line SSL of the Minute operational scale fork will make possible the continuation of the downward movement of GBP/USD to the lower border of the channel 1/2 Median Line Minute (1.2550) and the channel borders 1/2 Median Line (1.2480 - 1.2420 - 1.2365) of the Minuette operational scale fork. A break of the resistance level of 1.2620 at 1/2 Median Line Minute will determine the continuation of the movement of the currency of Her Majesty to the goals:
We look at the GBP/USD movement options from June 13, 2020 on the animated chart.
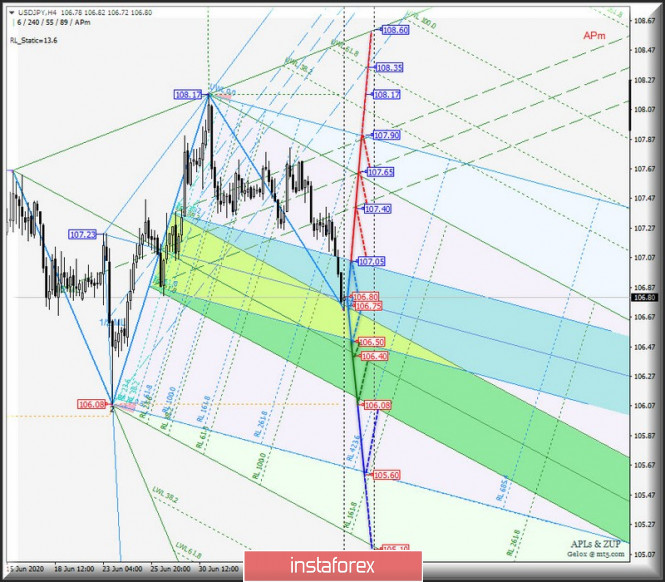
____________________ US dollar vs Japanese yen The development of the movement of the currency of the "Land of the Rising Sun" USD/JPY will continue from July 13, 2020, depending on the development and direction of the breakdown of the boundaries of the equilibrium zone (107.05 - 106.80 - 106.50) of the Minuette operational scale fork - marking of movement within this equilibrium zone is shown on the animated graph. If the resistance level of 107.05 is broken at the upper border of the ISL38.2 balance zone of the Minuette operational scale fork, the upward movement of USD/JPY will be directed to the borders of the 1/2 Median Line channel (107.40 - 107.65 - 107.90) of the Minute operational scale fork. If the support level of 106.50 breaks at the lower border of ISL61.8 equilibrium zone of the Minuette operational scale fork, it will be relevant to continue the movement of the "Land of the Rising Sun" currency towards the goals:
The marking of USD/JPY movement options since July 13, 2020 is shown on the animated chart.
____________________ The review is compiled without taking into account the news background, the opening of trading sessions of the main financial centers and is not a guide to action (placing "sell" or "buy" orders). Formula for calculating the dollar index: USDX = 50.14348112 * USDEUR0.576 * USDJPY0.136 * USDGBP0.119 * USDCAD0.091 * USDSEK0.042 * USDCHF0.036. Where the power coefficients correspond to the weights of currencies in the basket: Euro - 57.6 %; Yen - 13.6 %; Pound - 11.9 %; Canadian dollar - 9.1 %; Swedish Krona - 4.2 %; Swiss franc - 3.6 %. The first coefficient in the formula brings the index value to 100 on the starting date - March 1973, when the main currencies began to be freely quoted relative to each other. The material has been provided by InstaForex Company - www.instaforex.com |
| Unjustified rally over: Forex again going through downward correction Posted: 10 Jul 2020 07:48 AM PDT Global currency markets are gradually coming down to earth amid escalating concerns over the second wave of the COVID-19 pandemic. The robust rally seems to come to an end. Now Forex is going through the global downward correction. Nevertheless, the US dollar, the Japanese yen, and the Swiss franc are more confident being traditional safe haven assets. Investors are seeking shelter for their savings buying those assets. The Japanese currency has managed to assert strength to the highest levels in the latest two weeks. At the same time, riskier assets have come under pressure in the morning and are trading lower. The reason behind risk aversion is the rapid resurgence in the coronavirus rates in the US and around the world. With such rampant rates, a number of countries are thinking about re-imposing restrictive measures in an effort to stamp out the infection. A new lockdown threatens the fragile recovery in the global economy. On Wednesday, a few American states reported a record surge in new cases. So, in a single day the US set a new record of about 60,000 confirmed cases. Such an alarming increase has never been recorded during the whole pandemic period. Apart from the US, new cases were reported in Japan, China, and Europe. This arouses grave concerns and casts the shadow over the prospects of the global economy, thus market sentiment is turning sour. The risk-off mood boosted demand for the Japanese yen, so that it climbed to the strongest level on the latest two weeks. The yen gained 0.25% versus the US dollar. USD/JPY is trading currently at near 106.93. The US dollar index which measures the greenback's strength against a basket of major currencies also edged up 0.2%. Today the index is trading at about 96.919, having rebounded from a one-month low of 96.233. The Swiss currency is also gaining popularity among investors. The franc is trading at highs against the single European currency. EUR/CHF is trading at near 1.0619. The franc is showing a similar dynamic against the US dollar. USD/CHF settled up at 0.9419, surpassing the latest high of 0.93625. The single European currency is losing ground a bit. It edged down 0.1% to trade at 1.1273 versus the US dollar, lower than the recent high of 1.1371. The US currency perked up following weekly updates on the US labor market. Yesterday, the US Labor Department reported that the number of initial unemployment claims declined to the greatest extent in the recent 4 months. No wonder, market participants cheered the evidence of improvement in the US employment. Nevertheless, there is a fly in the ointment. Large US companies have reported a wave of layoffs. This is a worrisome signal that the US labor market has to go a long way until its full recovery. Some currencies vulnerable to external headwinds have already stalled growth and entered the phase of the downward correction. The Australian dollar shed 0.5%. So, the AUD/USD pair fell to 0.6929. Previously, the currency pair climbed as high as 0.7001 in the recent month. The Chinese yuan also lost footing, logging a 0.2% decline. Currently, the renminbi is trading at 7.0115 against the US dollar, weaker than the previous high of 6.9808. To sum up, investors are puzzled about prospects in global currency markets. One thing is certain that the coronavirus determines market sentiment and requires cautious investment. Things could turn upside down anytime. The material has been provided by InstaForex Company - www.instaforex.com |
| EUR / USD: Expect a warm week ahead for euro Posted: 10 Jul 2020 07:15 AM PDT
On Thursday, 63,000 new cases of COVID-19 were reported in the United States. This is the largest leap that has ever occurred in any country during the coronavirus pandemic. However, in some cities in the Asia-Pacific region that have previously been able to contain the disease, such as Tokyo, Hong Kong, and Melbourne, there have been alarming new outbreaks of the infection. Market sentiment is quite correlated with these indicators. The S&P 500 index fell by more than 0.5%, almost zeroing the increase at the beginning of the week. The EUR / USD pair lost 100 points, sifting to the level of 1.1260, and failing to test the resistance at 1.1400. The reduction in the balance of the Federal Reserve, which acts as a kind of indicator of the level of liquidity in the financial system, does not add optimism to market participants. Its decline undermines the positive attitude of the players, which is especially noticeable during the period of heightened concern about the new wave of the spread of COVID-19 and the associated economic consequences. The number of initial applications for unemployment benefits in the United States fell to 1.344 million, exceeding forecasts, but the number of repeated applications is more than 18 million. According to some analysts, high unemployment in the United States may indicate the early stages of a recession, rather than the beginning of a recovery in economic activity in the country. Meanwhile, a summit of EU leaders is approaching in Europe (July 18–19), at which they will discuss proposals for a fund to restore the region's economy. German Chancellor Angela Merkel, one of the initiators of the idea of creating a fund, called on leaders of other states not to lose time and act. ECB President Christine Lagarde also called on national governments of the EU to take action. Next week (July 16), the ECB will announce its next monetary policy verdict and share its current assessment of the situation. Upon its decline, the EUR / USD broke through the support of the upward trend, which held back the pair's rollback from early July. Nevertheless, it still holds above the line of May's upward trend. Support is found at 1.1250, 1.1220, 1.1190 (which kept the pair from declining several times last week) and 1.1160 (mid-June low). Resistance is located at 1.1300 (a round figure that restrained the growth of the pair last week), 1.1350 (the former triple top), and 1.1375 (July maximum). The material has been provided by InstaForex Company - www.instaforex.com |
| Evening review on EURUSD for July 10, 2020 Posted: 10 Jul 2020 07:02 AM PDT
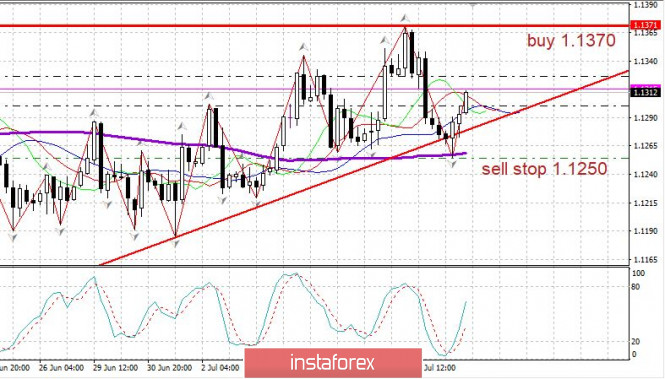
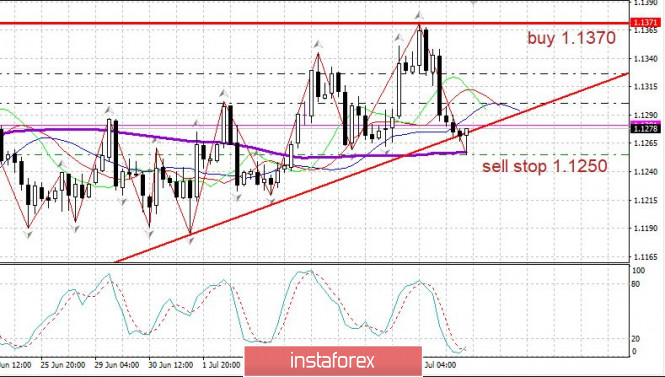
EURUSD The morning hike moved at a slow pace, thus showed that buyers have no strength in the euro. They updated the June maximum by as much as 20 pips and then collapsed to 1.1255 which is 120 points down. Thus, did not justify a potential growth. However, during the downward trend, the sellers reached a three-day low which exhausted their strength. This opened the opportunity for the buyers to pull the euro on an upward trend. At present, there are shifting trends so the bottom line is, the direction is unclear. You may consider purchases from 1.1370. Sell from 1.1250. The material has been provided by InstaForex Company - www.instaforex.com |
| Posted: 10 Jul 2020 06:11 AM PDT
Billionaire and founder of Heisenberg Capital Max Keiser said that the price of bitcoin could rise to $100,000. He is confident that this cryptocurrency will excel other projects, even the XRP token. Due to this, the problem with all altcoins will be solved, as some of them receive state support. Yet, bitcoin will be irreplaceable. Other cryptocurrency projects receive US subsidies as support during the crisis. This number includes 75 companies working in the blockchain and cryptocurrency sphere, such as MyEtherWallet, the project of IOHK. According to some reports, $30 million was spent on these projects. However, the billionaire strongly criticized them. At the beginning of this year, Kaiser suggested that bitcoin would cost $400,000. However, it is still not clear when the cryptocurrency will reach this level. Nevertheless, bitcoin will stay an attractive currency at any rate, says Max Keiser. The material has been provided by InstaForex Company - www.instaforex.com |
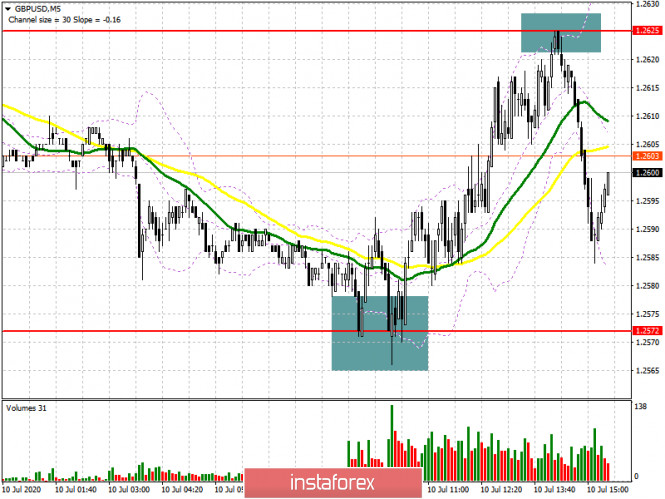
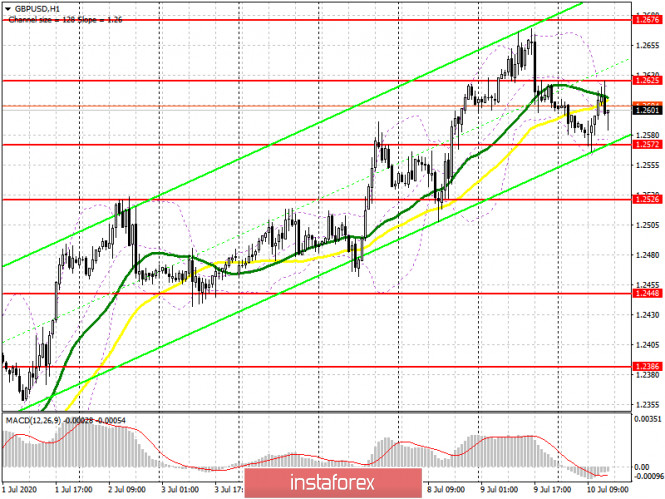
| GBP/USD: plan for the American session on July 10 Posted: 10 Jul 2020 05:56 AM PDT To open long positions on GBPUSD, you need: In the first half of the day, I paid attention to the support level of 1.2572 and recommended that it open long positions when forming a false breakout there, which happened. If you look at the 5-minute chart, you will see how the bulls did not let the pair fall below the area of 1.2572 and the repeated test of this level formed a good signal to open long positions, which eventually led the GBP/USD to the resistance of 1.2625. There was the first profit-taking. However, larger players will expect to break through this range. Fixing at the level of 1.2625 will open a direct path to the maximum of 1.2676 and to the exit to the larger area of 1.2754, where I recommend fixing the profits. In the case of a downward correction in the second half of the day, you can still watch purchases when forming a false breakout in the support area of 1.2572, but I recommend opening long positions immediately on a rebound only from the minimum of 1.2526 in the calculation of a correction of 30-40 points within the day.
To open short positions on GBPUSD, you need: At the moment, the important task of the bears is to break through and consolidate below the support of 1.2572, which was not possible in the first half of the day. Only such a scenario will knock down the bullish momentum and lead to a further major decline in the pound in the area of 1.2526. The longer-term goal remains at least 1.2448, where I recommend fixing the profits. An equally important task will be to protect the resistance of 1.2625, the first test of which has already taken place during the European session. However, it has not yet reached the formation of a false breakdown. Only this option will be a signal to open short positions in order to re-decrease to the support of 1.2572. I recommend opening short positions immediately for a rebound only after updating the larger level of 1.2676 in the expectation of a correction of 30-40 points within the day.
Signals of indicators: Moving averages Trading is conducted around the 30 and 50 daily averages, which indicates that buyers are trying to continue the bull market. Note: The period and prices of moving averages are considered by the author on the hourly chart H1 and differ from the general definition of the classic daily moving averages on the daily chart D1. Bollinger Bands Breaking the upper limit in the area of 1.2625 will lead to a new wave of growth of the pound. A break in the lower border at 1.2572 will increase the pressure on the pound. Description of indicators
|
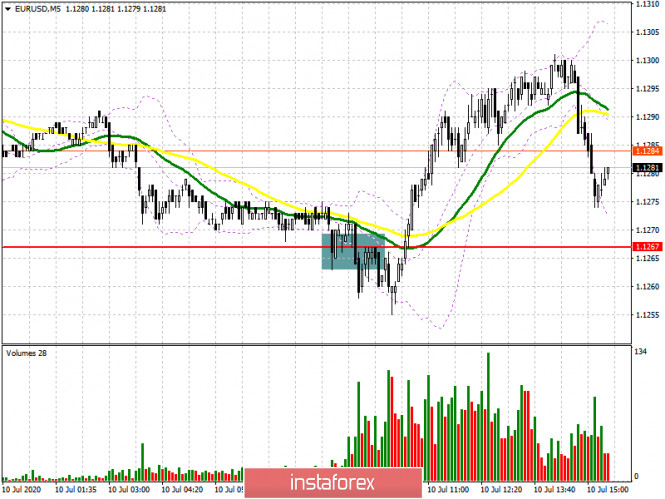
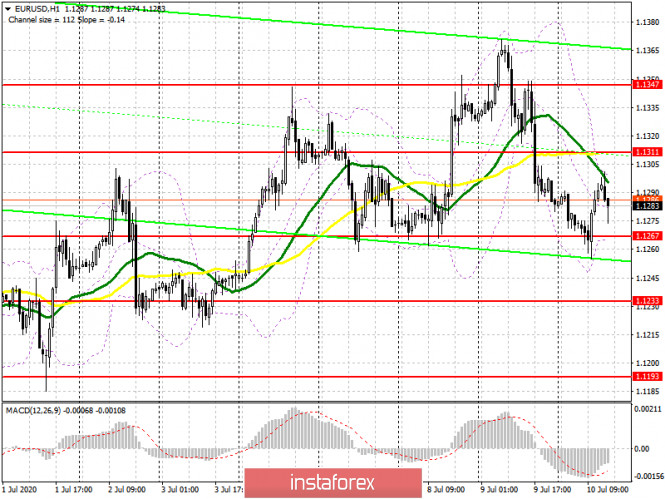
| EUR/USD: plan for the American session on July 10 Posted: 10 Jul 2020 05:52 AM PDT To open long positions on EURUSD, you need: From a technical point of view, there were no changes, except for the sell signal, which was formed in the first half of the day and did not bring a profit. If you look at the 5-minute chart, you can see how the bears hold the level of 1.1267 and test it from the bottom up, after which another wave of decline in the euro begins to form, which turned out to be quite short. After some time, buyers returned to the level of 1.1267 and began to actively grow the pair. Therefore, at the moment, the task of the bulls remains to protect the support of 1.1267, since its breakdown will lead to a break in the upward trend formed on July 1 this year. I recommend opening long positions from this range only after a repeated decline and testing this level. When the support breaks 1.1267, it is best to wait for the update of the new low of 1.1233 and open long positions from it immediately for a rebound in the expectation of a correction of 20-25 points within the day. Larger bulls will prefer to wait for the update of the area of 1.1193. An equally important task will be to return EUR/USD to the resistance level of 1.1311, fixing above which will be an additional signal to buy, which can lead to the maximum of the week in the area of 1.1347, where I recommend fixing the profits.
To open short positions on EURUSD, you need: Only a repeated consolidation below the support of 1.1267 will be a signal to open short positions in the euro in the hope of reducing and updating the larger minimum of 1.1233, where I recommend fixing the profits. The longer-term goal will be the area of 1.1193. If the pair grows in the second half of the day, it is best to stop selling before forming a false breakout in the area of the resistance of 1.1311 or open short positions immediately to rebound from the larger resistance of 1.1347 in the expectation of a downward correction by the end of the day of 20-25 points.
Signals of indicators: Moving averages Trading is just below the 30 and 50 daily moving averages, which keeps the market on the side of euro sellers. Note: The period and prices of moving averages are considered by the author on the hourly chart H1 and differ from the general definition of the classic daily moving averages on the daily chart D1. Bollinger Bands Breaking the lower border of the indicator in the area of 1.1267 will increase pressure on the euro. Growth above the upper limit in the area of 1.1305 will lead to bullish momentum. Description of indicators
|
| Chinese yuan to hardly replace US dollar as reserve currency Posted: 10 Jul 2020 05:46 AM PDT
US politicians are concerned about China's growing role in the world, and especially in the US economy. There is a trade imbalance between the countries. The US president is introducing tariffs on goods from China. This is the main reason for the souring of relations between two countries. Experts believe that the countries are on the edge of a trade war. Moreover, due to the difficult epidemiological situation in the United States, the country's economy is on the verge of collapse. Many analysts argue that the US dollar will soon depreciate and the Chinese yuan will take its place. However, the US and Chinese economies are interconnected. If the US market collapses, the Chinese market will collapse too. Also, China's production is export-oriented. The GDP structure shows that consumption in China is low. This means that the country's production is focused on the needs of other countries. In other words, the Chinese yuan is unlikely to gain the dominance. Ebrahim Rahbari, head of currency analysis at Citi, believes that the yuan will not become a reserve currency any time soon. Rahbari explained that the so-called safe-haven assets typically have certain attributes. Firstly, the analyst said, they tend to offer a long-term store of value function. Rahbari also said that the Chinese yuan "doesn't qualify" in terms of attributes typically associated with safe-havens, such as providing "refuge" during "periods of crisis." Mr. Rahbari is sure that the yuan is not suitable as a reserve currency. It will take a very long time to become an alternative to the US dollar and treasury bonds, even if the prospects for the Chinese economy are favorable as a whole. There is a rise in China's stock markets, which significantly boosts the yuan. On Thursday, the Chinese currency was trading at 6.99 per dollar, after rising above 7.05 the day before. The offshore analogue of the currency, meanwhile, changed hands at 6.9892 per dollar. Before evaluating the yuan as a "safe haven", it is necessary to consider the situation in Asia and what is happening with the US dollar, the analyst said. He suggests that the situation is more like a decline than a steady rise in the US dollar/yuan pair. Rahbari suggests the Chinese yuan would remain below 7. The material has been provided by InstaForex Company - www.instaforex.com |
| US and Asian stock indices sagged Posted: 10 Jul 2020 05:21 AM PDT
The US and Asian stock markets underwent negative dynamics on Friday. The reasons for the decline are still due to the continuous growth of the COVID-19 cases in the Americas and the other parts of the world, as well as concerns about a relatively slower than previously expected economic recovery. The first factor has been tormenting the markets for the third week in a row while investors, on the other hand, continue to ignore it. However, with the present condition, investors would have to think twice. The threat of the second wave and its negative consequences is starting to grow a possibility, which means that the appetites of market participants are reduced. Traders are even more worried about the serious consequences of the second wave, which can lead to greater losses than previously expected. Japan's Nikkei 225 index fell by 0.7%. Mitsui Fudosan Co. had a greater loss with 5.1% followed by car manufacturers Suzuki Motor Corp. with 3.8%, Honda Motor Co. by 2.8%, and Mitsubishi Motors Corp. by 3.7%, respectively. The China Shanghai Composite Index also fell by 1.4%. The Hong Kong index sank even further, which fell 2.2%. The shares of China Life Insurance Co were the most affected falling 6.5% of the value. The South Korean Kospi Index fell 1.2%. Corporate losses here are not so big, but still a negative. Samsung fell 0.8% while Sharp Corp. by 2%. Australia's S & P / ASX 200 index declined 0.9%. At the same time, the value of shares of the largest mining companies BHP and Rio Tinto went down. The former lost 1%, and the latter by 1.1%. The situation in world stock markets has been extremely mixed lately. They were able to bring back the bulk of the losses that occurred against the background of the first wave of coronavirus infection in the world. The only problem is that the rally in the markets was so rapid and sharp that now, perhaps, a significant negative correction is being observed, which will return everything to its previous level. The situation is heating up due to extreme tension and uncertainty. Market participants are gravely concerned that the number of COVID-19 cases in the world are growing rapidly daily. In view of this, investors are trying to make their work as safe as possible, so those sectors that have won the confidence of investors come to the fore. It includes, in particular, the technology sector which should provide the most support to the main stock indicators. However, the spread of coronavirus infection is growing rapidly and it seems that we can no longer talk about a more accelerated restoration of economic growth. On Wednesday, there was a record increase in the number of cases in some US states. Moreover, more and more new cases are recorded daily in Latin America, as well as in Asia and Europe. US stock indices are changing in different directions. The S&P 500 and Dow corrected downward, while Nasdaq continues to break positive records. The reason for the negative here was the increasingly obvious introduction of quarantine restrictive measures related to the containment of coronavirus infection. On Wednesday alone, a record breaking increase of 60,000 COVID-19 patients was recorded. And this is a negative record. Market participants began to pay close attention to statistics coming from the largest companies in the hope of finding a point of support and growth in it. However, there is not too much positive. Thus, according to preliminary forecasts, the S&P 500 should face a decrease in the level of profit by about 40%. If this happens, it will be the most serious decline in the last twelve years. Most analysts have already begun to reject the theory of a quick V-shaped economic recovery, which was previously anticipated. Meanwhile, all the negativity did not stop the Nasdaq index from taking on the lead again. This was the fifth record growth over the past six days. The index receives the main wave of positive from shares of Amazon.com, Microsoft Corp., Nvidia, and Apple Inc. which all underwent growth. The Dow Jones Industrial Average index lost 1.39% on Thursday and dropped to 25 706.09 points. The S&P 500 index followed a negative trend and fell 0.56%, which sent it to a new mark of 3,152.05 points. The Nasdaq Composite Index went against the current trend and showed steady growth of 0.53%, which moved it to another record level of 10,547.75 points. The material has been provided by InstaForex Company - www.instaforex.com |
| Posted: 10 Jul 2020 04:55 AM PDT Technical analysis:
BTC has been trading downwards and it confirmed the fake breakout for the supply trend line, which is indication for the further downside movement. I see further drop on BTC towards the $8,000 level. Trading recommendation: Based on the 4H time-frame price action chart, I found that there is fake breakout of the resistance at the price of $9,400, which is big clue that sellers took control over buyers. Watch for selling opportunities on the rallies using the intraday charts like 15/30 minutes for better entry location. Downward reference and target is set at $7,800 The material has been provided by InstaForex Company - www.instaforex.com |
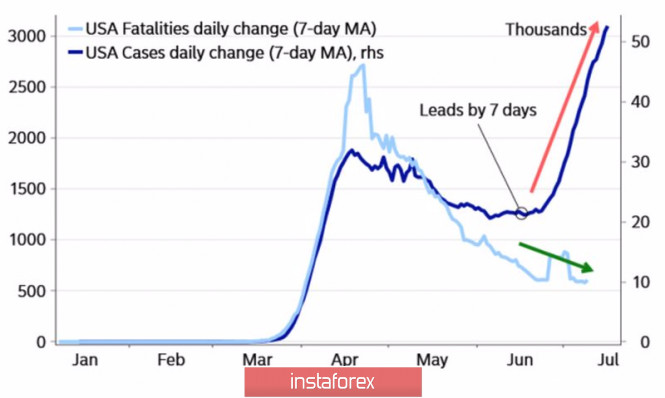
| Dollar: don't go against Trump! Posted: 10 Jul 2020 04:46 AM PDT Don't fight against the Fed. Markets have been living with this rule for decades, however, the "bears" on US stock indices have to face not only the central bank but also Donald Trump, as well as Beijing, which has called on the population to buy local shares, arguing that promoting a healthy "bull" market has never been more important than now. As a result, the Shanghai Composite fired, and its American counterparts will think three times before deciding on a correction. Although the scale of the Fed's monetary stimulus is enormous, FOMC officials say that the regulator can further increase the balance sheet if necessary. For some, this is a signal of the Fed's doubts about the bright future of the US economy, for others - a reminder that a war with the central bank is like death. No less dangerous is the confrontation with Donald Trump, who is preparing for the presidential election. Treasury Secretary Steve Mnuchin recalled the White House's intention to expand fiscal stimulus until the August holidays, and the head of state will do everything possible to ensure that the S&P 500 does not fall, because the stock index, in his opinion, is the best indicator of the effectiveness of its policies. As a result, the sagging stock market is actively bought back, especially since, despite the growth in the number of infected with COVID-19, the number of deaths is not growing. Whether the cause is the weakness of the virus itself or the best preparation of medicine, it does not matter. The main thing is that the risks of repeated lockdown fall. Dynamics of the number of infected and dead from COVID-19
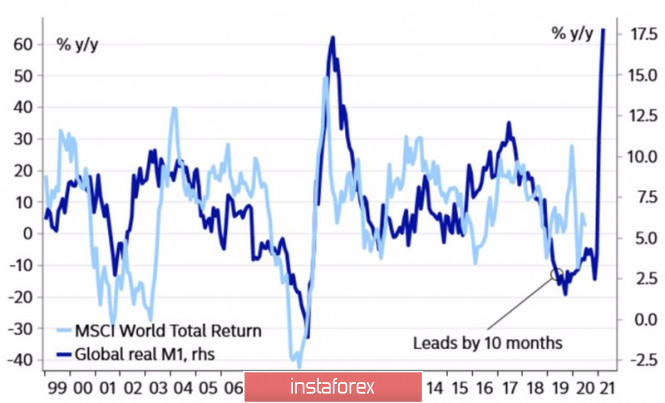
The euro draws strength both from a reduction in the yield differentials of peripheral Eurozone bonds with their German counterparts, which indicates a reduction in financial stress; and from an improvement in global risk appetite thanks to China. It should be noted that large-scale fiscal and monetary incentives lead to an increase in the money supply, which has a positive impact on global stock indices and a negative impact on safe-haven currencies. In this regard, the medium and long-term prospects for the US dollar look bleak, and the EUR/USD falls, just like the S&P 500 pullbacks, are quickly redeemed. Dynamics of money supply and global MSCI
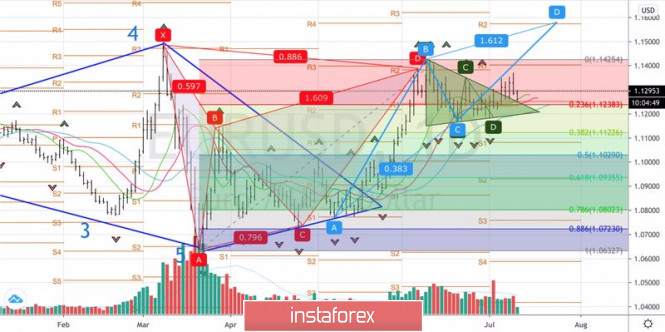
The ECB bulls are not embarrassed by the ECB meeting scheduled for the end of the week by July 17 and the EU summit, which will discuss the Franco-German proposal for a fiscal stimulus of € 750 billion. Angela Merkel reminded that Europe is facing an unprecedented crisis. Most likely, we expect a positive verdict, which is extremely important for the recovery of the upward trend in EUR/USD. As for the ECB, despite the forecasts of Bloomberg experts about the expansion of QE by €500 billion by the end of the year, it is unlikely that Christine Lagarde will talk about this at the next meeting. Technically, the euro managed to break away from the upper border of the previously formed triangle. A successful retest of support at $ 1.125-1.1255 indicates the strength of the "bulls" and allows you to make recommendations about buying EUR/USD on breakouts of resistance at 1.1375 and 1.14 with the specified pattern AB=CD target at 1.16. EUR/USD, the daily chart
|
| Analysis of Gold for July 10,.2020 - Potential for the another drop towards the $1.790 Posted: 10 Jul 2020 04:43 AM PDT Technical analysis:
Gold has been ttrading downwards as I expected.The Gold reached and rejected of our first downward target at $1,797 but it is now in overbought zone with potential for further drop. Trading recommendation: Based on the 1H time-frame price action chart, I found that there is test and reject of the resistance at $1,810, which is good sign for ther further downside. Watch for selling opportunities on the rallies using the intraday charts like 15/30 minutes for better entry location Downward references (targets) are set at $1,797 and $1,790 The material has been provided by InstaForex Company - www.instaforex.com |
| Posted: 10 Jul 2020 04:36 AM PDT Technical analysis:
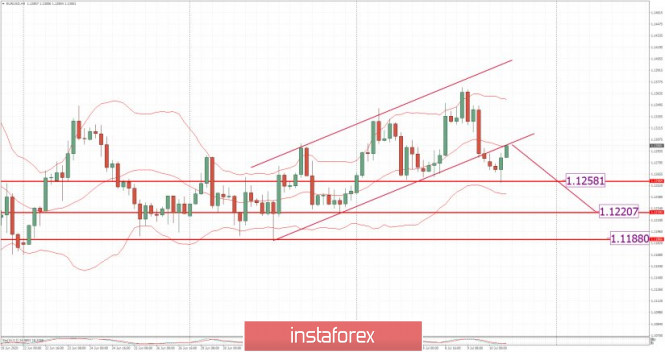
EUR/USD has been trading downwards as I expected. I still see further downside due to breakout of the rising trend line. Trading recommendation: Based on the 4H time-frame price action chart, we found that there is the breakout of the rising trendline and the fake breakout of the resistance yesterday at 1.1345, which is sign for the further downside rotation... Watch for selling opportunities on the rallies using the intraday charts like 15/30 minutes for better entry location Downward references (targets) are set at 1.1225-1.1200 Major resistance is set at 1.1345 The material has been provided by InstaForex Company - www.instaforex.com |
| Posted: 10 Jul 2020 03:24 AM PDT
Crude oil fell after a key Libyan oil field resumed production. It threatens to release barrels of oil into the market where demand is already low. Thus, due to this, oil futures in the US fell 3%. The Mesla and Sarir oil fields in eastern Libya resumed production after halting due to a technical problem. However, layoffs from Wells Fargo and Walgreens Boots Alliance have reduced the potential for recovery in demand, so this resumption of oil production is not good news. "It will be difficult for the global market to absorb these additional Libyan barrels," said John Kilduff, the founding partner of Again Capital. "In addition, there will be tens of thousands of layoffs of people who will be left without work and will not drive a car," Kilduff added. US oil initially recovered after collapsing below zero in April. However, the recovery was limited to futures trapped around $ 40 per barrel. The Goldman Sachs, for instance, recommended buying Brent futures on West Texas Intermediate as US stocks grew. Hence, at 08:26 (UTC + 1), August delivery of WTI oil in New York fell $ 1, settling to $ 39.90 a barrel. Meanwhile, Brent oil for September delivery dropped by 72 cents, amounting to $ 42.57 per barrel. Such complicated the dynamics of the market, and tankers that stored most of the world's oil began to unload cargo. The material has been provided by InstaForex Company - www.instaforex.com |
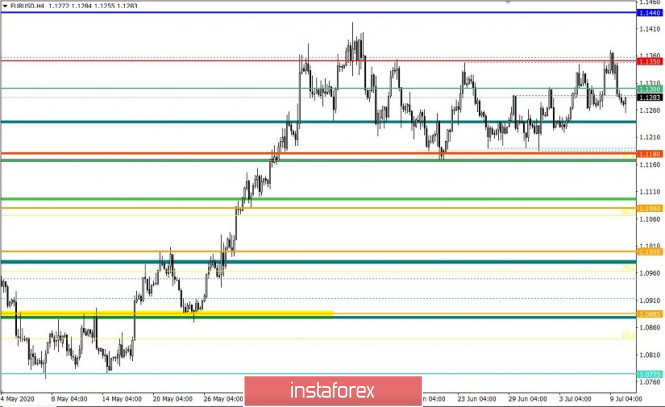
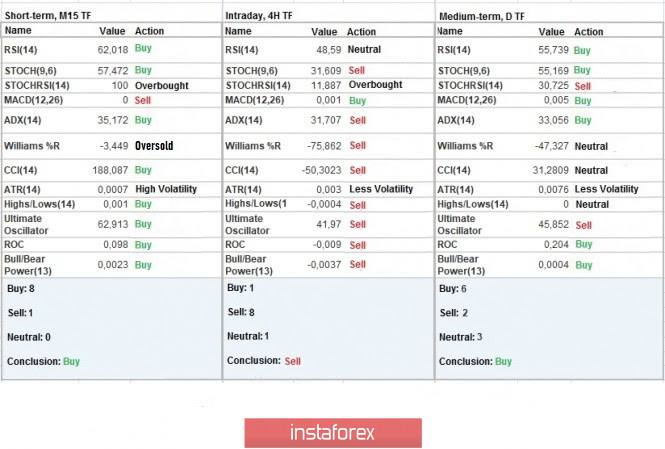
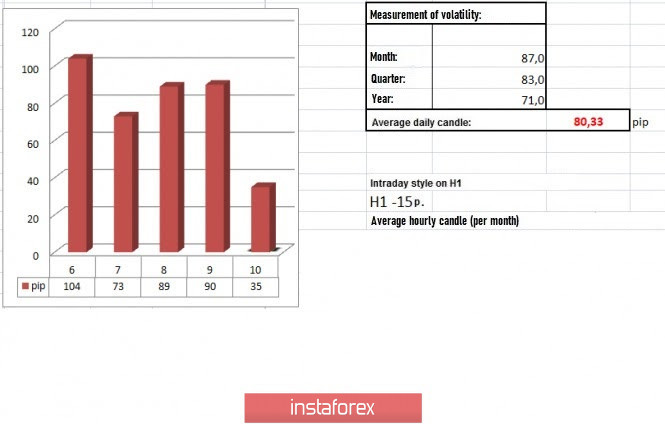
| Trading recommendations for the EUR/USD pair on July 10, 2020 Posted: 10 Jul 2020 03:15 AM PDT The current trading week is coming to an end. Looking back to the events that occurred, we can see that there were attempts to change the horizontal stroke of the market cycle, which ended in failure. Nevertheless, the quotes managed to consolidate above the level of 1.1350, but market participants failed to hold at this height, which resulted to a descent to the limits of the previous fluctuation. The main issue of traders is the possibility that the range 1.1180 // 1.1250 // 1.1350 will remain in the market. Such is due to the speculative mood of market participants, which enabled the quotes to consolidate above the level of 1.1350. But in order to pass the area of interaction of trade forces 1.1400 // 1.1440 // 1.1500, the quotes do not just need speculation, but also the support of news and technical factors, which are unfortunately not available at the moment. Thus, the resumption of fluctuations within the boundaries of 1.1180 // 1.1250 // 1.1350 has a high probability of occurring once again. Analyzing the past day in detail, we can see two turns of short positions, in which the first one appeared at the start of the European session, which led to a recovery. Meanwhile, the second round of short positions appeared at the start of the American trading session, which coincided with the flow of statistics. Hence, a volatility of 12% was recorded, which is relative to the average daily value of 80 -> 90 points. At the same time, if we analyze the average daily dynamics from the spring of the current year to the current month, we can see that the indicator has halved, which means that the market has practically taken control of the speculative mood, which benefits both technical analysis and fundamental analysis. Meanwhile, as discussed in the previous review, traders expected a similar development in the market, after the quotes consolidated below 1.1350. The trading idea last Thursday was followed, and the first goal of it was reached. Thus, analyzing the trading chart in general terms (the daily period), we will see a slight stagnation relative to the earlier movement. Major changes in the trend are still far away. As for news published yesterday, the indicators on the US labor market was published, in which according to reports, the number of initial applications for unemployment benefits were much better than all expectations, dropping to 1,314,000, lower than the forecast of 1,380,000. Previous indicators were also reviewed for the better, from 1,427,000 to 1,413,000. With regards to repeated applications, the figure decreased by 698,000 to 18,062,000, much lower than the forecast of 18.95 million. Its previous data was also revised for the better from 19.2 million to 18.76 million. Such figured indicate there recovery of the United States, despite the continued high rates of coronavirus infection in the country. It surprised investors so much that at the time of publication of the data, the quote hovered in consolidation, and then strengthened in an hour. In addition, the speech of US Treasury Secretary Steven Mnuchin also supported the US dollar, as he announced the possibility of another round of support for the US economy worth $ 660 billion. It will target businesses that really need help, as well as small businesses. Mnuchin said that the Ministry of Finance is working to ensure that the bill was approved by the Congress before the end of July. Meanwhile, in Europe, Governor Francois Villeroy de Galhau of the ECB said that the regulator is ready to use more innovative monetary policy instruments, if bank sees it necessary. "To fulfill its mandate of price stability over time, the Eurosystem will keep interest rates and liquidity at a very favorable level. The ECB is still ready to be as innovative as necessary with regard to its instruments, "Villeroy said. Today, data on producer prices in the United States will be published, which should slow down from -0.8% to -0.3%, and possibly to -0.2%. It will lead to the strengthening of the US dollar, if the real data coincides with the forecast. The upcoming trading week will be very busy, as during it, the final data on inflation in the EU and the US will be published. In addition, the ECB will conduct a meeting next week, after which is a press conference. Here are the most significant events for next week (UTC + 1): Tuesday, July 14 EU 10:00 - Industrial production index US 13:30 - Data on inflation Wednesday, July 15 US 14:15 - Industrial production index Thursday, July 16 EU - ECB meeting, followed by a press conference US 13:30 - Retail sales index US 13:30 - Applications for unemployment benefits Friday, July 17 EU 10:00 - Data on inflation US 13:30 - Number of building permits issued (June) US 13:30 - Volume of construction of new houses (June) Further development Analyzing the current trading chart, we can see that in the period earlier, the price reached the area 1.1260 / 1.1280, where a slowdown has occurred. In order to maintain the bearish mood, the quote has to consolidate lower than 1.1250, else, there will be a deviation to the level of 1.1300. As for market sentiment, speculative positions are visible, but they are playing to the advantage of consistently high volatility. Thus, it can be assumed that the area 1.1260 / 1.1280 will continue to put pressure on short positions, but if data on producer prices in the United States came out good, another round of sales may arise, on the basis of which a breakout from the level of 1.1250 will occur, moving in the direction of 1.1200-1.1190. So, based on the above information, here are our trading recommendations: - Sell positions lower than 1.1250, with the prospect of a move to 1.1200-1.1190. - Buy positions if there is a local rebound towards 1.1290-1.1300. Indicator analysis Analyzing the different sectors of time frames (TF), we can see that the indicators in the M15 chart signal buy due to the upcoming local rebound from the mirror level. The H1 chart, on the other hand, signal sell due to the upcoming recovery from the level of 1.1350. As for the D1 chart, the signal remains buy, but it will change if the price becomes lower than 1.1250. Volatility per week / Measurement of volatility: Month; Quarter Year The measurement of volatility reflects the average daily fluctuation calculated by Month / Quarter / Year. (July 10 was built, taking into account the time the article is published) The volatility in this current time is 35 points, which is 56% lower than the average daily value. Thus, it is assumed that when the quotes breakout of the mirror level, another acceleration will occur. Key levels Resistance Zones: 1.1350; 1.1440 / 1.1500; 1.1650 *; 1.1720 **; 1.1850 **; 1,2100 Support areas: 1.1250 *; 1.1180 **; 1.1080; 1,1000 ***; 1.0850 **; 1.0775 *; 1.0650 (1.0636); 1,0500 ***; 1.0350 **; 1,0000 ***. * Periodic level ** Range Level *** Psychological level The material has been provided by InstaForex Company - www.instaforex.com |
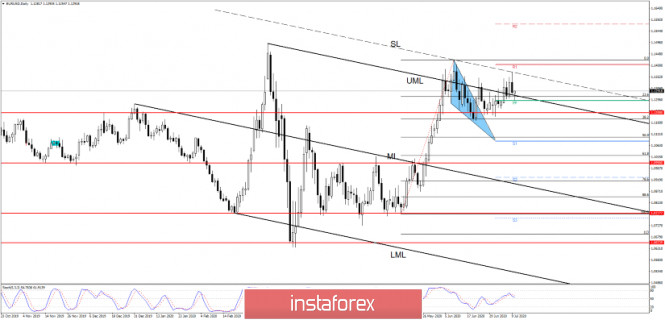
| Posted: 10 Jul 2020 03:00 AM PDT EUR/USD has dropped aggressively from 1.1370 yesterday's high and now is retesting potential dynamic support, resistance has turned into support. The pair is located in the buyer's territory, but the false breakout above the 1.1348 has signaled a bearish pressure again. The better than expected Unemployment Claims report has boosted the dollar in the short term, the indicator was reported at 1314K in the previous week, beating the 1375K estimates.
EUR/USD has plunged after it has reached the outside sliding line (SL) of the descending pitchfork and now has pressured the 23.6% level and the upper median line (UML), a false breakdown, rejection from these levels could send the rate higher again. The dollar has taken the lead again as the USDX has rebounded from 96.23 level, making only a false breakdown with huge separation below the 96.36 static support. The 96.36 - 96.00 area represents a critical support zone for the US dollar index, so another leg higher will force the EUR/USD to drop again. Unfortunately, yesterday's candle has endangered a further drop in the upcoming period, now, the outside sliding line (SL) represents a critical resistance, a valid breakout above this line will suggest buying again.
Buy - EUR/USD will resume its upwards movement if it will make a valid breakout above the sliding line (SL) and above the R1 (1.1403) level. Still, a consolidation above the UML, and above 23.6% (1.1268) level could bring a long opportunity sooner. The near term resistance is seen at the 1.1348 and at the sliding line (SL). Sell - I still believe that a selling signal will be validated by another lower low, buy a valid breakdown below the 1.1200 psychological level. The near-term support is represented by the upper median line (UML) and by the PP (1.1251) level. The material has been provided by InstaForex Company - www.instaforex.com |
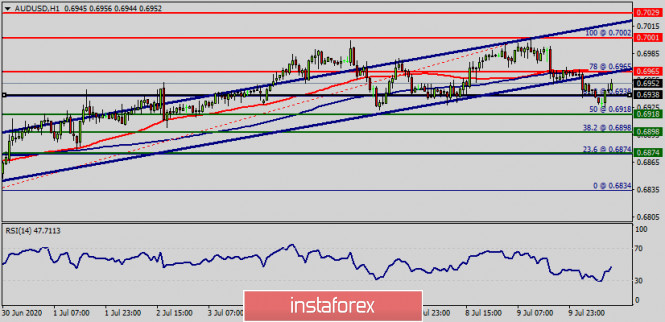
| Technical analysis of AUD/USD for July 10, 2020 Posted: 10 Jul 2020 02:57 AM PDT Overview: The AUD/USD pair reached a new maximum at the price of 0.6960. So, today the price may reach one more maximum around the spot of 0.6960 or 0.7001. Today, the AUD/USD pair is challenging the psychological support at 0.6938 which coincides with the ratio of 61.8% Fibonacci. So, the support is seen at the level of 0.6938 in the one-hour time frame. We expect the AUD/USD pair to continues moving in a uptrend above the level of 0.6938 towards the first target at 0.7001, while major resistance is found at 0.7029. On the downside, a clear break at the level of 0.6918 could trigger further bearish pressure testing 0.6874, which represents the major resistance today. Forecast: As a result, it is gainful to buy above this price of 0.6938 with targets at 0.7001 and 0.7029. However, the bullish trend is still expected for the upcoming days as long as the price is above 0.6918. Daily Technical level:
|
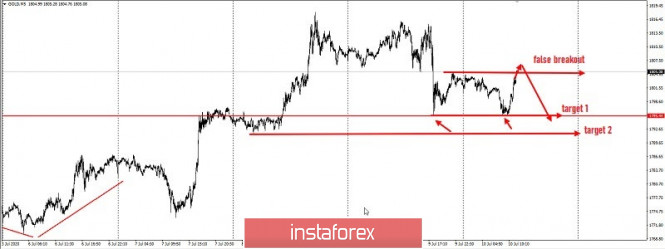
| Posted: 10 Jul 2020 02:34 AM PDT Good afternoon traders! An intraday trading idea for gold. If the short impulse yesterday can be considered as wave A of the classic ABC pattern, now, gold is trading in the area of 50% Fibonacci, which breaks the correction formed at the American session yesterday. Work for a false breakout in the level of 1805 to update the low reached yesterday and short the quotes in the trading chart. Movement may reach up to more than 1,000 pips, the profitability of which is 5/1. Good luck and make sure to control the risks! The material has been provided by InstaForex Company - www.instaforex.com |
| GBP/USD: between Sunak and Brexit Posted: 10 Jul 2020 02:34 AM PDT The British currency was optimistic this week. The weakness of the US currency, the ambitious plans of the Ministry of Finance of the UK, as well as the absence of bad news from the negotiation front allowed the pound to return to the framework of the 25th figure, and even test the 26th price level. However, buyers could not maintain their positions, especially against the backdrop of a general strengthening of the American currency at the end of the trading week. In my opinion, the growth of GBP/USD is initially doomed to failure - the only question is at what exact moment the price reversal will occur. The fact is that all the fundamental factors that served as the basis for the strengthening of the British currency are quite unreliable. For example, the pound received support from Brexit earlier this week. Information appeared on the market that Brussels was ready to yield to the most difficult issue of fish fishing. Let me remind you that the differences here are insurmountable. London considers the requirements of the European Union to provide access for European fishermen to British fishing areas unacceptable, calling it incompatible with the future status of Great Britain as an independent coastal state. Brussels insists on the contrary. As many analysts believe, negotiators will not be able to resolve these differences at their level, which means that the current negotiations are a priori doomed to failure. But, according to the British newspaper, The New European, the main EU negotiator Michel Barnier is supposedly ready to back down on this issue. He proposed a model based on the "zonal binding " – that is, the British quota shares will depend on the length of stay of fish populations in the waters of the Kingdom. According to Brussels, this is also the interest of London: with climate change, large volumes of fish will shift to the exclusive economic zone of Britain. In addition, according to journalists, Barnier retreated from the requirement to leave the current level of access to the UK's waters to EU vessels. According to him, this policy was initially unbalanced, so it is subject to revision. It is worth noting here that various rumors around the negotiation process arise regularly, but they are not always subsequently confirmed. Moreover, incomplete information could be in the hands of journalists: it is unlikely that Brussels decided to compromise without requiring mutual concessions. It is still an open question whether the British agreed to be mutually flexible. Therefore, in this case, the Brexit issue is not a "reliable ally" of the pound. This is not the case with the plans of the Ministry of Finance of Britain: Rishi Sunak has provided quite strong support for GBP/USD this week. The head of the department promised to allocate more than 30 billion pounds as additional assistance to the economy. First of all, assistance will be provided to the labor market (bonuses for the return of laid-off employees to work, reduction of value added tax, temporary cancellation of property tax when purchasing real estate, etc.). Of course, this factor is a serious driver for the growth of GBP/USD. However, the buyers of the pair risk falling into the trap, now opening long positions - the degree of uncertainty around Brexit is too high. On the daily chart, the pair tested the upper line of the Bollinger Bands indicator (that is, 1.2660) yesterday. However, the bulls could not break through this resistance level, after which the price receded and at the moment, it is quite trading weakly between the middle and upper lines of the Bollinger Bands indicator in anticipation of the next information signal. This signal will come from Brexit. This refers to the parties' comments on the results of the current round of negotiations on the prospects for the transition period. It is worth noting here that traders clearly have high expectations, given the previous newspaper rumors. Therefore, if the rhetoric of Barnier and his British counterpart is pessimistic, the pound will collapse to the first support level (1.2440 – the upper limit of the Kumo cloud on the daily chart) in just a few hours. If the negotiations end in a neutral manner, the market reaction may be restrained – the pound paired with the dollar may again test the resistance level of 1.2660, but it is unlikely to be fixed higher. All this suggests that the upper dynamics of the GBP/USD pair must be treated with extreme caution. The pound is rising amid positive messages from the UK Treasury Department, as well as thanks to encouraging rumors about the prospects for negotiations. However, if the current round, contrary to expectations, ends in failure again, then the pound will instantly be knocked down. The Brexit issue has an unconditional priority for the pound, while other fundamental factors (even as strong as the support of the Ministry of Finance) play a secondary role. Thus, trading decisions on the GBP/USD pair should only be made after the announcement of the interim results of negotiations between London and Brussels. The material has been provided by InstaForex Company - www.instaforex.com |
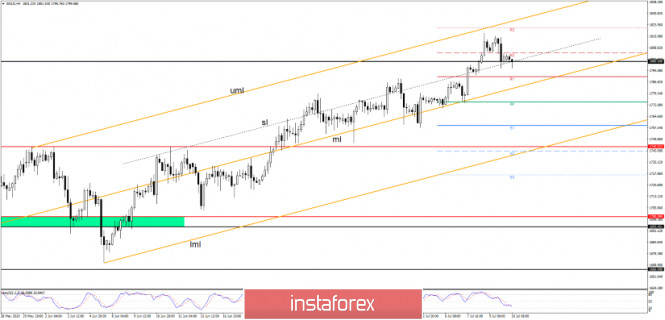
| Posted: 10 Jul 2020 02:03 AM PDT Gold has decreased a little after the recent amazing rally, but you should know that the uptrend is still intact, despite the minor drop. It is trading at $1,801 level, the retreat could represent only a $1,800 level retest before the price jumps higher. Another reason behind the gold price decrease is that USD managed to rebound in yesterday's session. I said in the last article that the outlook for the yellow metal is bullish, but it could drop a little to retest the broken $1,800 obstacle in the short term.
Gold has found resistance at $1,817 level and now has come back to test and retest the $1,800 level and the inside sliding line (sl) of the orange ascending pitchfork. As you already know from my previous analysis, the outlook remains bullish and the gold price is expected to climb higher as long as it is trading above the median line (ml) and above the sliding line (sl). A false breakdown with great separation below the $1,800 level will suggest buying again with a first potential target at the $1,817 high, the next major target is seen at the upper median line (uml).
The rejection from the $1,800 level could signal another bullish momentum, so a false breakdown with great separation followed by a strong bullish candle o the H4 could bring a buying opportunity. The $1,817 could be used as a first target, while the R3 ($1,821) and the upper median line (uml) could represent potential targets as well in the short term. Another higher high will really confirm that the gold price will resume the upside movement in the upcoming period. Only a major reversal pattern here around the $1,800 level could announce a potential correction. The material has been provided by InstaForex Company - www.instaforex.com |
| Posted: 10 Jul 2020 01:54 AM PDT
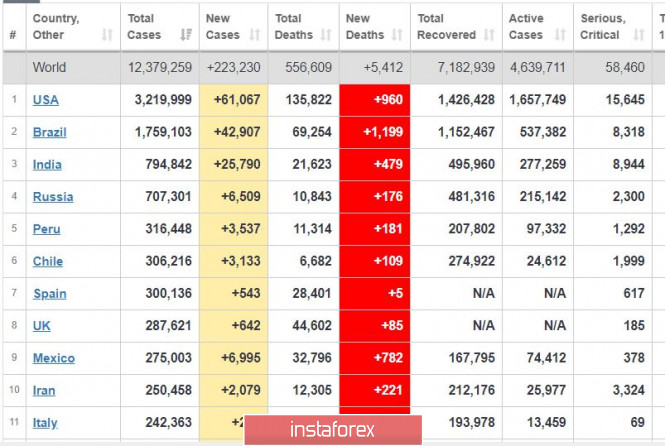
The latest data reveals that the United States has once again recorded a huge increase in the number of new infections, listing 61 thousand new cases as of the morning of July 10. Deaths, meanwhile, have been stabilized at 1,000 a day, which is quite good considering that the record last April, when the pandemic in the country was at its peak, was 2,500 a day. Nevertheless, this second wave puts restoration at serious risk, and its seems that the return of strict quarantine in the most troubled states is inevitable. In addition, Trump is losing his position with regards to the upcoming US presidential election, as he failed the fight against the coronavirus pandemic. The United States has remained the "leader" at this pandemic, so the situation in the country was at its worst. Other countries such as Brazil and India are also under terrible situations, having recorded sharp growths in the number of new infections as well.
EUR / USD: the deteriorating situation is lowering the demand for risky assets such as the euro. It went down from the highs and broke through the three-day lows, but perhaps this movement is just false. Nevertheless, be ready to sell euros from 1.1250, or buy from 1.1370. The latest news on the US labor market, which came out very strong on Thursday, also caused the strengthening of the US dollar. The material has been provided by InstaForex Company - www.instaforex.com |
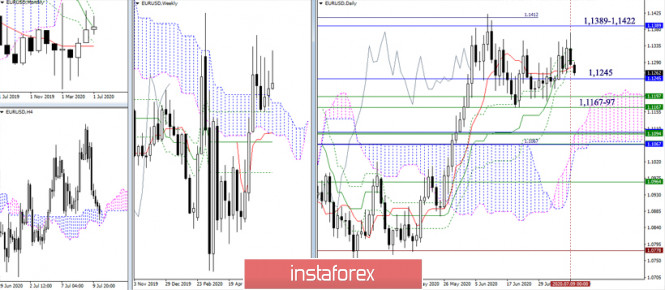
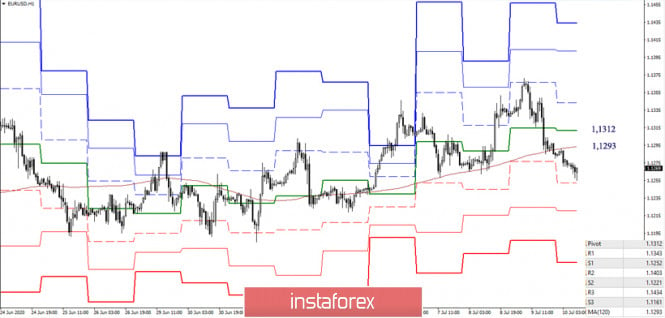
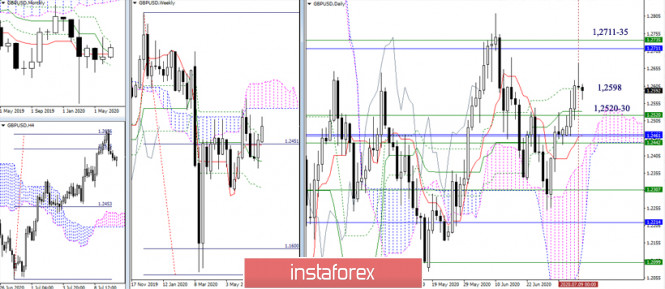
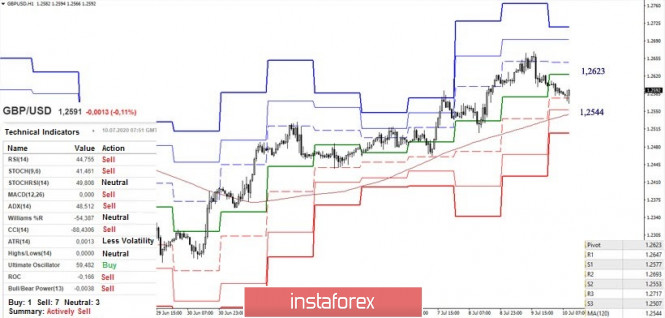
| Technical analysis recommendations for EUR/USD and GBP/USD on July 10 Posted: 10 Jul 2020 01:40 AM PDT Technical analysis recommendations for EUR/USD and GBP/USD on July 10 EUR / USD The next working week is about to close. At the same time, a long upper shadow appeared again on the weekly candle. If the players on the downside manage to fix the shadow in history, then there may come a moment when the quantity grows into quality in the near future. The reference points for bears are currently located at 1.1245 (monthly Kijun) - 1.1197 (upper border of the weekly cloud) - 1.1167 (weekly Fibo Kijun). After testing the first resistance of the classic Pivot levels yesterday, the players to decline began to decline. Today, the pair is already working below key levels of the lower halves. In this situation, retesting the passed levels is possible, which combines their efforts in the area of 1.1293 (weekly long-term trend) - 1.1312 (central Pivot level). A consolidation above can level the achievements of the bears and prevent them from closing the next week as optimistically as possible. The classic pivot levels 1.1252 - 1.1221 - 1.1161 are now the downward reference points within the day. GBP / USD The pair began to decline after fulfilling the target for the breakdown of the H4 cloud (1.2656). Today, we are closing the week. To form further prospects, it is now advisable for the players to decline to maintain their positions and, if possible, take possession of the nearest supports 1.2598 (daily Fibo Kijun) and 1.2520-30 (daily Kijun + weekly Fibo Kijun). There is another downward correction on the upward trend on H1. The players to decline managed to consolidate below the central Pivot level (1.2623), so support for the weekly long-term trend (1.2544) is of primary interest to them. A price consolidation below will affect the balance of power in the lower halves, but to achieve a longer and more reliable result, it is necessary to break through the support of the higher halves (1.2520-30). The return of the pair above the central Pivot level (1.2623) can return the players to increase the opportunities and prospects for the further rise. In this case, the closest reference point will be the maximum extremum (1.2669). Ichimoku Kinko Hyo (9.26.52), Pivot Points (classic), Moving Average (120) The material has been provided by InstaForex Company - www.instaforex.com |
| You are subscribed to email updates from Forex analysis review. To stop receiving these emails, you may unsubscribe now. | Email delivery powered by Google |
| Google, 1600 Amphitheatre Parkway, Mountain View, CA 94043, United States | |














No comments:
Post a Comment