
Forex analysis review |
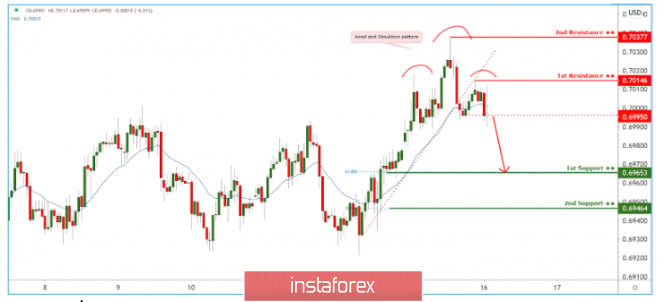
- AUDUSD Showing head and shoulders! Drop incoming!
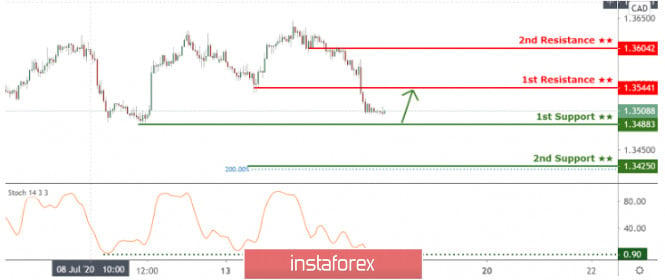
- USDCAD approaching 1st support, possible bounce!
- Hot forecast and trading signals for the GBP/USD pair for July 16. COT report. Macroeconomic data and 1.2668-1.2688 area
- Hot forecast and trading signals for the EUR/USD pair on July 16. COT report. US introduced new sanctions against China due
- Analytics and trading signals for beginners. How to trade GBP/USD on July 16? A plan to open and close deals on Thursday
- Analytics and trading signals for beginners. How to trade the EUR/USD currency pair on July 16? A plan to open and close
- July 15, 2020 : EUR/USD daily technical review and trade recommendations.
- Gold technical analysis
- Operational analysis of movement options for EUR/USD & GBP/USD (H1) on July 16-17, 2020
- Pound grows, but will soon face decline
- Asia, US, and EU stocks rise
- July 15, 2020 : EUR/USD Intraday technical analysis and trade recommendations.
- July 15, 2020 : GBP/USD Intraday technical analysis and trade recommendations.
- Short-term technical analysis of Gold for July 15, 2020.
- AUDUSD breaks the trading range
- US dollar losses ground
- Outlook for EUR/USD and GBP/USD on July 15. US economy may shrink due to second wave of coronavirus
- GBPUSD and USDJPY: Buyers of the pound do not lose optimism on the background of the UK inflation report. The yen will remain
- OPEC oil demand to exceed pre-crisis levels next year
- EUR/USD. 15th figure on the horizon: rumors around the ECB and the EU summit push the euro up
- Oil rises after series of decline
- GBP/USD: plan for the American session on July 15
- EUR/USD: plan for the American session on July 15
- BTC analysis for July 15,.2020 - Watch for potential downside break and drop towards $7.813
- EUR/USD analysis for July 15 2020 - Test of the maror resistance at the price of 1.1450, potential for the bigger drop towards
| AUDUSD Showing head and shoulders! Drop incoming! Posted: 15 Jul 2020 07:05 PM PDT
Trading Recommendation Entry: 0.69950 Reason for Entry: Head and shoulders neckline, Moving average resistance Take Profit: 0.69653 Reason for Take Profit: 61.8% Fibonacci retracement Stop Loss: 0.70146 Reason for Stop Loss: Ascending trendline resistance The material has been provided by InstaForex Company - www.instaforex.com |
| USDCAD approaching 1st support, possible bounce! Posted: 15 Jul 2020 07:03 PM PDT
Trading Recommendation Entry: 1.3488 Reason for Entry: Horizontal swing low support Take Profit :1.3544 Reason for Take Profit: Horizontal pullback resistance Stop Loss:1.3425 Reason for Stop loss: 200 fib retracement The material has been provided by InstaForex Company - www.instaforex.com |
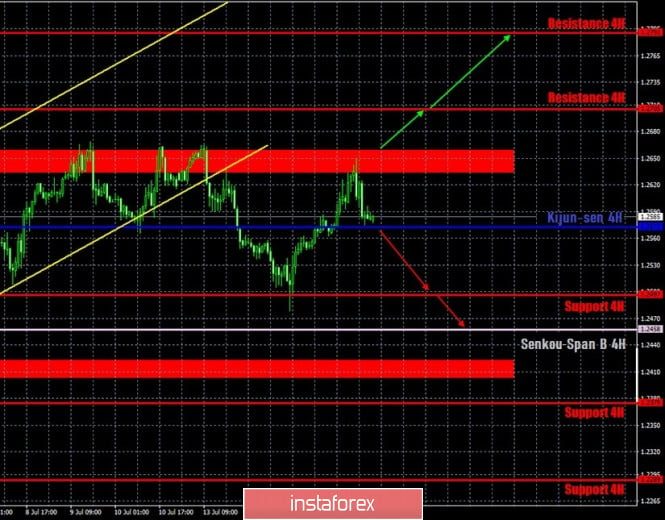
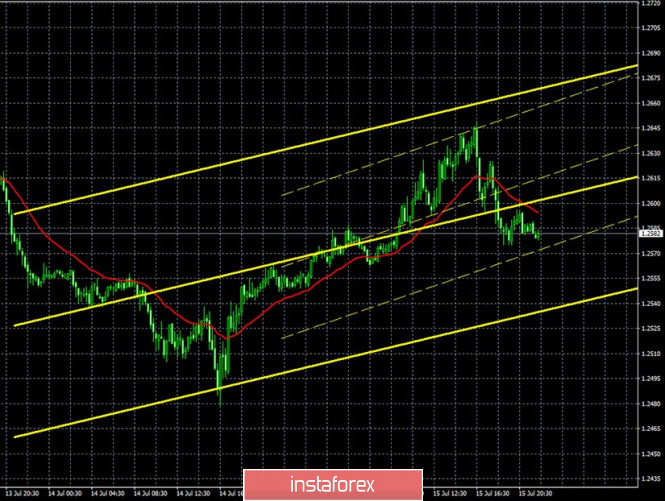
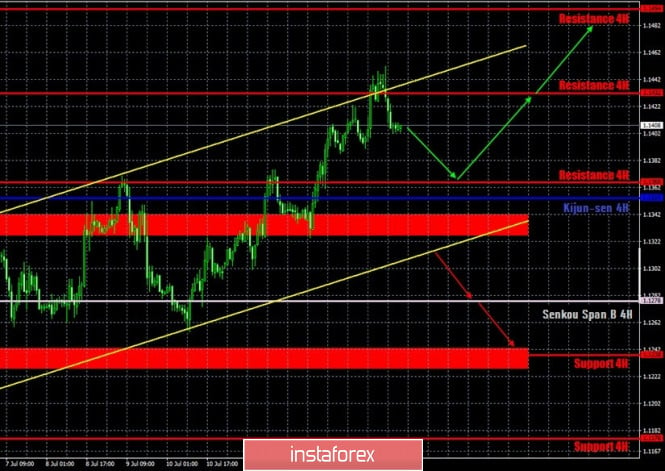
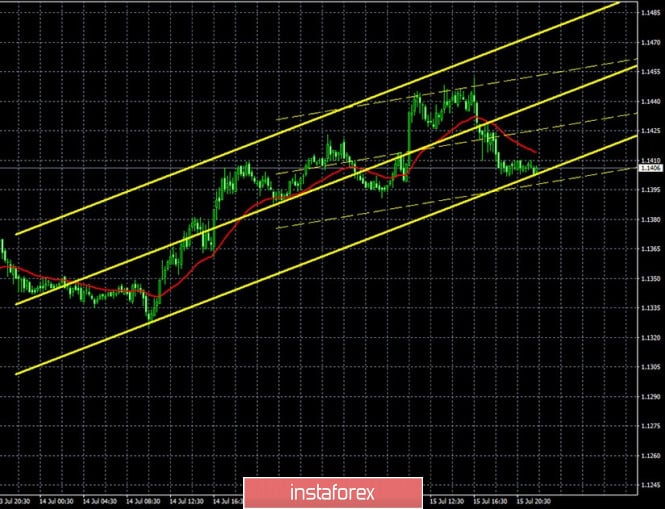
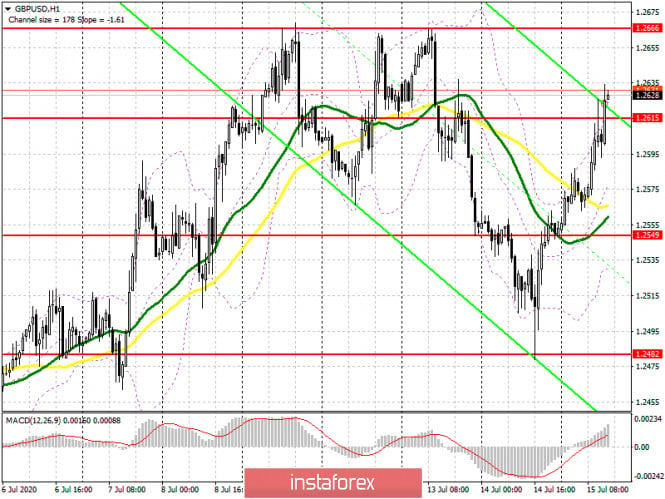
| Posted: 15 Jul 2020 05:31 PM PDT GBP/USD 1H The GBP/USD pair, unlike the EUR/USD pair, is just trying to continue the upward trend. Buyers reached the resistance area of 1.2634-1.2660 for the fourth time in the last few days and unsuccessfully tried to overcome it. Another rebound and correction to the critical Kijun-sen line. However, it was also not possible to gain a foothold below the Kijun-sen line, so at the moment everything looks as if the bulls will make a fifth attempt to go above the designated area today. Bears formally have a good chance of moving down, since the pair's quotes came out of the ascending channel. However, they will need a new fixation under the critical line to expect a fall to the Senkou Span B line. There is no question of a stronger growth of the US dollar now. GBP/USD 15M Both linear regression channels are directed upwards on the 15-minute timeframe, thus signaling that there is no correction. Thus, it is extremely important for buyers to stay above the Kijun-sen line in order for the upward movement to continue. The latest COT report fully reflects the essence of what is currently happening on the currency market for the pound/dollar pair. Professional traders opened 6,743 Buy-contracts and a total of 12 Sell-contracts during the reporting week. Obviously, they were interested in the pound. The total net position in the commercial category increased by 6,700. The total number of contracts in the category of commercial traders is approximately 115,000, and the preponderance of Buy over Sell was -21 thousand before the last report. Thus, +6,700 in the net position is a serious strengthening of the bullish mood. The British currency fell in price in the first two trading days of the week, but showed a strong growth on Wednesday, thus offsetting all fears about a change in the trend among professional traders, which drive the market. The fundamental background for the GBP/USD pair has not changed much in recent days. For the first time in a long time, several macroeconomic reports were published at once in the UK, which, I must say, disappointed traders. The biggest disappointment was GDP, which grew by only 1.8% in May. The remaining indicators were generally in line with the forecasts and expectations of traders. Today we are waiting for publications on changes in average wages, as well as on applications for unemployment benefits and the unemployment rate. All forecasts indicate a deterioration in the values of these indicators, which could potentially lower demand for the British pound on July 16. In conjunction with the fact that the pound/dollar pair failed to update the previous three local highs, we believe that the probability of a decline in the pound's quotes is quite high today. As for the prospects for the pound, they are about as vague as in the case of the US dollar. Therefore, we believe that it is more appropriate to trade the pair in the short term. The overall fundamental background is more important for traders now, but do not forget that it is equally bad in both the UK and the US. There is no news on the negotiations between London and Brussels at the moment. Boris Johnson has not yet visited Brussels, so there is no reason for optimism among buyers of the pound now either. There are two main scenarios as of July 16: 1) The bullish outlook worsened in the first half of the new trading week. At this time, the pair's purchases are temporarily not relevant, as quotes have gone below the rising channel. Thus, we recommend buying the British pound again, but not before overcoming the resistance area of 1.2634-1.2660. The targets in this case are resistance levels 1.2705 and 1.2791. Potential Take Profit in this case will be from 30 to 110 points. 2) Sellers are advised to resume trading on a lower level with targets at support level 1.2497, Senkou Span B line (1.2458) and support level 1.2375 if the pair overcomes the Kijun-sen line (1.2573). Today's reports from the UK can help the pair by pulling it down, as information is unlikely to turn out optimistic. Potential Take Profit range from 60 to 180 points. The material has been provided by InstaForex Company - www.instaforex.com |
| Posted: 15 Jul 2020 05:31 PM PDT EUR/USD 1H The euro/dollar pair reached the second resistance level of 1.1432 and rebounded from it on the hourly timeframe of July 15. We have already said that the pair is very often corrected within the current movement, so it is not surprising that a new round of corrective movement has begun. Buyers have significantly improved their positions over the past few days and are now trading near the upper line of the ascending channel. Overcoming the level of 1.1432 will most likely lead to continuing the upward movement. Sellers have nothing to oppose now. They are waiting for the bulls to retreat and the pair to consolidate below the ascending channel and the Kijun-sen line. EUR/USD 15M Both linear regression channels are still pointing up on the 15-minute timeframe, signaling an upward trend in the most short-term. There are no signs of the beginning of a new corrective movement at the moment. The latest COT report from July 7 was not informative, however, it provided answers to our questions. The most important category of large traders, commercial, which represents professionals who trade on the currency market for the purpose of commercial profit, opened almost 6,000 Buy-contracts and only 1,700 Sell-contracts. Thus, the net position in this category has increased by almost 4,000, which, simply put, means that the bullish mood of major players has increased. At the same time, the total number of Buy-contracts for professional traders is also much higher than the number of Sell-contracts – 186,000 against 80,000. The general conclusion is simple: professional traders are still focused on buying the European currency. This hypothesis is still fully confirmed in technical terms. The fundamental background for the EUR/USD pair remained unchanged on Wednesday. The only macroeconomic report on industrial production in the US caused the dollar to slightly strengthen, although, given the nature of the euro/dollar pair's movement in recent weeks, there is great doubt that the quotes fell because of this report. Traders still attach more importance to the overall fundamental background, which is still not in favor of the US dollar. One of the most important topics for the greenback was developed yesterday. US President Donald Trump signed two decrees at once, united in one law "on the autonomy of Hong Kong". The first decree concerned the removal of all trade preferences in Hong Kong, which now makes this district, in fact, just part of China, against which the general US sanctions and duty policy will apply. The second decree provides for the imposition of sanctions against officials and legal entities who are responsible for the loss of Hong Kong's autonomy status. Trump himself said: "Hong Kong, in my opinion, will no longer be able to compete with free markets. I suspect many people will leave the city." Beijing, of course, will not sit idly by and is already preparing retaliatory sanctions against Washington. "Hong Kong's affairs are exclusively China's internal affairs, and no foreign state has the right to interfere. Washington's plan to prevent the implementation of the national security law in Hong Kong will never be successful. To protect its legitimate interests, China will give the necessary response and impose sanctions on relevant individuals and organizations in the United States," the Chinese foreign ministry said in an official statement. Based on the foregoing, we have two trading ideas for July 16: 1) Buyers continue to dominate the market, so we just need to wait for a new buy signal. The trend remains unambiguously upward, but still do not forget about the frequent pullbacks and corrections, which are now inherent in the euro/dollar pair. You are advised to open new long positions with the target at the resistance level of 1.1494, if traders re-consolidate the pair above the level of 1.1432. Potential Take Profit in this case is about 55 points. 2) The bears have not been able to cross the Senkou Span B line, the Kijun-sen line, or leave the channel over the past few days. Sellers do not have enough power to form a new downward trend at this time, and reaching corrections is an unrewarded task. Thus, we recommend selling the euro, but not before overcoming the Kijun-sen line, and ideally after closing below the ascending channel, with the goal of Senkou Span B line (1.1278) and the support level of 1.1238. Potential Take Profit in this case is from 40 to 80 points. The material has been provided by InstaForex Company - www.instaforex.com |
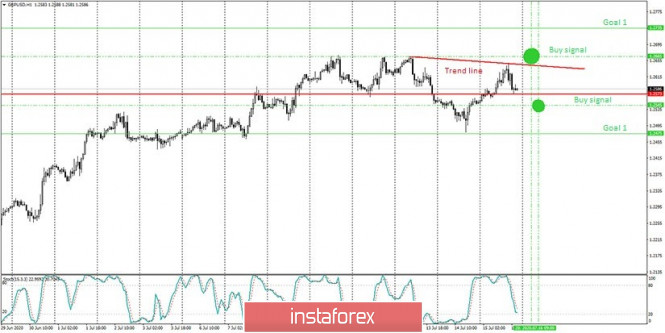
| Posted: 15 Jul 2020 05:31 PM PDT The hourly chart of the GBP/USD pair Everything is somewhat more complicated with the GBP/USD pair than it is with EUR/USD. News and reports, when viewed together, give different signals. The market does not take into account some reports and news at all, so they need to be filtered out. From the latest news, we note the weak UK GDP for the month of May, which grew by just 1.8% compared to April 2020. However, before that (in March and April) Britain's GDP was contracting by double digits, so after this fall, growth of 1.8% - this is nothing and can not be considered a strong value. Industrial production in Britain has fallen by 20.0% compared to May 2019 and this is a huge failure. Industrial production is an extremely important report for the economy of any country, since most of the GDP consists of production. The lower production and GDP, the worse the country's economy is. Accordingly, it is more difficult to expect the growth of the national currency. However, things are also so-so in America. The problems are the same – economic. However, in addition to them, there are also epidemiological problems with the coronavirus. Every day in the United States, 50-60 thousand people are reported to be infected, which can't help but affect the country's economy. Thus, the dollar can't be in high demand now either. However, the pound/dollar pair will still have to move in some direction. And technical analysis will help us figure out which one. Technical analysis tells us that the pair failed to continue its growth above the 1.2665 level. Three attempts to continue the upward movement were made on July 7, 9, and 13, but all were unsuccessful. Thus, we have built a downward trend line (one of the main tools for determining the trend), which just shows that in the near future we can expect quotes to fall. The important support level of 1.2573 (the level from which the price can most likely rebound, but if it consolidates below, it will be a signal to sell) does not allow the price to go below itself yet. Based on these technical constructions there are two possible scenarios: 1) If the pair is fixed below the level of 1.2573 (closing the bar below this level at the end of the hour), then sell with the goal of 70 points down. In other words, we place the Take Profit order near the 1.2475 level. 2) If the pair closes above the trend line at the end of the next hour (we assume that this may happen around the level of 1.2665), this will be a buy signal. In this case, we recommend buying the pair, and you can take the profit around the 1.2735 level manually, or by placing a Take Profit order (after reaching a certain price level, the transaction will close in profit itself). Each day, the pair usually travels the same distance (an indicator of the pair's volatility). At this time, from the lowest to the highest price of each day, the pair passes approximately 90-110 points (more volatile than the EUR/USD pair). Therefore, both targets are set at a safe distance from the intended entry points. Beginners that trade in the forex market should remember that each transaction cannot be profitable. The development of a clear strategy and money management are the key to success in trading for a long period of time. The material has been provided by InstaForex Company - www.instaforex.com |
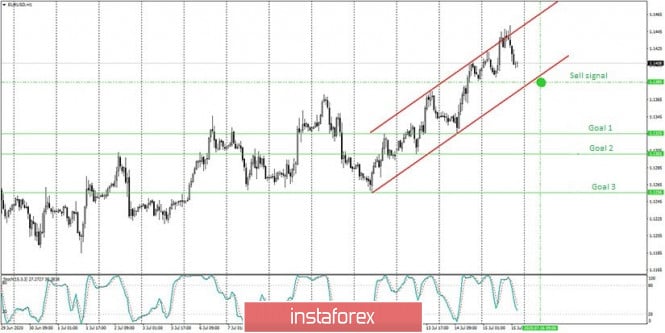
| Posted: 15 Jul 2020 05:31 PM PDT The hourly chart of the EUR/USD pair First of all, you need to understand the news and economic reports. This type of forex market analysis can affect the movement of a currency pair in the first place. At this time, the US dollar is not confident when the second wave of the coronavirus has swept America. There are very few buyers of the dollar right now. This is because traders are afraid of the negative impact of the coronavirus on the US economy. As you know, the economy and the exchange rate of the national currency are closely linked. The stronger the economy, the more money is invested in it, the stronger the demand for the national currency. And demand, as you know, has a positive effect on the value of the currency. Few people want to buy the dollar since the coronavirus pandemic can seriously weigh on the American economy. The US government is doing everything possible to mitigate the negative effect, but the epidemic, quarantine and crisis are things that "kill" jobs, the desire of the population to work, and not just to receive unemployment benefits. As a result, the more people who are sick and are just afraid of getting sick, the fewer people who work, lead active lives, and earn and spend money, respectively. And if money is not earned or spent, then the economy is worth it. The government has to pour huge amounts of money into supporting businesses and paying unemployment benefits. But money doesn't come out of nowhere. The US budget deficit is huge. Thus, we would say that the news factor speaks in favor of the euro's growth. Technical analysis also suggests that the euro currency will continue to increase in price (the upward movement on the chart is the euro's growth (appreciation), while the downward movement on the chart is the growth (appreciation) of the US dollar. This is evidenced by the ascending channel (red lines), within which the euro/dollar pair is traded. Thus, it is possible that today, on July 16, the pair's quotes will remain inside this channel and will not be able to exit it through its lower line. And if this does not happen, then further downward movement will be delayed for quite some time. Here are two possible versions of events: 1) If the pair touches the lower border of the channel, but cannot close lower (closing the bar below the channel line at the end of the hour), then buy with the goal of 50-60 points up. That is, after 50-60 points, we place a Take Profit order. 2) If the pair closes below the channel at the end of the next hour (we assume that this could happen near the level of 1.1385), this will be a sell signal. In this case, we recommend selling the pair, and placing Take Profit orders near the targets - the levels of 1.1325, 1.1301, 1.1256. The safest goal is the first one. During the same day, the pair usually goes the same distance (volatility). At this time, from the lowest to the highest price of each day, the pair passes approximately 75-80 points. The first goal is approximately 60 minutes away, so when it is reached, we advise you to take profit and exit the deal. Beginners that trade in the forex market should remember that each transaction cannot be profitable. The development of a clear strategy and money management are the key to success in trading for a long period of time. The material has been provided by InstaForex Company - www.instaforex.com |
| July 15, 2020 : EUR/USD daily technical review and trade recommendations. Posted: 15 Jul 2020 10:33 AM PDT
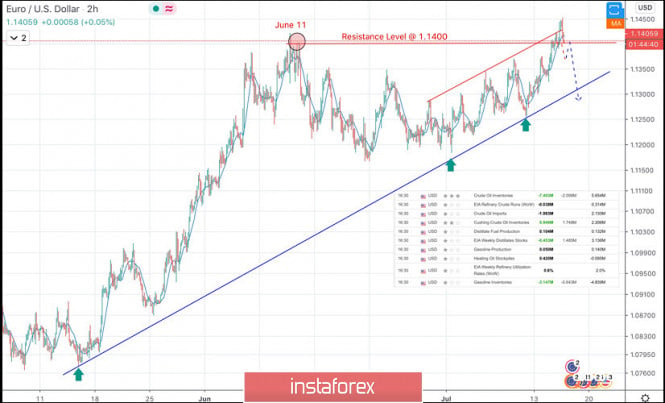
The EURUSD pair has been trending-up since the pair has initiated the depicted uptrend line on May 14. On June 11, a major resistance level was formed around 1.1400 which prevented further upside movement and forced the pair to have a downside pause towards the uptrend line. This week, the uptrend seems to show signs of weakness while approaching the mentioned resistance level (1.1400). A couple of positive Fundamental data from the U.S. are supporting the downside direction in the short-term. We should be expecting a probable breakdown for the depicted uptrend line to occur to the downside in the near future. Short-term traders can have a valid SELL order/position anywhere around the mentioned resistance level of 1.1400. Another SELL order can be placed after a breakdown below the uptrend line occurs. Estimated target levels are located around 1.1300, 1.1225 and 1.1170. The material has been provided by InstaForex Company - www.instaforex.com |
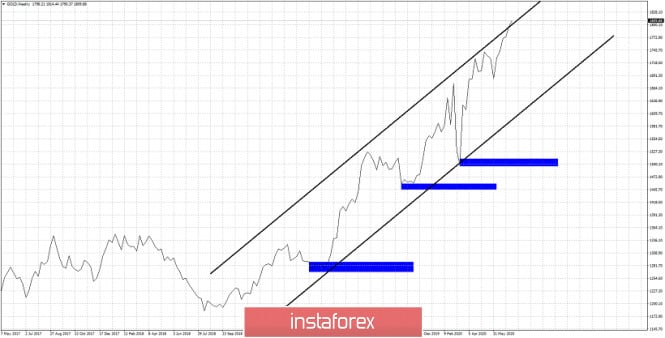
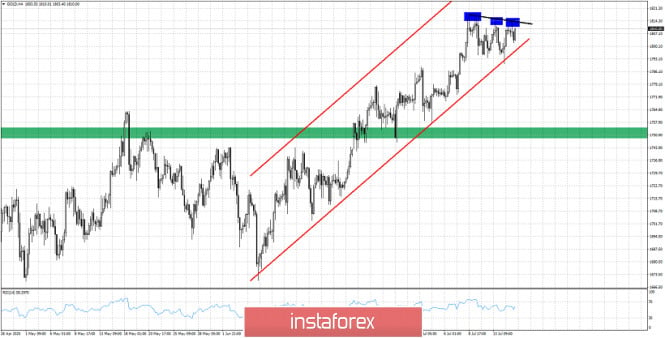
| Posted: 15 Jul 2020 10:12 AM PDT Gold price is in a bullish trend. This can be seen by the sequence of higher highs and higher lows price is making. As long as this sequence continues we remain optimistic for reaching $1,830.
Blue rectangles- higher lows Gold price as shown in the weekly chart above is inside rising parallel lines. The bullish channel. With blue rectangles are shown the higher lows that are important for the trend. Gold price now is near the upper channel boundary. Although trend is bullish, this is not the time to open new long positions as the risk of a pull back is high. The best strategy for longer-term traders is to raise their protective stops. In the short-term the strategy that can be followed is different.
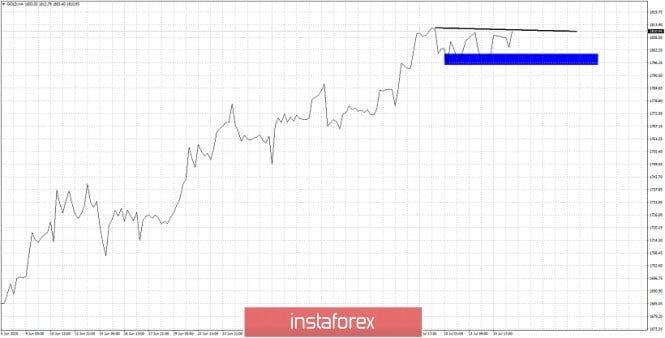
Black line -resistance Gold price is trying to break the resistance trend line as shown in the 4 hour chart above. As long as price is above the blue rectangle we expect a break to the upside. Breaking above the black trend line will confirm our bullish short-term view and price will be expected to move towards $1,830. Any move below the blue rectangle will make us neutral for the short-term. The material has been provided by InstaForex Company - www.instaforex.com |
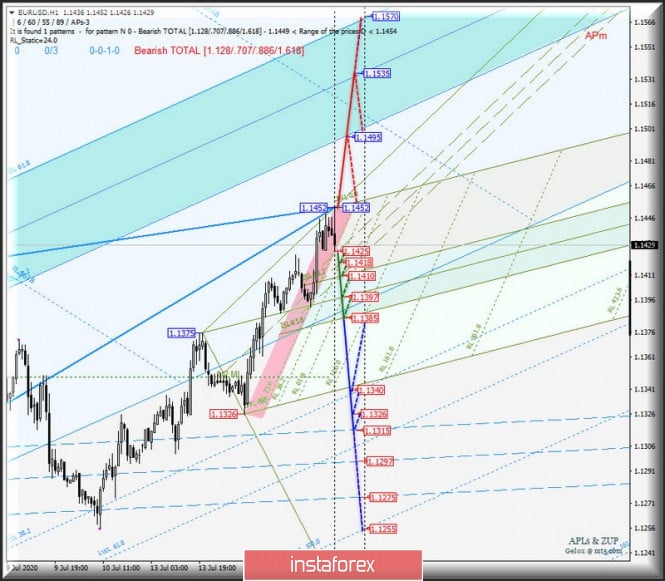
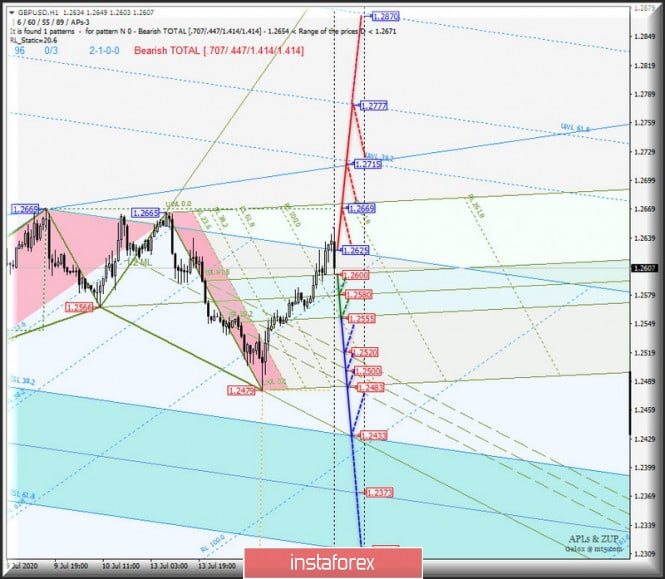
| Operational analysis of movement options for EUR/USD & GBP/USD (H1) on July 16-17, 2020 Posted: 15 Jul 2020 09:10 AM PDT Minuette operational scale (H1) Current development options for the movement of EUR/USD & GBP/USD (H4) on July 16-17, 2020. ____________________ Euro vs US dollar The development of the movement of the single European currency EUR/USD on July 16-17, 2020 will be determined by the development and direction of the breakdown of the range:
In case of breaking the support level of 1.1425, the development of the single European currency within the boundaries of the channel 1/2 Median Line (1.1425 - 1.1418 - 1.1410) and equilibrium zone (1.1410 - 1.1397 - 1.1385) of the Micro operational scale fork with the prospect of achieving the ultimate line FSL Micro (1.1340) and update local minimum 1.1326. . If the resistance level of 1.1452 breaks on the UTL control line, the Micro operational scale fork will confirm the possibility of continuing the upward movement of EUR/USD to the borders of the equilibrium zone (1.1495 - 1.1535 - 1.1570) of the Minuette operational scale fork. Options for EUR/USD movement on July 16-17, 2020 are shown on the animated chart.
____________________ Great Britain pound vs US dollar The movement of Her Majesty's currency GBP/USD on July 16-17, 2020 will continue depending on the development and direction of the breakdown of the range :
The breakdown ISL61.8 Micro - support level of 1.2600 will make the actual development of the movement in the zone of equilibrium (1.2600 - 1.2580 - 1.2555) of the Micro operational scale fork, and the breakdown ISL38.2 Micro (1.2555) the downward movement of the currency of Her Majesty may continue to the boundaries of the channel 1/2 Median Line Micro (1.2520 - 1.2500 - 1.2483) with the prospect of reaching the upper border ISL38.2 (1.2433) of the Minuette operational scale fork. If the resistance level of 1.2625 on the starting line SSL of the Minuette operational scale fork will make the actual continuation of the upward movement of GBP/USD to targets:
Options for the movement of GBP/USD on July 16-17, 2020, look at the animated chart.
____________________ The review is compiled without taking into account the news background, the opening of trading sessions of the main financial centers and is not a guide to action (placing "sell" or "buy" orders). Formula for calculating the dollar index: USDX = 50.14348112 * USDEUR0.576 * USDJPY0.136 * USDGBP0.119 * USDCAD0.091 * USDSEK0.042 * USDCHF 0. 036. Where the power coefficients correspond to the weights of currencies in the basket: Euro - 57.6 %; Yen - 13.6 %; Pound sterling - 11.9 %; Canadian dollar - 9.1 %; Swedish Krona - 4.2 %; Swiss franc - 3.6 %. The first coefficient in the formula brings the index value to 100 on the starting date - March 1973, when the main currencies began to be freely quoted relative to each other. The material has been provided by InstaForex Company - www.instaforex.com |
| Pound grows, but will soon face decline Posted: 15 Jul 2020 09:05 AM PDT
The pound sterling began to strengthen against the backdrop of a weakening US dollar. Today's rate has stopped at around 1.26 dollars per pound. Meanwhile, it remains stable in relation to the euro. The pound sterling is sensitive to all the changes that happen to the greenback, and it has recently been going through hard times. Risk appetite among investors is growing rapidly, which causes the dollar to sag, and the pound, in turn, to rise. However, in relation to the euro, the dynamics remain almost invisible. According to experts, sterling in the near future will nevertheless face a negative adjustment in its course, which will occur against the backdrop of a growing upheaval in the state's economy caused by the coronavirus pandemic. To date, the value of the pound sterling has become higher by 0.5% and reached $ 1.2610 per pound. In relation to the euro, it settled at 90.75 pence, which is practically no different from the previous rate. Nevertheless, the fact that the pound was able to cope with a serious fall against the euro, which happened two weeks ago, is already causing positive emotions. Earlier the euro fell sharply to a minimum of 91.12 euros per pound. Analysts continue to argue that UK macroeconomic indicators are among the worst in Europe. This will put serious pressure on the pound, which will inevitably backtrack. In the meantime, it has the opportunity to build up a greater advantage over the subsequent global decline. Britain's secession from the EU only exacerbates the current situation, being an additional source of pressure. The statistics on the country's GDP over the last month of spring were very unimpressive. The numbers were much lower than preliminary forecasts, which greatly upset investors. Now they are increasingly asking themselves the question: when will the government decide on a new portion of incentive measures that can support an economy that is rapidly falling into the abyss? The Central Bank of Great Britain is expected to expand the program of quantitative easing and lowering interest rates. The yields on government bonds with a maturity of five years decreased significantly last week, so much so that it went into the zone below zero. However, as some analysts note, this is not the limit of the fall, in the near future, it is likely to get an even larger portion of the negative. In the meantime, the pound's prospects are very vague, a trend for sale is forming in the foreign exchange market, which, most likely, cannot be avoided. The material has been provided by InstaForex Company - www.instaforex.com |
| Posted: 15 Jul 2020 08:31 AM PDT
The Asia-Pacific stock exchanges rose at the beginning of trading on Wednesday. This was, however, interrupted by some negativity with China's stock market which declined after market participants feared a further escalation of the conflict between the US and China. US President Donald Trump released a statement that he would not resume negotiations with Chinese colleagues on the next phase of the trade agreement. He added that at the moment he has no interest in these negotiations, and so far nothing is known about further plans. Moreover, Trump announced the release of the bill, which includes, inter alia, sanctions against certain Chinese officials who are involved in the ratification of the law restricting the freedom of Hong Kong. Trump believes that they should be punished for harassment that began in Hong Kong. In addition to the law, he also signed a decree terminating Hong Kong's special privilege position in relation to the USA. This means the end of simplified trading. The Chinese authorities did not take long to answer and said on Tuesday that American actions are contrary to international law and are a direct intervention in the country's domestic policy. The American government, trying to impose its own view on the Hong Kong problem, is crossing the legal frontiers. And the law issued, which relates to the autonomy of Hong Kong, is generally a direct intervention in domestic public affairs. The Ministry of Foreign Affairs of China has already protested against the actions of the United States. Against the background of these misunderstandings, the Shanghai Composite China Index began to move down and fell 0.4% so far. Hong Kong's Hang Seng Index remained virtually unchanged. Japan's Nikkei 225 Index, meanwhile, rose by 1.7%. It received a positive influence from the country's chief regulator, who decided not to adjust the basic interest rates in the near future and to continue the super-soft monetary policy in order to maintain the growth of the state economy. The Central Bank of the country said that there is no hope for a quick economic recovery and will not appear yet since the coronavirus infection pandemic had too serious an impact on economic growth. Of course, the situation will begin to improve very soon, but the pace of this recovery will not be too fast. The recovery will take place gradually, and its results are likely to appear in the second half of this year. Restrained growth is due to the fact that measures taken in coping with the COVID-19 pandemic has not yet succeeded, and the world is on the verge of a second wave of this pandemic. The South Korean Kospi Index rose 0.9%. Australia's S & P / ASX 200 Index went up by 1.7%. US stocks also went on a positive trend due to the satisfactory results of the released quarterly reports of the banks. This is amid the serious effect of the pandemic in the economy. Market participants are preparing themselves for a potential decline in the company profits which is reflected in the main stock indicators. Thus, companies in the S&P 500 index may lose up to 45% or more of profit per year. Nevertheless, while the American market looks quite confident, and negative forecasts have not begun to act on market participants who are in high spirits about the restoration of economic growth and the continuation of the soft stimulating monetary policy of the Federal Reserve of the United States of America. Experts point out that the recovery of the US economy will be rather difficult and will encounter many limiting factors that will make this path even more thorny. In order to support this process, the state should continue to purchase a significant amount of assets for a rather long time so that vague prospects take on at least some shape. In the meantime, economists are discussing plans for the future, coronavirus infection continues to hit America more severely across the entire territory. A record number of patients is recorded almost every day. New restrictive measures are already gradually being introduced in different states. All this, of course, does not contribute to the healthy development and growth of the economy and makes investors think about future prospects. The Dow Jones Industrial Average managed to grow by 2.13% or 556.79 points, which sent it to the level of 26,642.59 points. This one has been booming for the third consecutive trading session. The Standard & Poor's 500 Index gained 1.34% or 42.30 points. Its current level is located within 3 197.52 points. The Nasdaq Composite Index showed a more restrained growth of 0.94% or 97.73 points, which allowed it to move to the mark of 10,488.52 points. Europe stocks, on the other hand, began the trading session with a positive attitude, which led them to grow amid news of an upcoming vaccine against coronavirus infection. In addition, market participants are determined that during the next EU summit a decision will be made to continue and expand monetary stimulus in the territory of European states. The German DAX index rose to 0.7%. France's CAC 40 index is up by 0.9%. The UK FTSE index showed an increase of 0.9%. The most notable event during this day was brought by the news that the world could soon see an effective vaccine against COVID-19, which ultimately will play a decisive role in the fight against this disease. The material has been provided by InstaForex Company - www.instaforex.com |
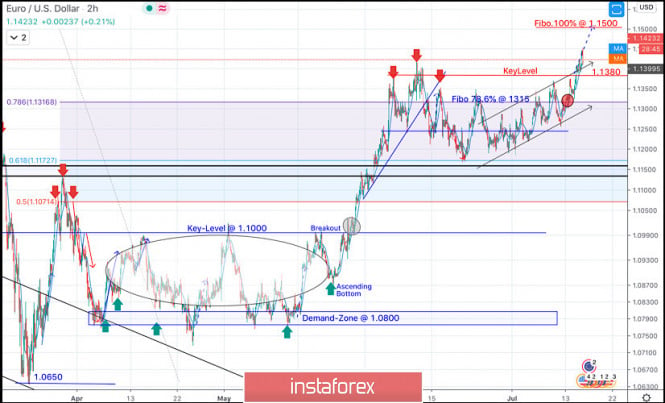
| July 15, 2020 : EUR/USD Intraday technical analysis and trade recommendations. Posted: 15 Jul 2020 07:59 AM PDT
Shortly after, a sideway consolidation range was established in the price range extending between 1.0770 - 1.1000. On May 14, evident signs of Bullish rejection as well as a recent ascending bottom have been manifested around the price zone of (1.0815 - 1.0775), which enhances the bullish side of the market in the short-term. Bullish breakout above 1.1000 has enhanced further bullish advancement towards 1.1175 (61.8% Fibonacci Level) then 1.1315 (78.6% Fibonacci Level) where bearish rejection was anticipated. Although the EUR/USD pair has temporarily expressed a bullish breakout above 1.1315 (78.6% Fibonacci Level), bearish rejection was being demonstrated in the period between June 10th- June 12th. This suggested a probable bearish reversal around the Recent Price Zone of (1.1270-1.1315) to be watched by Intraday traders. Hence, Bearish persistence below 1.1250-1.1240 (Head & Shoulders Pattern neckline) was needed to confirm the pattern & to enhance further bearish decline towards 1.1150. However, the EURUSD pair has failed to maintain enough bearish momentum to do so. Instead, a narrow-ranged bullish channel is being expressed while re-approaching the price levels of 1.1380-1.1400 where the upper limit of the channel is located. Please note that any bullish breakout above 1.1400 will probably lead to a quick bullish spike directly towards 1.1500. The material has been provided by InstaForex Company - www.instaforex.com |
| July 15, 2020 : GBP/USD Intraday technical analysis and trade recommendations. Posted: 15 Jul 2020 07:50 AM PDT
Since April, the GBPUSD pair has been moving sideways within the depicted consolidation range extending between the price levels of 1.2265 and 1.2600. On May 15, transient bearish breakout below 1.2265 (Consolidation Range Lower Limit) was demonstrated in the period between May 13 - May 26 denoting some sort of weakness from the current bullish trend. However, immediate bullish rebound has been expressed around the price level of 1.2080 bringing the GBPUSD back above the depicted price zone of 1.2520-1.2600 which failed to offer sufficient bearish rejection. Further bullish advancement was expressed towards 1.2780 (Previous Key-Level) where signs of bearish rejection were expressed. Short-term bearish pullback was expressed, initial bearish targets were located around 1.2600 and 1.2520. Moreover, another bearish Head & Shoulders pattern (with potential bearish target around 1.2265) was recently demonstrated around the same price the pair is approaching Today. Recent bearish persistence below 1.2500 ( neckline of the reversal pattern ) paused the bullish outlook for sometime & enabled further bearish decline towards 1.2265. However, last week, significant bullish rejection was originated around 1.2265 bringing the GBP/USD pair back towards 1.2600 - 1.2650 where a cluster of resistance levels are located. Earlier Yesterday, signs of bearish rejection were manifested around the price zone of 1.2620 - 1.2650 (Mid-channel zone). This indicates a high probability of bearish reversal provided that early bearish breakout is achieved below 1.2500. Trade recommendations : Intraday traders could consider Today's bullish pullback towards the depicted Supply Zone (1.2600-1.2650) for a valid SELL Entry. Stop Loss should be tight, it can be placed above 1.2700 while initial T/P level to be located around 1.2450 & 1.2265. The material has been provided by InstaForex Company - www.instaforex.com |
| Short-term technical analysis of Gold for July 15, 2020. Posted: 15 Jul 2020 07:36 AM PDT Gold price remains in a bullish trend. Gold is testing a triple top short-term formation while inside the bullish channel. The RSI is not in overbought conditions and as long as price holds above $1,790-85 we can expect Gold to continue to new higher highs.
Blue rectangles - triple top Black line - resistance trend line Green rectangle- support area Gold price continues to respect the bullish channel and the higher highs and higher lows sequence. Resistance at $1,814 is confirmed three times so far as shown by the blue rectangles in the chart above. Breaking above $1,814 will open the way for a move towards $1,830. Support is important at $1,800 and next at $1,790. The material has been provided by InstaForex Company - www.instaforex.com |
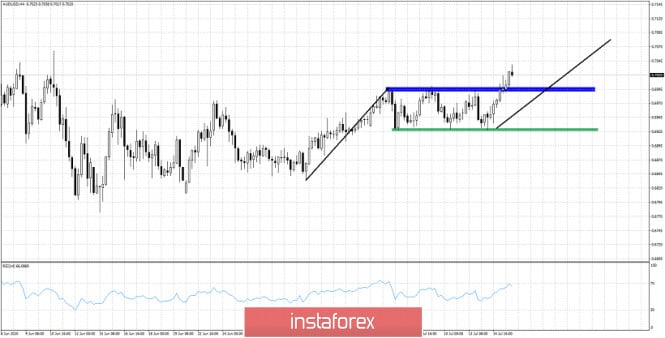
| AUDUSD breaks the trading range Posted: 15 Jul 2020 07:29 AM PDT In a previous analysis we noted the the trading range AUDUSD was in. In our last analysis we noted that we preferred to be bullish as the risk reward ratio for favorable towards bulls. The risk was smaller for bulls as the stop loss level was very close by.
Blue rectangle - resistance Green rectangle -support In our last analysis price was close to the green rectangle support area and lower trading range boundary. We were bullish then. Price was expected to move at least towards the blue resistance area. Price has broken above the resistance area. This is a bullish sign. Price could continue higher towards our target of 0.70. Support is now found in the blue rectangle. Previous resistance is now support. A back test pull back towards that level is justified but not necessary. The material has been provided by InstaForex Company - www.instaforex.com |
| Posted: 15 Jul 2020 06:07 AM PDT
The head of the Federal Reserve Bank of St. Louis, James Ballard, said that the situation will not change in the next six months as those who were temporarily laid off will return to work. He claims that the unemployment rate will fall to 4.5%. However, the economic recovery will take a lot of time and will face constraints, warned Lael Brainard, the governor of the Federal Reserve. Mrs. Brainard believes that it may be necessary to soften the monetary policy. Meanwhile, the president of the Federal Reserve Bank of Philadelphia, Patrick Harker, said that the whole world is in a grave crisis that will last for a long time. The Bank of Japan claims that the economy will begin to recover in the second half of 2020, but the pace of recovery will be slow due to the continued impact of the COVID-19 pandemic in the world. In the UK, inflation grew by 0.5%. EUR/USD rose by 0.11% to trade at $1.1412. The US dollar fell by 0.06% to 107.18 yen, while the euro rose by 0.05% to 122.31 against the yen. The pound sterling advanced by 0.33% to 1.2594 against the US dollar. Besides, the British pound grew by 0.25% to 1.1038 against the euro. The US dollar index that measure the value of the US dollar against a basket of six world currencies dropped by 0.07%. The material has been provided by InstaForex Company - www.instaforex.com |
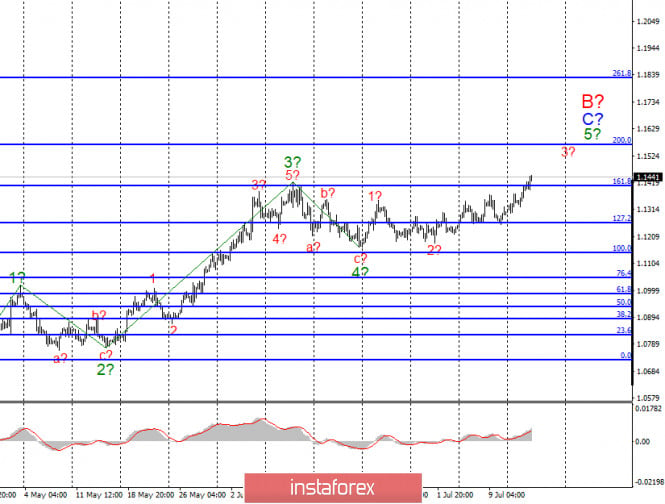
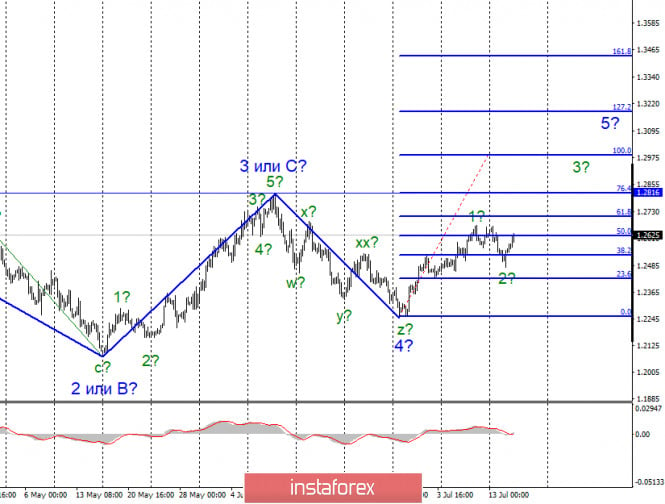
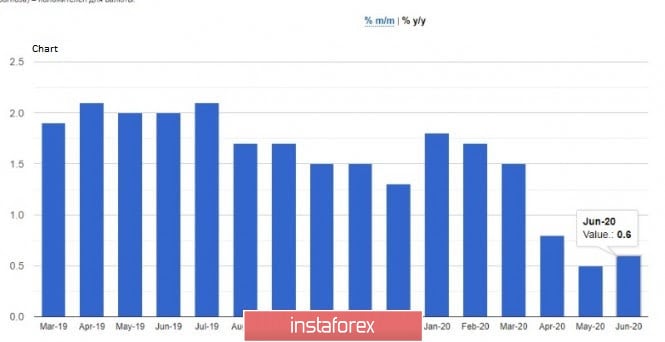
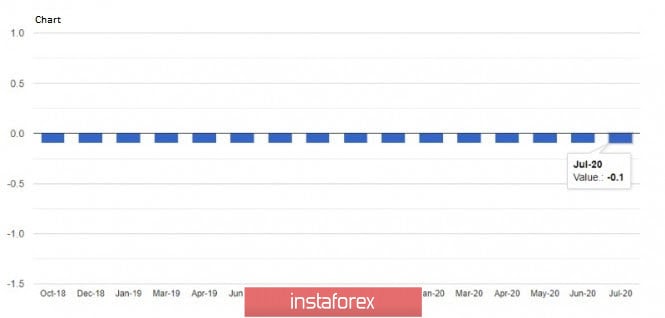
| Outlook for EUR/USD and GBP/USD on July 15. US economy may shrink due to second wave of coronavirus Posted: 15 Jul 2020 06:00 AM PDT EUR/USD On July 14, the euro/dollar pair gained about 55 basis points. It continues to build the expected wave 5 in C and B. A successful attempt to break the 161.8% Fibonacci level indicates that the markets are ready for new purchases of the single currency. Thus, the pair may continue advancing to the targets located near the 200.0% Fibonacci level. The entire wave 5 in C and B could be very extended. Fundamental data: On Tuesday, there was a lot of news from the US and the European Union. However, the markets' reaction was not very strong. Thus, the single currency just continued to rise, according to the current wave pattern. In other words, all the news of the day is informative. For example, the Germany's consumer price index in June, came in at 0.9% on a yearly basis, while industrial production in the European Union in May, declined by 20.9% on a yearly basis. The US consumer price index in June, was at the level of 0.6% on a yearly basis. The inflation data almost met market expectations. Thus, markets showed a slight reaction as the final data almost met the preliminary estimates. How can we explain an increase of 55 pips in the euro? I believe that the markets continue to attach great importance to the coronavirus outbreak in the US, and there is really something to worry about. The US economy may start to slow down again if the coronavirus continues to spread throughout the country. Congress, the White House, and the US Fed will have to adopt new and additional programs to help the economy. Each program enlarges the budget deficit. It is impossible to print a few trillions of dollars and hand them out to everyone in need. Thus, the coronavirus for the United States is not just a threat to the health and life of the nation, it is, first of all, the strongest threat to the economy. Moreover, the US presidential election will be held on November 3. At the moment, the election campaigns are in full swing. Donald Trump is traveling around the country; Biden is sitting at home. However, the US people believe that in times of pandemic, it is Biden who behaves more reasonable. General conclusions and recommendations: The euro/dollar pair continues to build upward waves C and B. Thus, I recommend buying the instrument with targets located near the level of 1.1570, which acts as the 200.0% Fibonacci retracement level. GBP/USD The pound/dollar pair did not gain a single pip on July 14, but today, it climbed by 80 pips. Thus, the assumed waves 2 and 5 are completed. If this assumption is correct, an increase in quotes will continue with the target near the 76.4% and 100.0% Fibonacci levels. The entire wave 5 may take a fairly extended form and a complex internal wave structure. Fundamental data: In the UK, several important economic reports were released on Tuesday. Thus, in May, the UK's GDP showed an increase of 1.8% on a monthly basis. Economists had expected an advance of 5%. At the same time, in May, the UK industrial production figures were in line with the forecast. Today, the inflation report was released in the UK. The indicator inched up in June from 0.5% to 0.6% on a yearly basis. General conclusions and recommendations: The pound/dollar pair has greatly complicated the current wave structure. Now, a building of a new upward wave should begin. Therefore, I recommend to buy an instrument with targets around 1.2816 and 1.2990, which act as a peak of wave 3 or C and the 100.0% Fibonacci retracement level respectively. The material has been provided by InstaForex Company - www.instaforex.com |
| Posted: 15 Jul 2020 05:45 AM PDT The British pound rose in spirit after yesterday's data on the pace of economic recovery after the coronavirus pandemic, which was far from predicted. Today, a report on the UK consumer price index was released, which increased in June this year compared to May, although many feared that this will not be without surprises. Given the fact that most stores and restaurants in the UK were opened in mid-June, the inflationary jump is delayed, however, it is unlikely to remain stable for a longer time, since there are no significant changes in the growth of fuel and food prices. On the contrary, some categories have even declined. So, consumer prices in June rose by 0.1% compared to May and by 0.6% compared to the same period in 2019 after rising by 0.5% in May. Economists had expected the index to grow by 0.4% in June. As for the basic indicator, which does not take into account volatile prices for food and energy, as well as tobacco products, it rose by 1.4% in June after rising by 1.2% in May. However, despite the growth, inflation is still far from the Bank of England's 2% target. As for the reaction of the British pound to the news, the bulls managed to get close to the resistance of 1.2615, from which a day earlier there was a larger sell-off. Now it is very important how the trading instrument will manifest itself around this range. On the one hand, the UK government's new bailout plan and expectations of an expansion of the bond purchase program by the Bank of England, as well as lower interest rates. On the other hand, Brexit and the lack of any consensus on negotiations, which can significantly complicate the life of business and the economy in 2021. If an agreement is not reached by the end of the year, the EU will easily introduce full customs control from the beginning of 2021, and this will mean the implementation of a hard Brexit scenario, which will be another blow to the UK economy, which is now struggling to cope with the consequences of the coronavirus. The Japanese yen managed to strengthen its position after today's speech by the head of the Bank of Japan, who said that if necessary, it will ease monetary policy more, but this is not currently required. Let me remind you that today the Central Bank's leaders left the key rate unchanged at -0.1%, and the target yield on 10-year government bonds is about zero. During the speech, Kuroda noted that there are some signs of economic recovery, but much will depend on the further situation with the coronavirus. At present, the pace of recovery of the Japanese economy, although not strong, is steady. If necessary, Kuroda once again noted that rates can be lowered if the economic situation worsens. According to the bank's forecast, in the current financial year, core inflation will range from -0.5% to -0.7%. In the long term, the Central Bank's target inflation rate remained unchanged at 2%. However, achieving this level is unlikely to be possible in the next couple of years. The bank emphasized that core inflation should reach 0.7% by March 2023, when the financial year ends in Japan. As for the technical picture of the USDJPY pair, trading continues in the narrow range of 106.00-108.00 after the unsuccessful attempt of the bulls to get above the level of 108 by the end of May this year. The optimal scenario for trading this instrument will be the opposite trades from the support levels of 106.00 and resistance levels of 108.00 with an intermediate goal in the middle of the channel around 107.50. The material has been provided by InstaForex Company - www.instaforex.com |
| OPEC oil demand to exceed pre-crisis levels next year Posted: 15 Jul 2020 05:44 AM PDT
According to the OPEC monthly report, in 2021 oil demand will rise by 25%. Oil production will hit 29.8 million barrels per day. This is a result of the global economic recovery after the coronavirus pandemic. It will highly affect a rise in demand. However, the US oil production in 2021 will be negligible. Moreover, it will drop by 7.4% this year. As it is already known, OPEC + countries concluded a deal to cut oil production. This, in turn, made it possible to reduce global stocks and boost prices. The cartel noted that they managed to fulfill the deal obligations in June by more than 100%. It is estimated that oil demand in 2021 will advance by 7.7% to 97.72 million barrels per day. However, a jump in demand directly depends on the revival of the tourism industry. Even if the predictions come true, the level of demand will still be lower than in 2018 and 2019. At the same time, oil production outside OPEC may decrease by 3.26 million bpd this year, and next year it may grow by only 0.92 million bpd. A week earlier, the International Energy Agency published a forecast for oil production, which was not as optimistic as the OPEC predictions. Today, an online meeting of OPEC + was held. The countries discussed a decision to soften oil production from 9.6 million barrels per day to 7.7 million barrels per day starting from August. The material has been provided by InstaForex Company - www.instaforex.com |
| EUR/USD. 15th figure on the horizon: rumors around the ECB and the EU summit push the euro up Posted: 15 Jul 2020 05:08 AM PDT Coincidentally, the July meeting of the European Central Bank will be held on the eve of the most important event for Europe – the summit of EU leaders. For the first time since the beginning of the pandemic, representatives of the bloc will meet offline to discuss the European Commission's 750-billion anti-crisis plan. Given the significance of Friday's meeting, many market participants doubt that the ECB will surprise investors tomorrow. It is almost 100 percent likely that the ECB will leave the monetary policy parameters unchanged and at the same time refrain from any specifics about the future prospects. After all, if the EU leaders do not agree on an anti-crisis plan on Friday, they will postpone the discussion of this issue to the end of August, while the next meeting of the ECB will be held on September 10. In other words, the fate of the EU recovery fund will be clear by the next ECB meeting, while there is still intrigue in this issue at the moment. All this suggests that the July meeting will most likely be of passing. However, not everyone agrees with this assumption. According to a number of currency strategists, the ECB could outline further steps that will be taken in any case by tomorrow – whether the EC anti-crisis plan will be implemented (in its current form) or not. This is a question of expanding the Pandemic Emergency Purchase program (PEPP). Let me remind you that the main intrigue was around this program on the eve of the June meeting. At that time, the European regulator spent about 210 billion euros out of 750 (that is, less than a third), so it could well afford not to rush to further decisions. According to experts, at an "even" rate of spending, the amount of the program would have been spent in mid-October, especially amid the weakening of quarantine measures in key European countries. By and large, there was no extraordinary need to expand PEPP at the June meeting. But at the same time, the market expressed general confidence that the ECB will allocate an additional 500 billion euros, as if in advance to repay the worries on this account. The solution would be to expand the program by 250 billion, while extending its term for the next year. But the ECB surprised: not only did it expand the PEPP, but it also exceeded even the most optimistic expectations, increasing the volume of the program by 600 billion euros at once. In addition, the ECB extended the program "until at least June 2021". In other words, the most optimistic scenario for the euro was realized in June, and this fact made it possible for buyers of EUR/USD to update three-month price highs. Experts are also discussing the prospects for PEPP on the eve of the July meeting. This time the ECB does not expect concrete actions, but they anticipate certain hints. The fact is that, according to a recent survey by Bloomberg, most economists are confident that the ECB will expand its bond purchase program in the coming months. In their opinion, the PEPP anti-crisis program will be increased by another 500 billion euros by December. The euro will receive additional support if the regulator admits the likelihood of this scenario tomorrow. Also, according to some analysts, the ECB may also increase the multipliers in the differentiation of rates to reduce the negative effect of negative rates. Thus, the ECB can strengthen the upward momentum of EUR/USD tomorrow, which is currently due to general optimism about the euro. The market is confident that the leaders of EU countries will agree on an anti-crisis plan of the European Commission on Friday. The other day the European Council President Charles Michel voiced new proposals that could lead to a compromise solution. In particular, he proposed to determine the EU budget at 1.074 trillion euros, and leave the volume of the economic recovery fund and the ratio of grants and loans in it unchanged. But at the same time, those countries that pay more to the EU general budget than receive from it will acquire a part of their contributions. We are talking about Austria, Sweden, Denmark, the Netherlands, as well as Germany. Michel also proposed covering losses by increasing the EU's own resources through future taxes on plastic waste, importing industrial products from countries that apply less stringent standards to reduce greenhouse gas emissions, and also through a digital tax that will affect companies such as Google, Facebook and Amazon. At the moment, the so-called separate negotiations (which precede the general meeting) are still ongoing, which means that the intrigue remains. In my opinion, the euro is ahead of events - but rumors of a positive nature help the euro grow throughout the market, also against the dollar. From a technical point of view, priority is also given to the growth of EUR/USD, and on all the higher timeframes - H4, D1, W1 and MN. So, on the daily chart, the price exceeded the upper line of the Bollinger Bands indicator, and the Ichimoku indicator formed a bullish Parade of Lines signal. The weekly chart also shows the priority of the upward scenario: the pair is between the middle and upper lines of the Bollinger Bands indicator, and the price is above the Kumo cloud. The monthly chart suggests that the price is between the middle and upper lines of the Bollinger Bands indicator - that is, subsequent growth can be of a larger scale - up to the level of 1.1510 (the upper BB line on MN). If the pair, according to today's results, remains within the 14th figure, one can consider long positions to this level of resistance. The material has been provided by InstaForex Company - www.instaforex.com |
| Oil rises after series of decline Posted: 15 Jul 2020 05:03 AM PDT
The price of oil soared on Wednesday after a series of declines for the past few days. Investors are still tense in anticipation of the next meeting of OPEC ministers, on July 15, Wednesday. In addition to this, the next batch of statistics on stocks of raw materials, gasoline, and distillates in the United States of America will be released. All of this will determine the further dynamics of prices in the oil market. The OPEC administration issued a preliminary forecast for oil demand on Tuesday which was adjusted for the better. This year, according to the organization, demand will grow by about 100 thousand barrels per day, which will allow it to reach 90.7 million barrels per day. However, this figure will still be lower than that recorded for the same period of the previous year. In light of the situation with the pandemic, there was a decrease of 8.9 million barrels per day. Estimates for next year also indicate growth to 97.7 million barrels per day, but this will be a very limited increase. The OPEC ministerial meeting is expected to discuss the systematic removal of restrictions on the extraction of crude oil, which should occur according to the agreement signed in April this year. The second phase of the contract involves a partial recovery of production. Thus, the total decline will now be at around 7.7 million barrels per day. There is no good reason for a deal to be reconsidered. Most likely, the second part will remain unchanged and will enter into force in August of this year. At the same time, the price of crude oil continues to be kept at a stable level, ignoring news of future mitigation of production. Nor does the fact that OPEC plans to introduce additional penalties for lagging members who have not fully fulfilled their obligations in the form of limiting production to 842 thousand barrels per day during August and September. These said states include Kazakhstan, Iraq, and Nigeria. Meanwhile, oil reserves in the United States decreased by 8.3 million barrels over the previous week. Gasoline stocks also adjusted downward by 3.6 million barrels, while distillates, on the contrary, showed growth by 3 million barrels. At the same time, reserves at the strategically important storage in Cushing rose by 548 thousand barrels. The price of futures contracts for delivery in September for Brent crude oil on the trading floor in London rose by 0.33% or $0.14. Now its value is within $43.04 per barrel. On Tuesday, the trading session also ended positively with an increase of 0.4% or $0.18, which was $42.9 per barrel. This growth, of course, has not yet compensated for the losses that have occurred over the previous days but have become clear evidence of a change in trend. The price of futures contracts for delivery in August for WTI light crude oil at an electronic trading platform in New York also rushed up by 0.35% or $0.14, which reflected the level of $40.43 per barrel. Tuesday's trading ended with an increase of 0.5% or $0.19, showing the dynamics of up to $40.29 per barrel. Oil was able to again step over its psychologically important mark of $ 40 per barrel, which most likely indicates that it has again found solid ground under its feet and is ready for further growth. Several factors provided support for black gold and among these is the weakening of the greenback which has a favorable effect on oil prices. The improved forecast from OPEC also cheered up market participants. Now the main attention is directed towards the OPEC decision, which will be known tonight. However, there is already information that countries such as Saudi Arabia and Russia plan to make their oil production higher next month. It is likely that this step will contribute to a negative rollback in the oil market, and in the long term, a drastic change in the trend to "bearish" may occur. While there is no official data, investors continue to be positive. The material has been provided by InstaForex Company - www.instaforex.com |
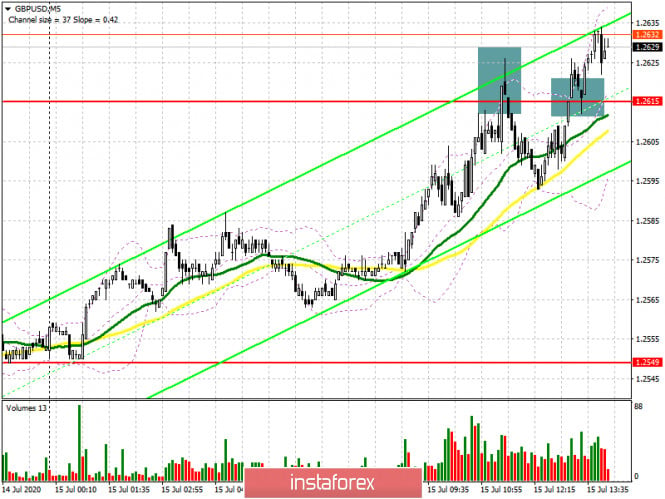
| GBP/USD: plan for the American session on July 15 Posted: 15 Jul 2020 04:38 AM PDT To open long positions on GBPUSD, you need: The hope of buyers of the pound was on the data on inflation in the UK, which was slightly better than the forecasts of economists, which allowed to maintain the bullish momentum today in the morning. If you look at the 5-minute chart, you will see how the bears managed to achieve the formation of a false breakout from the level of 1.2615, which led to the formation of a good point for entering short positions. However, it was not possible to achieve a larger movement than 30 points. As a result of a repeated test of the resistance of 1.2615, this level was broken. Now buyers are trying to gain a foothold on it, which forms a signal to open long positions in the hope of continuing the growth of GBP/USD to the maximum area of 1.2666, where I recommend fixing the profits. The longer-term goal is 1.2742 and 1.2809. If the pressure on the pound returns, and the bears achieve a return of the pound to the level of 1.2615, then in this scenario, it is best to exit from long positions and do not rush to buy. The best option is to wait for the update of the minimum of 1.2549, where the moving averages are held, and buy GBP/USD from there immediately for a rebound in the expectation of a correction of 30-40 points within the day.
To open short positions on GBPUSD, you need: Sellers continue to experience problems, as a sluggish attempt to protect the level of 1.2615 only fueled interest from buyers of the pound, who took this range for themselves the second time. The bears' task for the second half of the day will be to regain this area, which will definitely increase the pressure on the pair and quickly push it to the minimum of the day in the area of 1.2549, where I recommend fixing the profits. The sellers' longer-term goal will be a minimum of 1.2482. If the bulls continue to push the market up, this will lead to a reversal of the downward trend, which will be only a small correction of the bull market from June 30. Short positions on growth are best viewed after the formation of a false breakout near the weekly maximum of 1.2666 or sell GBP/USD immediately on the rebound from the resistance of 1.2742.
Signals of indicators: Moving averages Trading is conducted above the 30 and 50 daily averages, which indicates a serious attempt by buyers of the pound to return to the market. Note: The period and prices of moving averages are considered by the author on the hourly chart H1 and differ from the general definition of the classic daily moving averages on the daily chart D1. Bollinger Bands If the pair declines, the lower border of the indicator at 1.2540 will provide support. Description of indicators
|
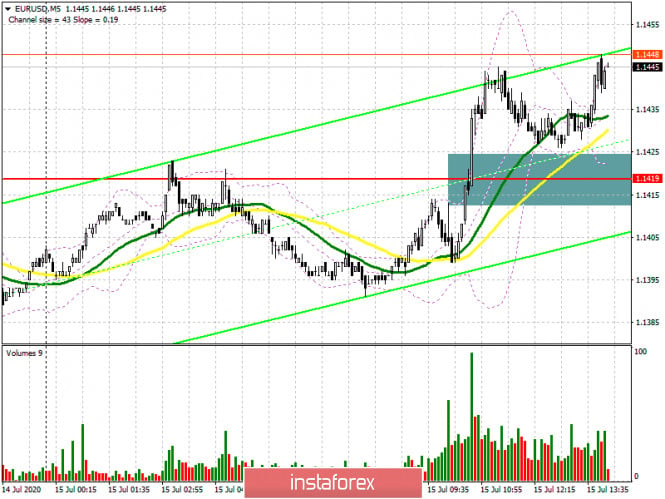
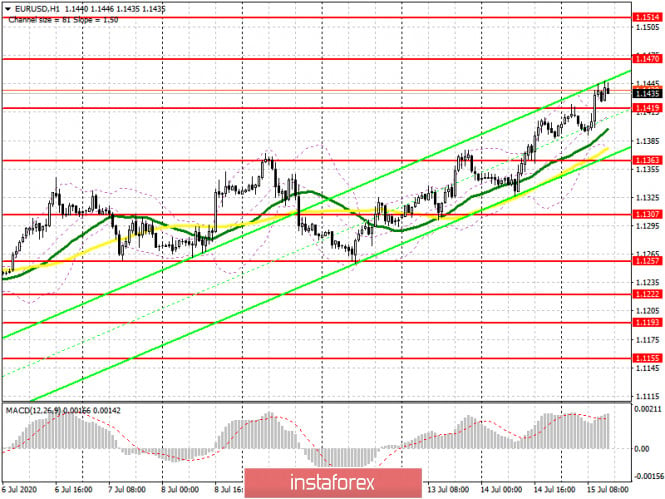
| EUR/USD: plan for the American session on July 15 Posted: 15 Jul 2020 04:33 AM PDT To open long positions on EURUSD, you need: In the first half of the day, there was a breakdown and consolidation above the resistance of 1.1419, which served as a signal to enter the market for the continuation of the upward trend formed at the end of last week. If you look at the 5-minute chart, you will see how the bulls are breaking above the area of 1.1419, which forms a good point to enter the market. The next target for euro buyers is the resistance of 1.1462, a break above which will provide EUR/USD with a direct path to the maximum of 1.1514, where I recommend fixing the profits. The growth of the euro can be provided by good data on industrial production in the United States, however, they should be better than the forecasts of economists. If the bullish momentum begins to fade in the second half of the day, and the bears return the pair to the support of 1.1419, it is best to postpone long positions to rebound from the low of 1.1363 in the expectation of a correction of 25-30 points within the day. Larger support is seen around 1.1307.
To open short positions on EURUSD, you need: Sellers did not even try to keep the pair below the level of 1.1419 in the first half of the day and retreated from the market at the first test. This once again confirms the absence of those willing to sell the euro even at current highs. The task for the North American session will be to return EUR/USD to the level of 1.1419, which may lead to profit taking on long positions and increase pressure on the euro. In this scenario, we can expect the pair to return to the area of major support of 1.1363, where I recommend fixing the profits, since the lower border of the current ascending channel passes in this range, and there are also moving averages. The bears' longer-term goal remains at least 1.1307, however, it is still very early to talk about it. When you save a bull market, it is better not to hurry with the sales against the trend and wait for the formation of a false breakout near the resistance of 1.1470 or open a short position once the rebound from the high of 1.1514 based on the correction of 25-30 points intraday.
Signals of indicators: Moving averages Trading is conducted above the 30 and 50 daily moving averages, which indicates the bullish nature of the market. Note: The period and prices of moving averages are considered by the author on the hourly chart H1 and differ from the general definition of the classic daily moving averages on the daily chart D1. Bollinger Bands If the euro falls in the second half of the day, the lower border of the indicator in the area of 1.1370 will provide support. Description of indicators
|
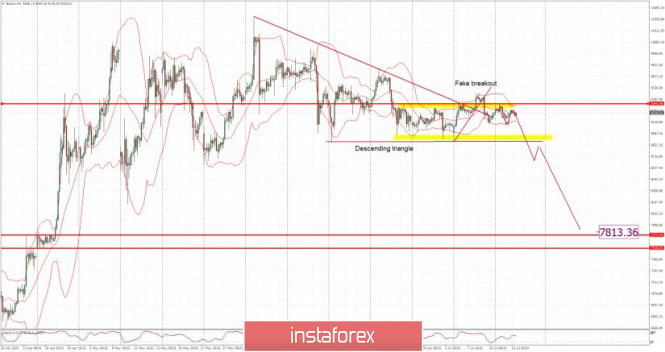
| BTC analysis for July 15,.2020 - Watch for potential downside break and drop towards $7.813 Posted: 15 Jul 2020 04:28 AM PDT Technical analysis:
BTC has been trading sideways at the price of $9,300. There is potential for the bigger drop but the price would need to breakout the key support at $8,900 to confirm downside direction. Trading recommendation: Watch for potential selling opporutnities in case of the downside breakout of support at $8,900. Stochastic is showing fresh bear cross, which is another sign and confirmation for the downside rotation. The material has been provided by InstaForex Company - www.instaforex.com |
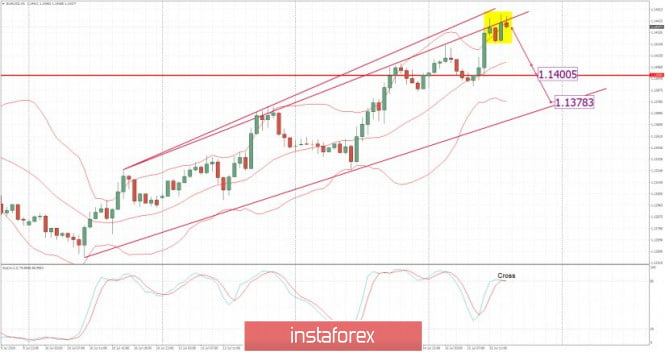
| Posted: 15 Jul 2020 04:17 AM PDT Technical analysis:
EUR/USD has been trading upwards. Anyway, I found that there is the potential for the downside rotation towards the 1,1400 and 1,1380 due to the resistance on the test. Trading recommendation: Watch for potential selling opporutnities due to rejection of the major resistance and potential for downside movement towards the 1,1400 and 1,1380. Stochastic is showing fresh bear cross, which is another sign and confirmation for the downside rotation. Downward targets are set at the price of 1,400 and 1,1380. Major resistance is set at 1,1450 The material has been provided by InstaForex Company - www.instaforex.com |

 On March 20, the EURUSD pair has expressed remarkable bullish recovery around the newly-established bottom around 1.0650.
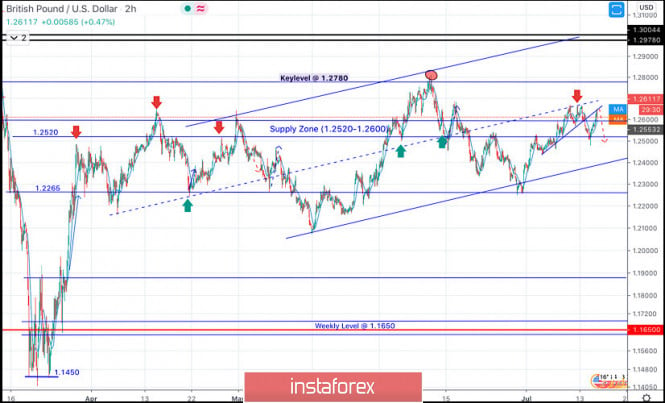


| You are subscribed to email updates from Forex analysis review. To stop receiving these emails, you may unsubscribe now. | Email delivery powered by Google |
| Google, 1600 Amphitheatre Parkway, Mountain View, CA 94043, United States | |
No comments:
Post a Comment