Forex analysis review |
- Presidential election factor in action: Trump postpones date
- Irresolute responses in US, EU, and Asian Stock markets
- July 30, 2020 : GBP/USD Intraday technical analysis and trade recommendations.
- Ichimoku cloud indicator analysis of Gold
- Short-term technical analysis of EURUSD for July 30, 2020
- July 30, 2020 : EUR/USD Intraday technical analysis and trade recommendations.
- EURUSD is at major Fibonacci resistance
- Gold begins to decline after series of growth
- July 30, 2020 : EUR/USD daily technical review and trade recommendations.
- Pound rises against all odds
- Platinum: prospects, trends, and trading ideas
- GBP/USD: plan for the American session on July 30
- EUR/USD: plan for the American session on July 30
- Evening review on July 30, 2020
- Absence of good support: oil prices continue to decline
- EUR / USD: Fed's rhetoric turns out more hawkish than expected.
- BTC analysis for July 30,.2020 - ABC downside correction in creation, potential for downside first towards the $10.475
- Main US problems that may push USD to bottom
- Analysis of Gold for July 30,.2020 - Intraday exhastion from sellers at $1.945 and potential for the upside swing
- GBP/USD analysis for July 30, 2020 - GBP on the extended run to the upside with potential for test of 1.3150
- Analysis of EUR/USD and GBP/USD for July 30. Markets ignored the speech of Jerome Powell and are waiting for the report on
- USD/CAD Temporary Growth?
- Trading plan for USDJPY for July 30, 2020
- Trading plan for GBPUSD for July 30, 2020
- Trading plan for EURUSD for July 30, 2020
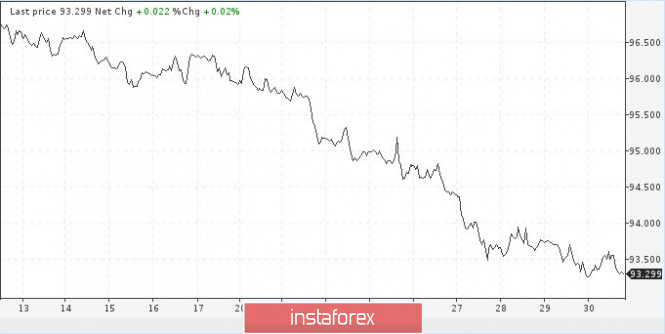
| Presidential election factor in action: Trump postpones date Posted: 30 Jul 2020 02:05 PM PDT The US dollar fell to a new 25-month low and hit 93.30 against a basket of competitors. Despite today's rebound, market experts believe that the dollar still has room to decline. This is due to the actions of the Federal Reserve and its willingness to further ease monetary policy. Nevertheless, the dollar index recovered by 30 points on Thursday afternoon. The evening session was confusing, but it did not lose the upward trend. USDX In principle, the greenback had something to flinch from. US GDP in the second quarter contracted by 32.9% in annual terms. This is the worst drop in history, but the forecast was even worse. The dollar was able to hold out, as the figure turned out to be no worse than market expectations and is to some extent meaningless. The fact is that the quarantine restrictions that caused the recession have since been largely lifted. However, this does not mean that there are no problems in the economy now. The Labor Department said the number of Americans who filed initial applications for unemployment benefits increased again in the week. The indicator grew by only 12,000, but the fact that it is an increase for the second straight week is important here. This number has been gradually decreasing in the previous 15 weeks, which gave hope to the markets for the recovery of the US economy. Uncertainty over the November presidential election is weighing on the dollar. It is difficult to say what this is connected with, but immediately after the release of a portion of important macroeconomic statistics on the United States, President Donald Trump went online with a statement. The current head of the White House considers it necessary to postpone the date of the presidential elections to a later date. According to him, American citizens cannot "properly and safely vote." Thus, he questioned the legality of the ballots that were used in much greater numbers in the primary in the pandemic. Trump also said without any reason that the vote would be rigged, and chose not to comment on whether he would accept the situation if he lost the election. Trump made it clear that the upcoming elections will not be easy. Democrats reacted. Together with Joe Biden began preparations for voter and election protection. It seems that the factor of the presidential election entered the scene ahead of time and will begin to put pressure on the markets and the position of the US dollar, which briefly slumped after Trump's statements. The material has been provided by InstaForex Company - www.instaforex.com |
| Irresolute responses in US, EU, and Asian Stock markets Posted: 30 Jul 2020 10:08 AM PDT
Asia-Pacific stock markets barely moved on Thursday. The main indicators showed almost no dynamics. Market participants continue to focus on the results of the meeting of the Federal Reserve System of the United States of America. Japan's Nikkei 225 Index slowed down and sank 0.22%. Even the good statistics on the level of retail sales in the country could not provide support. Thus, for the first month of summer, the indicator decreased by 1.2% per year, although the previous drop was much more significant which was around 12.5%. Experts' preliminary forecasts expect a more serious reduction at around 6.5%. However, there are still concerns: they are based on the fact that the decline in the level of retail sales has been taking place for the fourth month in a row, which indicates that the crisis in the Japanese economy continues, the consequences of which will have to be fought for a long time. The monthly indicator of the level of retail sales, on the contrary, became much higher in the first month of summer by 13.1%. China's Shanghai Composite Index rose 0.15%. The Hong Kong Hang Seng Index supported the positive sentiment of its colleague and increased even more by 0.75%. South Korea's Kospi index climbed 0.25%. The S & P / ASX 200 in Australia rose 0.65%. Analysts' forecasts turned out to be correct: during a meeting this week, the Fed decided to leave the base interest rate unchanged at an extremely low level ranging from 0% to 0.25% per annum. At the same time, it is noted that this decision was practically not criticized and was immediately approved by all committee members, a total of ten people. The preservation of the interest rate is dictated by the ongoing coronavirus pandemic, which the country still cannot cope with. The difficult epidemiological situation is putting very serious pressure on the American economy particularly in indicators such as business activity, employment, and inflation. These indicators continue to show negative and poor statistics which might get even worse if people and the government will not take decisive steps. This means that a more global decline awaits the US economy in the medium and long term. In this regard, the country's authorities, including Fed Chairman Jerome Powell, hastened to reassure stock market participants by announcing the continuation of a soft stimulating policy for at least the end of this year. At the same time, it is specified that the Central Bank will use the entire arsenal of funds available to it in order to change the negative dynamics and finally move on to recovery. Investors did not deny that this news inspired them, which immediately affected the main indicators. The Federal Reserve did one very important thing: by its decision to keep interest rates, it prepared the market participants for the next meeting, which should take place in September this year. Thus, investors will have no reason to believe that the regulator's policy will sharply tighten, and work on the stock exchanges will become less intense. The US stock exchange, on the other hand, reigned with enthusiasm on Wednesday as all the main indicators showed growth. The positive dynamics was provided by the rise in the value of shares in the technology sector, which happened immediately after the announcement of the results of the Fed meeting. The attention of market participants here, among other things, is occupied by the ongoing seasonal corporate reporting, as well as the possible introduction of a new portion of financial stimuli for the economy with a total volume of $ 1 trillion. Some statistics cause a small share of positive among investors. Thus, the deficit of foreign trade in goods in the country in the first month of this summer decreased by 6.1% and reached $ 70.64 billion in comparison with the previous period. As a reminder, in May 2020, the deficit stopped at $ 75.26 billion. Moreover, analysts were less encouraged: they talked about a possible reduction in the figure to $ 74.9 billion. The Dow Jones Industrial Average index at the closing of trading on Wednesday rose 0.61% or 160.29 points. Its current level is located at around 26,539.57 points. The Standard & Poor's 500 index gained 1.24% or 40 points, which allowed it to move to the level of 3,258.44 points. The growth leader was the Nasdaq Composite indicator, which jumped immediately by 1.35% or 140.85 points. Its position moved to the level of 10,542.94 points. European stock markets did not find any supporting factors on Thursday and moved to a negative correction, the main reason for which lies in the growing fears about the too slow and uncertain recovery of the economies of the region. In addition, the possibility of a repeat of the coronavirus pandemic continues to haunt market participants. The Stoxx Europe 600 fell 1.3% and reached 362.69 points. The UK's FTSE 100 also fell by 1.65%. France's CAC 40 Index lost 1.16%. Spain's IBEX 35 Index fell 2.06%. Italy's FTSE MIB Index dropped 2.21%. The leader of the fall was the German DAX index, which immediately sank 2.43%. The region's economic statistics did not impress the markets. Thus, it became known yesterday that the German economy became significantly smaller in the second quarter of this year by 10.1% compared to the three previous periods. On an annualized basis, the country's GDP fell by 11.7%. By contrast, the unemployment rate in Germany is declining. As it became known, unemployment decreased by 18 thousand and reached 2.923 million. This is a good sign, as this figure is declining for the first time in five months. The unemployment rate remains at its maximum level of around 6.4%. The composite index of consumer confidence in the EU economy for the second month of summer has strengthened significantly up to 82.3 points compared to the previous indicator of 75.8 points. However, even this could not overcome the negativity that arose in the stock markets. The material has been provided by InstaForex Company - www.instaforex.com |
| July 30, 2020 : GBP/USD Intraday technical analysis and trade recommendations. Posted: 30 Jul 2020 09:29 AM PDT
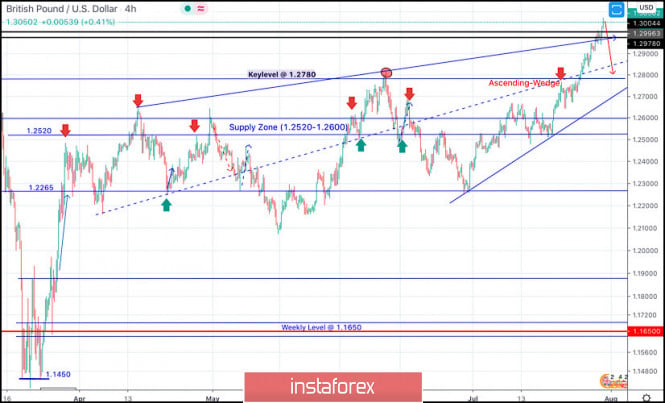
Intermediate-term Technical outlook for the GBP/USD pair remains bullish as long as bullish persistence is maintained above 1.2265 (Previous Consolidation range Lower Limit) on the H4 Charts. On May 15, transient bearish breakout below 1.2265 (the depicted demand-level) was demonstrated in the period between May 13 - May 26, denoting some sort of weakness from the current bullish trend. However, immediate bullish rebound has been expressed around the price level of 1.2080 bringing the GBPUSD back above the depicted price zone of 1.2520-1.2600 which failed to offer sufficient bearish rejection. Further bullish advancement was expressed towards 1.2780 (Previous Key-Level) where another episode of bearish pullback was initiated. Short-term bearish movement was expressed, initial bearish targets were located around 1.2600 and 1.2520 which paused the bullish outlook for sometime & enabled further bearish decline towards 1.2265. Significant bullish rejection was originated around 1.2265 bringing the GBP/USD pair back towards 1.2780, where the mid-range of the depicted wedge-pattern failed to offer enough bearish rejection. This indicated a continuation of the current bullish movement towards 1.2970-1.2980 where the upper limit of the depicted pattern came to meet the pair. Trade recommendations : Technical traders are advised to wait for any upcoming bearish breakdown below 1.2980 as a valid SELL Entry. Initial T/p level is to be located around 1.2780. On the other hand, bullish persistence above 1.2980 invalidates this trading scenario. The material has been provided by InstaForex Company - www.instaforex.com |
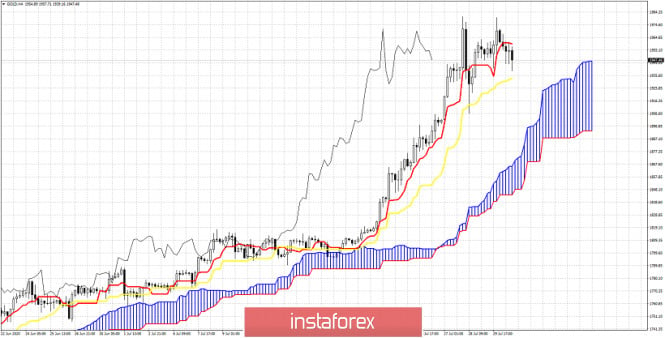
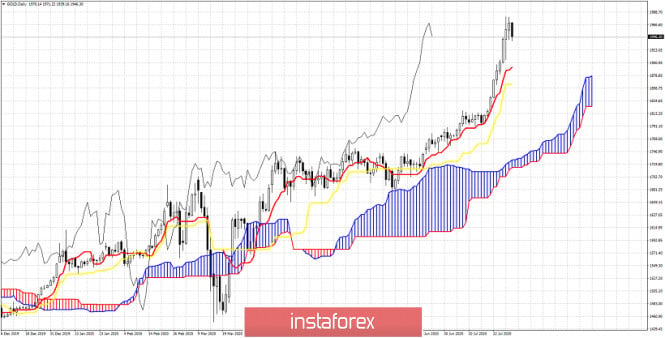
| Ichimoku cloud indicator analysis of Gold Posted: 30 Jul 2020 09:08 AM PDT Gold price is showing signs of a short-term top. Price has made an impressive upward move of nearly 200$ after the base and break out at $1,800. Trend is bullish still but today we identify some price levels that if broken could signal a deeper pull back.
Gold price is trading below the tenkan-sen (red line indicator). This is a first weakness sign. Support is now found at the kijun-sen at $1,933. A break below this support level will open the way for a move towards the Kumo (cloud). The next support is at the Kumo at $1,870-$1,900.
|
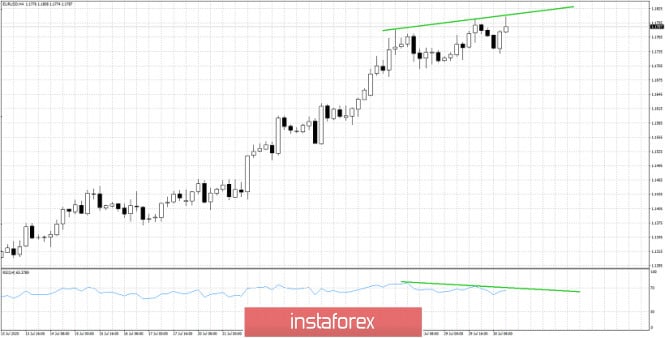
| Short-term technical analysis of EURUSD for July 30, 2020 Posted: 30 Jul 2020 09:01 AM PDT The RSI in the 4 hour chart of EURUSD is showing some warning signs. Usually after a bearish divergence the price pulls back. As we explained in previous posts, 1.18 is a very important resistance area and we expect a pull back from current levels.
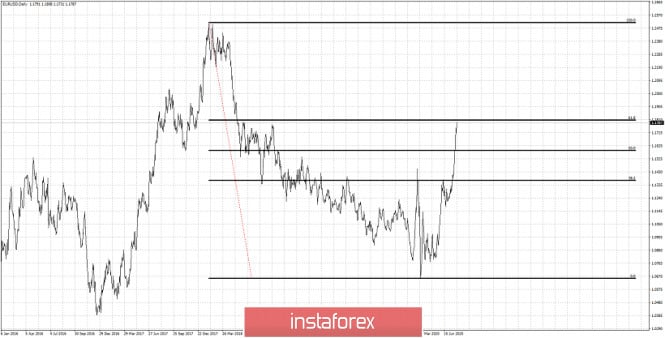
The new higher highs in EURUSD were not confirmed by the RSI. This is a typical bearish divergence signal. This is a warning. Not a reversal signal. Confirmation of at least a short-term top will come if support and recent low at 1.1730 fails to hold. The chances of a pull back are high at current levels because as we explained in previous analysis, at the 1.18 we find the 61.8% Fibonacci retracement of the 1.2510-1.0650 decline. Combining these two factors make me expect a pull back at least towards 1.16-1.17. The material has been provided by InstaForex Company - www.instaforex.com |
| July 30, 2020 : EUR/USD Intraday technical analysis and trade recommendations. Posted: 30 Jul 2020 08:59 AM PDT
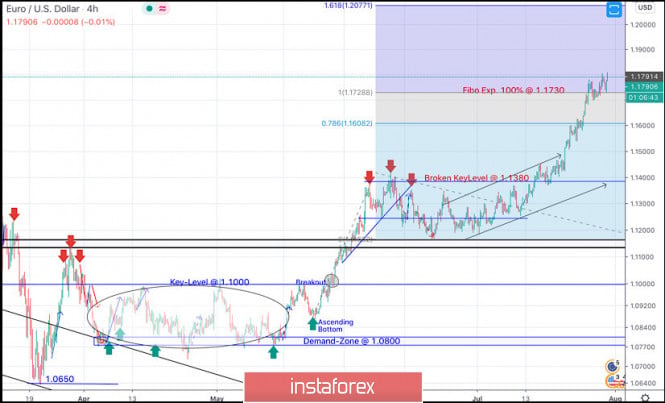
On March 20, the EURUSD pair has expressed remarkable bullish recovery around the established bottom around 1.0650. Shortly after, a sideway consolidation range was established in the price range extending between 1.0770 - 1.1000. On May 14, evident signs of Bullish rejection as well as a recent ascending bottom have been manifested around the price zone of (1.0815 - 1.0775), which enhances the bullish side of the market in the short-term. Bullish breakout above 1.1000 has enhanced further bullish advancement towards 1.1150 then 1.1380 where another sideway consolidation range was established. Hence, Bearish persistence below 1.1150 (consolidation range lower limit) was needed to enhance further bearish decline. However, the EURUSD pair has failed to maintain enough bearish momentum to do so. Instead, the current bullish breakout above 1.1380-1.1400 has lead to a quick bullish spike directly towards 1.1600 (Fibonacci Expansion 78.6% level) which failed to offer sufficient bearish pressure. That's why, further bullish advancement pursued towards 1.1730 (Fibonacci Expansion 100% level) which is failing to offer sufficient bearish rejection up till now. Bullish persistence above 1.1730 will probably favor further bullish advancement towards 1.2075 (161% Fibo Expansion Level) in the intermediate-term. Trade recommendations : Conservative traders should wait for the current bullish movement to pause and get back below 1.1730 as an indicator for lack of bearish momentum for a valid SELL Entry.T/P levels to be located around 1.1600 and 1.1500 while S/L to be placed above 1.1800 to minimize the associated risk. The material has been provided by InstaForex Company - www.instaforex.com |
| EURUSD is at major Fibonacci resistance Posted: 30 Jul 2020 08:57 AM PDT EURUSD has made an impressive upward move the last couple of weeks. Looking at the chart we see a parabolic like upward move from 1.08 to 1.18. Price has now reached important Fibonacci retracement resistance levels.
|
| Gold begins to decline after series of growth Posted: 30 Jul 2020 08:43 AM PDT
Gold moved on a negative correction Thursday morning after a prolonged and precipitous rally over the past few weeks. It nearly sank to 1% mainly due to the transition of the US dollar from a weak position to a stronger one. The dollar is gradually starting to regain its losses, and the price of gold futures for August delivery on the New York trading floor falls 0.88%, which will stir it to the level of $ 1,953.06 per troy ounce. Support for the precious metal goes to the area of $ 1,880.5 per troy ounce, and resistance, respectively, is at around $ 1,974.9 per troy ounce. According to experts, this fall is far from the previous one in the current period. All the problems of gold that it will inevitably have to face are still far ahead. In the near future, the metal may experience more serious resistance on the way to its coveted target of $ 2,000 per troy ounce. The voltage rises as quickly as the resistance. At the same time, it is noted that the frenzied popularity of gold will also end soon, as investors have already approached saturation. This means that a technical correction is quite possible by the end of this and the beginning of next week. In general, over the ongoing year, the price of gold increased by 28%. The rise was ensured by the steady investment demand for precious metals by American and European market participants. This is what neutralized the rather insignificant physical consumption of precious metals in Asia. Nevertheless, the political, economic, and epidemiological situation in the world continues to support the metal. The risk of geopolitical tensions, as well as weak economic growth, are just some of the factors that will contribute to the growth of gold quotes and will definitely not go anywhere in the near future. However, the price level of $ 2,000 per troy ounce is already quite seriously frightening investors, who psychologically did not have time to prepare for such a turn of events, since the situation was developing too quickly. In this regard, a correction is simply necessary to restore balance and continue to grow. The price of silver is also correcting downward today and already fell 4.62% and was at around $ 23.28 per troy ounce. Palladium also showed negative dynamics, which was reflected in its fall of 4.43%. Its current level is $ 2,061.66 an ounce. Platinum supported the 1.91% contraction, pushing it to $ 906.58 per ounce. Copper futures for September delivery are down by 0.34% and remain at $ 2.9238 per pound so far. The material has been provided by InstaForex Company - www.instaforex.com |
| July 30, 2020 : EUR/USD daily technical review and trade recommendations. Posted: 30 Jul 2020 08:42 AM PDT
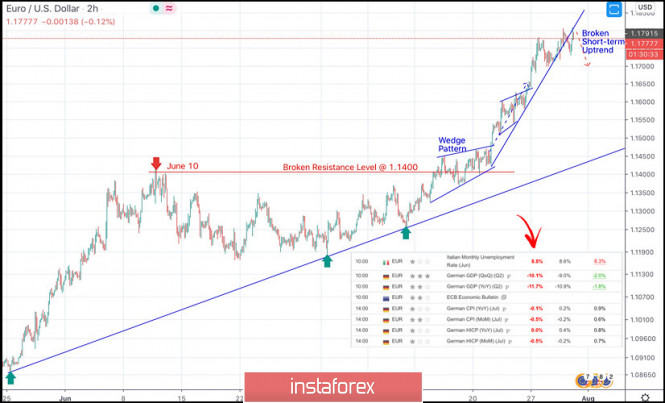
The EURUSD pair has been moving-up since the pair has initiated the depicted uptrend line on May 25. On June 11, a major resistance level was formed around 1.1400 which prevented further upside movement for some time and forced the pair to have a downside pause. Recently, the EURUSD demonstrated an ascending wedge around the mentioned price level of 1.1400.However, Last week a few negative fundamental data from the U.S. have caused the EUR/USD to achieve another breakout to the upside. This week, the EURUSD has been approaching the price levels around 1.1750 where some signs of downside pressure are being enhanced by the negative fundamental reports from Germany Today. Intraday traders should be considering the current breakdown of the depicted short-term uptrend line. A Breakdown below the price level of 1.1650 is going to give a better confirmation for a valid SELL Position. Estimated targets would be located around 1.1550, 1.1500 then 1.1450. The material has been provided by InstaForex Company - www.instaforex.com |
| Posted: 30 Jul 2020 08:18 AM PDT
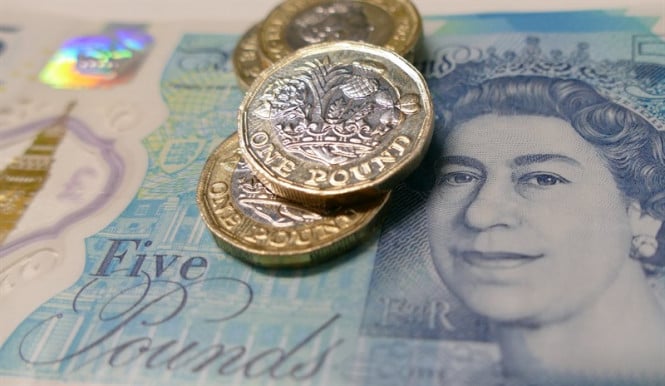
Although the pound sterling strengthened against the US dollar and the euro on Thursday, the risks associated with Brexit and the economic fallout from the COVID-19 pandemic continue to force investors to be wary of the long-term outlook for the pound sterling itself. The decline rate of the dollar accelerated in July, and on Thursday, it attempted to change the direction of its movement and began to strengthen in the Asian session. However, the pound rose anyway, reaching four-month highs against the US dollar and successfully testing the key $ 1.30 level, as well as regaining some of its recent losses against the euro. "Greenback is up against most emerging market currencies, so this is not a typical pound movement with risk," said Thu Lan Nguyen, strategist at Commerzbank. "In general, sterling remains a weak player in the G10 space, so I expect to see a slight correction at some point," she added. In July, the pound sterling gained 4.8% against the US dollar and only 0.2% against the euro. "If the market were confident that the United Kingdom was moving towards a controlled exit from the EU, we would see the pound rise in the cross (EUR / GBP)," said UBS Global Wealth Management. "The fact that we haven't seen much movement in this cross implies a risk premium in relation to the Brexit negotiations," they added. The UK and EU have made little progress so far on a post-Brexit trade agreement. The day before, a representative of the EU banking supervision said that financial institutions that use United Kingdom as a gateway to the EU should work out a plan to serve European customers before the end of the transition period, which ends on December 31, 2020. The outlook for the United Kingdom is also clouded by the country's high coronavirus deaths. According to the British Secretary of Health Matt Hancock, the number of COVID-19 cases in the country is no longer decreasing, and at best remains unchanged. Deutsche Bank experts predict a depreciation of the pound during the rest of the year. They believe that pound shorts are best opened against the euro or yen. The material has been provided by InstaForex Company - www.instaforex.com |
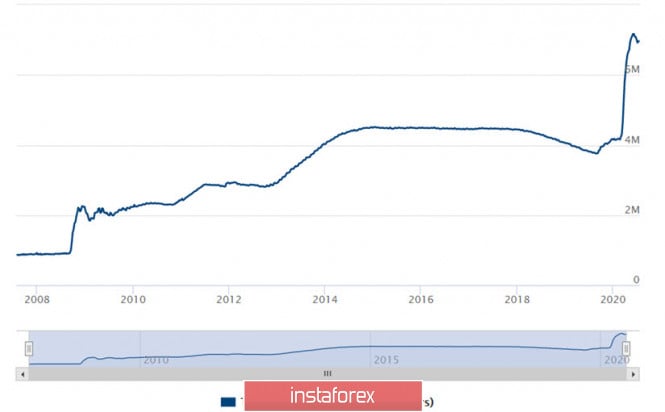
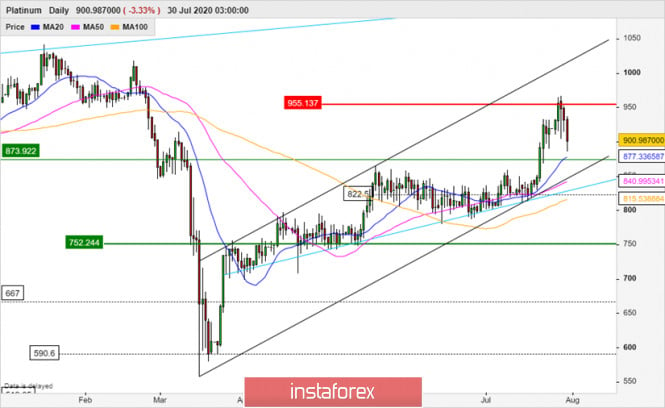
| Platinum: prospects, trends, and trading ideas Posted: 30 Jul 2020 07:44 AM PDT Hi everyone! Mulling over the situation in the market of precious metals, a lot of investors and traders are wondering whether all this hype is a bubble. Is the market actually overheated? Will they have an opportunity to buy at a lower price? With my vast trading and investment experience, I'll try to shed light on these questions. But let me warn you first that I don't have the last word on the matter and could be wrong. When we say that a particular asset is cheap or on the contrary expensive, we compare its price with something else. Is it cheap or expensive in relation to what? Let's take Tesla and compare the electric vehicle maker with TOYOTA, the equally popular and beloved brand by many generations. Which company is more valuable? The answer seems to be obvious. TOYOTA is more valuable as its market capitalization is worth $160 billion and any city is flooded with its cars. However, this is wrong. Tesla's market capitalization equals $279 billion which makes it the most valuable car maker in the world. Now let's compare business efficiency of both companies. TOYOTA has 360,000 employees and its sales are measured at $792,000 per one employee. At the same time, Tesla has 48,000 staffers, 7 times less than at its rival. Moreover, its car sales are measured at $512,000 per one employee. If you were the only owner of the Japanese car manufacturer, you would make a profit of your investment in 17 years due to sales revenue. When it comes to Tesla, you would need mere 296 years to have a good return on your investment. Until then, Tesla would work with losses for long years. The example with #TSLA proves that investors' behavior is often irrational and lacks logic. They are poised to believe in a dream rather than be pleased about dividends of 3.11% per annum which TOYOTA pays off its shareholders. Bingo! I would say this is nothing but hype which is going on now. What I mean, when people say that gold is overvalued now, I want to remind them that unlike the fashionable electric car, gold has been valued high since the times of Adam and Eve. Gold has survived and outpaced other assets in turbulent times. Now the market of precious metals is going through the hype. A year ago when the global community was unaware of COVID-19, Donald Trump stepped up pressure on the US Fed, so that the regulator launched a cycle of rate cuts. At present, the official funds rate is a wee bit above zero. It is expected to stay there indefinitely. Besides, the Federal Open Market Committee signals that it will go on buying bonds at the same pace. In other words, the Fed is going to pump up the money supply at the same pace. Over 5 months of this year, the Fed's balance sheet ballooned by the staggering $3 trillion (see picture 1). I'm impressed. And you? Picture 1. US Fed Balance Sheet from June 2007 until July 2008 Let's suggest that the US Fed keeps on printing cash at the same pace as they say, its balance sheet will swell to $10 trillion until the year end. To be honest, the Fed's balance sheet contracted by $200 billion since late May on account of excessive reserves. Perhaps the central bank decided to do some maintenance with the printing press =). The money supply is always used for some purposes. The massive injection of liquidity revived the equity market and propelled a rally of US stocks. However, the lack of alternative values and the search for shelter assets created new bullish momentum of gold and other precious metals. In a nutshell, speculators are wondering where to invest their savings amid the havoc in the US economy. Many kinds of business have survived at all worldwide. No one dares to predict when exactly the pandemic will come to an end. The stock market is overvalued. The bond market yields minor profits. The risks of holding sovereign debt are rising. No wonder, amid such conditions investors shift focus towards eternal safe haven assets, including gold, silver, and platinum. Back to the crucial question. Can gold extend its stellar rally? I suppose yes, it can. If investors are ready to buy like they are going nuts now, gold is set to extend its climb despite out speculations on what is expensive and what is cheap. Tesla is a good example. Thus, if you have an opportunity to buy precious metals today, then you should do it. I expanded on gold and silver in my previous articles. As for platinum #PLF, it slipped out of my attention. So, today I'd like to consider it in detail. Indeed, platinum has good prospects for further growth. Relative to other precious metals, investors downplay platinum because of its industrial nature. The main field of its application is a catalyst agent in diesel engines. In addition, platinum is used in medicine as well as in production of higher octane gasoline and jewelry. Nevertheless, its application in jewelry is not so popular as gold and silver. The principle difference of platinum from gold is that the former is not an investment asset. Nevertheless, a balance between supply and demand determines any price. Curiously enough, the main source of demand is commodity speculators especially on North American exchange floors. These bulls are betting on a further increase. They have plenty of money. How can we judge what speculators are doing now and want to do? There are legal ways to find out. We should analyze official information about long and short positions on exchanges for any commodity. Yes, I mean the Commitment of Traders Report (COT) which is released by the US Commodity Futures Trading Commission (CFTC). Let's look at this before we make any conclusions. On the whole, platinum is not a very liquid asset. At the peak of its popularity in January 2020, open interest in platinum reached 106,000 contracts which is modest compared to gold. Open interest for gold was 1 million contracts that time. For silver it was over 300,000 contracts. In May, demand for platinum collapsed to 45,000 contracts to the level of 2012. However, shortly after gold and silver set out on a long upward journey, platinum also aroused interest among investors. Since May, speculators are buying platinum slowly but surely. At present the number of open long contracts is a bit over 20,000. Interestingly, the platinum market still lacks big money despite the fact that the price has rocketed over 50% from the lows of $600. On one hand, it means that the ongoing price growth rests on weak fundamentals. On other hand, there are prospects for a spike in case other precious metals extend their rally. In fact, there are god reasons for that. Picture 2. Technical analysis of platinum for 1 to 6 months ahead Well, despite my wish to tell you smart fundamental ideas, the main source of information is a technical chart. Moreover, let me share a secret with you. I never consider fundamental information on any asset unless I see its prospects on the chart. Back to platinum, I'm confident that it has prospects for further growth. Another thing, the ongoing correction can suggest you a decent market entry point. At present, #PLF is moving inside the rising channel, having surpassed resistance of $874 recently. This opens the door for a further climb. In the lower side, I see strong support at near $820 which consists of moving averages and trendlines. The pivot point is at $750. Thus, in case there is a buy signal, it is possible to open a long position from $800-870 with the first target at $1,050. Stop loss could be set below $750 that ensures the risk/reward ratio at least of 2:1. Please be prudent and careful! Make sure you follow money management rules! The material has been provided by InstaForex Company - www.instaforex.com |
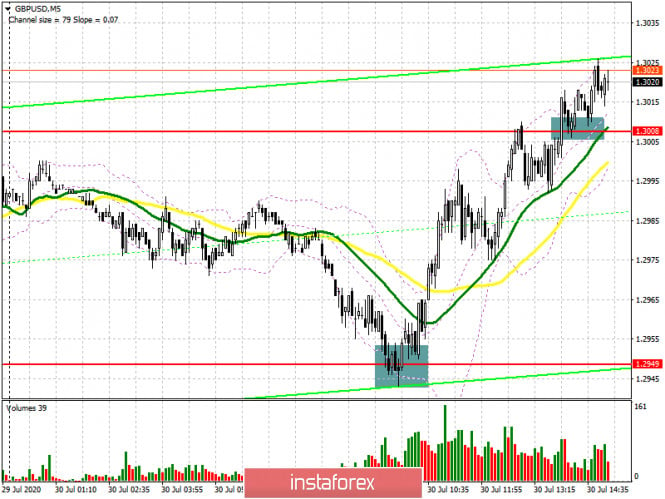
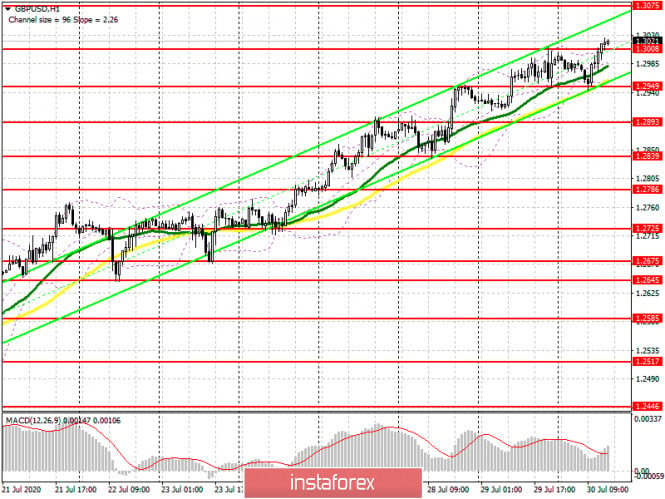
| GBP/USD: plan for the American session on July 30 Posted: 30 Jul 2020 06:09 AM PDT To open long positions on GBPUSD, you need: In the first half of the day, several signals were formed to buy the British pound. Let's look at the entry points in more detail. If you look at the 5-minute chart, you will see that after a downward correction to the support area of 1.2949, a false breakout was formed, which led to the growth of the pound in the resistance area of 1.3008. It was from the area of 1.2949 that I recommended buying the pound in my morning forecast. Now the bulls are trying to take control of the 1.3008 range, breaking through and fixing on it, which is an additional buy signal. While trading will be conducted above this area, you can count on the continued growth of the European currency to the maximum area of 1.3075, where I recommend fixing the profits. The further point will be the resistance of 1.3138. If the pair returns to the level of 1.3008 in the second half of the day, I recommend that long positions be postponed until the low of 1.2949 is updated, and only if a false breakout is formed. If there is no activity from the bulls, it is best to buy immediately for a rebound from the support of 1.2893 in the expectation of a correction of 30-40 points within the day.
To open short positions on GBPUSD, you need: The bears remain in limbo, and the initial task for the second half of the day is to return the pair to the level of 1.3008, which they missed in the first half of the day. Only this scenario forms a signal to open short positions, which will lead to a decrease in the pair to the support area of 1.2949, where I recommend fixing the profits. If the bulls continue to bend their line, then it is best to look at short positions from the resistance of 1.3075 or sell immediately for a rebound from the larger maximum of 1.3138 in the expectation of a correction of 30-40 points within the day.
Signals of indicators: Moving averages Trading is conducted above the 30 and 50 daily averages, which indicates further growth of the pound. Note: The period and prices of moving averages are considered by the author on the hourly chart H1 and differ from the general definition of the classic daily moving averages on the daily chart D1. Bollinger Bands In case of a decline in the pair, the lower border of the indicator in the area of 1.2949 will provide support. Description of indicators
|
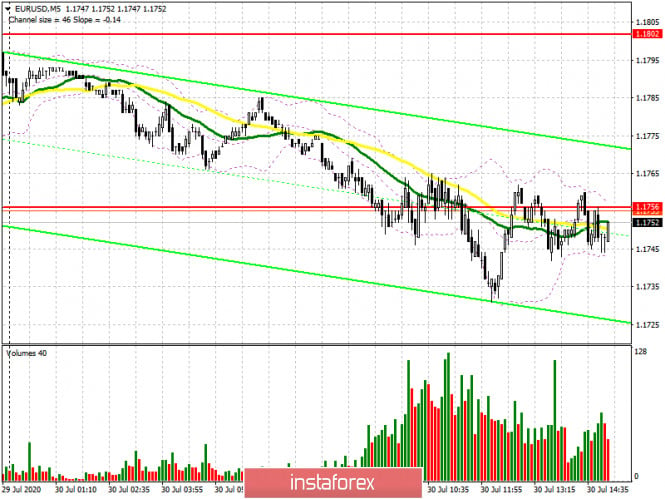
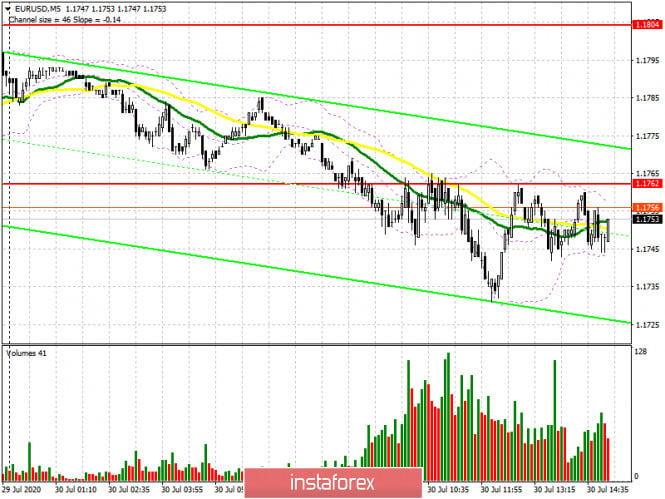
| EUR/USD: plan for the American session on July 30 Posted: 30 Jul 2020 06:00 AM PDT To open long positions on EURUSD, you need: In the first half of the day, it was not possible to achieve a normal entry point for buying or selling the European currency. The level of 1.1756, which I was paying attention to, was completely blurred, resulting in a new resistance of 1.1762, which is clearly visible on the 5-minute chart.
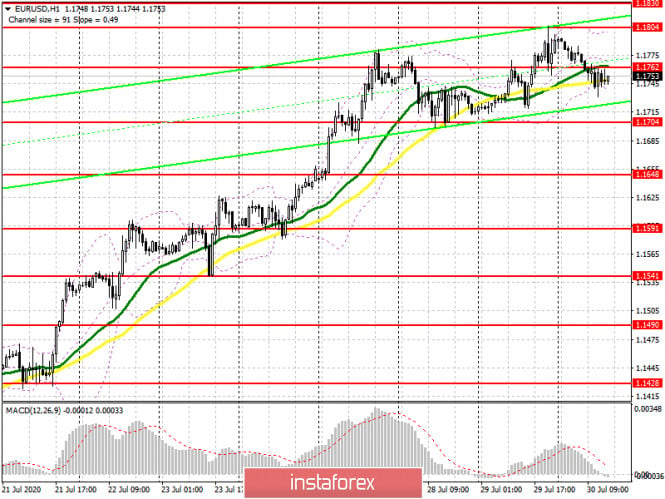
Released fundamental data on the unemployment rate in the Eurozone in the first half of the day did not support the euro much, as it coincided with the forecasts of economists. Now, the further growth of EUR/USD directly depends on the breakdown of the resistance of 1.1762. Only the exit and consolidation at this level forms a good signal to open long positions that can return demand for the euro and lead to an update of the maximum of 1.1804, where I recommend fixing the profits. The longer-term goal is located near the maximum of 1.1830, where I recommend fixing the profits. In the scenario of a decline in EUR/USD in the second half of the day, the minimum of 1.1704 will act as support, however, you can open long positions from it only if a false breakout is formed. You can buy EUR/USD immediately on the rebound from the area of 1.1648 in the expectation of a correction of 25-30 points within the day.
To open short positions on EURUSD, you need: Bears are still coping with their task, but for the full formation of the entry point to short positions from the level of 1.1762, it is necessary to form a false breakout. Only such a scenario will lead to a return of pressure on EUR/USD and a decrease in the area of the lower border of the channel 1.1704, where I recommend fixing the profits. The further target of the bears remains the area of 1.1648. If the demand for the euro returns in the afternoon, and the bears miss the level of 1.1762, it is best to consider new short positions after the update of the weekly high or immediately on a rebound from the resistance at 1.1830, counting on a correction of 25-30 points within the day.
Signals of indicators: Moving averages Trading is conducted in the area of 30 and 50 daily moving averages, which indicates market uncertainty in the short term. Note: The period and prices of moving averages are considered by the author on the hourly chart H1 and differ from the general definition of the classic daily moving averages on the daily chart D1. Bollinger Bands A break in the upper limit of the indicator around 1.1804 will strengthen the demand for the euro. A breakdown of the lower border of the indicator in the area of 1.1740 will lead to a larger downward correction of the pair. Description of indicators
|
| Evening review on July 30, 2020 Posted: 30 Jul 2020 05:53 AM PDT
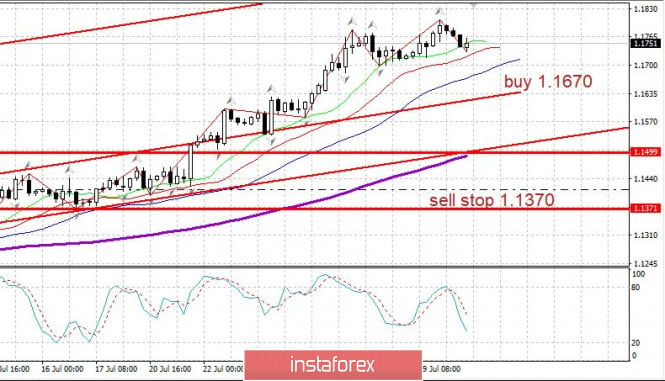
EURUSD: No movement yet. New claims for US unemployment for the last week of July increased to 1.4 million. Long-term employment, on the other hand, has stopped declining at 17 million. We are waiting for a strong rollback in the euro to 1.1670, after which you may consider purchases. The material has been provided by InstaForex Company - www.instaforex.com |
| Absence of good support: oil prices continue to decline Posted: 30 Jul 2020 05:36 AM PDT
The price of crude oil again cannot choose the vector of its movement. It slightly corrected downward on Thursday morning, but the movement was so insignificant to assert that prices practically stand still. However, on Wednesday, the price grew slightly against the background of the release of another portion of statistical data on the level of raw materials in the United States of America. The statistics turned out to be so good that it encouraged market participants and made prices rise slightly. Nevertheless, the future of the oil market remains rather vague: development prospects are already uncertain, and in the context of the spread of coronavirus infection in America and Asia, it becomes completely incomprehensible. Another pressing factor is the new (softer) level of oil production, which was adopted in accordance with the continuing OPEC agreement to reduce the production of raw materials in the world. Added to this is the expected increase in oil refining in the United States since after a steady decline of capacity in the country, previously shut down and frozen stations began to resume their activities. All this, on the one hand, will exert serious pressure on the black gold market, on the other hand, it will become a certain test of the market for stability. If the market copes with this negative, then the rapid and unshakable growth, which analysts previously talked about, will follow. The United States Department of Energy released a report on Wednesday which indicated a decline in oil reserves in the country last week. Moreover, the drop became significant and turned out to be within 10.6 million barrels. Such success has not been noted for a long time, since about late 2019. The preliminary forecasts of analysts were much more modest than real figures. Thus, it was expected that there will be a reduction, but not more than 12 million barrels. Stocks of crude oil on the territory of the storage facility in Cushing, which is a strategically important point, increased slightly by 1.3 million barrels, which, however, is not at all critical. The extraction of raw materials on the territory of the state remained unchanged. Its level remains close to 11.1 million barrels per day. However, US gasoline stocks for the third week of July, on the contrary, increased by 700 thousand barrels. Distillates rose by 500 thousand barrels. This, of course, is also far from the highest figures, but they again contradict the preliminary data. Experts hoped that gasoline stocks would be reduced by about 2 million barrels, while the level of distillates would remain the same. Meanwhile, the US stocks look as ambiguous as the situation on the raw materials market. Investors certainly appreciated the fact that crude oil inventories had dropped significantly, but the increase in gasoline and distillate inventories limited that joy. The price of futures contracts for Brent crude oil for September delivery on the trading floor in London fell slightly by 0.16% or $ 0.07, which sent the price to $ 43.68 per barrel. Note that Wednesday's trading ended with a good rise in the price of contracts by 1.2% or $ 0.53, which allowed it to reach the range of $ 43.75 per barrel. The price of WTI light crude oil futures contracts for September delivery on the electronic trading floor in New York also declined by 0.22% or $ 0.09 and stood at $ 41.18 per barrel. Nevertheless, the trading session on Wednesday ended fairly with growth amounting to 0.6% or $ 0.23, and the price moved to the level of $ 41.27 per barrel. The material has been provided by InstaForex Company - www.instaforex.com |
| EUR / USD: Fed's rhetoric turns out more hawkish than expected. Posted: 30 Jul 2020 04:43 AM PDT
At the two-day FOMC meeting, committee members left the interest rates unchanged at 0% -0.25%, and confirmed the central bank's readiness to do everything necessary to limit the damage of the COVID-19 pandemic and ensure the recovery of the national economy ... Fed Chairman Jerome Powell said that household spending in the US has rebounded by nearly 50%, but capital investment has not yet shown a similar dynamic. According to him, the pandemic left a significant imprint on inflation, and the worsening epidemiological situation in the country is certain to put pressure on the economy. In addition, the upcoming release of US GDP for the second quarter is likely to increase the Fed's concerns on the country's economic outlook, especially since the expected figure is a decline of about 34%, which, if it happens, will be a historic anti -record. The recent depreciation of the dollar indicates that traders expect such an outcome to happen already, moreso because in the coming months, the economic recovery of the US is at risk of slowing down. Strong budget incentives or the creation of a vaccine against COVID-19 would help alleviate this problem, but the likelihood of these events happening soon is rather low. In addition, investors are concerned about the dynamics of the US GDP, but the main problem right now is the uncertainty around the new program that will replace the current payments to unemployment benefits. Hence, during the last week, market participants were actively selling the US dollar, and the Fed was not able to reverse it.
Now, after the announcement of the results of the July FOMC meeting, the USD index updated multi-month lows around 93.16, but despite the fact that the dollar is trying to bounce off these lows, the bulls are clearly not enough to achieve it. "Although the Fed's decision on monetary policy was more hawkish than expected, it was not enough to stop dollar sales," said strategists from Standard Chartered. "The low real and nominal yields in the US, as well as the huge amount of dollar liquidity being injected, remain unfavorable factors for the dollar greenback," they added. On Wednesday, the Fed decided to extend the dollar swap lines in the central banks of nine countries, as well as REPO programs for foreign and international monetary institutions until March 31, 2021. Meanwhile, the decline in the dollar continues to benefit the euro, with which in July, the dollar lost more than 4% of its value against the European currency. In addition, the overall economic prospects for the eurozone looks much better than in the United States, thus, on Wednesday, the EUR / USD pair hit its highest rate since June 2018, rising above the level of 1.18, but then pulled back from those levels. "Apparently, the bullish momentum is starting to show signs of weakening. Along with the persisting overbought indicators, this suggests that the growth phase, which began about two weeks ago, may soon take a break. However, only a breakdown of the strong support in the area of 1.1680 will signal the pair's readiness for such a break. The EUR / USD may advance above 1.1830, but the next important resistance at 1.1950 is unlikely to come into play anytime soon, " UOB said. The material has been provided by InstaForex Company - www.instaforex.com |
| Posted: 30 Jul 2020 04:10 AM PDT Technical analysis:
BTC has been trading downwards in the past 10 hours towards the level of $10,900.I see BTC in potential ABC correction with the potential for test of $10,785 and $10,475. Trading recommendation: Watch for selling opportunities on the rallies due to the C leg in creation and potential for the test of $10,475 BTC failed to test the high at $11,450 and that caused the sellers to come in. Downward targets are set at the price of $10,785 and $10,475 Resistance level is set at the price of $11,330 The material has been provided by InstaForex Company - www.instaforex.com |
| Main US problems that may push USD to bottom Posted: 30 Jul 2020 04:10 AM PDT
Goldman Sachs noted that investors do not trust the current financial policies of the US authorities. The falling US dollar is forcing investors to buy gold as actively as possible. The country fears a rise in inflation due to the unprecedented printing of the US dollars and fiscal stimulus from the Federal Reserve in the amount of $2.8 trillion. This could lead to the depreciation of the currency and, as a consequence, to a loss of the US dollar's status as the main reserve currency of the world. Goldman Sachs initially warned of the long-term incentives' consequences. The US dollar hit a two-year low against the euro. The situation became more critical after the European Union approved the €750 billion Recovery Fund. Based on the market situation, Goldman Sachs raised its forecast for the price of gold as the precious metal reached historic highs of $1,950. However, gold prices may continue to rise if the US real interest rates decline. The last time the United States faced such serious economic problems was in the postwar period. Stephen Roach, a professor at Yale University, expects the US dollar to drop by a third against the other major currencies in 2021-2022. Today, it is difficult to imagine how long the economic recovery will take. The US economic activity continues to remain below the pre-crisis levels. The situation is complicated due to the dreadful epidemiological situation in the country and the rising number of unemployed people amid the pandemic. The number of coronavirus cases is growing rapidly every day. This complicates the process of economic revival. According to Fed Chairman Jerome Powell, the US economy will need even more help from both the Fed and Congress. Mr. Powell assured investors that the financial assistance from the Fed will continue for a long time. The Fed is not going to raise rates. He also promised to use the entire arsenal at the disposal of the Central Bank to support further economic recovery. Jefferies economist Aneta Markovska noted that the Fed would take serious measures and announce a new approach to forecast interest rates and the course of monetary policy in September. Also, the Fed will finalize the revision of the long-term strategy of the monetary policy. From September and until the end of this year, the Fed is likely to start using a yield curve control tool, as Markowska said. In her opinion, the American Central Bank will begin targeting at a certain yield level on government bonds with maturities from 3 to 5 years. The material has been provided by InstaForex Company - www.instaforex.com |
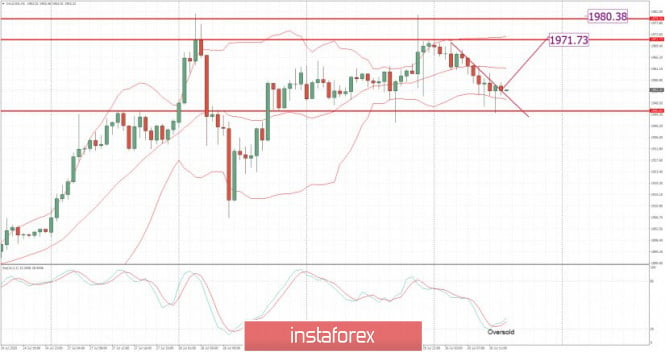
| Posted: 30 Jul 2020 04:03 AM PDT Technical analysis: Gold has been trading downwards in the past 10 hours towards the level of $1,945. Anyway, I still see potential for the new upside leg due to strong upward trend in the background. Trading recommendation: Watch fro buying opportunities on the dips using the 30 minutes and hourly time-frame. I found the brekaout of the supply trendline and the oversold condiiton on the Stochastic oscillator, which is good sign for the further rise. The upward target is set at the price of $,971 and $1,980 Intraday support level is set at the price of $1,945 The material has been provided by InstaForex Company - www.instaforex.com |
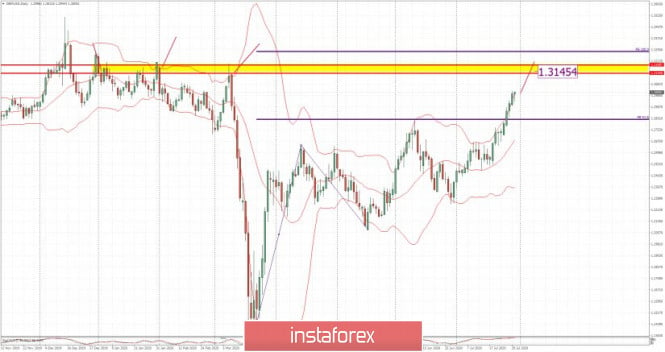
| Posted: 30 Jul 2020 03:57 AM PDT Technical analysis:
Trading recommendation: Watch fro buying opportunities on the dips using the hourly and 4h time-frame for better entry location. The upward target is set at the price of 1,3145 and I dont see any bigger resistance before that level. The material has been provided by InstaForex Company - www.instaforex.com |
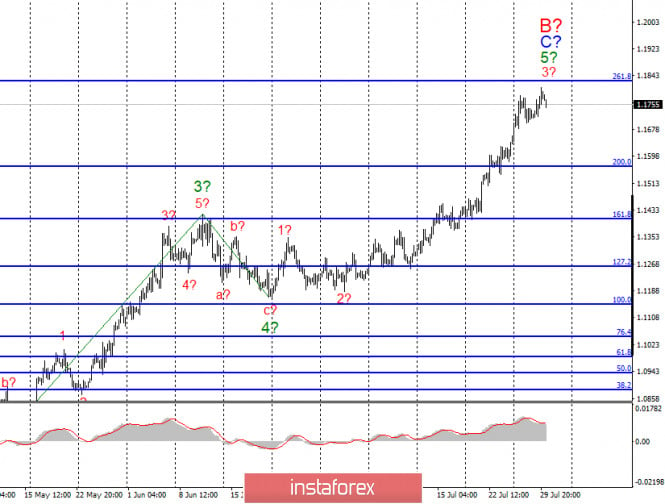
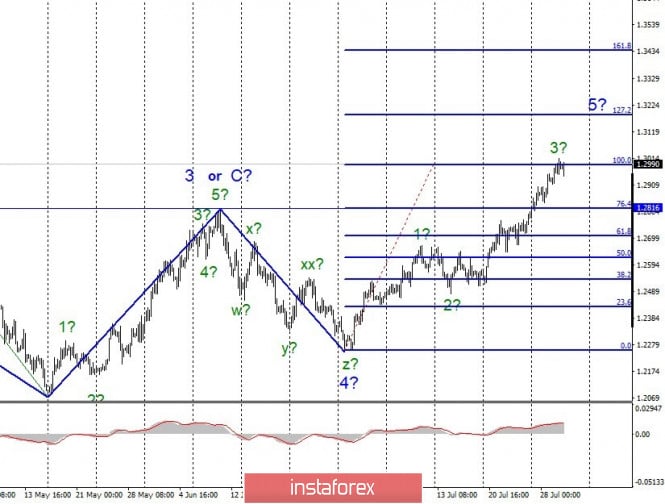
| Posted: 30 Jul 2020 03:54 AM PDT EUR / USD On July 29, the EUR/USD pair gained about 70 pips and thus, continues to build an assumed wave 3 in 5 in C in B with targets located near the 261.8% Fibonacci level. An unsuccessful attempt to break through this level will indicate unavailability of traders to further purchase the instrument and can lead to completion of construction not only waves 3 in 5 to C to B, but of the entire wave C in B. In this case, the instrument will start building a new long-term downward trend section. Fundamental component: The key event of the past day was the Fed meeting and its results, while the coronavirus remains the key event for the whole of America and the markets. Yesterday, the Fed did not change its monetary policy and left rates unchanged, which is what the markets were expecting. However, Fed President, Jerome Powell noted at a press conference that it is the coronavirus that remains the main factor that will affect the economic recovery, its pace, and further actions to change monetary policy. Powell expressed concern that the coronavirus will continue to have a very significant negative impact on the American economy. Thus, full economic recovery can be forgotten until the moment when the epidemic can be completely defeated. In addition, he also noted the high deflationary risks and promised that the Fed will do everything necessary to counter the crisis and epidemic. Several rather important reports have already been released in the European Union. For example, the unemployment rate in Germany did not change compared to June and amounted to 6.4%, while the number of unemployed declined by 18 thousand. On the other hand, GDP for the second quarter turned out to be worse than the already poor forecasts and amounted to -11.7% y / y. The unemployment rate in the European Union rose to 7.8%. But the most interesting thing awaits us in the second half of the day, when the report on GDP for the second quarter in America is released. Markets are expecting a huge drop in the US economy, down 34.5% from the first quarter. Thus, even if the real numbers are slightly better, it is unlikely to help the US currency. The demand for it may decline again in the afternoon, while the euro and the pound may continue to rise. General conclusions and recommendations: The euro/dollar pair presumably continues to build an upward wave C in B. Thus, I recommend staying in the instrument purchases with the goals located near the calculated level of 1.1827, which equates to 261.8% by Fibonacci. Purchases can even be closed on the way to this level. I recommend opening further purchases of the instrument only in case of a successful attempt to break through the level of 1.1827. GBP / USD On July 29, the GBP/USD pair gained about 60 pips by the end of the day and thus, continues the construction of the expected wave 3 in 5. A successful attempt to break through the 100.0% Fibonacci level will indicate that the markets are ready for further growth in the British currency. In this case, the rise in quotes will continue within the same wave 3 to 5 with targets located near the 127.2% Fibonacci level. In any case, Wave 5 does not seem to be complete yet. Fundamental component: There was not a single important economic report in the UK this week. There was also little other news. Thus, the markets are still trading this instrument based on US statistics and news from this country. Today, the situation has not changed at all. The pound stood still waiting for the publication of the US GDP and is ready to start rising again if this report disappoints. There is almost a 100% probability that it will. General conclusions and recommendations: The pound/dollar pair continues to build upward wave 5, nothing changes. Therefore, at this time, I recommend waiting for a successful attempt to break through the level of 1.2990 and continue buying the instrument for each MACD signal "up" with targets located near the level of 1.3183, which equates to 127.2% Fibonacci. The material has been provided by InstaForex Company - www.instaforex.com |
| Posted: 30 Jul 2020 03:53 AM PDT
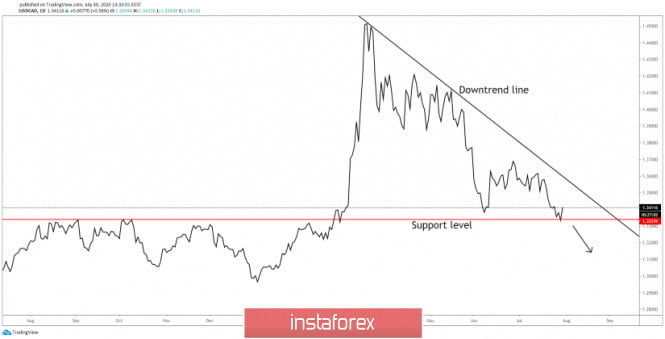
You can see that USD/CAD has bounced back from 1.3337 static support, downside obstacle, and now is traded at 1.3416 level. The downtrend remains intact as long as USD/CAD is located below the downtrend line, that's why we could think that the current increase is temporary. We may have an up reversal, larger upside movement if USD/CAD will breakout and stabilize above the downtrend line, but we cannot talk about this scenario as long as the rate is traded far below this trendline.
The outlook is bearish, USDCAD could drop deeper, as long as it's trapped below the downtrend line. So, we could sell this pair again if it will drop again below the 1.3337 level, let's say if it touches 1.3310 level and you can keep this selling position as long as USD/CAD is located within this downtrend. If you think that USD/CAD will register an important increase and you want to buy this pair, you should wait for the price to jump and stay above the downtrend line, this will be a strong signal that the pair will turn to the upside and it will increase on the medium to the long term. The material has been provided by InstaForex Company - www.instaforex.com |
| Trading plan for USDJPY for July 30, 2020 Posted: 30 Jul 2020 03:46 AM PDT
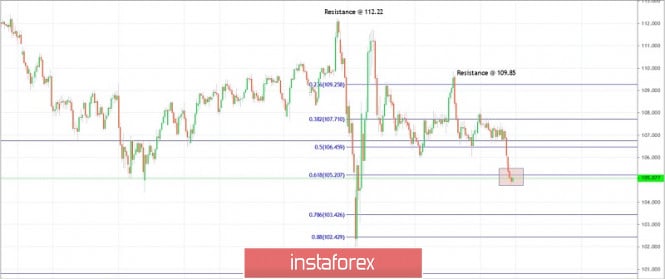
Technical outlook: USDJPY is seen to be trading just above 105.00 levels at this point in writing and might be preparing to produce a bullish reversal ahead. The currency pair is probably working upon the bullish boundary between 101.18 and 112.22 respectively. Kindly note that fibonacci 0.618 support of the above rally is seen towards 105.20 levels and probability remains high for a bullish reversal here. We have to wait for a confirmed signal though, before initiating fresh long positions. A strong support is seen towards 101.18, while resistance comes in around 109.85 levels respectively. If prices continue to drop below 103.40 levels, it would threaten a break below 101.18 going forward. Trading plan: Aggressive traders might remain long, stop @ 104.00, target above 109.85 Good luck! The material has been provided by InstaForex Company - www.instaforex.com |
| Trading plan for GBPUSD for July 30, 2020 Posted: 30 Jul 2020 03:29 AM PDT
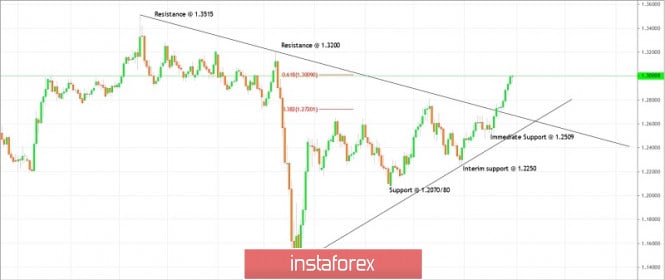
Technical outlook: GBPUSD is trading close to the fibonacci 0.618 extension of the first leg of the rally between 1.1414 and 1.2645 respectively. Immediate price resistance is seen towards 1.3200, while support comes in at 1.2509 respectively. The Cable currency pair is seen to be trading around 1.2995/97 at this point in writing and is expected to produce a bearish reversal soon. Since GBPUSD remains completely in the buy zone of the support trend line through 1.1414 levels, it is advisable to remain on the long side or flat. The rally from 1.1414 look complete around 1.3000 levels and GBPUSD could be reversing lower from here. We shall be waiting for a confirmed bearish signal on the daily chart to initiate fresh short positions. Trading plan: Remain flat for now and prepare to sell. Good luck! The material has been provided by InstaForex Company - www.instaforex.com |
| Trading plan for EURUSD for July 30, 2020 Posted: 30 Jul 2020 03:07 AM PDT
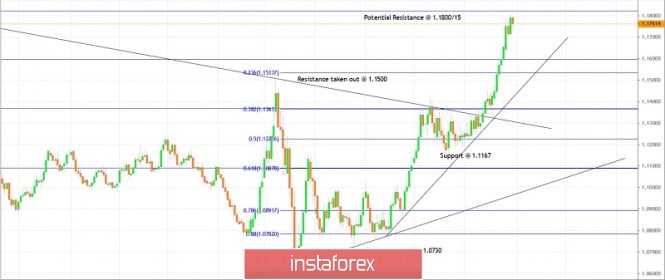
Technical outlook: EURUSD raised past resistance defined at 1.1500 and reached up to 1.1806 yesterday. The single currency pair is seen to be trading around 1.1755 levels at this point in writing and is expected to produce a bearish reversal soon. Looking at the wave structure, the rally from 1.0636 seems to be complete around 1.1806 yesterday, or is very close to completing. It would be a better strategy to prepare to initiate short positions around 1.1800/20 if prices reach there. Also note that EURUSD has almost reached the fibonacci 0.618 retracement of the previous drop from 1.2555 through 1.0636, which is seen towards 1.1820 respectively. On the flip side, a break below 1.1720 also confirms a meaningful top in place. Trading plan: Remain short, stop @ 1.1880, target is open. Good luck! The material has been provided by InstaForex Company - www.instaforex.com |
| You are subscribed to email updates from Forex analysis review. To stop receiving these emails, you may unsubscribe now. | Email delivery powered by Google |
| Google, 1600 Amphitheatre Parkway, Mountain View, CA 94043, United States | |







No comments:
Post a Comment