Forex analysis review |
- Hot forecast and trading signals for the GBP/USD pair on August 12. COT report. UK GDP report should help sellers
- Hot forecast and trading signals for the EUR/USD pair on August 12. COT report. Trump proposes to disperse the protesters
- Analysis and trading signals for beginners. How to trade the GBP/USD pair on August 12? Analysis of Tuesday. Preparation
- Analysis and trading signals for beginners. How to trade the EUR/USD pair on August 12? Analysis of Tuesday. Preparation
- August 11, 2020 : GBP/USD Intraday technical analysis and trade recommendations.
- August 11, 2020 : EUR/USD Intraday technical analysis and trade recommendations.
- GBP/USD prospects based on UK economic data
- August 11, 2020 : EUR/USD daily technical review and trade recommendations.
- Europe stock exchanges experienced positive data, while US indices show different dynamics
- Evening review on August 11, 2020
- EUR/USD at risk of facing deep drawdown
- NZD/USD. The August meeting of the RBNZ
- Analysis of EUR/USD and GBP/USD for August 11. European investors are optimistic about the future; Unemployment in the UK
- False breakout on the EUR/USD pair
- BTC analysis for August 11,.2020 - Watch for potential breakout of the contraction of Bollinger bands
- Analysis of Gold for August 11,.2020 - Downside objective reached at $1.982 with potential for further drop towards $1.940
- Trading recommendations for the GBP/USD pair on August 11
- EUR/USD analysis for August 11 2020 - Completion of the ABC downside correction and potential for strong upside swing towards
- EUR/USD Attracting More Buyers!
- Partial recovery of oil demand raises oil prices
- GBP/USD Downside was compromised!
- Bitcoin has risen in price by 220%, now what's next?
- Trader's diary on 08/11/2020. EURUSD
- Comprehensive analysis of movement options for Gold & Silver (H4) on August 11, 2020
- GOLD Accelerating Its Sell-Off!
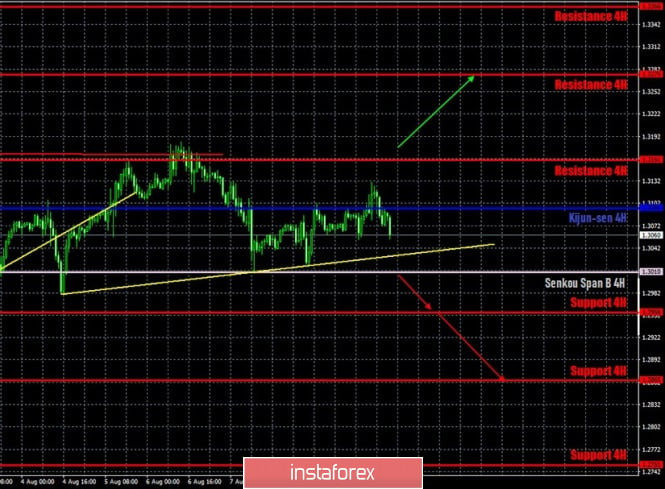
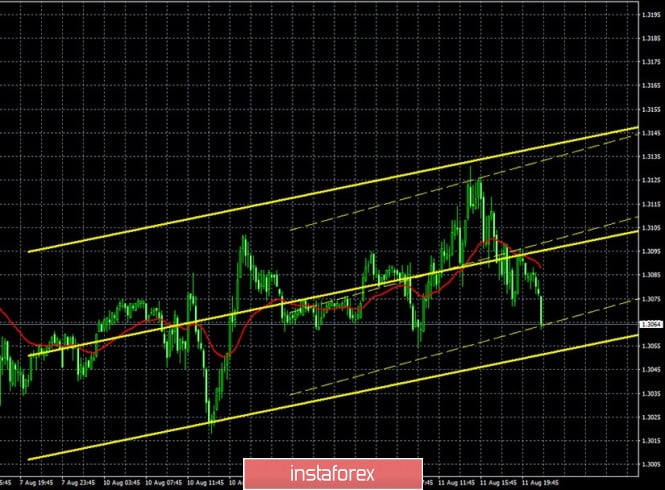
| Posted: 11 Aug 2020 06:34 PM PDT GBP/USD 1H The GBP/USD pair continues to move quite strangely on August 11, completely ignoring the Kijun-sen line, which is important and strong. As of today, we are forced to state that buyers failed to go above the 1.3169 level, and sellers failed to continue moving down after overcoming the critical line. Thus, there is even a kind of flat, which can easily turn into a resumption of the upward trend. Despite the fact that the US dollar has significantly fallen in price recently, traders still do not see any reasons to buy this currency, even if it is technically necessary to correct it. GBP/USD 15M Both channels of linear regression turned up on the 15-minute timeframe, showing the hopelessness of the US dollar at this time. The latest Commitment of Traders (COT) report for the British pound, which was released on Friday, finally matched what is happening now in the market. Recall that two COT reports previously showed a decrease in the net position of non-commercial traders, which, in fact, means that the bullish mood is weakening. That is, the most important category of "non-commercial" traders reduced (roughly speaking) purchases of the British pound during the last two weeks and at the same time the UK currency became more expensive. However, the latest COT report finally showed an increase in the number of Buy-contracts for non-commercial traders, by almost 5,000. At the same time, they also closed Sell-contracts, which were reduced by 3,500. Thus, the total net position for this category increased by 8,500. The pound lost just around 140 points at the end of last week and the beginning of the new week, if you count from the last high. This is very small in the context of COT reports and the concept of a trend. This is not even a correction in the medium term. The fundamental background for the GBP/USD pair was contradictory on Tuesday. For example, the unemployment rate in the UK unexpectedly turned out to be better than forecasts, 3.9%, that is, it did not change compared to the previous month. On the other hand, average wages declined, and the number of applications for unemployment benefits was nine times higher than the forecast. You can interpret these data in different ways, but the British pound did not grow very much after them. Just 30 or 40 points, the usual market noise. The UK will provide much more important information today, which we discussed a week ago. We are talking about the GDP report for the second quarter, which can show the economy contracting by a record 20%. We believe that if this report does not help the US currency, then it is not clear what can help it and pull down the pound/dollar pair. In addition, the change in the volume of industrial production in June will be announced on August 12. However, this report will clearly be in the shadow of the GDP report. The same applies to the report on US inflation. However, if the consumer price index accelerates and comes out better than forecasts, it could also help the dollar today. There are two main options for the development of events on August 12: 1) Buyers continue to remain dominant, only taking a timeout in the last days. They did not manage to gain a foothold above the previous local high of 1.3169, so we recommend opening new purchases of the British currency, but not before breaking the 1.3169 level while aiming for the resistance level of 1.3275. In this case, the potential Take Profit is about 90 points. 2) Bears returned to the area below the Kijun-sen line with great difficulty. Thus, we can now consider trading for a fall, but we recommend waiting until the trend line and Senkou Span B (1.3010) line have been overcome, and only then should you open short positions with targets at 1.2956 and 1.2865. Potential Take Profit in this case is from 30 to 120 points. In any case, you should be careful with selling the pair. There are many factors working in favor of starting a decline, but the bears are still very weak. The material has been provided by InstaForex Company - www.instaforex.com |
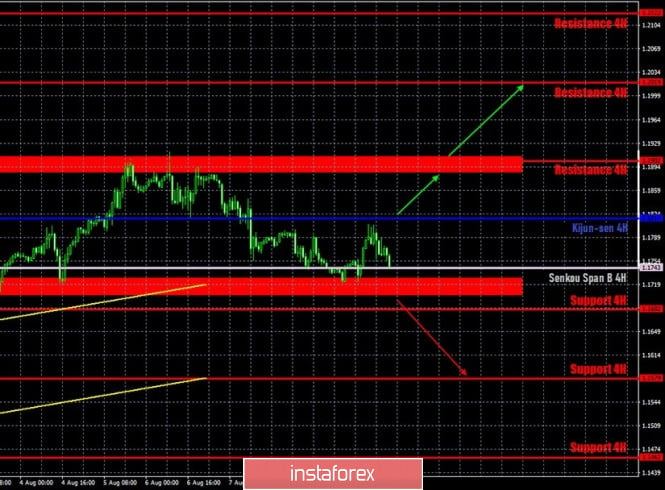
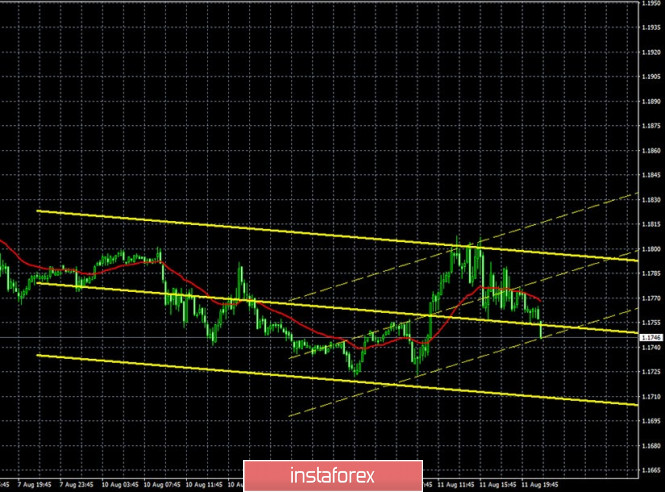
| Posted: 11 Aug 2020 06:31 PM PDT EUR/USD 1H The technical picture for the euro/dollar pair has not changed much on the hourly timeframe of August 11. The pair traded between the Kijun-sen and Senkou Span B lines throughout the trading day, which are strong lines and are not easy to break through. Traders failed to do this on Tuesday. Thus, the pair is now trapped in a side channel that is bounded by the 1.1911 level on the top and the Senkou Span B line (1.1743) on the bottom. There is also a resistance area of 1.1884-1.1907 on the top, and a support area of 1.1702-1.1727 on the bottom. Thus, we have several important resistances at once both at the top and bottom, and the Kijun-sen line in the middle, from which the price also likes to rebound. Thus, at the moment, the pair can not continue to move down, but there is no need to talk about the resumption of the upward trend now. EUR/USD 15M The lower linear regression channel turned up once on the hourly chart on the 15 minute timeframe, the price did not manage to overcome Senkou Span B. The last Commitment of Traders (COT) report, released on Friday, showed that the mood of professional traders have not changed for the last week (recall that the report comes with a three-day delay), July 29 - Aug 4. The "non-commercial" category of traders opened 19,354 Buy-contracts and closed 3,561 Sell-contracts during this time period. Thus, the net position for the most important category of traders has grown by 23,000 at once, which is a very large and eloquent indication of the current mood of the major players. The most important thing is that the report exactly matches what is happening in the foreign exchange market, since the euro currency as a whole continued to grow until August 4. The euro did not suffer any losses during the next three trading days of the week. Thus, so far, everything is going to the point that the next COT report will show that non-commercial traders are increasing purchases. The pair has recently lost about 120 points, but this drop is too weak to be reflected in the COT report. The fundamental background for the EUR/USD pair remained unchanged on Tuesday. No optimistic information coming from overseas. Only negative news from US President Donald Trump, the Democrats, the media, on coronavirus, on rallies and protests, and so on. There is still one negative associated with Trump's figure even when he refrains from another discouraging statement. For example, an unknown person opened fire during a regular briefing at the White House yesterday, near the White House itself. Naturally, he could not inflict damage on any of those gathered at the press conference, and in general it is not clear where he was shooting and why he did so. Nevertheless, Trump had to be urgently evacuated from the briefing, and the US dollar could start a new round of decline from the very night because of this event. In addition, if anyone has forgotten, rallies and protests within the "Black Lives Matter" movement continue in many cities in the United States. The fact that some media have stopped covering these events does not mean that the rallies themselves have stopped. This time, Trump suggests sending the National Guard to Portland. "Portland, which is out of control, should finally, after almost 3 months, bring in the National Guard. The Mayor and Governor are putting people's lives at risk. They will be held responsible. The Guard is ready to act immediately." Trump wrote on Twitter. Recall that the rallies have been going on for three months. Based on the above, we have two trading ideas for August 12: 1) Buyers continue to wait for the right moment to start active trading again. To make new purchases of the euro, you are advised to wait until the price consolidates above the resistance area of 1.1884-1.1910. Then we will recommend buying the pair with the target at the resistance level of 1.2019. In this case, the potential Take Profit is about 80 points. If the price consolidates above the Kijun-sen line (1.1817), you can also open longs with the target of 1.1884. 2) Bears are still moving down with great difficulty. The fact that the price is below the Kijun-sen line leaves them chances for a new downward trend to form. Thus, we recommend opening sales after breaking through the support area of 1.1702-1.1727 while aiming for the 1.1579 level. Potential Take Profit in this case is about 90 points. The material has been provided by InstaForex Company - www.instaforex.com |
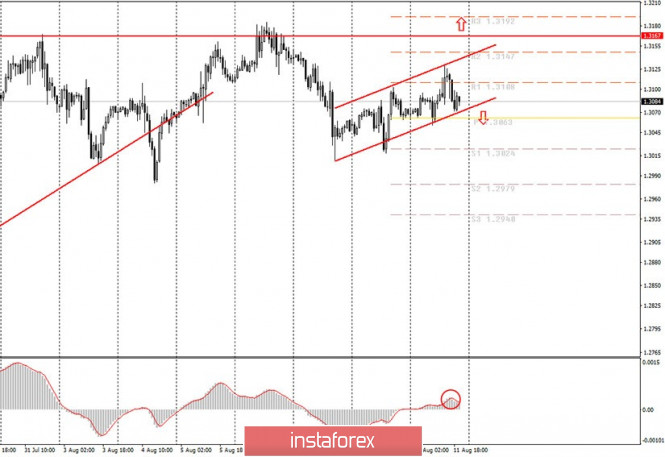
| Posted: 11 Aug 2020 04:49 PM PDT Hourly chart of the GBP/USD pair The technical picture for the GBP/USD pair is getting more complicated day by day. Since the pair's quotes also failed to overcome their previous local high of 1.3169, we expect the pound to fall in the near future. Nevertheless, market participants have been buying the pair in recent days, which even led to forming a short-term upward trend, which is indicated by an upward channel in the illustration. At the same time, we do not advise trading the pound/dollar pair upwards now, as well as for the euro. The likelihood that traders will no longer actively buy the pound around five-month highs is too great, which itself is one of the most problematic and weak currencies in the last four years. Be that as it may, it will be possible to consider buying but not before the 1.3167 level has been overcome. As for selling, for these trades, we advise you to wait for the price to close below the rising channel. Fundamentally, novice traders had something to look out for on Tuesday. For once, several important macroeconomic publications have been published in the UK. The most interesting - the unemployment report - turned out to be much better than the forecast values and reached 3.9%. In fact, unemployment has not increased from the very beginning of the pandemic and the coronavirus crisis in Britain. What is it? Correct government action? An effective stimulus program from the Bank of England that saved the British from cuts? One way or another, but the pound really had reasons for growth on Tuesday. The other two reports were less rosy, but they were also less significant. Wages slightly fell in June and jobless claims were higher than traders expected. On Wednesday, novice traders are advised to pay attention to the report on GDP for the second quarter, since this is the most important report for the day. It is expected that the GDP would fall 20.2% compared to the first quarter as a result of the coronavirus crisis, which was also negative. We believe that this information may put pressure on the pound's position, since this is the largest drop in GDP in the country over the past 100 years. A greater economic contraction in the second quarter has only been found in the United States, but the market has already worked out this data. A report on industrial production will also be released tomorrow, which has already begun to recover after quarantine and could grow by 9.2% in June compared to May. The following scenarios are possible on August 12: 1) Despite the fact that the pound/dollar pair resumed its upward movement, we believe that buying around five-month highs is not the wisest decision. Nevertheless, if the price manages to close for an hour above the 1.3167 level, which passes through the last two peaks of the price, this will be a signal for new small purchases. 2) Selling, from our point of view, can be considered if the price manages to gain a foothold below the upward channel in which it is trading right now. In this case, sellers may again try to bring the pair to the levels of 1.3024 and 1.2979. Most likely, the MACD indicator in this case will be automatically directed downward. This signal can also be formed at night, which is somewhat inconvenient in terms of accompanying an open deal. What's on the chart: Support and Resistance Price Levels - Levels that are targets when buying or selling. You can place Take Profit levels near them. Red lines - channels or trend lines that display the current trend and show which direction it is preferable to trade now. Arrows up/down - indicate when you reach or overcome which obstacles you should trade up or down. MACD indicator is a histogram and a signal line, the crossing of which is a signal to enter the market. It is recommended to use in combination with trend lines (channels, trend lines). Important speeches and reports (always contained in the news calendar) can greatly influence the movement of a currency pair. Therefore, during their exit, it is recommended to trade as carefully as possible or exit the market in order to avoid a sharp price reversal against the previous movement. Beginners in the forex market should remember that every trade cannot be profitable. The development of a clear strategy and money management are the key to success in trading over a long period of time. The material has been provided by InstaForex Company - www.instaforex.com |
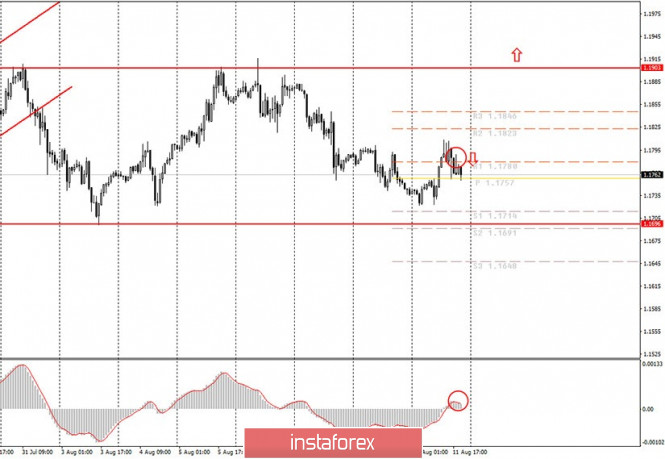
| Posted: 11 Aug 2020 04:47 PM PDT Hourly chart of the EUR/USD pair The EUR/USD pair began to correct upward again on Tuesday, August 11, which was signaled by the MACD indicator with an upward reversal at night. In fact, the correction began at night trading and did not stop throughout the day. Thus, novice traders did not receive a new sell signal. Therefore, short positions should not have been opened. We did not recommend buying the pair, since the upward trend is temporarily paused, and the price has not yet reached the 1.1696 level (the previous price low). However, take note that the volatility of the EUR/USD pair increased on Tuesday, so we can expect stronger moves on Wednesday and the rest of the week. Fundamentally speaking, there was nothing to analyze on Tuesday. No important economic news and reports on that day. However, there was not even much usual news, and most of it came from America again. Although, there is no particularly interesting information here even for novice traders. An unknown person opened fire during a regular briefing by US President Donald Trump. Where the attacker was shooting and why he did so is unknown. After all, the president was at a press conference inside the White House. Thus, even theoretically, the attacker could not inflict any harm on the US president. Nevertheless, this news had a very negative impact on the US currency, which, as we said above, began to fall overnight. Several macroeconomic reports from Europe did not have a particular impact on the pair's quotes. All of them reflected the economic expectations of major investors and managers in Germany and the European Union. Novice traders are advised to carefully study two reports on Wednesday, August 12. The first will be published in the morning - industrial production in the European Union. The second - after lunch - inflation in the United States. Industrial production has a huge impact on GDP and is therefore considered a fairly important report. It is expected to grow by 10% m/m by the end of June. As for inflation in America, the main indicator (which takes into account absolutely all prices) is projected to rise to 0.8% y/y, while inflation excluding food and energy (volatile commodity groups) may slow to 1.1% y/y. g. In general, these figures do not indicate either a serious improvement in the situation or a serious deterioration. Recall that, in principle, any value of core inflation below 2% is considered weak, since the Federal Reserve (the US central bank) is exactly aiming for 2% y/y. The following scenarios are possible on August 12: 1) Purchases of the pair remain irrelevant at this time, since the price was not able to overcome the 1.1903 level. Traders are currently deprived of buy signals. Based on this, we do not recommend trading the pair up. We still believe that quotes should fall at least to the 1.1696 level, and only after that it will be possible to speculate about a possible resumption of the upward trend. 2) Selling the currency pair is still more promising now, at least with the target of 1.1696 (the previous local low). There are now about 60 points to this goal, but with the current volatility, even these 60 points will be difficult to pass. The MACD indicator reversed down just a few hours ago, so now there is a signal for new sales with targets at 1.1714 and 1.1696. Leaving a trade open overnight for novice traders is a bit risky, so if you do this, you must set Take Profit and Stop Loss. What's on the chart: Support and Resistance Price Levels - Levels that are targets when buying or selling. You can place Take Profit levels near them. Red lines - channels or trend lines that display the current trend and show which direction it is preferable to trade now. Arrows up/down - indicate when you reach or overcome which obstacles you should trade up or down. MACD indicator is a histogram and a signal line, the crossing of which is a signal to enter the market. It is recommended to use in combination with trend lines (channels, trend lines). Important speeches and reports (always contained in the news calendar) can greatly influence the movement of a currency pair. Therefore, during their exit, it is recommended to trade as carefully as possible or exit the market in order to avoid a sharp price reversal against the previous movement. Beginners in the forex market should remember that every trade cannot be profitable. The development of a clear strategy and money management are the key to success in trading over a long period of time. The material has been provided by InstaForex Company - www.instaforex.com |
| August 11, 2020 : GBP/USD Intraday technical analysis and trade recommendations. Posted: 11 Aug 2020 10:37 AM PDT
Since April, the GBPUSD has been moving sideways within the depicted consolidation range extending between (1.2265 - 1.2600)On May 15, transient bearish breakout below 1.2265 (consolidation range lower limit) was demonstrated in the period between May 13 - May 26, denoting some sort of weakness from the ongoing bullish trend. However, immediate bullish rebound has been expressed around the price level of 1.2080 bringing the GBPUSD back above the depicted price zone of 1.2520-1.2600 which failed to offer sufficient bearish rejection. Further bullish advancement was expressed towards 1.2780 (Previous Key-Level) where another episode of bearish pullback was initiated. Short-term bearish movement was expressed, initial bearish targets were located around 1.2600 and 1.2520 which paused the bullish outlook for sometime & enabled further bearish decline towards 1.2265. Significant bullish rejection was originated around 1.2265 bringing the GBP/USD pair back towards 1.2780, where the mid-range of the depicted wedge-pattern failed to offer enough bearish rejection. Intermediate-term Technical outlook for the GBP/USD pair remains bullish as long as bullish persistence is maintained above 1.2780 (Depicted KeyLevel) on the H4 Charts. On the other hand, significant bearish rejection was demonstrated around the price level of 1.3160 in the form of (Bearish Engulfing Candlesticks). Hence, upcoming bearish reversal should be expected provided that early bearish breakout occurs below 1.2980 (the depicted wedge pattern upper limit). Trade recommendations : Technical traders are advised to wait for any upcoming bearish breakdown below 1.2980 as a valid SELL Entry. Initial T/p level is to be located around 1.2780. On the other hand, bullish persistence above 1.2980 invalidates this trading scenario. The material has been provided by InstaForex Company - www.instaforex.com |
| August 11, 2020 : EUR/USD Intraday technical analysis and trade recommendations. Posted: 11 Aug 2020 10:34 AM PDT
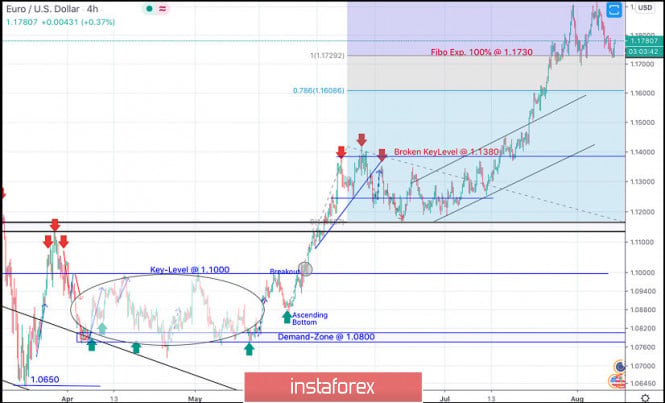
On March 20, the EURUSD pair has expressed remarkable bullish recovery around the established bottom around 1.0650. Shortly after, a sideway consolidation range was established in the price range extending between 1.0770 - 1.1000. On May 14, evident signs of Bullish rejection as well as a recent ascending bottom have been manifested around the price zone of (1.0815 - 1.0775), which enhances the bullish side of the market in the short-term. Bullish breakout above 1.1000 has enhanced further bullish advancement towards 1.1150 then 1.1380 where another sideway consolidation range was established. Hence, Bearish persistence below 1.1150 (consolidation range lower limit) was needed to enhance further bearish decline. However, the EURUSD pair has failed to maintain enough bearish momentum to do so. Instead, the current bullish breakout above 1.1380-1.1400 has lead to a quick bullish spike directly towards 1.1600 (Fibonacci Expansion 78.6% level) which failed to offer sufficient bearish pressure. That's why, further bullish advancement pursued towards 1.1730 (Fibonacci Expansion 100% level) which failed to offer sufficient bearish rejection for a few days until Today. Bullish persistence above 1.1730 will probably favor further bullish advancement towards 1.2075 (161% Fibo Expansion Level) in the intermediate-term. On the other hand, bearish re-closure below 1.1730 indicates lack of bullish momentum and enhances further bearish decline initially towards 1.1600. Trade recommendations : Conservative traders should wait for the current bullish movement to pause and get back below 1.1730 as an indicator for lack of bearish momentum for a valid SELL Entry.T/P levels to be located around 1.1600 and 1.1500 while S/L to be placed above 1.1800 to minimize the associated risk. The material has been provided by InstaForex Company - www.instaforex.com |
| GBP/USD prospects based on UK economic data Posted: 11 Aug 2020 09:37 AM PDT UK's data on national economic growth is set to be published on Wednesday. This is a rather important event, which, as a rule, has a strong influence on the dynamics of the GBP/USD pair. Since last week, the pound has been demonstrating increased volatility, but it still cannot determine the direction of its movement. Starting from August 3, the pair storms the 31st figure almost every day, but each time it comes back to the 30th price level. According to the D1 timeframe, every bullish win is followed by a bearish revenge. As a result, the pound sterling is marking time in the area of the 1.3050 mark. This is a kind of "parity line" to which both buyers and sellers return. Tomorrow traders will again try to swing the pendulum in one direction or another, depending on the status of the British economy.
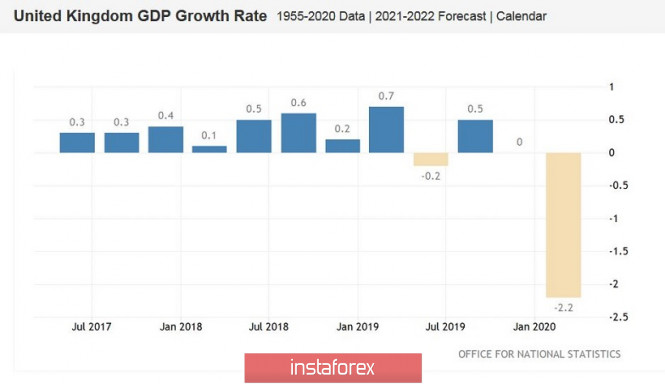
It should be noted that on Wednesday we will not only be expecting data on UK GDP growth for the second quarter but also more recent economic data in the UK. This includes indicators of growth of the British economy in June, indicators of industrial production, processing industry, construction, and service sectors. And the more operational indicators there are in the "green zone", the more calmly traders will perceive the disastrous GDP figures for the second quarter. Note that was in the second quarter that Britain experienced the peak of the coronavirus pandemic (like many countries in the world). The most difficult situation developed from late March to early May - the country was quarantined, and the economy was paralyzed. And tomorrow we will finally find out the adverse effects of the general lockdown: according to general forecasts of experts, the UK economy in the second quarter will collapse by a record of 20.5% in quarterly terms and by a similar record 22.5% in annual terms. But - I repeat - such a dynamic is widely expected and certainly will not come as a surprise to market participants (unless the numbers go much deeper into the negative area). Remember the results with which the US or the EU countries closed the second quarter - analysts barely had time to declare another set anti-record. And Britain is no exception. Completely different requirements for more operational indicators. And although we will only find out the data for June, they will still be able to guide traders regarding the future prospects of the British economy. Most countries in the world fell at the same rate, but they will recover in different ways. And if the June data signals alarming trends, the pound will come under severe pressure. Moreover, against the backdrop of recent events, when the coronavirus again reminds of itself - both in Europe and in the UK. Nevertheless, preliminary forecasts are positive. So, in June, the volume of British GDP should increase immediately by 8%, after a weak growth of up to 1.8% in May. Such a result will testify to the stable dynamics of the British economic recovery. For comparison, it should be said that in March this figure came out at the level of -5.8%, in April - at the level of -20.3%, and in May, as mentioned above, already in positive territory - at the level of 1.8 %. And if the June release compliments this puzzle with 8% gains, the pound will gain support even amid a record second-quarter decline. The same can be said about the rest of the releases. Industrial production is set to rise by almost 10% in June (on a monthly basis); the processing industry should show similar dynamics (+ 10% m / m). The construction industry may even surprise you with a record: the volume of construction may increase by 15% at once. The service sector may have tremendous experience of negative dynamics. However, this is quite understandable, given the collapse of the tourism and restaurant business (for example, pubs in Britain opened only in early July). Therefore, if this component comes out at least at the level of forecasts, it will not have a strong influence on the mood of traders.
Thus, trading decisions on the GBP/USD pair should be based on the results of tomorrow's release. If more immediate economic indicators turn out to be in the green zone, the pound could receive significant support - even if the second-quarter figures update the anti-record. In this case, it will be possible to enter longs with the first northern target of 1.3150 - as a rule, the pair bounces down from this price level. If the price overcomes this target, the next resistance level will be the upper line of the Bollinger Bands indicator on the daily chart, which corresponds to the level of 1.3230. If all of the above indicators turn out to be worse than forecasted, then the GBP/USD pair will fall into the power of bears. In this case, we should expect the price to fall to the support level of 1.2900 (the middle line of the Bollinger Bands on the same timeframe). The material has been provided by InstaForex Company - www.instaforex.com |
| August 11, 2020 : EUR/USD daily technical review and trade recommendations. Posted: 11 Aug 2020 09:34 AM PDT
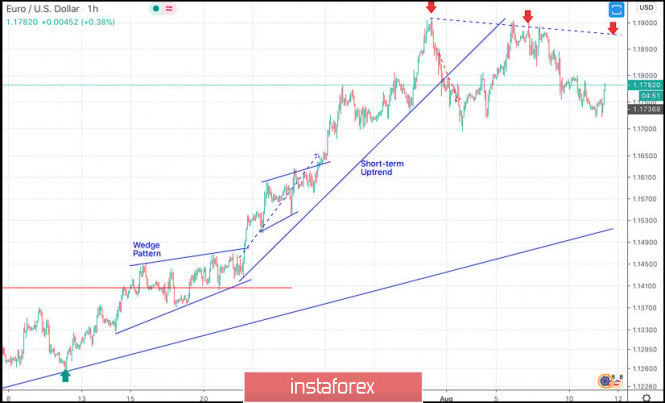
The EURUSD pair has been moving-up since the pair has initiated the depicted uptrend line on May 25. On June 11, a major resistance level was formed around 1.1400 which prevented further upside movement for some time and forced the pair to have a downside pause. Recently, the EURUSD demonstrated an ascending wedge around the mentioned price level of 1.1400.However, recent negative fundamental data from the U.S. have caused the EUR/USD to achieve another breakout to the upside. By the end of last week, the EURUSD has been approaching the price levels around 1.1900 where signs of downside pressure were enhanced by the negative fundamental reports from Germany on Friday. Intraday traders should be considering the current breakdown of the depicted short-term uptrend line. A Breakdown below the price level of 1.1650 is going to give a better confirmation for a valid SELL Position. Estimated targets would be located around 1.1550, 1.1500 then 1.1450. On the other hand, conservative traders should consider any bullish pullback to retest the newly-established downtrend line around 1.1850 for another SELL Position with a lower risk. The material has been provided by InstaForex Company - www.instaforex.com |
| Europe stock exchanges experienced positive data, while US indices show different dynamics Posted: 11 Aug 2020 07:34 AM PDT
Main indices in the US stock exchanges are still showing multidirectional movement on Tuesday. If the S&P 500 is growing rapidly to its maximum historical values, the Nasdaq, on the other hand, continues its negative correction. US President Donald Trump's signing of the stimulus bill which bypassed Congress became the main vector of support for the stock market. According to the provisions of this document, incentive payments to unemployment benefits will be charged again which is now narrowed to $400. Approximately 75% of stimulus funding will come from the federal budget, and 25% will be assigned to local authorities. In addition, Trump ratified a decree deferring tax payments on salaries of employees whose total annual income is less than $ 100,000. A moratorium on student loan payments and support measures for homeowners and tenants have also been maintained. However, there is still no single decision of the country's two central parties regarding the incentive program. The Finance Minister issued a statement in which he indicated that the problematic situation could end at the end of this week, which means that the long-awaited agreement on a new program of stimulating the economy will be adopted soon. In the meantime, President Trump's action of issuing his own decrees came in handy, since they provide a short-term respite for making final decisions. According to most experts, this is better than nothing at all. However, do not forget that this is a temporary solution that needs to be reinforced with more subsequent steps. The biggest concern of analysts now is that all eyes are on the Democrats and Republicans, which means that the pressure is extremely high, which can also affect the speed of decision-making. Another unpleasant moment for market participants is the aggravation of the conflict between the United States and China. This is becoming a particular problem in the run-up to a new round of negotiations between countries on a trade agreement. It should be noted that the meeting of representatives of the states should take place at the end of this week. One of the points that is expected to be discussed will be the issue on China's imports of energy resources. However, the political background for the meeting is not very favorable. Last week, Trump imposed sanctions against high-ranking officials from Hong Kong and China, which was followed by a similar response from the Chinese authorities. In addition, the use of the TikTok application, which was developed in the PRC, was banned in the United States. The Dow Jones Industrial Average at the end of the trading session on Monday increased by 1.3%, or 357.96 points, which allowed it to step up significantly to 27,791.44 points. This is the seventh climb in a row, and the victorious procession does not intend to slow down. The Standard & Poor's 500 Index gained 0.27% or 9.19 points. Its level amounted to 3,360.47 points, coming close to its maximum value, which was fixed closer to the end of February this year. Recall that then the indicator level was 3,386.15 points. Moreover, its growth also continues for the seventh day in a row, which has not happened for a long time. The Nasdaq Composite index was the only one that went into the negative zone: its indicators decreased by 0.39% or 42.63 points, to 10,968.36 points. The European stock exchanges, on the contrary, experienced positive data in general. The main stock indicators are showing steady and rapid growth. Investors kept their eyes on the decision-making process for a new financial incentive program in the US. The general index of large enterprises in the Stoxx Europe 600 increased immediately by 1.57% and amounted to 370.37 points. The UK's FTSE 100 jumped nearly 2% adding 1.97%. The German DAX Index rose 2.18%. France's CAC 40 index rose confidently by 2.23%. The Italian FTSE MIB index has become the leader of the growth today climbing 2.53%. Spain's IBEX 35 index was slightly more modest adding 2.29%. In addition to overseas news, the European stock market is playing back its internal statistics. The total number of working citizens in the country in the second quarter decreased by 220 000 compared to the previous quarter. Thus, the unemployment rate dropped to 32.92 million, which was the highest decline in the last eleven years. The material has been provided by InstaForex Company - www.instaforex.com |
| Evening review on August 11, 2020 Posted: 11 Aug 2020 06:49 AM PDT
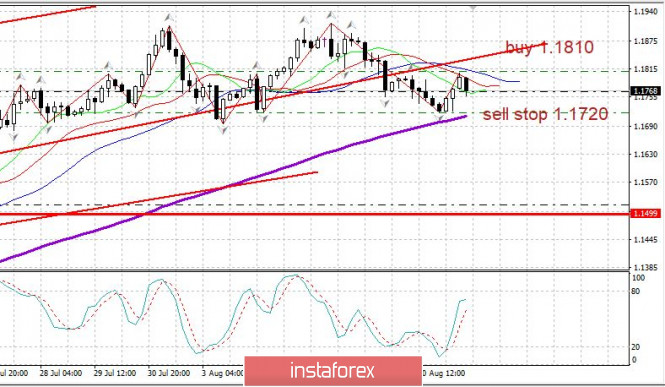
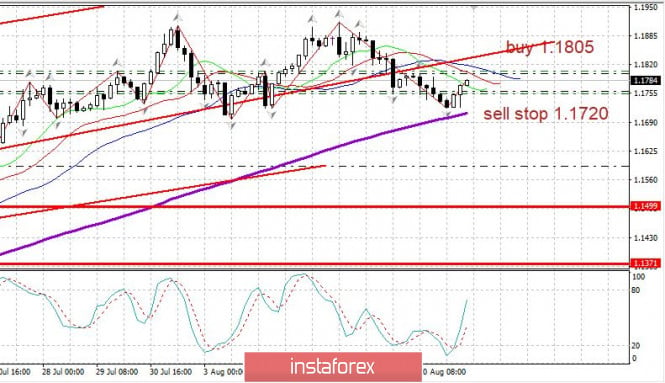
The EURUSD pair prepares levels for a breakdown entry. You may consider purchases from 1.1810. Sell from 1.1720. Stops are 45 points, targets are at least 170 points in each direction. There was no significant news which is why the market was stagnant. The material has been provided by InstaForex Company - www.instaforex.com |
| EUR/USD at risk of facing deep drawdown Posted: 11 Aug 2020 05:39 AM PDT The EUR/USD pair has been reaching new intraday lows for the fourth consecutive session. The downtrend strengthened after the bulls had made several unsuccessful attempts to settle above 1.1900. According to experts, a drop below 1.1700 will lead to a stronger decline, pushing the major currency pair to the level of 1.1650 and lower. "The EUR /USD current trajectory largely resembles the price dynamics seen before the downside correction that happened in June. Then the price went from 1.1422 to 1.1168. This scenario carries the risk of a deeper retracement. A drawdown to the area of 1.1475-1.1530 is highly possible now," analysts at Citigroup said. Investors are now shifting from the euro to the US dollar amid reports that the sell positions for USD and buy positions for EUR have reached record highs. This may signal that many traders have already bet on the growth of the euro against the dollar. However, this could have deprived the single European currency of a driver for further rise. On the other hand, it could indicate a broader recovery in the US currency. The greenback got a chance to rebound on hopes that a new stimulus package will be approved in Washington. Besides, the recovery of the US government bond yields from their multi-month lows provided additional support for the US dollar. Last weekend, US President Donald Trump approved a supplement of $400 to unemployment benefits, and signed orders on other stimulus measures. "Compared to the previously discussed agreement on the stimulus package worth $1-1.5 trillion, a positive effect on the economy from the announced measures will be much weaker. However, investors seem to hope that some kind of a deal will follow in the end," JPMorgan said. Meanwhile, tensions between Washington and Beijing continue to escalate. Donald Trump said yesterday that the trade deal with China means much less to him now. This comment was made just before the next round of trade negotiations between senior representatives of the two countries. Investors seem to downplay the fact of the worsening relations between the United States and China. However, they are very concerned about the outcome of the trade agreement. If it is terminated, then stocks could slump and the greenback would rise as a safe-haven asset. "The weakening of the US dollar against the euro has exceeded our expectations, but the movements seen in the recent weeks are unlikely to be sustainable," analysts at HSBC said. "It looks like the global economic recovery will be relatively slow. At the same time, in the United States, according to the latest statistics, the picture does not look as grim as many investors thought. Therefore, we remain optimistic about the outlook for the US currency and still think that to the EUR/USD will remain at 1.10 by the end of 2020," experts added. The material has been provided by InstaForex Company - www.instaforex.com |
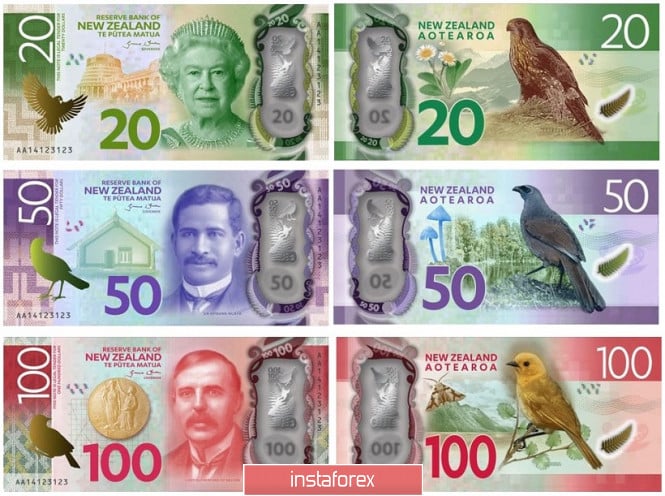
| NZD/USD. The August meeting of the RBNZ Posted: 11 Aug 2020 05:21 AM PDT Tomorrow, the August meeting of the Reserve Bank of New Zealand will be held, which will determine the fate of the Central Bank's monetary policy. However, according to most experts, the RBNZ will not present any surprises – the meeting will be "passing", without any sensations. However, NZD/USD traders are unlikely to ignore tomorrow's event. Now the pair is in a positional struggle for the 66th figure: bears are trying to pull the price to the support level of 0.6540 (the lower line of the Bollinger Bands indicator on the daily chart), while bulls are resisting, counterattacking bearish positions. Buyers need to stay within the 66th figure, and to do this, they need to gain a foothold above the mark of 0.6620 (the average line of the Bollinger Bands on the same timeframe). At the moment, the pair follows mainly the US currency, which also cannot determine the vector of its movement. But tomorrow's meeting of the RBNZ may become a determining factor for traders, at least in the medium term. And although the pendulum may swing in any direction, in my opinion, the New Zealand Central Bank will de facto be on the side of the "kiwi".
First of all, it should be noted that New Zealand is one of the first countries in the world to defeat the coronavirus. Last weekend, the country's Prime Minister, Jacinda Ardern, marked one hundred days without identifying new "non-exported" cases of infection inside the country. And although from a formal point of view, it is impossible to talk about the complete and unconditional surrender of the disease (there are still infected people in the country). At the moment, their number is equal to two dozen: 22 cases per 5 million people in the country. It is not surprising that the head of the WHO yesterday advised the world to follow the example of New Zealand in the fight against coronavirus – according to him, New Zealanders were able to stop the virus at an early stage of spread thanks to effective and, most importantly, timely quarantine measures taken. This allowed Wellington to restart the economy "ahead of schedule" – much earlier than many countries in the world. In other words, the process of restoring key macroeconomic indicators started earlier, and by and large only the general slowdown in the global economy serves as an anchor for the New Zealand economy. New Zealand's main macroeconomic indicators have recently come out either in line with forecasts or better than expected. And here it is worth noting that many of them have lost their relevance, as they reflected the situation at the peak of the epidemic (in the second quarter). For example, traders were quite calm about the decline in inflation – in quarterly terms, the consumer price index fell into negative territory for the first time since 2016. In annual terms, a negative but predictable dynamic was also recorded – with the CPI expected to fall to 1.5%. And this decline is not supernatural: since 2017, New Zealand inflation has been hovering in the range of 1.3%-1.9%, so the current decline is quite acceptable. Moreover, the RBNZ's inflation expectations for the third quarter, published in July, rose from 1.2% to 1.45%. A similar situation has developed in the labor market: according to the latest data, the unemployment rate in New Zealand has fallen to 4.0%. This figure has been hovering in the range of 4.0%-4.3% since the second quarter of 2018, so we can say that the coronavirus crisis has not left its imprint here. Given all of the above, we can assume that tomorrow's meeting of the RBNZ will not be radically different from the previous one, which was held in June. Then Orr said that the rate can only be revised downward, while the Central Bank does not plan to tighten monetary policy for at least the next 12 months. He also did not rule out further expansion of QE "if necessary". At the same time, the head of the Central Bank said that it will regularly review the asset purchase program. He also repeated the standard phrase that the Central Bank is ready to use "additional monetary policy tools".
In June, Adrian Orr did not focus on positive trends in the country's economy. And most likely, it will not do this in August. For quite an understandable reason: the head of the Central Bank is not satisfied with the current exchange rate of the New Zealand dollar. In one of his interviews, he noted that the growth of the NZD/USD exchange rate has put additional pressure on export earnings, while the balance of risks for the economy remains downward. It is worth recalling that since May this year, the New Zealand dollar has strengthened against the US currency by almost 700 points. Thus, the Reserve Bank of New Zealand is likely to repeat the main points of its June meeting tomorrow. Some of the experts assume that the regulator will expand the program for buying government bonds to 90 billion New Zealand dollars (at the moment, it is 60 billion) following the results of tomorrow's meeting. But in my opinion, the Central Bank only announces such steps, while implementing them only in September. The RBNZ's wait-and-see attitude, even without "enthusiastically optimistic" comments, will support the New Zealand dollar. This will allow buyers of NZD/USD not only to gain a foothold above the resistance level of 0.6620, but also to approach the key resistance level of 0.6700 (this is the upper line of the Bollinger Bands indicator on the daily chart). Therefore, longs can be considered either from the current position, or based on the results of tomorrow's meeting of the regulator's members. The material has been provided by InstaForex Company - www.instaforex.com |
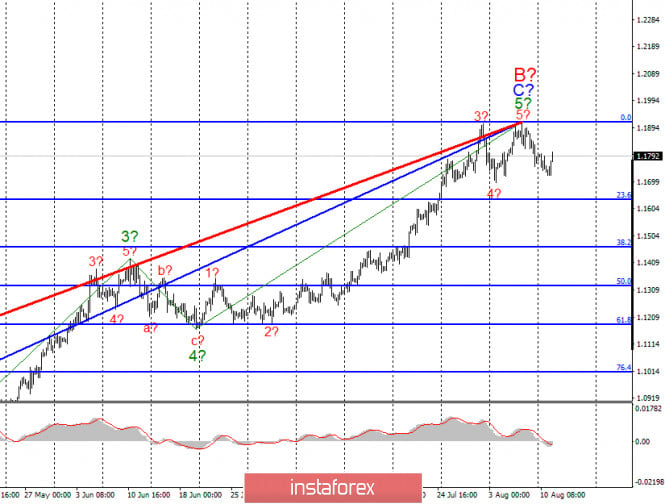
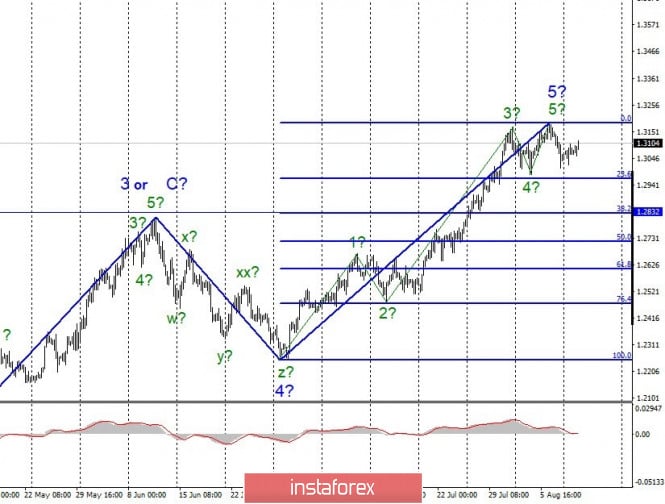
| Posted: 11 Aug 2020 05:18 AM PDT EUR / USD On August 10, the EUR/USD pair lost about 50 pips and thus, it continued to build the assumed first wave as part of a new downward trend section. If this assumption is correct (and the wave structure of the ascending part of the trend looks fully completed), then the decline in quotes will continue in the near future with the first targets located near the level of 23.6% and 38.2% Fibonacci. On the other hand, a successful attempt to break the 0.0% Fibonacci level will indicate the complication of the upward trend. Fundamental component: On Monday, August 10, the markets continued to relax in some way. At the beginning of the new week, there was practically no economic information either in America or in Europe. Thus, the markets had nothing to consider. Today, two indices of the ZEW Institute were released in Germany, which showed that the current assessment of economic conditions in the country with the strongest economy in the European Union remains extremely low. The report showed -81.3 in August, although it was -68.8 back in July. That is, the mood of investors is deteriorating. Perhaps, due to the high probability of a new wave of pandemic in the European Union or for other reasons. But in the future, which month in a row investors are looking with optimism, the corresponding report showed a value of 71.5, which is higher than the previous month and the forecast. In the European Union, investors also expect a bright future, as the economic sentiment index rose to 64. Demand for the European currency rose in the first half of the day, which may be partly due to these indices, although they are not considered important. Meanwhile, during another briefing by Donald Trump near the White House, an unknown person opened fire with a pistol. It is not known exactly where this man was shooting and what his intentions were (he was hardly going to inflict damage on the president through the walls of the White House), but the president's press conference was interrupted. A little later it became known that the shooter was wounded, detained and taken to the hospital, but details of the incident are being investigated. General conclusions and recommendations: The euro/dollar pair has supposedly completed the construction of the upward wave C in B. Thus, at this time, I do not recommend new purchases of the instrument, but I recommend closing the old ones. I also recommend starting to look closely at sales with the first targets located around the estimated 1.1634 and 1.1465, which equates to 23.6% and 38.2% Fibonacci. GBP / USD On August 10, the GBP/USD pair gained about 15 pips. However, an unsuccessful attempt to break through the 127.2% Fibonacci mark still indicates the completion of the upward trend section. Interestingly, both major instruments of the currency market have supposedly completed the formation of an upward set of waves. Thus, despite the small deviation of quotes from the previously reached maximums, the probability of further decline is high. Fundamental component: In the UK, unemployment and wage figures have become known today. It turned out that unemployment remained unchanged at 3.9% in June, although market expectations were 4.2%. On the other hand, the number of applications for unemployment benefits increased by 94.4 thousand in July, although the markets were waiting for no more than 10 thousand. The average wage in the UK declined by 1.2% in June. Thus, in general, the package of statistics is quite contradictory, but still, the most important indicator of unemployment pleased us. Thanks to it, demand for the pound has grown. General conclusions and recommendations: The pound/dollar pair is expected to have completed an upward wave 5 around 1.3183. Therefore, at this time, I recommend to close all purchases at least until a successful attempt to break through the 127.2% Fibonacci level and tune in to a possible long-term decline in quotes within a new downward trend section with the first targets located around 1.2832 and 1.2719. which equates to 38.2% and 50.0% Fibonacci. The material has been provided by InstaForex Company - www.instaforex.com |
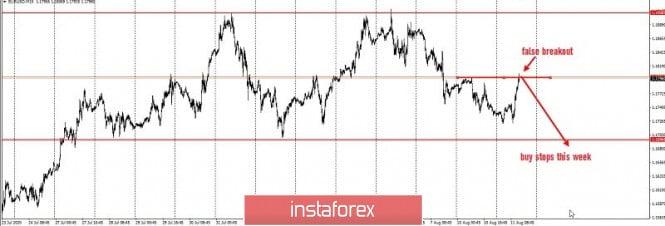
| False breakout on the EUR/USD pair Posted: 11 Aug 2020 04:45 AM PDT Good afternoon traders! A trading idea for the EUR / USD pair. Today, the EUR / USD pair pulled back below the round level of 1.18, breaking through yesterday's high. To decrease the price of the pair, following the scheme presented below: The market is currently trading in the area of Friday's volumes. Because of this, short positions are the most relevant, and doing it now is the most profitable option. Thus, trade sell positions until the quote reaches a price level of 1.18500, and take profit when it breaks out of 1.17000. Such an idea is based on the framework of Price Action and Stop Hunting strategies. Good luck! The material has been provided by InstaForex Company - www.instaforex.com |
| Posted: 11 Aug 2020 04:37 AM PDT Further Development
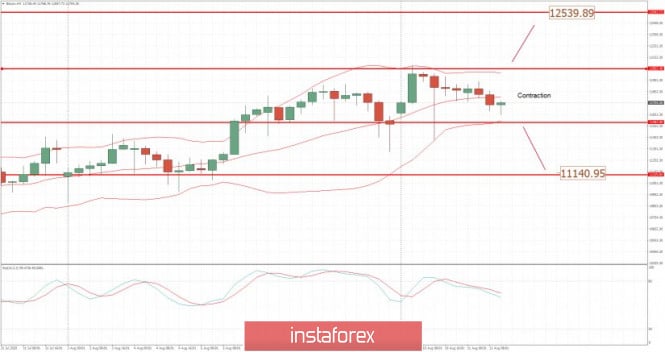
Analyzing the current trading chart, I found that the BTC is in contraction and sideways mode between the resistance at $12,050 and support at the price of $11,580. I would watch for the breakout of support or resistance to confirm further direction. The upside breakout of resistance at $12,050 can lead us to test $12,500 The downside breakout of the support at $11,582 can lead us to the test of $11,150 Key Lvels: Pivot support: $11,580 Resistance level: $12,050 The material has been provided by InstaForex Company - www.instaforex.com |
| Posted: 11 Aug 2020 04:29 AM PDT Putin says that his daughter has been vaccinated from the coronavirusSays that Russian health ministry has approved coronavirus vaccine developed by Moscow's Gamaleya Institute
Take what you will and believe what you want from the headlines above, but this may lay the groundwork for other countries to start prepping their own "breakthroughs" sooner rather than later. As with everything related to the pandemic thus far, all it takes is for one country to set a precedent and the others will take that as an opportunity to follow.
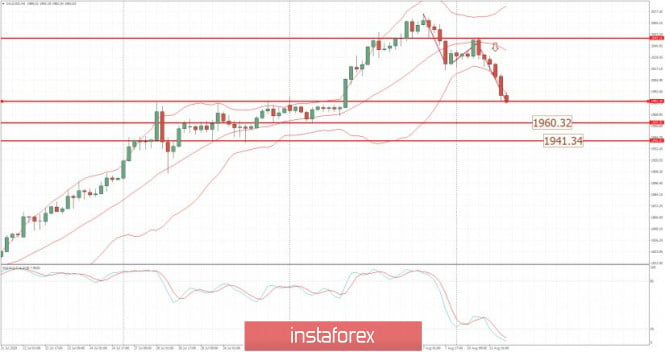
As I discussed in the previous review, the Goldmanaged to drop as I expected in my previous anlaysis. The level at $1,980 seems like solid support and it will serve like very important pivot. Further Development
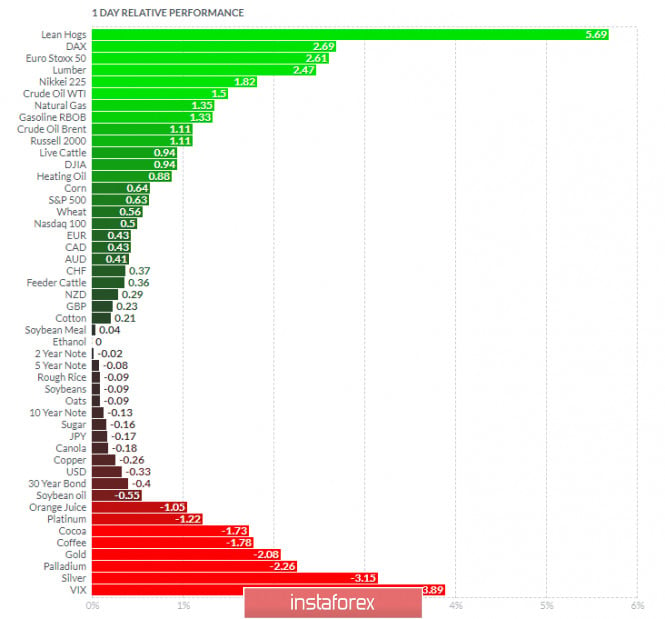
Analyzing the current trading chart, I found that the sellers are in total control but that Gold might be temporal exhausted at $1,980. Anyway, I see no big divergences yet and I see potential for even more downside towards the $1,960 and $1,940. Selling opportunities will be preferable on the rallies.... 1-Day relative strength performance Finviz:
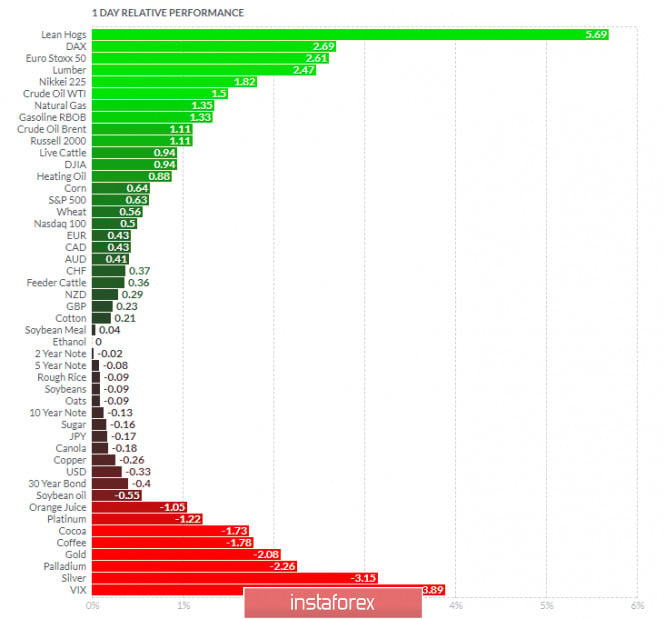
Based on the graph above I found that on the top of the list we got Lean Hogs and DAX today and on the bottom VIX and Silver. Gold is showing very weak relative strength and it is on the bottom of the list from all markets, which is another indication for the strong downside pressure... Key Levels: Resistance level: $2,015 The material has been provided by InstaForex Company - www.instaforex.com |
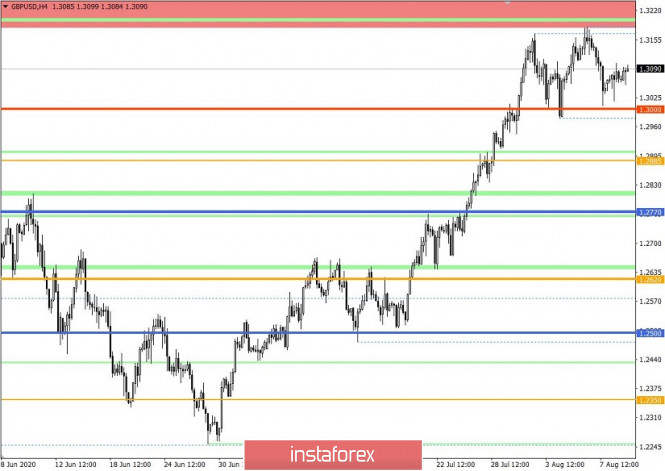
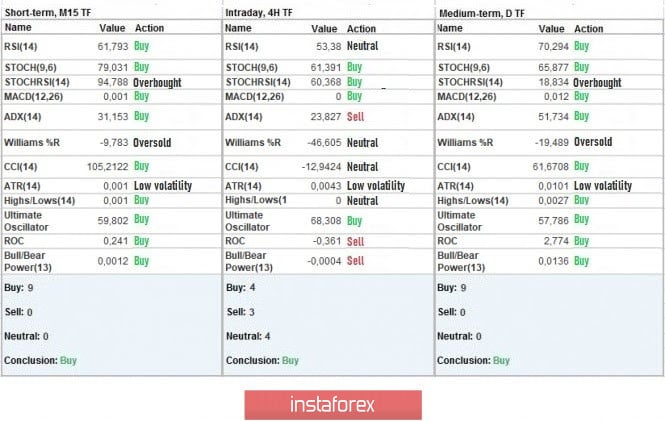
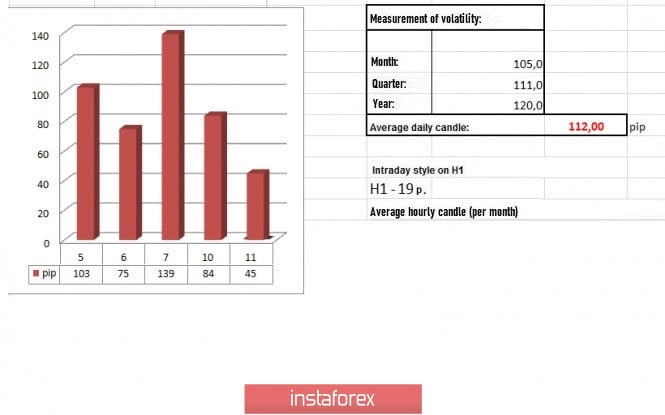
| Trading recommendations for the GBP/USD pair on August 11 Posted: 11 Aug 2020 04:28 AM PDT The GBP / USD pair once again consolidated in the area of the psychological level of 1.3000, where the quote immediately formed a pullback, after which it completely got stuck on the levels 1.3060 / 1.3100. The movement of the pound had many ticks that intersect in time frames and analysis. The foundation of the whole process is the inertial move from July 20, which led to a change in price ranges 1.2150 // 1.2350 // 1.2620 ---> 1, 2770 // 1.3000 // 1.3300. It was due to this movement that the pound found itself in a difficult situation, where long positions were so overheated that a slowdown occurred, which led to a fluctuation within the levels 1.3000 / 1.3185. This fluctuation is the same as what was observed in the beginning of the year (January-February), where the interaction of trade forces led to a reduction in the volume of long positions, which, in turn, stopped the movement. Thus, based on the graphical analysis, the fluctuation at 1.3000 / 1.3185 signals a market reversal, starting from the "Double Top" in the four-hour TF. A similar model can be seen on the EUR / USD pair, with which the situation with overheating of long positions is very much the same. However, the model is quite unstable, so the pattern could evolve into a "Triple Top" instead, which is considered the most stable in terms of development in the market. Meanwhile, in terms of daily dynamics, a 25% deceleration of volatility relative to the average level of 112 ---> 84 points is recorded, which suggests that activity in the hourly periods are highly speculative. Hence, if we analyze the past trading day by minutes, we can see that speculative jumps occurred at 10: 30-14: 30, where a V-shaped pattern appeared, after which activity subsided, forming a looped fluctuation at 1.3060 / 1.3100. This is because as discussed in the previous review , traders worked on a consolidation at the price level of 1.3000, with a subsequent rebound after it. So, analyzing the trading chart in general terms (daily period), we will see that there was no correction nor a rollback, and the candlestick structure has many Doji formations, which signals ambiguity and readiness for a future surge in activity. The news published yesterday included data on JOLTS, which, instead of a reduction in vacancies, a growth from 5,371,000 to 5,889,000 was observed. This surprising situation supported the US dollar to rise in the market. Meanwhile in the UK, British Prime Minister Boris Johnson issued a statement about the opening of schools in September. According to him, "Closing our schools for longer than absolutely necessary is socially unacceptable, economically unsustainable and morally unjustified. Students must return to school in early September, a national priority for the country. Schools will be the last places to be closed in case of future local quarantines. " Thus, Britain is again imposing the strict use of masks, as the situation with COVID-19 in the country has not yet been taken under full control. Today, data on the UK labor market will come out, in which the unemployment rate is expected to be 3.9%, the same level it has for the third month in a row. However, there are questions about the reliability of the information provided by the office of national statistics. Further development Analyzing the current trading chart, we can see that the price continues to fluctuate, within the levels 1.3060 / 1.3100. Local bursts of activity were recorded in these areas, but a clear breakout has not yet been observed. Thus, the best strategy is to break out from the established boundaries, in which the quote will form a "Triple Top", or reach and breakout of the psychological level of 1.3000. So, based on the above information, we present these display trading recommendations: - Sell positions below the level of 1.3060, targeting a drop to the price levels 1.3020-1.3000. The main move will occur, after the quote consolidates below 1.2950. - Buy positions above the level of 1.3110, targeting a rise to the price levels 1.3145-1.3180. Indicator analysis Analyzing the different sectors of time frames (TF), we can see that the indicators of technical instruments on the minute and hourly periods currently signal "buy", but it may change soon due to the price fluctuation within the price range 1.3060 / 1.3100. Meanwhile the daily period, as before, signals "buy" due to the general trend, but if the price falls below the level of 1.2950, this may change as well. Weekly volatility / Volatility measurement: Month; Quarter; Year The measurement of volatility reflects the average daily fluctuation, calculated per Month / Quarter / Year. (August 11's was built, taking into account the time this article is published) Volatility is currently 45 points, which is 59% below the average daily value. It may increase though, as soon as the quote breaks out of the range 1.3060 / 1.3100. Key levels Resistance zones: 1.3200 (1.3250) **; 1.3300 **; 1.3600; 1.3850; 1.4000 ***; 1.4350 **. Support Zones: 1.3000; 1.2885 *; 1.2770 **; 1.2620; 1.2500; 1.2350 **; 1.2250; 1.2150 **; 1.2000 *** (1.1957); 1.1850; 1.1660; 1.1450 (1.1411); 1.1300; 1.1000; 1.0800; 1.0500; 1.0000. * Periodic level ** Range level *** Psychological level Also check the brief trading recommendations for the EUR / USD and GBP / USD pairs here . The material has been provided by InstaForex Company - www.instaforex.com |
| Posted: 11 Aug 2020 04:14 AM PDT Prior 100.6 Small business optimism fell last month amid the spike in virus cases across the country, as that tempered with hopes for a quicker economic recovery, according to NFIB. The details highlight five of the ten sub-indexes in the survey fell, with the uncertainty index rising from 81 in June to 88 in July. Sales expectations over the next three months also fell by 8 points to a net 5% last month.
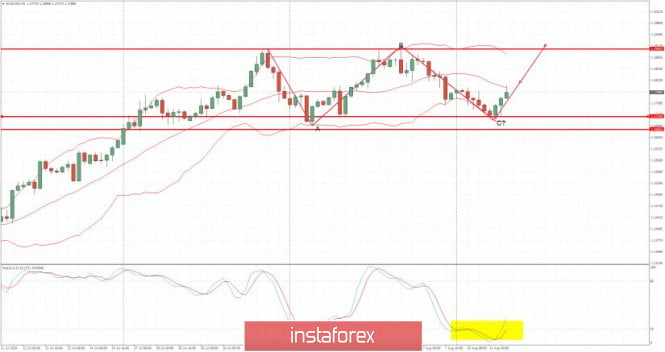
As I discussed in the previous review, the EUR managed to complete the downside ABC correction and start the upside swing. The level at 1,1720 worked like strong support and I see further upside movement towards the 1,910 Further Development
Analyzing the current trading chart, I found that the buyers are in total control and that we got outside day relative to yesterday's range, which is good indication for the further upside continuation. Watch for buying opportunities on the dips... 1-Day relative strength performance Finviz
Based on the graph above I found that on the top of the list we got Lean Hogs and DAX today and on the bottom VIX and Silver. Key Levels: Support: 1,1720 The material has been provided by InstaForex Company - www.instaforex.com |
| EUR/USD Attracting More Buyers! Posted: 11 Aug 2020 03:56 AM PDT
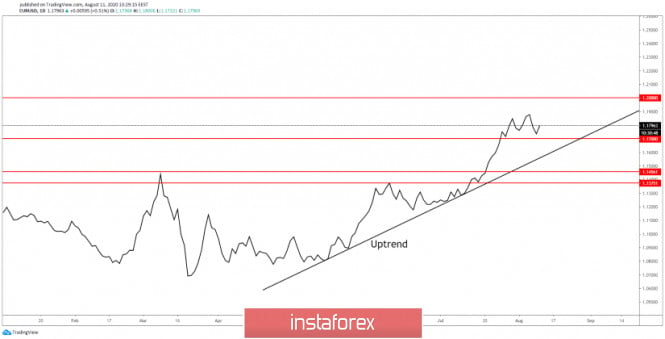
EUR/USD has decreased a little after the impressive growth, now is moving somehow sideways, but the outlook is still bullish, the uptrend is still intact, so the pair could resume its upwards movement. The upside could continue as long as EUR/USD is traded, located, above the uptrend line. Only a drop below the uptrend line will invalidate further growth and will bring a selling opportunity.
Buy EUR/USD if the price jumps above the previous high, let's say from 1.1915 level, the next upside target is seen at the 1.2000 psychological level. Right now we cannot talk about a selling opportunity as long as the rate is located above the uptrend line. The material has been provided by InstaForex Company - www.instaforex.com |
| Partial recovery of oil demand raises oil prices Posted: 11 Aug 2020 03:37 AM PDT
Crude oil manages to rise again this morning, mainly due to the partial recovery of demand for oil. The head of Saudi Aramco issued a statement saying that demand in some markets have become stable, which could not but please investors. In addition, market participants continue to focus on the creation of new stimulus measures in the United States. Yesterday, news came out that demand for gasoline and diesel recovered almost to pre-crisis levels in China. It is now at around 90 million barrels per day, and in the near future, may reach 95–96 million barrels per day. Particularly positive analysts believe that this would happen by the end of this year. At the same time, the US government expresses sincere hope that the issue surrounding the creation of a new stimulus measure will be finalized soon. Hence, Treasury Secretary Steven Mnuchin issued a statement, which, among other things, called on Democrats and Republicans to quickly end their disputes and come to a consensus by the end of this week. Of course, if this happens, oil will receive additional incentives to rise in the market. Meanwhile, with regards to the epidemiological situation of the world, the latest data reveals that the daily growth rate of coronavirus infections over the past three days has significantly decreased. By Sunday morning last week, it reached 224 thousand, which may signal the gradual retreat of the pandemic. In particular, the number of new cases in the United States have decreased sharply, with which last Sunday, it did not exceed 50 thousand for the first time. These data enabled Brent futures for October delivery to rise this morning on the London trading floor, increasing by about 0.49%, or $ 0.22, moving it to a price level of $ 45.21 per barrel. It was able to step over the new strategically and psychologically important level of $ 45 per barrel, and may possibly jump further in the near future. As for WTI futures for September delivery, price also rushed up at the New York trading floor this morning, increasing about 0.76%, or $ 0.32 per barrel and reaching a price level of $ 42.26 per barrel. Growth was rapid, at about 1.8%, or $ 0.72, with which the closing price consolidated around $ 41.94 per barrel. Such a rise in the market is, of course, very significant. Losses have been won back, but unfortunately, there is still one more factor that may negatively affect the price of oil. This is the ongoing escalation of conflict between the US and China. Just yesterday, the Chinese authorities have retaliated against American officials, the reason for which was the sanctions imposed by US President Trump on some high-ranking officials in Hong Kong and China. So far, the situation looks sluggish and does not turn into an aggravated stage, but even this can upset the balance in the raw materials market. Now, investors are also waiting for a new publication on the level of oil reserves in the United States. The data will be released tomorrow, but today there are no big risks for the market, so, most likely, growth will continue until the end of the day. The material has been provided by InstaForex Company - www.instaforex.com |
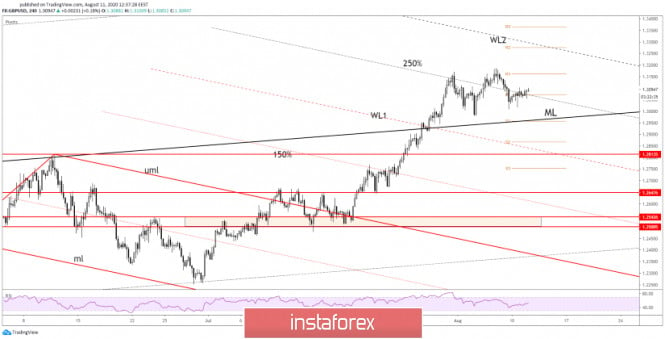
| GBP/USD Downside was compromised! Posted: 11 Aug 2020 03:19 AM PDT GBP/USD is trading in range in the short term and maintains a bullish outlook after the failure to make another lower low. Technically, the quote is still present in the buyer's territory, so we could search for long opportunities. The currency pair has decreased a little only because the USDX has managed to rebound, but you should know that the index could is under pressure and it could drop anytime if it fails to make another higher high.
GBP/USD has failed to come back to retest the median line (ML) of the major ascending pitchfork signaling some strong buyers. It has managed to come back above the 250% Fibonacci line and above the Pivot Point (1.3072) level, so bullish momentum is favored as long as the price is located above these levels.
Buy a valid breakout above the R1 (1.3162), the next upside target is at the second warning line (WL2) and at the R2 (1.3275) level. Sell a potential drop below the 1.3000 psychological level. Another lower low will signal a drop way below the median line (ML) of the ascending pitchfork. The material has been provided by InstaForex Company - www.instaforex.com |
| Bitcoin has risen in price by 220%, now what's next? Posted: 11 Aug 2020 03:16 AM PDT The last month of summer turned out to be hot for the main cryptocurrency: it broke another record, soaring by 220% in the current five months. Experts fear that price swings of an incredible scale can lead to an imbalance of the BTC/USD pair. The price expansion of the leading cryptocurrency is striking: it almost reached the bottom in March this year, dropping to $ 3,800, and exceeded twice the psychologically important threshold of $ 12,000 already in August. However, BTC could not hold on to this top and surrendered its positions at the beginning of this week. On Tuesday, August 11, Bitcoin is trading in the $ 11,690- $ 11,700 range, aiming to go beyond that range. The crypto market is watching the dynamics of the leading digital asset with anticipating breath. Experts of Binance Research explain the sharp rise of the cryptocurrency for a number of reasons, including a significant increase in transactions. Note that at the end of July, there was a sudden and significant (by 50% of the usual) excess of the volume of deposits and withdrawals on crypto exchanges. Analysts believe that the next reason for the rise in price of the first cryptocurrency is a noticeable influx of DeFi investors into the PTS. At the moment, experts believe that the popularity of the industry of decentralized means of payment is at its peak. Binance Research experts consider the general positive mood in the crypto market as the third factor explaining the growth of the leading virtual asset. The optimism was added by statements by the heads of large banks in the United States regarding the provision of depository services for digital currencies. An additional positive factor was the perception of bitcoin as a possible defensive asset. It can be recalled that such moods strengthened during the COVID-19 pandemic, and now they continue amid fears about a depreciation of the USD and a reduction in real rates. According to preliminary estimates, the main cryptocurrency has soared by 70% since the beginning of this year. Experts from Trading View Inc. believe that at present, the PTS has "caught a wave" and moved into an upward spiral. Experts consider the level of support for bitcoin at $11770. According to the forecasts of Trading View Inc., the leading virtual currency can test the level of $12400 in the coming days, rewriting the annual maximum. If the situation worsens, profit-taking is not excluded, after which the sun will decline to $10700. Most analysts are optimistic about the near term prospects for Bitcoin. Some of them expect the leading asset to rise to $ 14,000, but other predictions look less plausible. For example, Dan Morehead, the head of Pantera Capital, does not rule out its explosive growth - up to $ 115,000 by August 2021. This assumption is based on observations of the MTS course after two previous halvings. It should be noted that after them, the price of the virtual asset continued to grow by inertia for 440 days after the miners' reward was cut. However, other forecasts based on the dynamics of bitcoin in relation to the US currency are considered more realistic. It can be recalled that the key digital asset is becoming more expensive in relation to USD in impulses, the size of which ranges from $ 1500 to $ 2500. Currently, BTC buyers are targeting the $ 13,200 mark with the possibility of breaking the $ 14,600 barrier. According to experts, bitcoin has a large room for growth, but it is moving towards its goal in small steps. Passing level after level, the main digital asset overcomes new barriers to conquer new heights. Nevertheless, cryptocurrency market experts are confident in its victory in the medium and long term. The material has been provided by InstaForex Company - www.instaforex.com |
| Trader's diary on 08/11/2020. EURUSD Posted: 11 Aug 2020 03:07 AM PDT
EUR/USD: The pullback seems to be almost completed. We are ready to buy from the level of 1.1805. In case of a downward reversal, we can consider selling from the level of 1.1720. The material has been provided by InstaForex Company - www.instaforex.com |
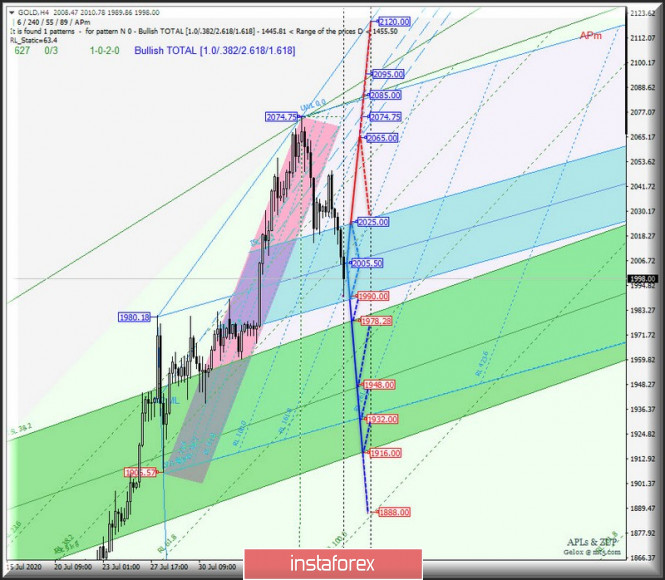
| Comprehensive analysis of movement options for Gold & Silver (H4) on August 11, 2020 Posted: 11 Aug 2020 03:05 AM PDT Minute operational scale (H4) Is the dollar winning the battle with metals? Review of options for the movement of Gold & Silver since August 11, 2020. ____________________ Spot Gold The development of the Spot Gold movement from August 11, 2020 will depend on the development and direction of the breakdown of the boundaries of the equilibrium zone (2025.00 - 2005.50 - 1990.00) of the Minuette operational scale fork - the movement markings inside this equilibrium zone are shown on the animated chart. A breakout of the lower border ISL61.8 equilibrium zone of the Minuette operational scale fork - support level of 1990.00 - will make it relevant for Spot Gold to reach the equilibrium zone boundaries (1978.28 - 1948.00 - 1916.00) of the Minute operational scale fork. In case of a breakdown of the top border ISL38.2 equilibrium zone of the Minuette operational scale fork - resistance level of 2025.00 - upward movement of Spot Gold can be resumed to the borders of the channel 1/2 Median Line Minuette (2065.00 - 2074.75 - 2085.00). Details of the Spot Gold movement since August 11, 2020 can be seen on the animated chart.
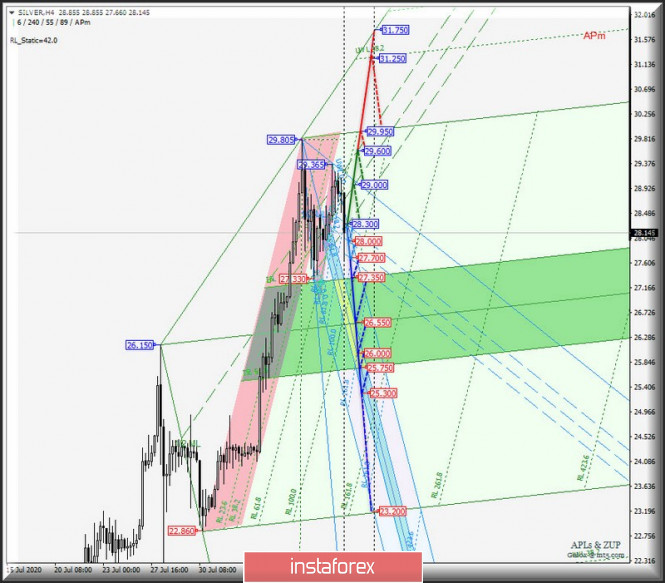
____________________ Spot Silver The development of the Spot Silver movement from August 11, 2020 will be due to the development and direction of the breakdown of the boundaries of the 1/2 Median Line channel (28.300 - 28.000 - 27.700) of the Minuette operational scale fork - details of movement inside this channel are shown on the animated graph. A breakdown of the support level of 27.700 at the lower boundary of the 1/2 Median Line Minuette channel will make it possible for Spot Silver to reach the boundaries of the equilibrium zones of the operational scale forks - Minute (27.350 - 26.550 - 25.750) and Minuette (26.550 - 26.000 - 25.300). In case of a breakdown of the resistance level of 24.750 at the upper border of ISL38.2 of the equilibrium zone of the Minute operational scale fork, the upward movement of Spot Silver can be continued to the borders of the 1/2 Median Line Minute channel (25.150 - 25.550 - 26.010) with the prospect of a maximum update of 26.150. Details of the Spot Silver movement options from August 11, 2020 are shown in the animated chart.
____________________ The review is compiled without taking into account the news background, the opening of trading sessions of the main financial centers and is not a guide to action (placing "sell" or "buy" orders). The material has been provided by InstaForex Company - www.instaforex.com |
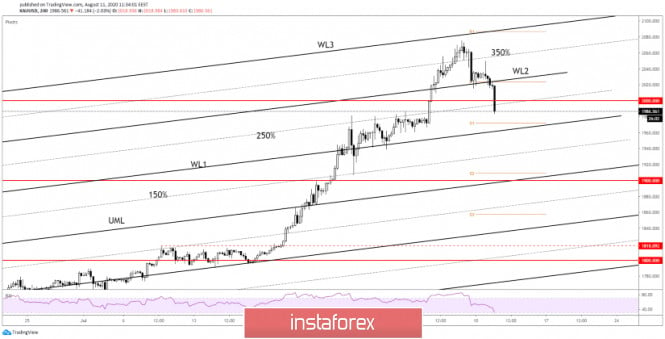
| GOLD Accelerating Its Sell-Off! Posted: 11 Aug 2020 02:30 AM PDT XAU/USD is trading at $1,986 level and it seems very heavy in the short term. It has dropped like a rock in the last hours violating strong downside obstacles. The gold price is into a corrective phase right now, the current retreat was somehow expected after the impressive rally. The USD's temporary rebound has brought sellers on the yellow metal. However, it's hard to believe that we may have a major drop, a false breakdown below the near-term support levels will confirm the end of this retreat.
The failure to retest the 350% Fibonacci line has signaled strong sellers in the short term. The price has accelerated its drop after closing below the Pivot Point ($2,023) level and below the second warning line (WL2). Gold is trading below the 250% Fibonacci line, the near-term support levels are seen at the S1 ($1,972) and at the second warning line (WL1). The yellow metal has slipped below $2,000 psychological level, but a strong increase till the end of the day could invalidate the breakdown.
You can sell during a consolidation below $2,000 level, or several retests, false breakouts with great separation above this level. The next downside targets are seen at S1 ($1,972) and at the first warning line (WL1). A valid breakdown below these levels will confirm a broader drop. A false breakdown below the $2,000 level and consolidation above this level could bring another long opportunity. The material has been provided by InstaForex Company - www.instaforex.com |
| You are subscribed to email updates from Forex analysis review. To stop receiving these emails, you may unsubscribe now. | Email delivery powered by Google |
| Google, 1600 Amphitheatre Parkway, Mountain View, CA 94043, United States | |












No comments:
Post a Comment