
Forex analysis review |
- Daily Video Analysis: AUDUSD High Probability Setup
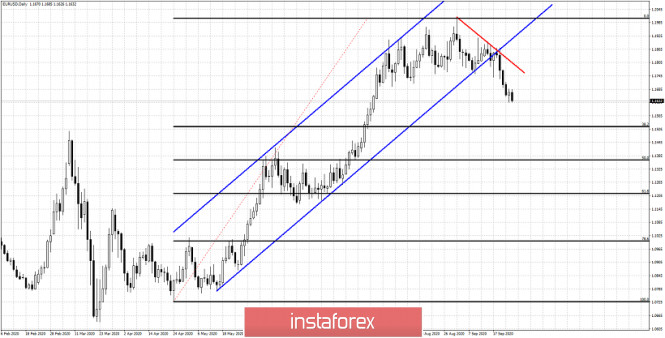
- EURUSD broke above descending trendline resistance, further rise expected!
- USDCAD to retest 1st resistance, potential for further drop!
- CADJPY is facing bearish pressure, potential for further drop!
- COVID-19 poses another grave threat to stock markets
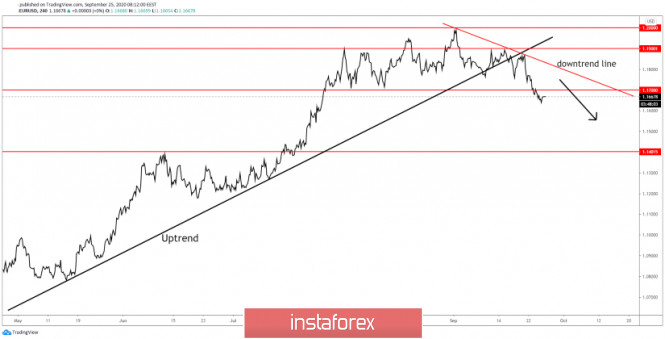
- EURUSD at its weekly lows
- September 25, 2020 : GBP/USD Intraday technical analysis and trade recommendations.
- Gold is trading inside a bearish channel
- September 25, 2020 : EUR/USD Intraday technical analysis and trade recommendations.
- USDCAD remains strong near weekly highs
- BTC analysis for September 25,.2020 - Watch for selling opportunities on the rallies with the target at $10.145
- September 25, 2020 : EUR/USD daily technical review and trade recommendations.
- EUR/USD. September 25. Traders are waiting for an agreement between Democrats and Republicans on a new package of financial
- GBP/USD. September 25. COT report. A new anti-record for morbidity in the UK has been set.
- GOLD May Extend Its Fall
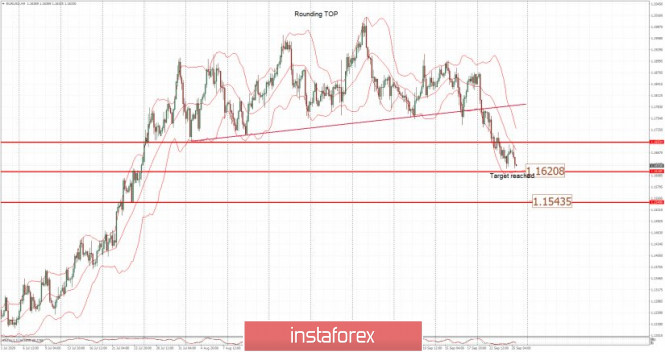
- EUR/USD analysis for September 25 2020 - Sellers stil in control with potential for the test of 1.1545
- USD/CAD Rally Stopped By Dynamic Resistance!
- EUR/USD Downside Prevails
- Analysis of GBP/USD for September 25, 2020
- EUR/USD analysis on September 25. Donald Trump got jeered on by the crowd while visiting the funeral of Judge Ruth Ginsburg
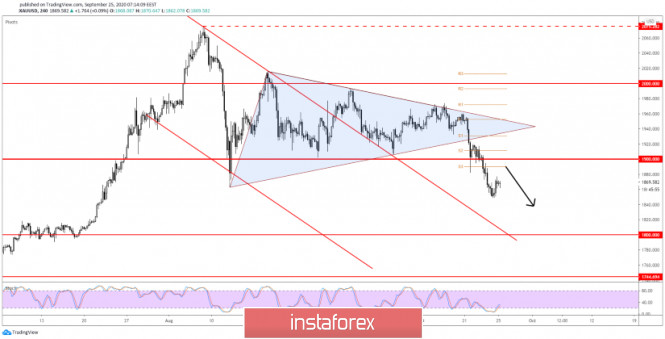
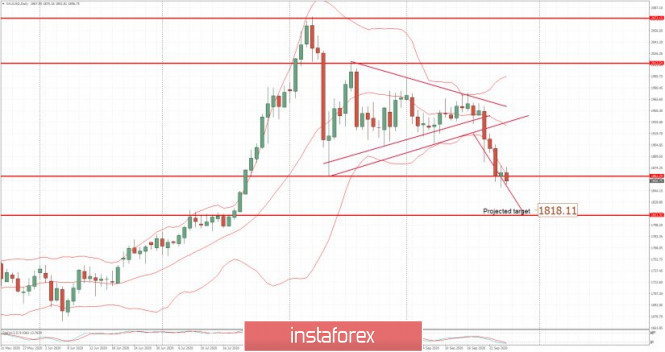
- Analysis of Gold for September 25,.2020 - Projected downside target of the broken symmetrical triangle is set at $1.818
- GBP/USD: Plan for American session on September 25 (overview of morning trade). Pound bulls fail to assert themselves. Bears
- EUR/USD: US dollar is not in a rush to dismiss doubts, leaving the euro under pressure
- US oil producers do not care about future
- EUR/USD: plan for the American session on September 25
| Daily Video Analysis: AUDUSD High Probability Setup Posted: 25 Sep 2020 08:02 AM PDT Today we take a look at AUDUSD. Combining advanced technical analysis methods such as Fibonacci confluence, correlation, market structure, oscillators and demand/supply zones, we identify high probability trading setups. The material has been provided by InstaForex Company - www.instaforex.com |
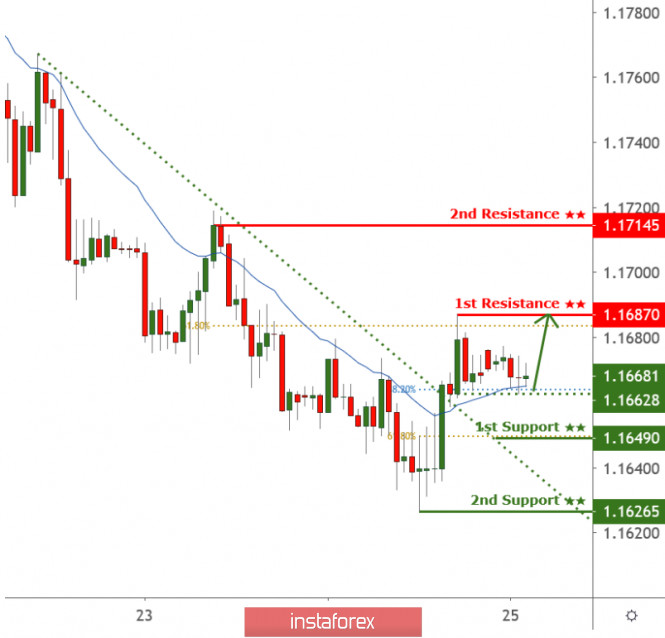
| EURUSD broke above descending trendline resistance, further rise expected! Posted: 25 Sep 2020 08:01 AM PDT
EURUSD broke above descending trendline resistance (now support) and is also holding above moving average as well. A further push up above 1.16628 towards 1st resistance at 1.16870 is expected. Trading Recommendation Entry: 1.16628 Reason for Entry: 38.20% fib retracement, moving average Take Profit : 1.16870 Reason for Take Profit: 61.8% fib retracement Stop Loss: 1.16490 Reason for Stop loss: 61.8% fib retracement, descending trendline support The material has been provided by InstaForex Company - www.instaforex.com |
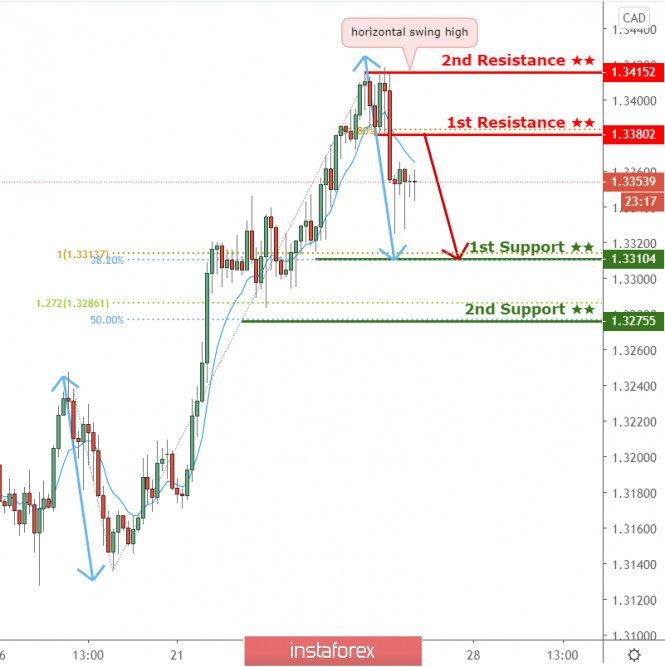
| USDCAD to retest 1st resistance, potential for further drop! Posted: 25 Sep 2020 08:00 AM PDT
USDCAD dropped nicely from our 2nd resistance and might go up to retest the 1st resistance where the 61.8% fib retracement is. Price could reverse from 1st resistance towards 1st support where the 100% fib extension is. EMA is also showing that more bearishness is to come. Trading Recommendation Entry: 1.3380 Reason for Entry: 61.8% fib retracement Take Profit: 1.3310 Reason for Take Profit: 100% fib extension Stop Loss: 1.3415 Reason for Stop Loss: Horizontal swing high The material has been provided by InstaForex Company - www.instaforex.com |
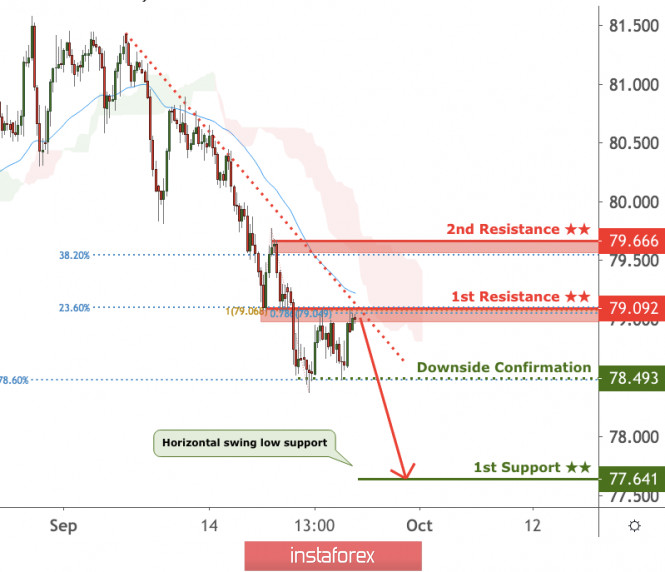
| CADJPY is facing bearish pressure, potential for further drop! Posted: 25 Sep 2020 07:59 AM PDT
Price is facing bearish pressure from our first resistance, in line with our descending trend line, 23.6% fibonacci retracement, 100%, 78.6% fibonacci extension and horizontal pullback resistance where we could see a reversal below this level to our first support level. The 20 period EMA and Ichiomku cloud are showing signs of bearish pressure in line with our bearish bias. Trading Recommendation Entry: 79.092 Reason for Entry: 23.6% fibonacci retracement, 100%, 78.6% fibonacci extension and horizontal pullback resistance Take Profit: 77.641 Reason for Take Profit: Horizontal swing low support Stop Loss: 79.666 Reason for Stop Loss: 38.2% fibonacci retracement, horizontal swing high resistance The material has been provided by InstaForex Company - www.instaforex.com |
| COVID-19 poses another grave threat to stock markets Posted: 25 Sep 2020 07:26 AM PDT
The US stock exchanges showed positive dynamics at the close of the trading day on Thursday, however, the overall session was extremely volatile. During the day, the major stock indexes significantly lost their positions. The Dow Jones sank 1.92%, the S&P 500 fell by 2.37%, and the Nasdaq tanked 3.02%. Serious pressure on the market continues to be inflicted by the US government. The authorities cannot overcome the disagreements on the issue of additional measures to stimulate the economy, which are necessary to overcome the crisis that has arisen against the background of the coronavirus pandemic. In addition, the crisis itself is likely to worsen, as new cases of COVID-19 infection are becoming more and more frequent, and some countries have already begun to introduce repeated restrictive measures to contain the second wave of the pandemic. The deficit in the decision on the new stimulus program has already led to a decline in the level of the country's GDP. According to updated data, growth in the fourth quarter will not be 6%, but 3%. At least it is clear that the remaining payments under the previous program are now being processed, and new ones should not be expected until next year. Statistics on the US labor market was also released on Thursday. The number of new applications for the unemployment benefits last week, which ended September 19, was around 870,000. A week earlier, the level was revised from the announced 860,000 to 866,000. All this went against the initial forecasts which estimated the figure to not go higher than 840,000. Against the background of mistrust in the Fed's new course, which is being expressed more and more, as well as the ineffectiveness of its chosen monetary policy and the lack of budget support, any weak statistical data will lead the market into a state of panic and inevitable reduction of the main indicators. Against the background of distrust of the new rate of the Fed, which is expressed frequently, as well as the inefficiency of its chosen monetary policy and lack of support from the budget, any weak statistics will lead the market to a state of panic and the inevitable reduction of the major stock indexes. Meanwhile, the chairman of the US Federal Reserve has repeatedly stated that budget spending can help to accelerate the achievement of the target result on the unemployment rate and stabilize inflation in the country. The Dow Jones Industrial Average rose 0.2% or 52.31 points, pushing it to 26,815.44 points. The S&P 500 index rose 0.3% or 9.67 points, and its level was within 32,46.59 points. The Nasdaq Composite Index added 0.37% or 39.28 points, which sent it to the level of 10,672.27 points. On the stock exchanges of the Asia-Pacific region today there is also an increase in almost all major areas. The positive here is due to the growth of American indicators, as well as the hope for the introduction of stimulating measures in the United States. The Asian stock exchanges also experienced an increase in almost all major areas. The positive was due to the growth in the major US stock indexes, as well as the hope for the introduction of stimulus measures in the US. Japan's Nikkei 225 Index climbed 0.6%. China's Shanghai Composite Index fell 0.3%. The Hong Kong Hang Seng Index supported this trend and sank 0.2%. South Korea's Kospi Index rose 0.6%. Australia's S & P / ASX 200 Index gained 1.2%. Stock markets in Europe today do not differ in the same dynamics, all changes in the main exchange indicators are of a multidirectional nature. Europe's stocks, on the other hand, traded multidirectional. The general index of large enterprises in the European region Stoxx Europe 600 increased slightly by 0.03%, which forced it to move to the level of 355.96 points. However, this will not be enough to avoid losses for the whole week. Initial data estimated a decline of 3.4%. And then it will be the most negative result since the beginning of this summer. The UK FTSE 100 rose 0.21%. Spain's IBEX 35 Index went up by 0.28%. The German DAX Index fell 0.43%. The French CAC 40 index supported the negative trend with a decline of 0.6%. Italy's FTSE MIB Index dropped 0.34%. Investors fear the recurrence of the situation in spring, when the coronavirus pandemic paralyzed activity in almost all of Europe. In this regard, market participants continue to closely monitor the cases of COVID-19 around the globe and especially in the region. Any sharp dynamics leads them to a panic state. Recall that in some European countries, the growth of coronavirus infection is already quite serious. UK and France, in particular, already warn about the possible introduction of quarantine restrictive measures to contain the second wave of the pandemic. Of course, these measures do not encourage investors to work productively. The material has been provided by InstaForex Company - www.instaforex.com |
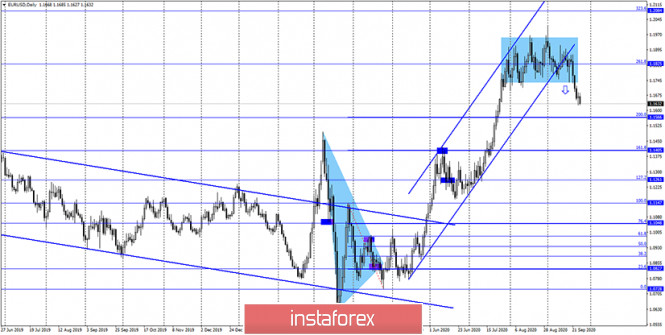
| Posted: 25 Sep 2020 07:23 AM PDT EURUSD is trading every day closer to our first target of 1.16. Price remains in a bearish short-term trend. Confirmation of the bearish signal at 1.1865 came when price broke below 1.1750. Price should continue lower towards the major Fibonacci retracement level.
Red line - resistance Black lines - Fibonacci retracement levels EURUSD continues to make lower lows and lower highs. Price is approaching the important 38% Fibonacci retracement level. I expect price to stop the decline near this retracement level. Resistance is key now at 1.1740 where it was once support. Support is at 1.1515 area where we find the 38% Fibonacci retracement. However I expect price to bounce strongly off 1.16. For now we remain bearish expecting prices to continue lower. The material has been provided by InstaForex Company - www.instaforex.com |
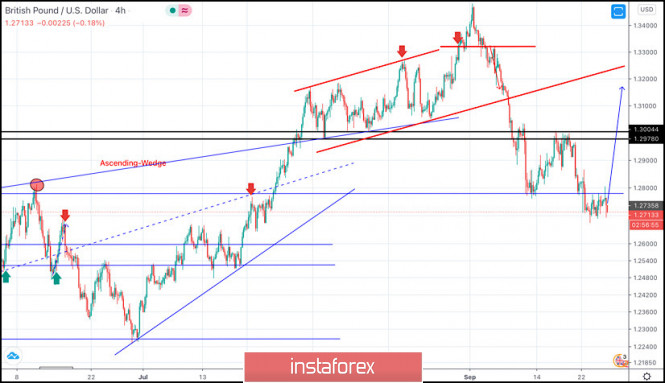
| September 25, 2020 : GBP/USD Intraday technical analysis and trade recommendations. Posted: 25 Sep 2020 07:19 AM PDT
Intermediate-term technical outlook for the GBP/USD pair has remained bullish since bullish persistence was achieved above 1.2780 (Depicted Key-Level) on the H4 Charts. On the other hand, the GBPUSD pair looked overbought after such a quick bullish movement while approaching the price level of 1.3475. That's why, short-term bearish reversal was expected especially after bearish persistence was achieved below the key-level level of 1.3300. A quick bearish decline took place towards 1.2900 then 1.2825 where some bullish recovery was recently expressed. The price zone of 1.3130-1.3150 (the backside of the broken trend) remains an Intraday Key-Zone to offer bearish pressure if retested again. However, the GBPUSD pair has shown lack of sufficient bullish momentum to pursue above the price level of 1.3000. This enabled further bearish decline towards 1.2800 then 1.1700 where another episode of bullish recovery may be executed. Initial bullish breakout above 1.2800 is currently needed to allow bullish pullback to pursue towards 1.3100. Otherwise, further bearish decline would be expected towards the price level of 1.2600. Trade recommendations : Conservative traders are advised to wait for bullish pullback towards 1.3130-1.3150 (the backside of the broken trend) as a valid SELL Entry. Initial T/p level is to be located around 1.3050 and 1.2900 if sufficient bearish pressure is maintained. The material has been provided by InstaForex Company - www.instaforex.com |
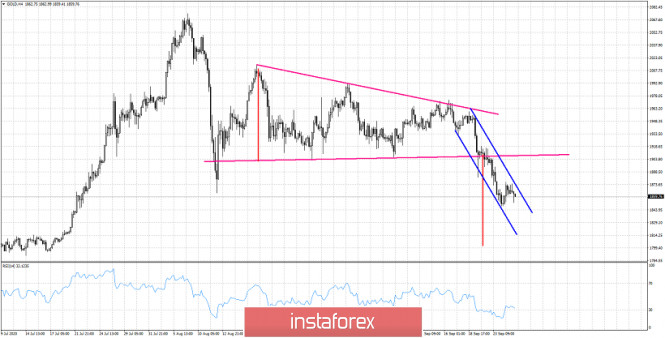
| Gold is trading inside a bearish channel Posted: 25 Sep 2020 07:17 AM PDT Gold price is at its weekly lows and price has now formed a bearish channel. Price remains in a bearish trend making lower lows and lower highs. Gold price target is below $1,850 towards $1,800.
Blue lines - bearish channel Red lines -expected size of downward move Gold price has more room to fall. The base of the triangle is the measured move that Gold price should follow after the triangle breakout. This means that we expect a move towards $1,800. So far price has shown no sign of a reversal. Trend remains bearish. Resistance is at $1,876 and next at $1,905. The material has been provided by InstaForex Company - www.instaforex.com |
| September 25, 2020 : EUR/USD Intraday technical analysis and trade recommendations. Posted: 25 Sep 2020 07:16 AM PDT
The EURUSD pair has failed to maintain enough bearish momentum below 1.1150 (consolidation range lower zone) to enhance further bearish decline. Instead, bullish breakout above 1.1380-1.1400 has lead to a quick bullish spike directly towards 1.1700 which failed to offer sufficient bearish pressure. Bullish persistence above 1.1700-1.1760 favored further bullish advancement towards 1.1975 where some considerable bearish rejection has been demonstrated. The price zone around 1.1975-1.2000 ( upper limit of the technical channel ) stood as a strong SUPPLY-Zone to offer bearish reversal. Conservative traders should have considered the recent bearish closure below 1.1700 - 1.1750 as this enhanced further bearish decline initially towards 1.1645 and probably 1.1600 if sufficient bearish pressure is maintained. Trade recommendations : Conservative traders should wait for any upcoming bullish pullback towards the recently-broken SUPPLY Zone around1.1750 - 1.1770 as a signal for a valid SELL Entry. T/P levels to be located around 1.1645 and 1.1600 while S/L to be placed above 1.1800 to minimize the associated risk. The material has been provided by InstaForex Company - www.instaforex.com |
| USDCAD remains strong near weekly highs Posted: 25 Sep 2020 07:13 AM PDT USDCAD is trading around 1.34. Our bullish targets have been achieved and at the end of the week we find USDCAD near its weekly highs. Short-term trend is bullish but price is now at an important resistance area.
Green rectangle - consolidation area now support USDCAD has reached the upside target and I prefer to lower my bullish exposure as price is at its target area and the RSI is at overbought levels with a minor bearish divergence. There is no reversal signal but next week could start with Dollar weakness. Aggressive traders should look for a reversal from current levels. The RSI bearish divergence is a warning sign and not a reversal sign. Price continues to make higher highs and higher lows. Trend remains bullish. The material has been provided by InstaForex Company - www.instaforex.com |
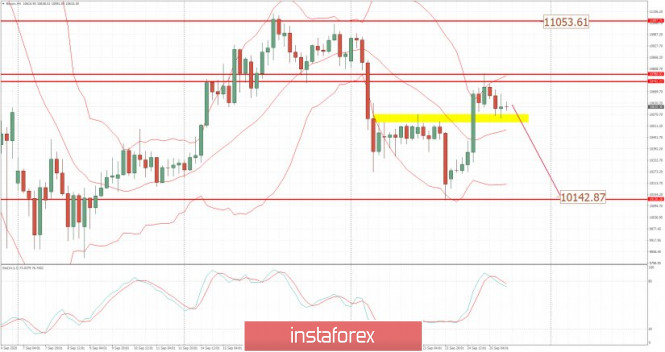
| Posted: 25 Sep 2020 07:00 AM PDT Further Development
Analyzing the current trading chart of BTC, I found that BTC traded again into the key resistance pivot at the price of $10,800 but it found resistance. My advice is still to watch for selling opportunities on the rallies with the target at $10,145. Only in case of the stronger breakout of resistance at $10,800 there is the chance for the test of $11,050, which is also strong resistance pivot. Key Levels: Resistance: $10,800 and $11,050 Support levels and downside target: $10,140 and $9,820 The material has been provided by InstaForex Company - www.instaforex.com |
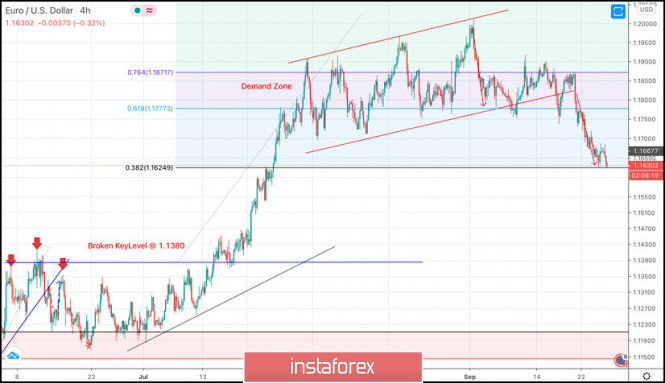
| September 25, 2020 : EUR/USD daily technical review and trade recommendations. Posted: 25 Sep 2020 06:55 AM PDT
The EUR/USD pair has been moving sideways within the depicted expanding channel since August 3. Previously, a temporary resistance level was formed around 1.1900 which prevented further upside movement and forced the pair to have a downside pause for sometime. By the end of August, the EURUSD pair has achieved another breakout above the previously mentioned resistance zone. However, Significant SELLING pressure was applied around 1.2000 where the upper limit of the movement pattern came to meet the pair. That's why, the EUR/USD pair has demonstrated a quick bearish decline towards 1.1800 then 1.1770-1.1750 which failed to offer sufficient Support for the EUR/USD. Earlier This week, a breakout to the downside was executed below the price level of 1.1750 (Lower limit of the depicted movement pattern). Hence intraday technical outlook has turned into bearish. Intraday traders should be waiting for any pullback to the upside towards the recently-broken key-zone (1.1750-1.1770) for a valid SELL Entry Provided that the current price level around 1.1630 prevents any further decline. On the other hand, a breakout above 1.1820 (Exit Level) will probably enable further upside movement towards 1.1860-1.1900. The material has been provided by InstaForex Company - www.instaforex.com |
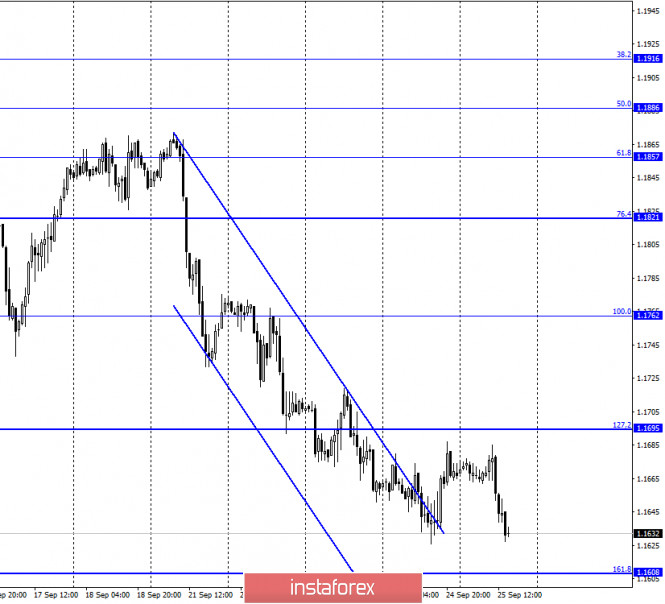
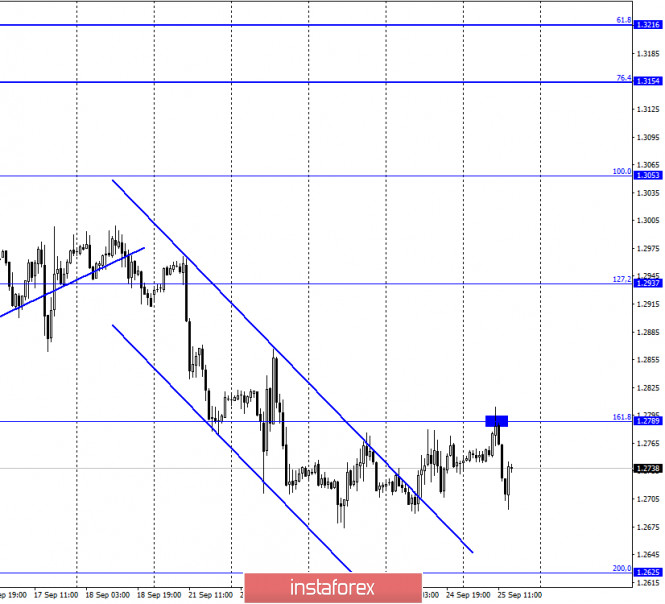
| Posted: 25 Sep 2020 06:55 AM PDT EUR/USD – 1H.
On September 24, the EUR/USD pair began the process of growth towards the corrective level of 127.2% (1.1695). However, it did not reach a few points. Therefore, it performed a reversal in favor of the US currency and began the process of falling towards the corrective level of 161.8% (1.1608). Thus, despite the closing of quotes above the descending corridor, the mood of traders remains "bearish". Meanwhile, after the speeches of Jerome Powell and Steven Mnuchin in the US Congress, traders concluded this week that Democrats and Republicans will again sit down at the negotiating table and still sign an agreement that will provide an additional 1-2 trillion dollars for economic recovery. As Powell and Mnuchin unanimously stated, the economy needs this money to maintain the current pace of recovery. However, the US dollar has been showing fairly steady growth in recent days. Thus, it seems that the dollar does not really need help. Today, there was no important news in America and the European Union, however, the dollar continues to grow. EUR/USD – 4H.
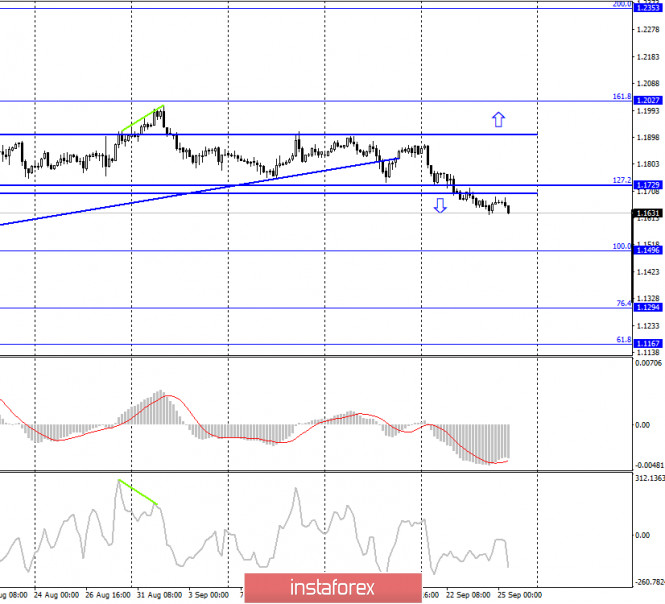
On the 4-hour chart, the quotes of the EUR/USD pair were fixed under the side corridor, which allows traders to continue counting on a fall in the direction of the corrective level of 100.0% (1.1496). The pair's quotes broke out of the side corridor after two months of staying in it. There are no pending divergences in any indicator today, thus, only the level of 161.8% (1.1608) on the hourly chart can prevent bear traders. EUR/USD – Daily.
On the daily chart, the quotes of the EUR/USD pair performed another reversal in favor of the US dollar, fixing under the corrective level of 261.8% (1.1825) and fixing under the blue rectangle that displayed the flat. Thus, now the chances of continuing the fall in the direction of the Fibo level of 200.0% (1.1566) have significantly increased. EUR/USD – Weekly.
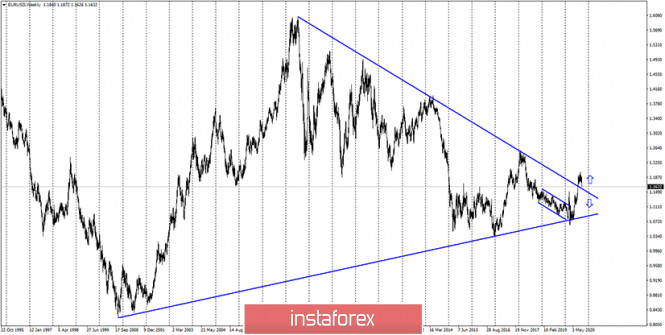
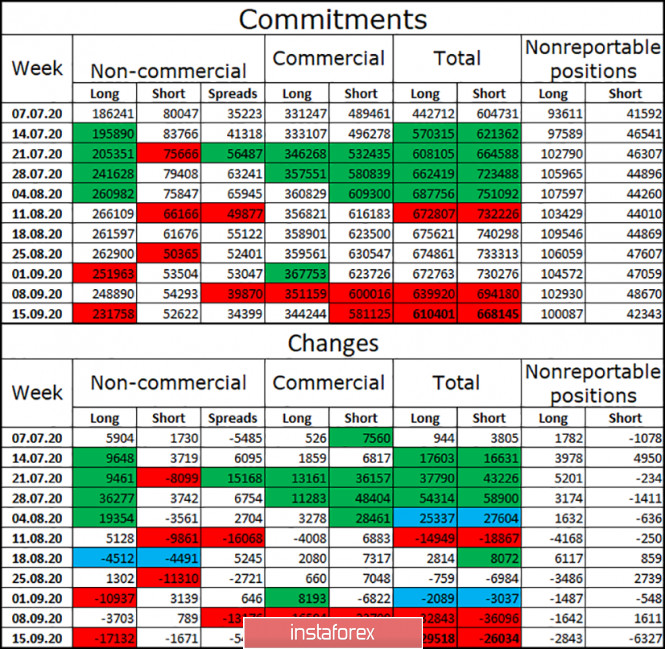
On the weekly chart, the EUR/USD pair has consolidated above the "narrowing triangle", which now allows us to count on further growth of the euro currency, which may be strong, but in the long term. Overview of fundamentals: On September 24, there was no news in the European Union, and new speeches by Jerome Powell and Steven Mnuchin took place in America, which did not particularly interest traders. Changes in the number of applications for unemployment benefits in the United States also became known. The number of primary applications increased by 870,000 and the number of secondary applications was 12.58 million, which is slightly lower than a week earlier. News calendar for the United States and the European Union: US - change in the volume of orders for durable goods (12:30 GMT). On September 25, the calendar of economic events of the European Union again does not contain important reports and speeches. In America, there will be a fairly significant report on orders for long-term products. COT (Commitments of Traders) report:
The latest COT report was very interesting. During the reporting week, the "Non-commercial" group got rid of 17,000 long contracts and only 1,700 short ones. Thus, the mood of major speculators began to change to "bearish". The total number of long contracts focused on the hands of speculators is 231,000 against 52,000 short contracts. Thus, the advantage is still with the bulls, however, it is beginning to decrease. Over the past three weeks, the "Non-commercial" group has closed almost 30,000 long contracts, which significantly increases the probability of a fall in the European currency in the near future. However, the number of short contracts has also decreased in the last two months from 80,000 to 50,000. Thus, the euro may start the process of falling, however, it is unlikely to be strong. Forecast for EUR/USD and recommendations for traders: Today, I recommend selling the euro with a target of 1.1608 since it was closed under the side corridor on the 4-hour chart. I do not recommend buying a pair today. Terms: "Non-commercial" - major market players: banks, hedge funds, investment funds, private, large investors. "Commercial" - commercial enterprises, firms, banks, corporations, companies that buy currency, not for speculative profit, but for current activities or export-import operations. "Non-reportable positions" - small traders who do not have a significant impact on the price. The material has been provided by InstaForex Company - www.instaforex.com |
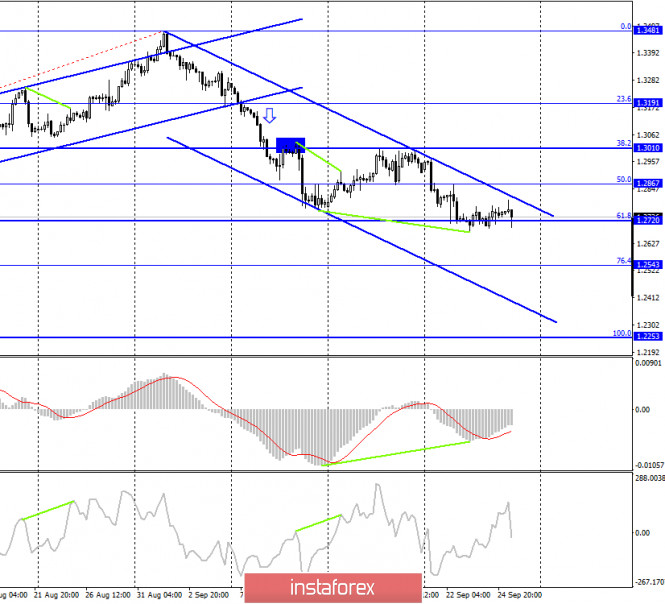
| GBP/USD. September 25. COT report. A new anti-record for morbidity in the UK has been set. Posted: 25 Sep 2020 06:55 AM PDT GBP/USD – 1H.
According to the hourly chart, the quotes of the GBP/USD pair consolidated over the downward trend corridor and rose to the corrective level of 161.8% (1.2789). The pair's rebound from this level worked in favor of the US currency and began to fall in the direction of the corrective level of 200.0% (1.2625). Meanwhile, in the UK, all attention is once again focused on the coronavirus epidemic and its second wave. According to Johns Hopkins University, 6,200 people fell ill in Britain on September 23, and 6,600 people fell ill on September 24. The maximum incidence in the spring was 5,500 people per day. Thus, even now, at the beginning of the second wave, we can make a forecast that it will be much stronger and more destructive than the first. For a Briton, this is certainly bad news since quarantine measures have already been tightened in the UK, however, the number of cases is growing every day, which may force the British authorities to tighten the quarantine even more. Further, any tightening is a blow to the business and economic activity of the population. A blow to the service sector, which is mostly crowded places (shopping centers, bars, restaurants, stadiums, fitness clubs). Thus, in the event of further deterioration of the epidemiological situation, it is the service sector that will be the first to fall under restrictions, which will undoubtedly affect the country's final GDP. GBP/USD – 4H.
On the 4-hour chart, the GBP/USD pair fell to the corrective level of 61.8% (1.2720). However, the bullish divergence of the MACD indicator allowed the pair to make a reversal in favor of the British dollar and make a minimal growth in the direction of the upper border of the downward trend corridor. Closing the pair's rate above this border will increase the probability of further growth in the direction of the Fibo level of 50.0% (1.2867). Fixing quotes under the Fibo level of 61.8% will allow us to expect a resumption of the fall in the direction of the corrective level of 76.4% (1.2543). GBP/USD – Daily.
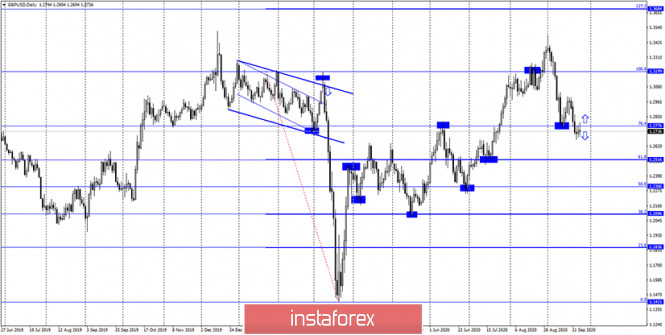
On the daily chart, the pair's quotes performed a consolidation under the corrective level of 76.4% (1.2776). Now traders can expect a further drop in quotes in the direction of the corrective level of 61.8% (1.2516). GBP/USD – Weekly.
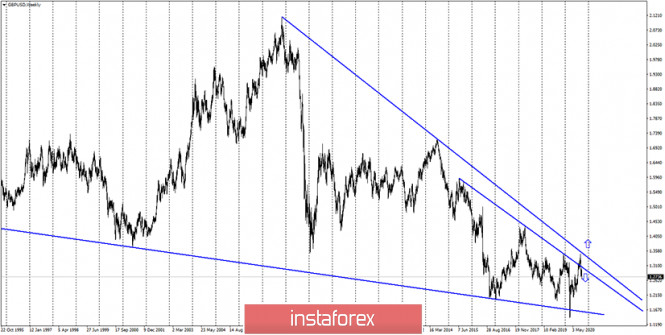
On the weekly chart, the pound/dollar pair closed under the lower downward trend line, thus, a false breakout of this line followed earlier. The pair returns to a downward trend. Overview of fundamentals: On Thursday, the Bank of England Governor Andrew Bailey gave a speech in the UK. Meanwhile, in America, Mnuchin and Powell made regular speeches to the US Congress. No important messages were received from these events. News calendar for the US and UK: US - change in the volume of orders for durable goods (12:30 GMT). On September 25, there was no news or reports in the UK, and a report on orders for durable goods is expected to be published in America. COT (Commitments of Traders) report:
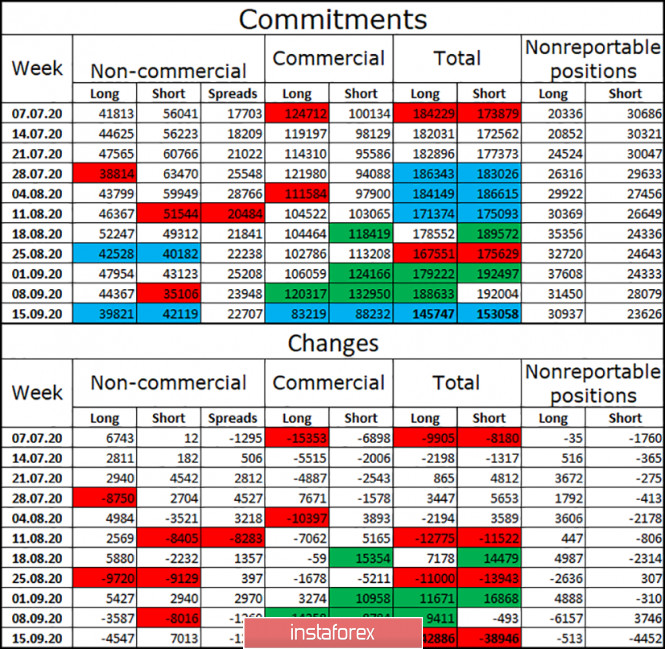
The latest COT report on the British pound, released last Friday, turned out to be much more logical than the previous one. This time, the report showed that the "Non-commercial" group reduced the number of long contracts on its hands by 4,547 units and opened 7,013 short contracts. Thus, the mood of the most important group (the group of professional speculators) became more "bearish" during the reporting week. Given that the British pound has fallen by 700 points since September 1, this behavior of the "Non-commercial" group is logical. The "Commercial" group (hedgers) managed to close about 80,000 contracts during the reporting week, in equal shares of short and long. For comparison, 80,000 contracts are more than the total number of contracts currently in the hands of speculators. Thus, the attractiveness of the British in the eyes of major traders begins to decline quite strongly. Forecast for GBP/USD and recommendations for traders: I recommend selling the British currency with a target of 1.2625 since the rebound was made from the level of 161.8% (1.2789) on the hourly chart. I do not recommend opening purchases of the British currency until the quotes are fixed above the downward trend corridor on the 4-hour chart. Terms: "Non-commercial" - major market players: banks, hedge funds, investment funds, private, large investors. "Commercial" - commercial enterprises, firms, banks, corporations, companies that buy currency, not for speculative profit, but for current activities or export-import operations. "Non-reportable positions" - small traders who do not have a significant impact on the price. The material has been provided by InstaForex Company - www.instaforex.com |
| Posted: 25 Sep 2020 06:12 AM PDT Gold has rebounded due to the USD's retreat but this could be only a temporary rebound before dropping deeper. Technically, the rebound could be natural after the last massive drop. The rate could come back to test and retest the broken levels before reaching new lows. Gold has recovered a little as the US Unemployment Claims increased to 870K in the previous week. The Durable Good Orders could increase by 1.1%, while the Core Durable Goods Orders may register a 1.0% growth in August. A higher increase could boost the USD and could push the price of gold down.
XAU/USD drop was stopped at $1,848 level and now is fighting hard to come back higher. It remains to see if the rate will have enough bullish energy to reach and retest the S3 ($1,890) and the $1,900 psychological level. A temporary rebound could bring a selling opportunity. Gold has failed to stay under $1,862 former low, for now. Another drop below this downside obstacle could suggest selling with a potential target at $1,800 level.
Dropping and stabilizing below $1,862 activates a short opportunity with a potential target at $1,800 psychological level. Also, a false breakout with great separation above the S3 ($1,890) or above $1,900 could suggest selling as well. The material has been provided by InstaForex Company - www.instaforex.com |
| Posted: 25 Sep 2020 06:12 AM PDT US durable goods orders for AugustPrior was +11.4% (revised to +11.7%)
As I discussed in the previous review, the EUR is still in the strong downward cycle and I see no evidence of any reversal yet. Further Development
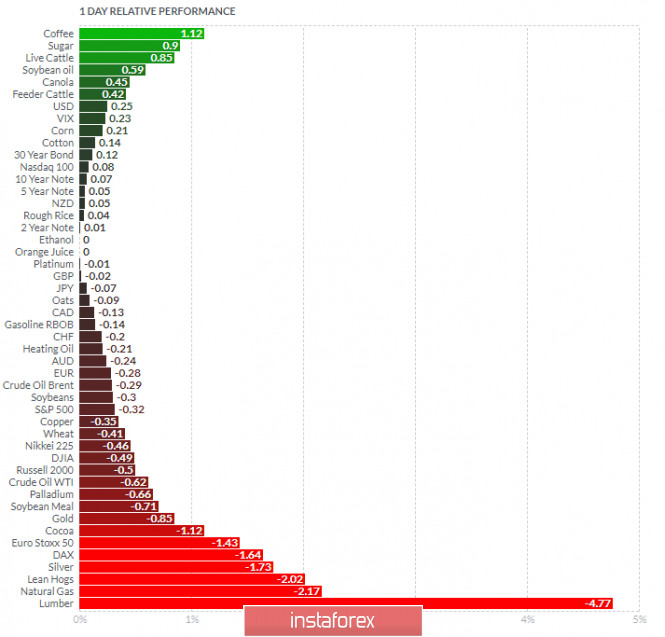
Analyzing the current trading chart of EUR, I found that sellers are still in control and tat EUR managed to hit my yesterday's target at 1,1625. The next downside target is set at the price of 1,1545 Watch for selling opportunities on the rallies with the target at 1,1545. The main cause of the most recent drop on EUR was the breakout of the rounding top formation in the background. My advice is still to watch for selling opportunities with the target at $1,818 1-Day relative strength performance Finviz
Based on the graph above I found that on the top of the list we got Sugar and Live Cattle today and on the bottom Lumber and Lean Hogs. EUR is on the negative territory.... Key Levels: Resistance: 1,1690 Support level and downside target: 1,1545 The material has been provided by InstaForex Company - www.instaforex.com |
| USD/CAD Rally Stopped By Dynamic Resistance! Posted: 25 Sep 2020 06:09 AM PDT The pair is trading at 1.3350 below yesterday's high of 1.3418. The minor drop was caused by the US Unemployment Claims unexpected growth to 870K in the previous week. Still, the retreat could be ended soon if the USDX will jump higher after the Durable Goods Orders and Core Durable Goods Orders data will be released. Personally, I'm expecting to see another bullish momentum after the current drop. Another higher high, jump above 1.3418 suggests buying. USD/CAD is somehow expected to resume its upside journey after taking out the major downtrend line.
USD/CAD upside was stopped by the median line (ML) of the ascending pitchfork. I still believe that it will try again to make a valid breakout above this obstacle. So, a bullish fly above the median line (ML) and above 1.3418 former high validates further growth. The R1 (1.3254) and 38.2% (1.3269) levels are seen as near-term strong support levels. The bias is bullish as long as USD/CAD is trading above these levels. Actually, a deeper retreat could help us to go long as well.
Buy a valid breakout above the median line (ML) or above 61.8% (1.2439) level with higher targets at 1.36, 1.37 levels. Right now we don't have a selling signal, so we have to search only for long opportunities. A deeper drop to 1.3259 could bring another long opportunity. Better than expected US data should send the pair towards fresh new highs. The material has been provided by InstaForex Company - www.instaforex.com |
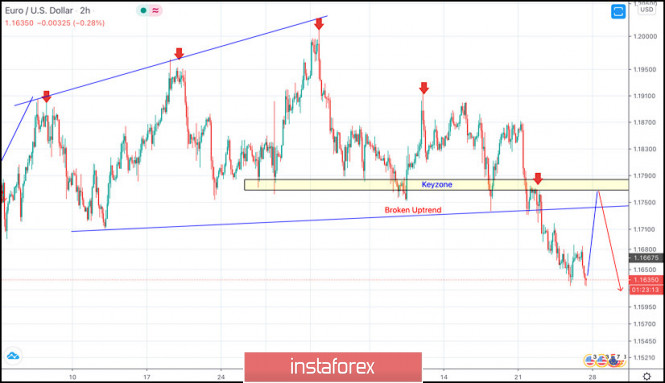
| Posted: 25 Sep 2020 06:06 AM PDT
EUR/USD is located below 1.17, deep in the seller's territory. The price has rebounded a little but the outlook is still bearish, it should drop towards fresh new lows as long it stays below 1.17 and under the red downtrend line. The 1.17 retest followed by a strong drop suggests selling. Also, a drop below 1.1626 yesterday's low confirms a deeper drop as well.
Sell from below 1.1626 low or after a sideways movement below 1.17 psychological level. The next major downside targets are seen at 1.15 and lower at 1.14 levels. The material has been provided by InstaForex Company - www.instaforex.com |
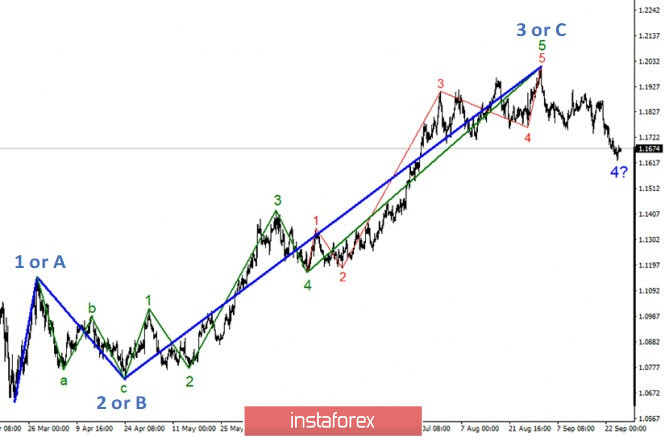
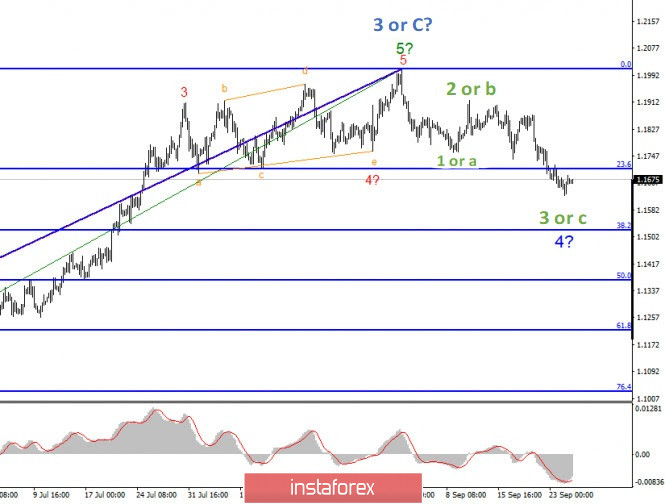
| Analysis of GBP/USD for September 25, 2020 Posted: 25 Sep 2020 06:05 AM PDT In the most global terms, the construction of a new downward section of the trend continues. The continued decline in quotes suggests the completion of the construction of wave 2 or b as part of this section, which, therefore, has taken a rather shortened form. A successful attempt to break through the minimum of the expected wave 1 or a allows us to conclude that the markets are ready for further sales of the GBP/USD. The chart clearly shows the drop in demand for the pound sterling in recent weeks, which is caused by a whole list of different reasons and factors. Over the past trading day, the GBP/USD instrument gained several basis points. Thus, the construction of a new downward section of the trend continues within the expected wave 3 or C, since the minimum increase in the instrument cannot violate the current wave marking. An unsuccessful attempt to break through the level of 61.8% suggests that the markets are ready for a small departure of quotes from the lows reached. So far the pound has made a small success in its attempt to recover. According to the latest news from the UK, it is quite difficult to rely on a strong increase in the price of the pound sterling. At the same time, no currency can move in one direction all the time. The second correction wave turned out to be quite weak, so now there are actually quite a large number of options for further development of events. Thus, it is possible to conclude that the upward section of the trend is really complete. And the grounds are quite simple. Right now, UK goes not just at the edge of a precipice called "Brexit no bargain", but it already walks on the edge of a precipice called "the Quarrel with the EU." Representatives of the European Union have already stated that the actions arranged by London are lawlessness, as well as weak attempts to intimidate. This simply means, no one in the European Union believed Boris Johnson and is not going to make concessions to him in the negotiations. The official position of the EU is clearly seen in the comments of its representatives. If London wants to violate international law and the agreement with the EU, let it go. Brussels will go to court with this, impose sanctions on Britain, which will already be drained of blood by leaving the bloc, and may eventually start its own trade war. It is unlikely that Europe will simply agree with Johnson's desire to violate the current agreement, and even such an important and principled one. For the European Union, Northern Ireland is a window that needs to be closed to avoid illegal movements of people from Britain to its territory, to avoid the flow of contraband in both directions. The mechanism stipulated in the agreement seems to satisfy both sides, but in the end, Boris Johnson is going to violate this agreement. Or at least he says he's going to. General conclusions and recommendations: The Pound-Dollar instrument presumably completed the construction of the upward trend section. At the same time, there is a high probability of building a correction wave 2 or b, which could also have already completed its construction near the level of 38.2%. An unsuccessful attempt to break this mark allows the markets to start selling the instrument with targets located around 1.2721 and 1.2539. Based on the construction of the third wave, this is equal to 61.8% and 76.4% Fibonacci. The material has been provided by InstaForex Company - www.instaforex.com |
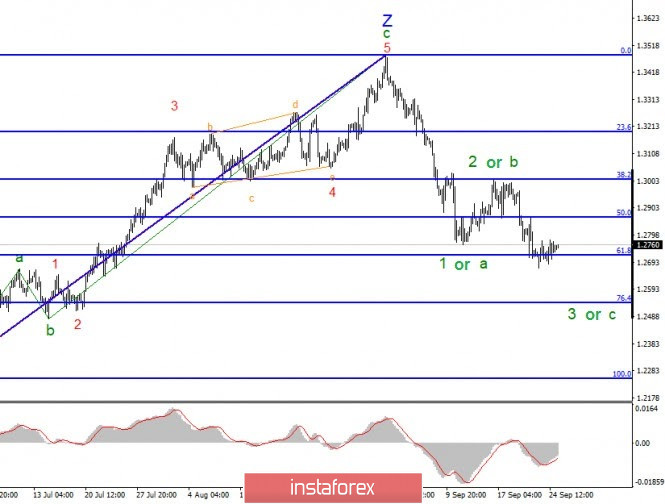
| Posted: 25 Sep 2020 06:01 AM PDT The wave marking of the EUR/USD instrument in global terms still looks quite convincing in everything that concerns the upward section of the trend, which presumably ended with wave 3 on the first of September. After this day, the construction of the proposed wave 4 began, which at first took a three-wave form, but the decline in quotes this week led to a complication of the internal structure of this wave. Thus, the entire wave that begins on September 1 takes on a more complex and extended form and may even be not wave 4, but the first wave as part of a new downward trend section. The wave marking of a smaller scale shows that two smaller waves have already been built inside the assumed wave 4, while the assumed wave 3 or C in 4 is currently being built, within which smaller-scale waves are also being viewed. The entire downward wave, which began its construction on September 1, is unlike an impulse wave. If this assumption is correct, then we are now seeing the construction of wave 4, which takes a complex and extended form. A successful attempt to break through the level of 23.6% suggests that the instrument is ready for further decline. The movements of the Euro/Dollar instrument this week fully corresponded to the current wave marking. Despite the fact that there were quite a lot of important events this week, there was not enough important information. US Treasury Secretary Steven Mnuchin and Federal Reserve Chairman Jerome Powell spoke to various congressional committees three times during the week. However, their performances only led to a weak increase in the US dollar. It is not even certain that these speeches could have caused the growth of the US currency. As mentioned before, the wave marking, even without the speeches, suggested a decrease in the instrument's quotes. America does not have any other news at the moment. Markets are still very much interested in two topics. The first - the coronavirus - has faded into the background as the epidemiological situation improved slightly in recent weeks. However, this opinion is ambiguous since 40,000 new cases of infection are recorded daily. On the contrary to this, what came to the fore is the second topic - the upcoming presidential election case. The last important information says that the case may reach the US Supreme Court, as either Donald trump or Joe Biden may not recognize the election results. Trump opposes voting by mail, while Biden believes that his opponent will try to rig the election. In general, it is very probable that the case will have to go to court, in which one of the judges, Ruth Ginsburg, who was not a fan of Trump and opposed him, recently died at the age of 87. Now, Donald is going to replace her with a new candidate before the election, and experts say that in this case, as many as six of the nine judges will be appointed by Republican presidents. Therefore, if the election case does go to court, it is Trump who can count on a decision in his favor. General conclusions and recommendations: The Euro-Dollar pair presumably completed the construction of the global wave 3 or C and the second corrective wave as part of the trend section that begins on September 1. Thus, at this time, It is still recommended to sell the instrument with targets located near the estimated 1.1520 mark, corresponding 38.2% Fibonacci, for each MACD signal down. The material has been provided by InstaForex Company - www.instaforex.com |
| Posted: 25 Sep 2020 05:58 AM PDT The Spanish government recommends Madrid to extend lockdown restrictions to all parts of the regionMadrid just announced that they are raising the number of areas under lock down to 45 from 37 moments ago, adding that about 1 million people in the region are reported to be in lockdown based on the latest restrictions. But Spain's health minister has come out to say that the region should go into total lock-down instead to curb the spread of the virus outbreak. For some context, Madrid has a population of roughly 6.6 million but the concern is that the hospitalization capacity is starting to see another drastic increase recently with nearly 500 patients hospitalized per day in the past week. Spain reported 10,600 new virus cases yesterday as the virus situation in Europe continues to see more negative developments with France reporting a record daily number of infections yesterday and Germany seeing its highest daily increase since April.
As I discussed in the previous review, the Gold is still in the strong downward cycle and I see no evidence of any reversal yet. Further Development
Analyzing the current trading chart of Gold, I found that sellers are still in control and that Gold might trade to my projected target at the price of $1,818. My advice is still to watch for selling opportunities with the target at $1,818 1-Day relative strength performance Finviz
Based on the graph above I found that on the top of the list we got Sugar and Live Cattle today and on the bottom Lumber and Lean Hogs. Key Levels: Resistance: $1,863 Support level and downside target: $1,818 The material has been provided by InstaForex Company - www.instaforex.com |
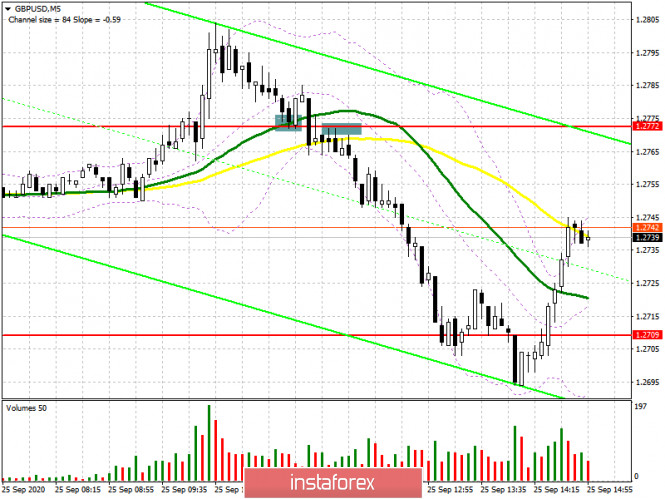
| Posted: 25 Sep 2020 05:26 AM PDT What is needed to open long deals on GBP/USD In the first half of the trading day, I paid attention to buying the sterling after the level of 1.2772 was breached and the price fixed above 1.2772. If you look at the 5-minute chart, you will see how the bulls are striving to push the price up above 1.2772. Then, the price declined. While this level was being tested from top downwards, the pair created a nice market entry point for long positions. Unfortunately, it happens that the market does not develop a further move. So the currency pair rapidly retreated to the level below 1.2772, thus creating an excellent entry point for short positions. Of course, it is risky to trade against the trend. However, it was the right decision to sell at a fake breakout. As a result, after the level of 1.2772 was tested, the pair fell to support of 1.2709.
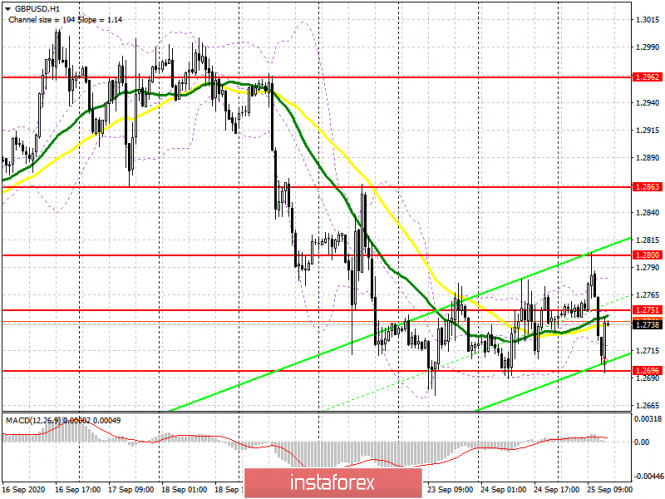
Now let's consider a one-hour chart. The technical picture has totally changed. Now we should trade bearing in mind new levels. The bulls should defend support of 1.2696 as the second test might create a good buy signal taking into account a breakout and the price fixation above the middle of the channel that is 1.2751. This will push GBP/USD up to the intraday high of 1.2800 where I recommend profit taking. Under the scenario of breaking the one-week low of 1.2696, it would be better to refrain from buying the sterling against the trend. So, we should wait for a test of a new area of 1.2645 and 1.2585 and open there long positions bearing in mind a 30-40 pips intraday correction. What is needed to open short positions of GBP/USD The first thing to do for the pound sellers is to focus on defending the middle of the trading range of 1.2751. The formation of a fake breakout here will be a new excellent entry point to open short positions with the view of a further bearish trend. The outlook for sellers will be confirmed by a breakout and fixation of the price below support of 1.2696. This will increase pressure on the pair and open the door for news local lows of 1.2645 and 1.2585 where I recommend profit taking. Under the scenario of the GBP/USD climb above the level of 1.2751in the second half of the trading day, it would better to wait for a higher border of the trading range of 1.2800. So, it will be a good time to sell the pound there bearing in mind a downward 30-40 pips intraday correction.
Signals of technical indicators Moving averages The pair is trading below 30- and 50-period moving averages. It indicates that the market is uncertain about a further trend. Remark. The author is analyzing a period and prices of moving averages on the 1-hour chart. So, it differs from the common definition of classic daily moving averages on the daily chart. Bollinger Bands A breakout of the indicator's upper border of 1.2785 will trigger a new wave of the sterling growth. Alternatively, a breakout of the lower border of 1.2696 will increase pressure on the pair. Definitions of technical indicators
|
| EUR/USD: US dollar is not in a rush to dismiss doubts, leaving the euro under pressure Posted: 25 Sep 2020 05:20 AM PDT The USD index is trading near a two-month peak today, which was reached yesterday in the area of 94.6 points. As we can see, the dollar is close to showing the best weekly performance in almost six months. James Bullard, the head of the Federal Reserve Bank of St. Louis, said that the US economy may fully recover by the end of 2020. However, his forecast looks overly optimistic, since there are only few now who believe that the Democrats and Republicans will compromise on the agreement about a new economic stimulus package before the US presidential election. According to State Street Bank experts, it is not yet clear whether another economic package will be adopted. At least no one expects the deal to be concluded before the elections, but the economy really needs some help by the end of the year, as recently announced by Feds' representatives. Yesterday's released data showed that the number of Americans who filed new applications for unemployment benefits unexpectedly increased last week. This signals that the US economic recovery is getting worn out. Moreover, Goldman Sachs experts revised their forecast for US GDP growth in the fourth quarter of 2020 — from 6% to 3%. This week, the USD index rose by 1.4%,but there are doubts whether US lawmakers will be able to overcome the differences to agree on another package of support for the national economy. State Street Bank said that the dollar's rise and risk aversion may continue, since news in the United States is dominated by elections. At the same time, it is likely that political uncertainty will put pressure on the markets. Nomura strategists also expect the dollar to strengthen in the short term and recommend selling the euro. They said that there are several factors indicating that the dollar will continue to rise. The risk sentiment is deteriorating as the chances of US fiscal stimulus decline. In addition, it is not yet clear whether the market has fully considered the threat of the second wave of COVID-19. So technically, breaking through below 1.1700 seems to signal the end of the upward trend of EUR/USD. Thus, they advise to sell the main currency pair with the target at 1.1400 and the stop at 1.1850. In turn, analysts at JPMorgan note that while the EUR/USD pair remains below the level of 1.1700, the path of least resistance for it looks like a movement to new lows, and the nearest target is the level of 1.1500. Meanwhile, Danske Bank expects that the pressure on the single European currency is unlikely to disappear until the end of this year. "The euro is unable to receive support from the recent change in the Fed's approach to the inflation target. At the same time, a new wave of restrictions due to the increase in cases of coronavirus infection in the EU can undermine the economic growth of the region," Bank experts said. So, they forecast that the EUR/USD pair will trade within the levels of 1.1500-1.1900 by the end of the year. The material has been provided by InstaForex Company - www.instaforex.com |
| US oil producers do not care about future Posted: 25 Sep 2020 05:17 AM PDT
The coronavirus pandemic has forced many countries to cut production. However, American oil producers think only about their own profit. It seems that they are not interested in the world market situation. Despite the forced reduction in oil output, massive layoffs, and a series of bankruptcies, they still prefer to maintain and increase production, rather than cutting costs and obligations to creditors. The Federal Reserve Bank of Dallas made an analysis, according to which 16% of oil executives intend to reduce debt. Another 16% intend to increase production, while 19% prefer to keep production at current levels. Meanwhile, 32 companies have filed for bankruptcy since the beginning of the year, including Whiting Petroleum and Chesapeake Energy. In total, the company owed $49.7 billion, including $29 billion in unsecured debt. Also, 66% of analysis's participants believe that the US oil market has peaked and will never reach the levels of early 2020 when the oil output exceeded 13 million barrels per day. Moreover, American oil workers fear the US presidential election. They believe that Biden's policies will deal a further blow to their sphere. In other words, the leaders of oil companies prefer to live in the present day, as there is no hope for a bright future. The main thing for them is to sell as much oil as possible while there is such an opportunity. And when the money runs out, they will declare themselves bankrupt. As simple as that. In the meantime, oil prices are rising as investors hope for a recovery in demand. Earlier this week, the US Department of Energy reported a decrease in oil reserves in the country for the past week. Investors also hope that the second wave of coronavirus will not do as much damage as the first did. Brent oil futures for November rose by 0.55% to trade at $42.17 per barrel, while November futures for WTI grew by 0.6% to settle at $40.55 per barrel. However, prices may fall amid risks around the coronavirus and the resumption of oil production in Libya, which could lead to an oversupply. However, Iraq intends to reduce production as part of the OPEC+ deal. In other words, the market situation will not change. This has an impact on oil prices, Jeffrey Halley, senior market analyst at OANDA, said. The material has been provided by InstaForex Company - www.instaforex.com |
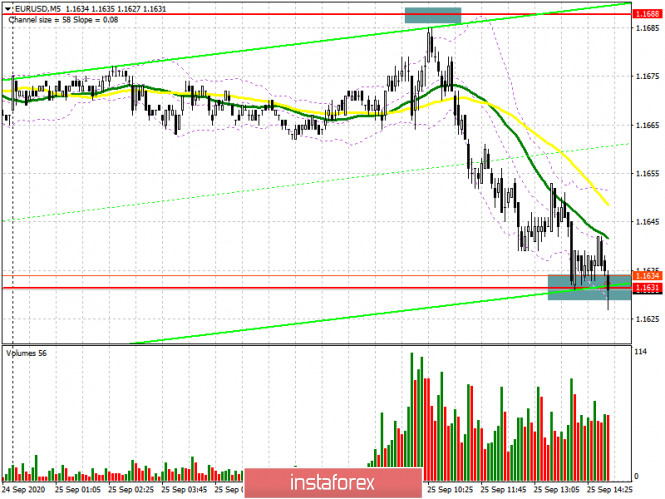
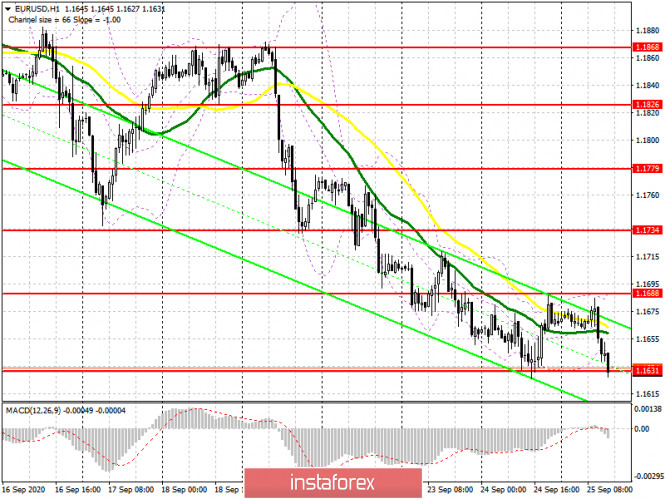
| EUR/USD: plan for the American session on September 25 Posted: 25 Sep 2020 05:14 AM PDT Unfortunately, I did not wait for the formation of a false breakout at the level of 1.1688 in the morning, to which we fell a couple of points short. As a result, the entire downward movement of the euro passed. At the moment, the focus is on the support of 1.1631, and the further direction of the pair will depend on how the pair behaves at this level. The formation of a false breakout forms a signal to buy the euro to return to the area of today's maximum of 1.1688, where I recommend fixing the profits. In the scenario of a further decline in the EUR/USD trend under this level, it is best to wait for the update of the new local support of 1.1585 and open long positions on the pair, counting on correction of 20-30 points within the day. There may be a fairly large surge in the volume area of 1.1585 that will also indicate the exit of major sellers of the euro from the market after the trend movement observed since the beginning of September this year.
To open short positions on EURUSD, you need to: Sellers of the euro formed a downward movement of the pair a little earlier than predicted and their main task in the afternoon will be to break through and consolidate below the local minimum of 1.1631. A test of this level from the bottom up after the breakout forms a good entry point for short positions in the expectation that the euro will continue to decline along with the trend to the area of the minimum of 1.1585. Fairly large profit-taking on short positions may occur here. If there is no movement of the pair up from this area, you can expect to update the minimum of 1.1541. In the scenario of forming a false breakout at 1.1631 in the afternoon, I recommend not to rush with sales, but to wait for the repeated test of the maximum of 1.1688 and sell the euro from there immediately on the rebound in the expectation of correction of 20-30 points within the day.
Signals of indicators: Moving averages Trading is conducted below 30 and 50 daily moving averages, which indicates continued pressure on the euro and the formation of a bear market. Note: The period and prices of moving averages are considered by the author on the hourly chart H1 and differ from the general definition of classic daily moving averages on the daily chart D1. Bollinger Bands A break of the lower limit of the indicator in the area of 1.1631 will lead to a larger decline in the euro. Growth will be limited by the upper level of the indicator in the area of 1.1688. Description of indicators
|


| You are subscribed to email updates from Forex analysis review. To stop receiving these emails, you may unsubscribe now. | Email delivery powered by Google |
| Google, 1600 Amphitheatre Parkway, Mountain View, CA 94043, United States | |
No comments:
Post a Comment