2019-01-22
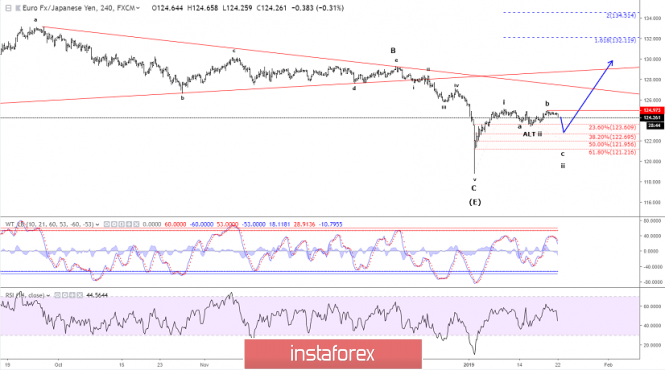
As the US market was closed for Martin Luther King Day, nothing much happened in yesterday's trading. We still favor a more complex correction in wave ii and resistance at 124.93 being able to cap the upside for a final dip towards 122.70 to complete wave ii and setting the stage for the next impulsive rally higher in wave iii towards 132.12.
Only a direct break above 124.93 will indicate that wave ii already has completed and wave iii is developing towards 132.12.
R3: 125.81
R2: 125.19
R1: 124.93
Pivot: 124.71
S1: 124.20
S2: 123.73
S3: 123.37
Trading recommendation:
We will buy EUR at 123.00 or upon a break above 124.93.
Elliott wave analysis of GBP/JPY for January 22, 2019
2019-01-22
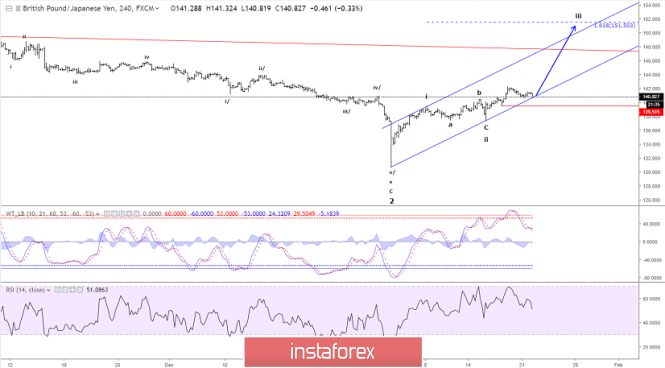
With the US market closed in observance of Martin Luther King Day, we saw a very quiet trading day yesterday. We still favor minor support at 140.71 is able to protect the downside for a break above more important resistance at 141.78 that will confirm a continuation higher to 143.81 and 145.17 on the way higher to 151.30.
A break below 140.71 will be a bit disappointing, but only a break below key support at 139.43 will force a recount of the rally from 130.70.
R3: 143.81
R2; 142.71
R1: 142.00
Pivot: 141.54
S1: 140.92
S2: 140.71
S3: 140.25
Trading recommendation:
We are long GBP from 140.90 with our stop placed at 139.40
Technical analysis of EUR/USD for 22/01/2019
2019-01-22
Market technical overview:
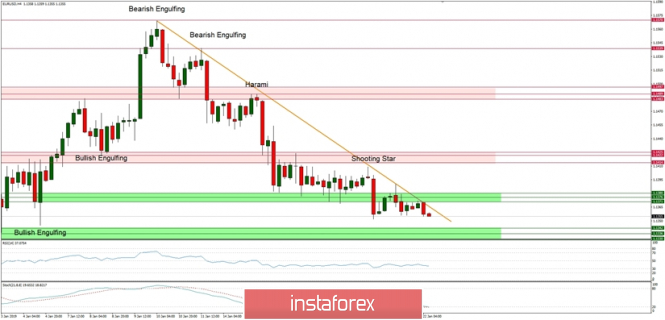
The bulls have been too weak to break through the orange trendline, so the Shooting Star candlestick formation has been made just below the trendline and the price moved down towards the technical support at the level of 1.1371. This support has been broken as the market has made a new local low at the level of 1.3152. The price is still trading below the trendline, which means the bears are still in control over the market and are trying to push the prices below the level of 1.1342 - 1.1324.
The momentum is still negative and weak (below its fifty level), so the odds are in favor of bears despite the oversold market conditions. The larger time frame trend is still bearish, so the ease of move is to the downside.
Recommendations:
The bears are in control over the market, so the price will likely decrease towards the support zone at the levels of 1.1342 - 1.1324. If, however, this level is violated as well, then the next target for bears is seen at the level of 1.1284 (Hammer candlestick low).
Technical analysis of GBP/USD for January 22, 2019
2019-01-22
Technical analysis of GBP/USD for January 22, 2019:
The bulls defend the support, but for how long?
Technical market overview:
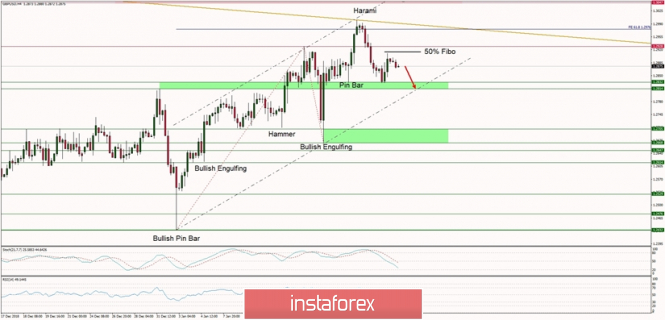
The price of GBP/USD went down towards the technical support zone located between the levels of 1.2814 - 1.2832 and bounced from this zone. The bounce has hit the 50% Fibonacci retracement at the level of 1.2914 (just below the technical resistance at the level of 1.2928) and the market seems to be reversing now. Any other violation of the level of 1.2814 might lead to further sell-off towards the technical support seen at the level of 1.2705 as the price will fall out of the channel lower boundary line. This situation would only accelerate the sell-off as the bulls would have stopped defending the support at 1.1214.
Please notice the market is just coming off from oversold levels and the momentum is neutral to bearish, so both of the indicators support the short-term bearish outlook.
Trading recommendations:
The support zone of 1.2814 - 1.2832 is the key support zone for the bulls, so they will defend it as any sustained violation of this zone will lead to accelerated sell-off. Traders should keep an eye on this zone to see who will win this battle and join the winning side.
Technical analysis for Gold for January 22, 2019
2019-01-22
Gold price got rejected at $1,300 and broke the triangle pattern downwards. Our target remains $1,272 area and the 38% Fibonacci retracement level. Bulls will need to react from this support area.
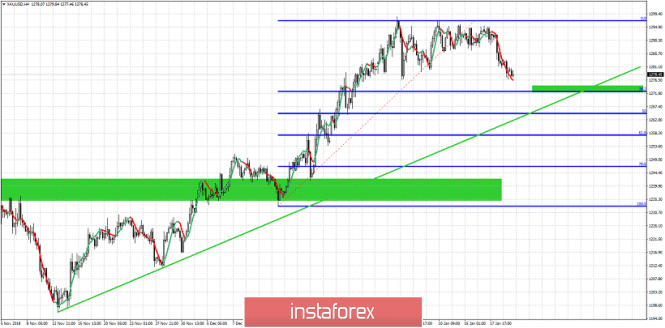
Green rectangles - support areas
Green line - long-term trend line support
Gold price is moving towards the 38% Fibonacci retracement level and the first green support area as expected after the triangle breakdown. Bulls must hold this support level and push prices higher. A break below this area of support at $1,272-75 would be a bearish sign. As long as price is above the green long-term trend line support, the medium-term bullish trend targeting $1,320 is intact. If this trend line fails to hold we could call a major top is in.
Technical analysis for EUR/USD for January 22, 2019
2019-01-22
EUR/USD remains weak inside a bearish short-term channel continuing its move towards 1.1320 and the important upward sloping trend line support. Bulls need to react soon and recapture at least 1.14 in order to remain alive. Bears on the other hand want to break below 1.13 in order to confirm that a major top is in at 1.1570 and we are heading towards 1.11-1.10.
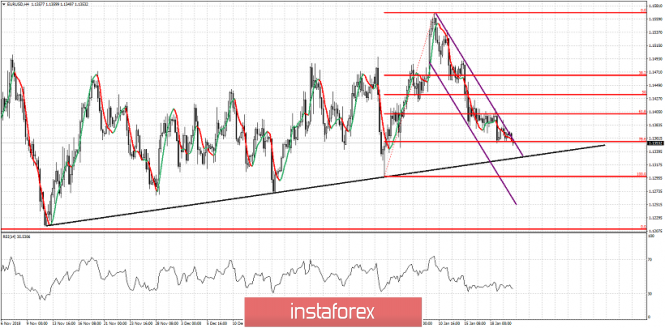
Purple lines - bearish channel
Black line - important trend line support
EUR/USD continues to make lower lows and lower highs. A break above short-term resistance of 1.1405 would signal that the downward move from 1.1570 is over and we should at least see a bounce towards 1.1450. Support is important at 1.1290-1.1320. A break below this level will imply that the 1.1570 high is an important top and any bounce should be sold. Target would then be a move towards 1.11-1.10. As long as price holds above 1.1290-1.13 bulls still have hopes for a move higher.


No comments:
Post a Comment