Elliott wave analysis of EUR/JPY for February 19, 2019
2019-02-19
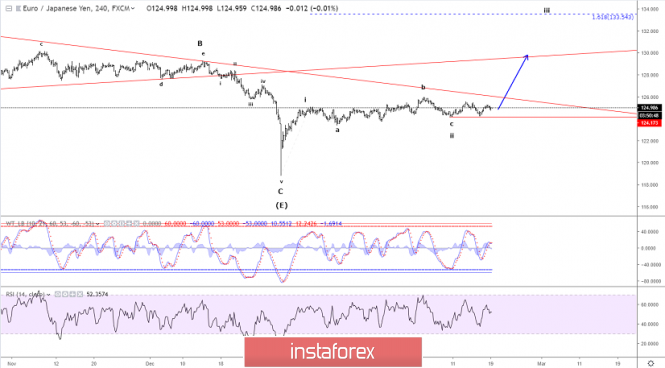
The complex correction in wave ii continues to use up time as it moves sideways. To break out of this deadlock, we need a clear break above minor resistance at 125.54 that will yield a rally higher to 125.95 on the way higher to 129.48 and ultimately towards 133.54.
Support is seen at 124.67 and key-support is at 124.38 a break below the later, will extend the correction in wave ii even more.
R3: 125.95
R2: 125.46
R1: 125.09
Pivot: 124.85
S1: 124.67
S2: 124.38
S3: 124.15
Trading recommendation:
We are long EUR from 124.65 with our stop placed at 124.15
Elliott wave analysis of GBP/JPY for February 19, 2019
2019-02-19
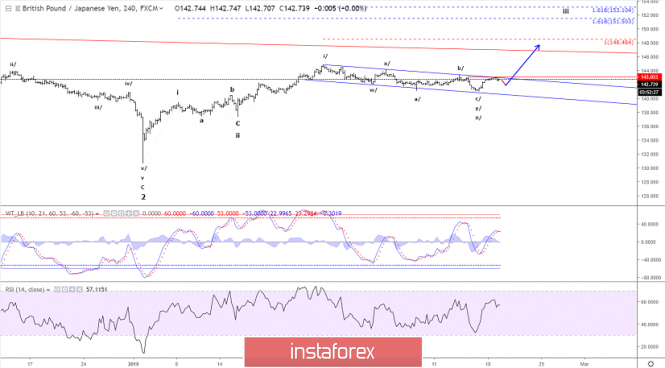
Key-resistance at 143.03 has capped the rally from 141.04, which keeps wave ii/ alive. The rally to 143.03 could be an x-wave calling for a final zig-zag decline in wave z towards support in the 140.35 - 140.67 to complete wave ii and set the stage for the next impulsive rally.
The second option is that an ending diagonal is developing as wave c/ of y/ of ii/. The target in both cases will be almost identical, but the later option is of course the more complicated pattern of the two, so for now we will try to track the decline to the support-zone between 140.35 - 140.67 as well as possible.
R3: 143.86
R2: 143.34
R1: 143.03
Pivot: 142.50
S1: 141.79
S2: 141.35
S3: 140.98
Trading recommendation:
We sold GBP at 142.65 with our stop+reverse placed at 143.10. We will take profit+reverse at 140.75.
GBP/USD technical analysis for 19/02/2019
2019-02-19
GBP/USD technical analysis for 19/02/2019:
The battle of the resistance was won by bears so far.
Technical market overview:
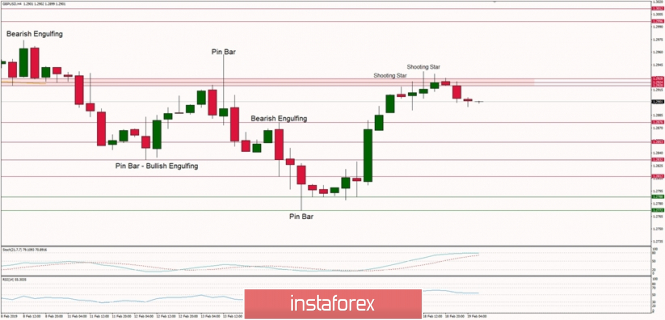
In the GBP/USD market, the bulls have managed to test the key technical resistance zone located between the levels of 1.2920 - 1.2928, they even manage to break through it but the Shooting Stars candlestick patterns were made and the price has been slowly going down since then. The local high was made at the level of 1.2937, but the candle has closed below the technical resistance anyway. The market conditions are now overbought and despite the positive momentum the price might now pull-back. The nearest technical support is seen at the level of 1.2876.
Weekly Pivot Points:
WR3 - 1.3163
WR2 - 1.3061
WR1 - 1.2979
Weekly Pivot - 1.2879
WS1 - 1.2794
WS2 - 1.2689
WS3 - 1.2606
Trading recommendations:
All sell orders opened from the level of 1.2920 should still be in play as the first target for them is seen at the level of 1.2876. The second target is seen at the level of 1.2853 and third at 1.2832. No new long-term sell orders should be opened yet.
EUR/USD technical analysis for 19/02/2019
2019-02-19
EUR/USD technical analysis for 19/02/2019:
The resistance holds, for now, the price pulls-back lower
Technical market overview:
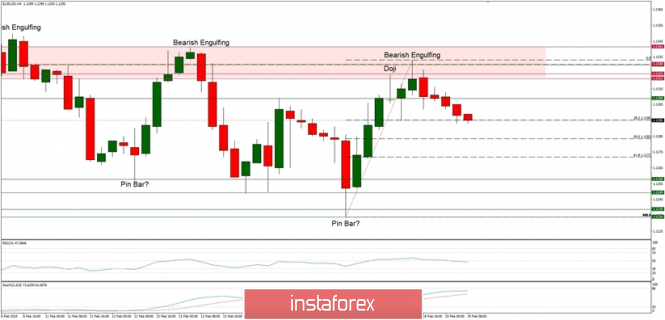
The EUR/USD price was not able to break through the technical resistance zone located between the levels of 1.1321-1.1341 and the price pulled-back towards the 38% Fibonacci retracement at the level of 1.1295. The momentum is below the neutral level, which is again not a very good indication of the strength of the bullish side of the market. The next targets for bears are the Fibo retracements at 50% (at 1.1283) and 61% (at 1.1272). Only a clear breakout above the level of 1.1341 would change the short-term outlook from bearish to bullish.
Weekly Pivot Points:
WR3 - 1.1452
WR2 - 1.1395
WR1 - 1.1341
Weekly Pivot - 1.1286
WS1 - 1.1238
WS2 - 1.1177
WS3 - 1.1130
Trading recommendations:
All of the sell orders opened yesterday should be still in play as the targets are seen at the levels of 1.1295, 1.1283 and 1.1272. The corrective move down might get time-consuming, so the patience is required now.
Technical analysis for Gold for February 19, 2019
2019-02-19
Gold price is making higher highs as expected after breaking above the short-term resistance at $1,317. In our past analysis I mentioned that $1,317 was the key resistance for more upside. Breaking above it would provide a bullish signal.
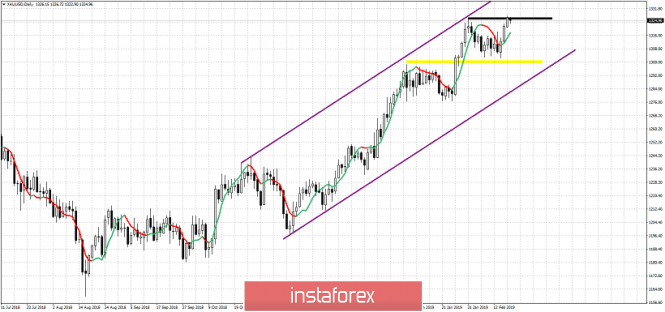
Purple lines - bullish channel
Yellow rectangle - major support
Black line - resistance
Gold price remains in a bullish trend as price continues to make higher highs and higher lows. Support remains at $1,300 and if broken we could see the end of the up trend since August. Resistance and previous highs were broken yesterday but price remains around this area. As long as price is above $1,311 we continue to expect to see $1,330-40 area.
Technical analysis for EUR/USD for February 19, 2019
2019-02-19
EUR/USD visited again our first bounce target area and 38% Fibonacci retracement. This area of 1.1340-1.1350 is important short-term resistance. Breaking above it will open the way for a move towards 1.14.
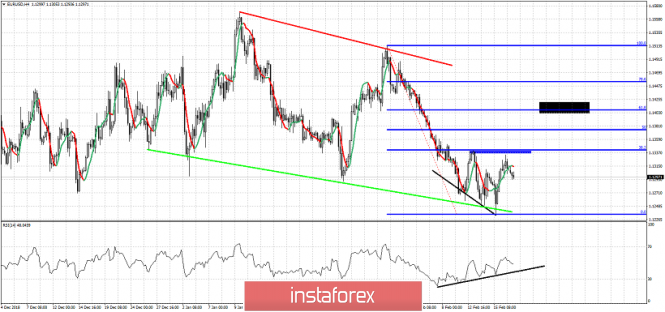
Green line - trend line support
Red line - major trend line resistance
Blue rectangle - short-term resistance
Black rectangle - bounce target if blue rectangle is broken
Black lines - bullish divergence
EUR/USD bounced again as expected but price only managed to reach the 38% Fibonacci retracement level. Bulls need to break above the blue rectangle in order to hope for a bigger bounce towards 1.14. The RSI continues to provide a bullish divergence while being supported and making higher highs and higher lows. We are in a consolidation/correction phase and I would prefer to be neutral or bullish, waiting for higher levels to try a short position, where risk reward is better. For the medium-term trend to change price would need to recapture 1.15 and stay above it.
Author's today's articles:
Torben Melsted
 Born in November 1962. Graduated from CBS, got Diploma in Finance. Began trading on Forex in 1986 and since that time held various positions such as advising clients, hedging client flows on FX and commodity markets. Also worked for major corporations as Financial Risk Manager. Uses Elliott wave analysis in combination with classic technical analysis, and has been using a Calmar Ratio of 5.0 for over 3 years. Has his own blog, where he uses Elliott wave and technical analysis on all financial markets.
Sebastian Seliga
 Sebastian Seliga was born on 13th Oсtober 1978 in Poland. He graduated in 2005 with MA in Social Psychology. He has worked for leading financial companies in Poland where he actively traded on NYSE, AMEX and NASDAQ exchanges. Sebastian started Forex trading in 2009 and mastered Elliott Wave Principle approach to the markets by developing and implementing his own trading strategies of Forex analysis. Since 2012, he has been writing analitical reviews based on EWP for blogs and for Forex websites and forums. He has developed several on-line projects devoted to Forex trading and investments. He is interested in slow cooking, stand-up comedy, guitar playing, reading and swimming. "Every battle is won before it is ever fought", Sun Tzu
Alexandros Yfantis
 Alexandros was born on September 14, 1978. He graduated from the ICMA Centre, University of Reading with the MSc in International Securities, investment and Banking in 2001. In 2000, Alexandros got the BSc in Economics and Business Finance from Brunel University, UK. In 2004, he began trading on the Greek stock market, where Alexandros got a specialization in international derivatives. Alexandros Yfantis has worked in a top financial company in Greece, responsible for the day-to-day running of the International markets department. He is a certified Portfolio Manager and a certified Derivatives Trader. Alexandros is also a contributor and analyst using Elliott wave and technical analysis of global financial markets. In 2007, he started Forex trading. He loves his profession and believes that entering a trade should always be accompanied by money management rules. His goal is to find profitable opportunities across the markets while minimizing risk and maximizing potential profit. "I'm still learning" Michelangelo
Subscription's options management Theme's: Fundamental analysis, Wave analysis, Technical analysisAuthor's : Ahsan Aslam, Alexandros Yfantis, Arief Makmur, Azeez Mustapha, Dean Leo, Felipe Erazo, Oscar Ton, Hossam Soliman Ali, Michael Becker, Mohamed Samy, Mourad El Keddani, Petar Jacimovic, Rocky Yaman, Sebastian Seliga, Torben Melsted, Viktor Bajer Edit data of subscription settings Unsubscribe from the mailing list
Sincerely,
Analysts Service
If you have any questions, you can make a phone call using one of the
InstaForex Toll free numbers right now:
|
 |

InstaForex Group is an international brand providing online trading services to the clients all over the world. InstaForex Group members include regulated companies in Europe, Russia and British Virgin Islands. This letter may contain personal information for access to your InstaForex trading account, so for the purpose of safety it is recommended to delete this data from the history. If you have received this letter by mistake, please contact InstaForex Customer Relations Department.
|