
Forex analysis review |
- XAG/USD approaching support, potential bounce!
- XAG/USD approaching support, potential bounce!
- XAU/USD approaching support, potential bounce!
- EUR/USD. April 15th. Results of the day. The trade war between the EU and the US is gaining momentum
- GBP/USD. April 15th. Results of the day. Today, the pound did not find reasons for active movements
- Where will the market go in the coming days?
- Carry trade is back in fashion
- GBP/USD: Three important days for the pound
- April 15, 2019 : EUR/USD Intraday technical analysis and trade recommendations.
- April 15, 2019 : GBP/USD facing a confluence of supply levels around 1.3150, will it hold ?
- Elliott wave analysis of GBP/JPY for April 15, 2019
- Elliott wave analysis of EUR/JPY for April 15, 2019
- Weekly review of EUR / USD, GBP / USD pairs: Preparing for the holiday
- Bitcoin analysis for April 15, 2019
- EUR./USD analysis for April 15, 2019
- Analysis of Gold for April 15, 2019
- EUR / USD plan for the US session on April 15. Another unsuccessful attempt to grow the euro
- BITCOIN Analysis for April 15, 2019
- The euro may be happy to grow but there are too many obstacles in its way
- Fundamental Analysis of EURUSD for April 15, 2019
- GBP/USD: plan for the American session on April 15. The pound remains in the wide side channel
- Technical analysis of USD/CAD for April 15, 2019
- Technical analysis of USD/CHF for April 15, 2019
- Dollar declined but will stay in the range (A corrective decline is expected in AUD/USD and USD/JPY pairs)
- The Japanese currency depreciates against the background of positive on the markets
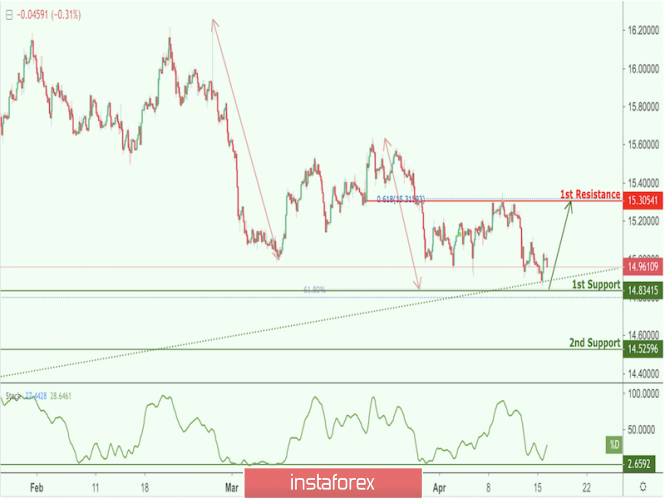
| XAG/USD approaching support, potential bounce! Posted: 15 Apr 2019 07:04 PM PDT XAGUSD is approaching our first support at 14.83 (horizontal pullback support, 61.8% Fibonacci extension , 61.8% retracement , short term ascending line) where a strong bounce might occur to our first resistance at 15.30 (horizontal overlap resistance, 61.8% Fibonacci retracement ). Stochastic is also approaching support where we might see a corresponding bounce in price. Trading CFDs on margin carries high risk. Losses can exceed the initial investment so please ensure you fully understand the risks.
|
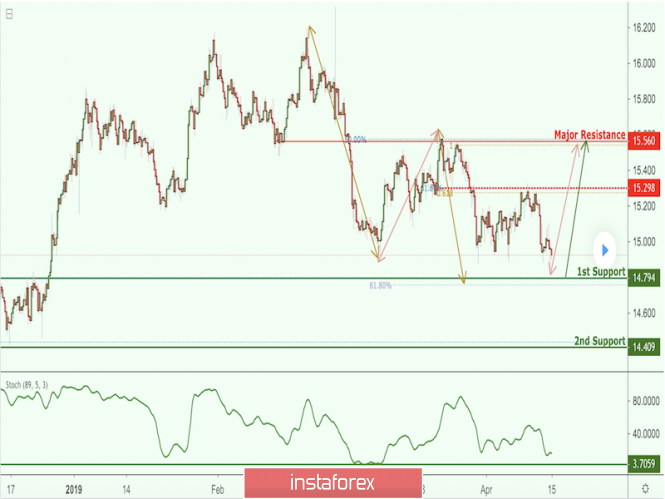
| XAG/USD approaching support, potential bounce! Posted: 15 Apr 2019 06:52 PM PDT XAGUSD is approaching our first support at 14.79 (horizontal pullback support, 61.8% Fibonacci retracement , 61.8% Fibonacci extension ) where a strong bounce might occur to our first resistance at 15.56 (horizontal overlap resistance, 100% Fibonacci extension , 50% Fibonacci retracement ). Stochastic is also approaching support where we might see a corresponding bounce in price. Trading CFDs on margin carries high risk. Losses can exceed the initial investment so please ensure you fully understand the risks.
|
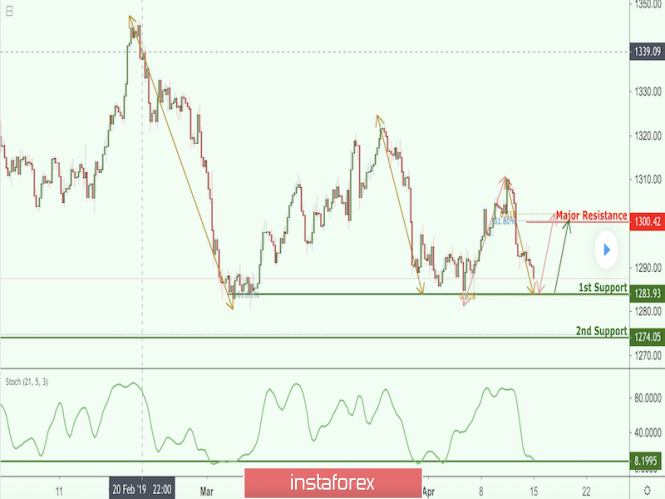
| XAU/USD approaching support, potential bounce! Posted: 15 Apr 2019 06:50 PM PDT XAUUSD is approaching our first support at 1283.93 (horizontal swing low support, 61.8% Fibonacci extension ) where a strong bounce might occur to our first resistance at 1300.42 (61.8% Fibonacci extension , 61.8% Fibonacci retracement ). Stochastic is also approaching support where we might see a corresponding bounce in price. Trading CFDs on margin carries high risk. Losses can exceed the initial investment so please ensure you fully understand the risks.
|
| EUR/USD. April 15th. Results of the day. The trade war between the EU and the US is gaining momentum Posted: 15 Apr 2019 03:34 PM PDT 4-hour timeframe The amplitude of the last 5 days (high-low): 62p - 29p - 58p - 38p - 71p. Average amplitude for the last 5 days: 52p (45p). The first trading day of the week for the EUR/USD pair ended with low volatility and multidirectional movements. Last Friday, the pair quite unexpectedly soared upwards, however, the European currency did not have any fundamental support. Therefore, such a growth from the euro, although logical from a technical point of view, is not logical from a fundamental one. Moreover, in recent days a trade conflict has clearly flared up between the EU and the United States. The prerequisites for its occurrence appeared long before that, as Trump believes that all the other countries that have trade relations with the United States are being "unfair to America." However, earlier, Trump was occupied by China and the sanctions that go along with it. Now, a list of goods that will be taxed has been prepared. A list of European goods. Quite expectedly, the European Commission has prepared its list of goods for the same amount ($11 billion). Thus, in the near future, these duties may start to take effect. However, looking a bit into the future, there is reason to assume that the US will simply introduce more and more new duties in response to the EU's response, as was the case with China. Given the much weaker state of the European economy compared to the US, again, we can assume that the European Union will have to sit down at the negotiating table with Trump sooner or later. So far, the euro is not responding to this news, but it may begin to react, and, most likely, traders will take the side of the US dollar. From a technical point of view, the correction has now begun, but the MACD indicator can move down at this moment. Trading recommendations: The EUR/USD pair adjusted at the beginning of the new week. Thus, it is recommended to open new longs no earlier than the completion of the current correction with a target of 1.1344. The pair's volatility remains low. Sell positions are recommended to be considered in small lots with targets at 1.1252 and the Senkou Span B line no earlier than when you consolidate the price below the Kijun-Sen line. An escalation of the trade war between the EU and the US could lead to overcoming the level of 1.1200 in the future. In addition to the technical picture, one should also take into account the fundamental data and the time of their release. Explanation of the illustration: Ichimoku indicator: Tenkan-sen - the red line. Kijun-sen - the blue line. Senkou Span A - light brown dotted line. Senkou Span B - light purple dotted line. Chikou Span - green line. Bollinger Bands indicator: 3 yellow lines. MACD Indicator: Red line and histogram with white bars in the indicator window. The material has been provided by InstaForex Company - www.instaforex.com |
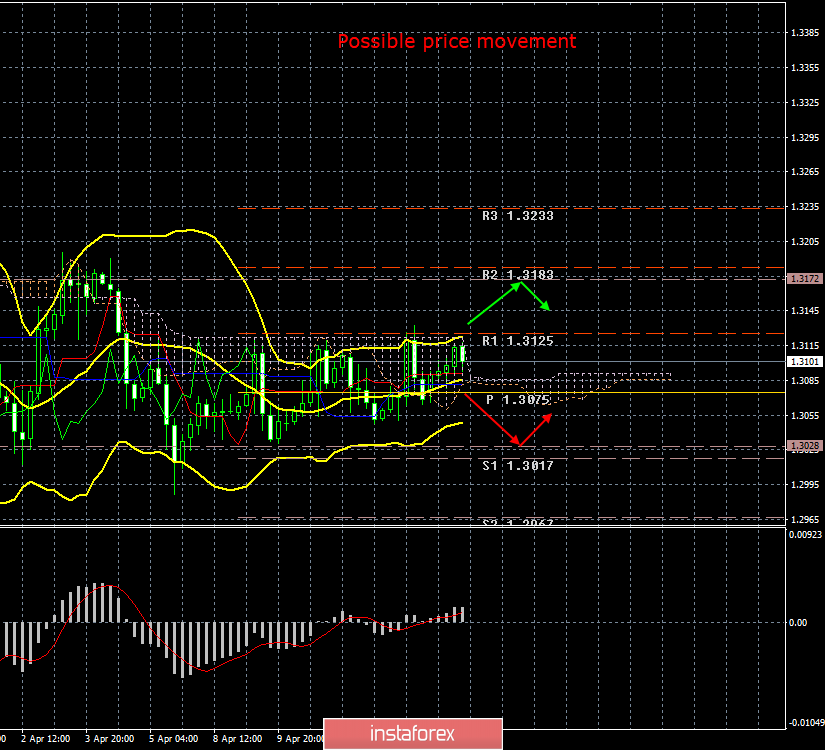
| GBP/USD. April 15th. Results of the day. Today, the pound did not find reasons for active movements Posted: 15 Apr 2019 03:34 PM PDT 4-hour timeframe The amplitude of the last 5 days (high-low): 49p - 91p - 77p - 60p - 82p. Average amplitude for the last 5 days: 72p (82p). On Monday, April 15, the British pound sterling is trying to resume its upward movement, but so far it has again stumbled into a barrier in the form of the Senkou Span B line and the resistance level of 1.3125. Thus, the pair's further upward movement depends on overcoming these resistances. In recent days, the volatility of the GBP/USD pair has greatly decreased, as important news on the Brexit topic has ceased to be available to traders. Moreover, the whole topic of Brexit is put on hold, since it is currently unnecessary to be in a rush with the votes and the adoption of one or another option. There will be no "hard" Brexit in the future, and that is what traders are interested in the most. In the future, it is even possible to hold a second referendum in the UK, which Theresa May does not want. However, if she never succeeds in coming up with anything new, she will have to use any alternative options, since the EU will unlikely agree in constantly postponing Brexit terms. Market participants now only have to trade in a narrow side channel, content with small transactions with the minimum possible profit, or expect the completion of a low-volatility side section. Formally, hopes for an upward movement will appear if the pair succeeds in overcoming the level of 1.3125, but even in this case the probability of this is not very big. No important macroeconomic reports have been received from the UK today. Trading recommendations: The GBP/USD currency pair failed to overcome the Senkou span B line and is still located inside the Ichimoku cloud. Now there is a flat on the pair and we recommend that you wait for its completion before re-opening any positions. In addition to the technical picture, one should also take into account the fundamental data and the time of their release. Explanation of the illustration: Ichimoku indicator: Tenkan-sen - the red line. Kijun-sen - the blue line. Senkou Span A - light brown dotted line. Senkou Span B - light purple dotted line. Chikou Span - green line. Bollinger Bands indicator: 3 yellow lines. MACD Indicator: Red line and histogram with white bars in the indicator window. The material has been provided by InstaForex Company - www.instaforex.com |
| Where will the market go in the coming days? Posted: 15 Apr 2019 03:34 PM PDT The market is now at a crossroads. Possible explosive growth and its further strengthening or decline. This situation developed at the end of the Friday session, when there was an increase in risk appetite. Positive data on China came out, and it was not without Donald Trump, who reiterated his discontent with the Fed's policy. Over the course of many months, assets do not show a pronounced movement. This is due to the fact that traders can not decide what to do with the dollar and other risky currencies. It is worth noting that at the moment the situation for taking risks is more favorable than ever. The global risk index is at the most positive level since the moment preceding the collapse in early 2018. The AUDUSD has been changing its direction for almost the past week, now it is just below the 200-day moving average. Meanwhile, the US stock market is less than 2% of a record peak, and the treasury yields are at reversal levels. Thus, the "10-year" is slightly higher than 2.50%, and the "30-year" is slightly below 3.0%. The yen is showing the most stable downward trend. This became especially noticeable back on Friday morning, when the March lending data in China demonstrated the strength of the stimulus measures it used. The question now is how long will the rally last in the event of a new round of yield growth - especially at the long end of the US curve. Recall that last year, aggressive increases in this indicator preceded significant pullbacks. Continuing growth in US bond yields, even with increased risk appetite, would mean a steady risk rally in an explosive scenario. Traders expect that the stimulus measures of China and the "softness" of the world central banks will support the growth of financial markets. But this will require confirmation from the economic forecasts. Since only a technical reversal of the regime of falling rates is seen in the case of continued growth in the yield of 10-year securities, it is a bit early to talk about an increase in yields. But in any case, this is a stumbling block for the market, it is hardly a coincidence that the US indices are only 2% of the record highs since the autumn of 2018. Plus, this is just before the reporting season. For currencies, continued growth in risk sentiment will coincide with the weakening of the yen, the dollar and the strengthening of the euro. The single currency is reaching up on hopes that stimulating the economy in China will benefit European exports. There is still an opportunity for an important test of $1.1500 by the EURUSD pair. The following data can play an important role in the euro's movement: the economic sentiment index ZEW in Germany (Tuesday) and preliminary PMI (Thursday). On Monday, the EURUSD pair is quoted at slightly above $1.13. There is a risk that the news background will not allow it to stay and continue its upward movement. Some strategists even recommend to bet on selling. Following a recent ECB meeting, market participants received an additional signal that the euro retains its potential to decline. On Saturday at the spring session of the IMF, Mario Draghi confirmed concerns about the growth of the eurozone economy in the second half of the year. The material has been provided by InstaForex Company - www.instaforex.com |
| Carry trade is back in fashion Posted: 15 Apr 2019 03:34 PM PDT In conditions of low volatility, traders once again resort to the help of a carry-trade strategy. Last week, a Bloomberg currency index that measures carry-trade returns from eight emerging markets has increased for the second week in a row. Such dynamics is recorded for the first time in more than two months. At the same time, expected fluctuations in currencies dropped for a second week, according to a JPMorgan Chase & Co volatility indicator. The lack of volatility in the foreign exchange markets suggests that investors need evidence to accelerate the growth of the global economy. Only then will they begin to enter long positions in EM-assets. Buyers' confidence in improving the state of the Chinese economy seems to be increasing every day. But the data on Wednesday, most likely, will show that the growth rate of the second largest economy in the world in Q1 stalled to 6.3%. Investors continue to worry about country risks. In India, Indonesia and South Africa, elections are scheduled, Brazil is still trying to implement pension reforms, and Turkey cannot stop the economic decline and high inflation. Upcoming events On Wednesday, Indonesians will decide whether to give the current president, Joko Widodo a mandate for a second five-year term or to choose another leader. The official count may take several days. Last month, the rupee became the best in Asia after the Philippine peso. In Brazil, traders' attention will be directed to the first congressional vote on the pension reform bill. Any postponement of a political event scheduled for Wednesday will be perceived negatively. Markets will focus on the number of votes that supported the bill. The situation with the speaker of the lower house, Rodrigo Maya, will also be in sight, after local media accused him of bribery. Senior representatives of the Bank of Korea on Thursday will discuss the possibility of a rate cut later this year after an unexpected slowdown in inflation in March. Market participants are already evaluating potential monetary easing. The yields on 3-year government bonds for the first time since 2016 fell below the rate at the end of March. China is in focus Along with the GDP report for Q1, China will publish monthly data on retail sales and industrial production. Investors are waiting for growth rates. In addition, on Wednesday comes the first maturity of the medium-term credit line in the amount of 367.5 billion yuan, or $ 55 billion. According to Chinese analysts, this gives the ideal time to adjust the reserve indicators of banks in case of disappointment with the growth statistics. China's securities should benefit from easing trade tensions with the US. The material has been provided by InstaForex Company - www.instaforex.com |
| GBP/USD: Three important days for the pound Posted: 15 Apr 2019 03:33 PM PDT Brexit again moved into the sluggish stage of internal political negotiations. The events of last week have been left behind, and now this topic is moving, so to speak, to the "background". This suggests that traders of the GBP/USD will now switch to macroeconomic reports, while news on Brexit will complement the general fundamental picture. Over the past two weeks, the pound/dollar pair has repeatedly tested the 31st figure, but buyers could not gain a foothold in this price area. Today, the bulls launched another assault (currently successful), rising to the level of 1.3115. However, today's dynamics are a result of the dollar's weakness than the strengthening of the pound. Against the background of an almost empty economic calendar, traders are trading under the impression of Friday's releases: news from China has increased the risk-taking and eased concerns about the slowdown in the global economy. I recall that Chinese exports in dollar terms rose by 14% in March after a significant decrease of 20% the previous month. In addition, the volume of bank lending has also increased significantly: last month this figure doubled compared with the previous period, reaching almost 1.7 trillion yuan, or more than $250 billion. In addition, the financial world responds positively to the desire of parties to resolve global trade conflicts. We are not talking only about the negotiations between Beijing and Washington. Just today, the ministers of the European Union countries approved the decision to start negotiations with the United States on trade issues: in particular, the parties will discuss issues of reducing reciprocal tariffs on industrial goods. This question has long been hanging in the air because of the position of the French, who did not want to start a dialogue with the Americans in connection with Washington's decision to withdraw from the Paris Climate Agreement. By and large, the world was on the verge of a new trade war - the United States increasingly expressed dissatisfaction about delaying the beginning of negotiations, and the US president announced that if the talks failed, the US would impose duties on European cars. Now the situation has shifted from a dead end, and this fact complemented the optimistic picture of today. All of the above factors contributed to the GBP/USD pair's growth for today – but only due to the devaluation of the US currency. But in the coming days, the pound can independently assert itself – if only the key macroeconomic reports come out in the "green zone". This week is full of important events. Thus, tomorrow (Tuesday), there will be published data on the UK labor market, on Wednesday we learn the dynamics of inflation in Britain, and on Thursday – the volume of retail sales. In addition, on the penultimate trading day, we will listen to Bank of England Governor Mark Carney, who will speak at the economic conference in Paris. In general, experts are waiting for the recovery of key macroeconomic indicators in Britain. In particular, the unemployment rate should remain at a record low, 3.9%, and the increase in the number of applications for unemployment benefits will show a more modest trend compared to the previous month. Most importantly – further growth of wages is expected. If the January figure fell to 3.4%, thus interrupting the semi-annual growth of the indicator, in February the index should return to 3.5%. Perhaps, among all the components, this is the most important indicator that will have a significant impact on the dynamics of the GBP/USD pair. But the consumer price index should demonstrate a contradictory trend: on a monthly basis, it should slow down to 0.2% (after rising to 0.5%), and in annual terms, it could grow to a two percent mark. Core inflation should also rise, to 1.9% (1.8% in February). If the above forecasts are justified, then the pound will receive support due to the growth of annual and core inflation against the background of rising wages. The retail price index should complement the optimistic picture, rising to 2.6% (on an annualized basis). In the end, on Thursday, data on the growth of retail sales in Britain will be released. If this figure comes out at the level of preliminary forecasts, it will update almost two-year highs: in annual terms, it should jump to 4.6%. On a monthly basis, the indicator may slow down a bit, but in this case it will not be as important. Thus, the pound is waiting for the most important economic reports. Traders took a deep breath after the negotiating epic in Brussels, and now British macroeconomic data is coming to the fore. If the real numbers coincide with the announced forecasts, the pound will receive support throughout the market, and the GBP/USD pair will not be an exception. This will make it possible for the pair to test the next resistance level of 1.3170 (Kijun-sen line on the daily chart). Otherwise, the price will roll back to the support level of 1.2980 - this is the bottom line (Bollinger Bands on the same timeframe). The material has been provided by InstaForex Company - www.instaforex.com |
| April 15, 2019 : EUR/USD Intraday technical analysis and trade recommendations. Posted: 15 Apr 2019 09:37 AM PDT
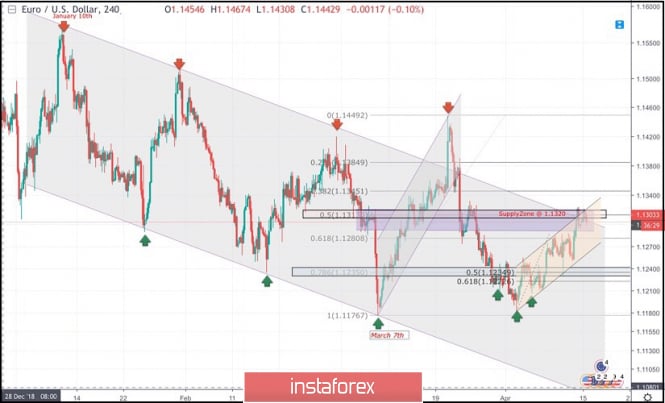
On January 10th, the market initiated the depicted bearish channel around 1.1570. Since then, the EURUSD pair has been moving within the depicted channel with slight bearish tendency. On March 7th, recent bearish movement was demonstrated towards 1.1175 (channel's lower limit) where significant bullish recovery was demonstrated. Bullish persistence above 1.1270 enhanced further bullish advancement towards 1.1290-1.1315 (the Highlighted-Zone) which failed to provide adequate bearish pressure. On March 18, a significant bullish attempt was executed above 1.1380 (the upper limit of the Highlighted-channel) demonstrating a false/temporary bullish breakout. On March 22, significant bearish pressure was demonstrated towards 1.1280 then 1.1220. Two weeks ago, a bullish Head and Shoulders reversal pattern was demonstrated around 1.1200. As expected, this enhanced further bullish advancement towards 1.1300-1.1315 (supply zone) where recent bearish rejection was being demonstrated. Short-term outlook turns to become bearish towards 1.1280 (61.8% Fibonacci) where price action should be watched cautiously. For Intraday traders, the price zone around 1.1280 stands as a prominent demand area to be watched for a possible BUY entry if enough bullish rejection is expressed. On the other hand, bearish breakdown below 1.1280 opens the way for further bearish decline towards 1.1250-1.1235. Trade recommendations : Conservative traders can look for a valid SELL entry around 1.1300-1.1320. TP levels to be located around 1.1280 and 1.1250 and 1.1210. SL should be placed above 1.1350. The material has been provided by InstaForex Company - www.instaforex.com |
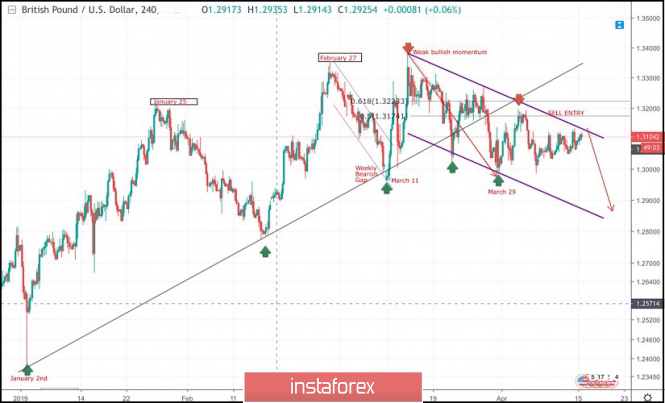
| April 15, 2019 : GBP/USD facing a confluence of supply levels around 1.3150, will it hold ? Posted: 15 Apr 2019 09:20 AM PDT
On January 2nd, the market initiated the depicted uptrend line around 1.2380. This uptrend managed to initiate two successive bullish waves towards 1.3200 (Jan. 25) then 1.3350 (Feb. 27) before the bearish pullback brought the GBPUSD pair towards the uptrend on March 8th. A weekly bearish gap pushed the pair below the uptrend line (almost reaching 1.2960) before the bullish breakout above short-term bearish channel was achieved on March 11. Shortly after, the GBPUSD pair demonstrated weak bullish momentum towards 1.3200 then 1.3360 where the GBPUSD failed to achieve a higher high above the previous top achieved on February 27. Instead, the depicted bearish channel was established. Significant bearish pressure was demonstrated towards 1.3150 - 1.3120 where the depicted uptrend line failed to provide any bullish support leading to obvious bearish breakdown. On March 29, the price levels of 1.2980 (the lower limit of the depicted movement channel) demonstrated significant bullish rejection. This brought the GBPUSD pair again towards the price zone of (1.3160-1.3180) where the upper limit of the depicted bearish channel as well as the backside of the depicted uptrend line came to meet the pair. Currently, the price zone of 1.3140-1.3170 currently corresponds to the upper limit of the depicted bearish channel where another bearish movement may be initiated. Bearish rejection is still anticipated around the mentioned price levels (1.3140-1.3170). Bearish decline is expected towards 1.2920-1.2900 where the lower limit of the depicted channel is located. Trade Recommendations: Bullish pullback towards 1.3150-1.3170 should be considered for another SELL entry. TP levels to be located around 1.3100, 1.3020 then 1.2950 - 1.2920. S/L to be located above 1.3190. The material has been provided by InstaForex Company - www.instaforex.com |
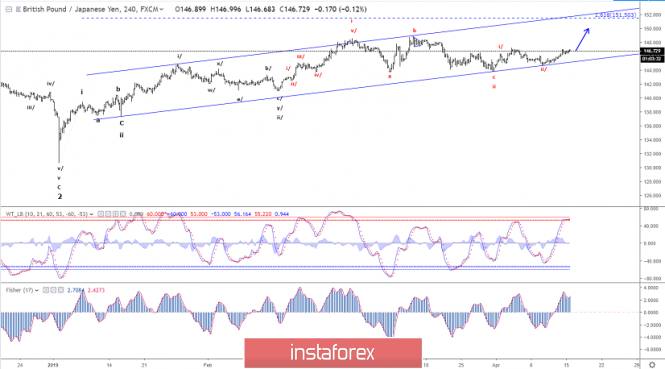
| Elliott wave analysis of GBP/JPY for April 15, 2019 Posted: 15 Apr 2019 09:08 AM PDT
We continue to look for a clear break above minor resistance at 147.00 for a continuation higher towards 148.50 on the way to 151.50. Support is now seen at 146.25 which we expect will be able to protect the downside for a firm break above 147.00. R3: 148.05 R2: 147.40 R1: 147.00 Pivot: 146.65 S1: 146.25 S2: 146.00 S3: 145.66 Trading recommendation: We are long on GBP from 146.25 with our stop placed at 144.80. The material has been provided by InstaForex Company - www.instaforex.com |
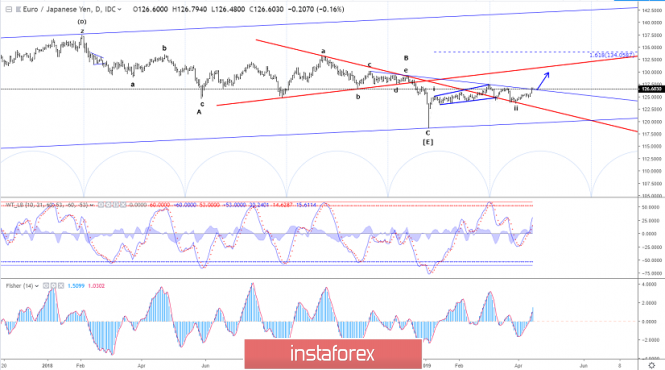
| Elliott wave analysis of EUR/JPY for April 15, 2019 Posted: 15 Apr 2019 09:04 AM PDT
EUR/JPY has broken clearly above the minor resistance line at 125.91 and, what is more important, it breached the resistance line near 126.00. So, it indicates more upside movement to come. The next major target is seen near 129.50, but this resistance should only be able to cap the upside temporally as a further rise is still expected for this cross towards 135.50. Support is now seen at 126.45 and again at 125.65. R3: 127.50 R2: 127.00 R1: 126.75 Pivot: 126.45 S1: 126.00 S2: 125.65 S3: 125.40 Trading recommendation: We are long on EUR from 125.65 and we will move our stop higher to 125.25. The material has been provided by InstaForex Company - www.instaforex.com |
| Weekly review of EUR / USD, GBP / USD pairs: Preparing for the holiday Posted: 15 Apr 2019 08:59 AM PDT Frankly, the past week was just crazy, especially because of the incessant Brexit, which seems to be postponed just in operation. But much more interesting is that it is completely different since the pound remained in the same positions from which it began. However, the single European currency could be well strengthened. Hence, the European Union gave the UK a new respite as they gather for an extraordinary Brexit summit and after listening to all the outcry and lamentations of Theresa May on the obstinate Labor Party, who are forever blocking the adoption of the most remarkable divorce agreement in the history of mankind. Just so that the "Iron Lady - 2" was able to win over Jeremy Corbin with his "accomplices and here such a song began immediately, that you wonder. Absolutely all the means of mass agitation and disinformation began to shout that Britain was given a reprieve right up to October 31st. Along the way, they began to look for some kind of mystical signs and omens in it as they noticed that it was Halloween. But in fact, the United Kingdom was given a delay only until March 23 and prior to this date, the UK will sign the agreement. This resettlement will take place exactly on October 31 with all the necessary procedures and transitional periods. It is either the UK must take part in the elections to the European Parliament, which is at odds with the very idea of Brexit and will obviously not completely understood by both Her Majesty's subjects and Theresa May's political partners. . Virtually no one doubts that if the UK participates in elections to the European Parliament, the political crisis in the United Kingdom will only intensify. Just as in the case of the cancellation of Brexit or holding a second referendum. In other words, the conditions set by the European Union are not very different from those that they used to be, only the UK should now sign the agreement exactly for the European elections. Otherwise, either they go without an agreement, with all the consequences or get a political crisis that threatens to bury the entire political class in the United Kingdom. Thus to some extent, a certain uncertainty of the pound can be understood and of course, against the background of such epoch-making events that have good chances to go down in history, nobody paid attention to data on industrial production in the UK, which stopped falling by 0.3% and showed an increase of 0.1%. But much more interesting is all of what happened with the single European currency. It grew after all and if you blame it on the euphoria of the decision of the European Union about Brexit, then the question remains - what happened to the pound then? Moreover, it is still more fun if you look at the US statistics, especially on inflation and producer prices. After all, inflation accelerated from 1.5% to 1.9% and the growth rate of producer prices from 1.9% to 2.2%, whereas it was predicted that inflation would rise to only 1.8%. Instead, the growth rates of producer prices should have remained unchanged. Yet, the answer lies in the content of the text of the minutes of the meeting of the Federal Commission on Operations on the open market, which almost directly states that the refinancing rate will be raised next year. However, when the meeting was held, inflation showed a downward trend on the contrary, which was reflected in the form of fears of the leadership of the Federal Reserve System. Hence, we can safely assume that the rhetoric of Jerome Powell will soon change to the joy of investors, large and small. Apparently, no one wants to think and risk so far. However, the answer to the question about the bad behavior of the single European currency, which most likely lies in Europe itself and more precisely in the results of the board meeting of the European Central Bank. Naturally, Mario Draghi was extremely cautious in his statements and confirmed once again that before the start of the next year one should not wait for the refinancing rate to increase. Also, the head of the European Central Bank did not answer the question of how long the regulator intends to distribute long-term loans to banks, which are designed so that these same banks could calmly return to Mario Draghi the money they received during the years of the quantitative easing program. It is like theory and practice again diverge. It can be said with all certainty that this is an official statement saying that the European Central Bank has headed for a gradual normalization of monetary policy or then to tighten if it is absolutely needed. Of course, one cannot ignore the latest rumors about how negotiations between the United States and China are going on regarding a full-scale trade agreement. In many ways, this is precisely what explains the growth of the single European currency while the standing of the pound is explained by a complete lack of understanding of what will happen to Brexit in the end. The thing is that the trade agreement should have already been signed at the end of April, according to the assurance of the same mass agitation and disinformation. The trade agreement should have already been signed at the end of April but negotiations continue. It seems that on most issues the parties found a compromise and this is encouraging. Consequently, the world can avoid a full-scale trade war between the two largest economies in the world. After all, such a conflict will inevitably affect all countries of the world. Even the artillery preparation, with which the United States and China arranged in the form of a mutual increase in duties on a number of goods, has greatly frightened all those who were not involved since these measures affected many countries of the world. Increased optimism about the successful conclusion of negotiations reduces risks globally, which contributes to the growth in demand for assets of developing countries and not only to them. In general, American investors are more inclined to invest outside the United States, which adversely affects the dollar. With the pound, everything is much more fun and joyful as is often the case. At first, the labor market data may show that the average wage growth rate accelerated from 3.4% to 3.5%, taking into account premiums. All other indicators may remain unchanged and from this, it follows that employees are willing to work more, which always pleases investors. Also, inflation in the United Kingdom should accelerate from 1.9% to 2.0%. But that's not all, as the growth rate of retail sales should accelerate from 4.0% to 4.6%, which coupled with rising inflation resulted in the rosy dream of any investor in general. Hence, the pound may be late in pursuing the single European currency and rising to 1.3150. |
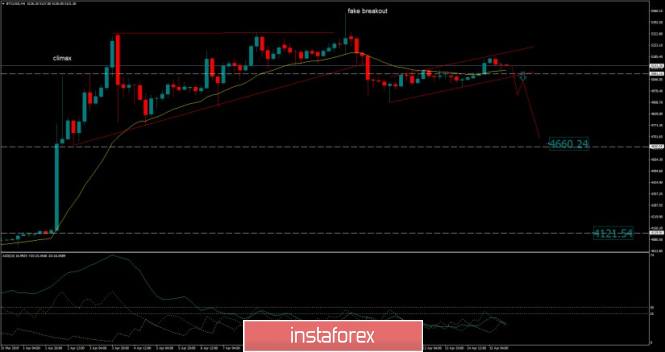
| Bitcoin analysis for April 15, 2019 Posted: 15 Apr 2019 06:28 AM PDT BTC has been trading sideways at the price of $5.131. We are still expecting more downside on the BTC.
According to the H4 time-frame, we found that bearish flag is in creation just after the BTC did break the support trendline, which is sign that potential distribution of orders may appear. Our advice is to watch for the breakout of the support trendline to confirm further downward movement. Support levels are seen at the price of $4.660 and at the price of $4.121. Trading recommendation: We are bearish on the BTC from $5.130 with the targets at $4.660 and $4.121. Protective stop is placed at $5.460. The material has been provided by InstaForex Company - www.instaforex.com |
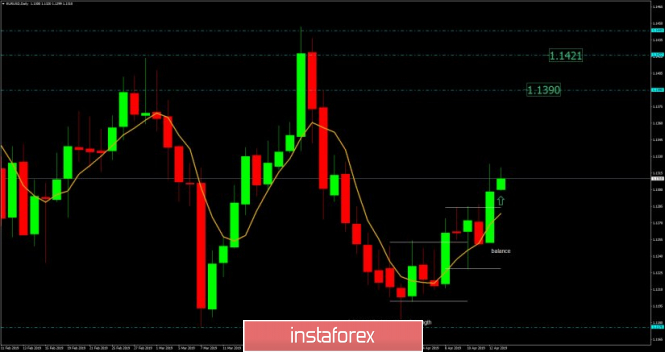
| EUR./USD analysis for April 15, 2019 Posted: 15 Apr 2019 06:21 AM PDT EUR/USD has been trading upwards. The price tested the level of 1.1320. We are expecting more upside continuation on the EUR/USD.
According to the Daily time-frame, we found that there is the breakout of the 4-day balance in the background and key resistance at the price of 1.1286, which is sign that buyers are in control and that there is demand for the EUR currency. Also, in the background, there is the fail test of the key low at 1.1176, which is another sign of the strength. Trading recommendation: We are bullish on the EUR from 1.1300 with the targets at 1.1390 and 1.1420. Protective stop is placed at 1.1225. The material has been provided by InstaForex Company - www.instaforex.com |
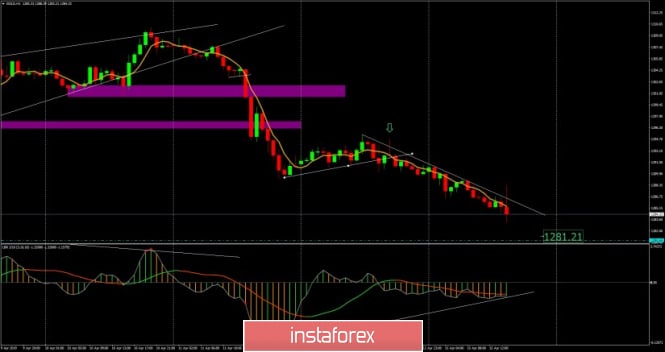
| Analysis of Gold for April 15, 2019 Posted: 15 Apr 2019 06:09 AM PDT Gold has been trading downwards. As we expected, the price tested the level of $1.283.20. The gold is approaching the key short-term support at the price of $1.281.00, selling at this stage looks risky.
According to the H1 time-frame, we found that sellers are in control but that key support at the price of $1.281.20 is very close to current price, which is sign that selling looks risky. We found bullish divergence on the LBR oscillator in creation, which is sign that potential rally might happen. Supply line is holding for now but the upward breakout may confirm further rally. Resistance levels are seen at the price of $1.289.20 and $1.295.00. Key support is seen at the price of $1.281.20. Trading recommendation: We closed our short position from $1.290.80 and we made 0.6% profit. We are neutral on the Gold now but we will observe key support at $1.281.20 to see how the price will reacti around that level. The material has been provided by InstaForex Company - www.instaforex.com |
| EUR / USD plan for the US session on April 15. Another unsuccessful attempt to grow the euro Posted: 15 Apr 2019 06:05 AM PDT To open long positions on EUR / USD pair, you need: Buyers of the European currency failed to break through the resistance of 1.1319, which I paid attention to in the morning review. Only after a breakthrough of this range can we talk about the continuation of the upward trend in the area of highs at 1.1358 and 1.1388, where I recommend taking profits. In case that the downward correction of the EUR/USD pair moves further to the support area of 1.1294, it is best to consider buying EUR/USD from this range but provided that a false breakdown is formed. On the other hand, larger long positions are best to open on a rebound from the lows of 1.1265 and 1.1232. To open short positions on EUR / USD pair, you need: The failure to consolidate above the resistance of 1.1319 in the first half of the day led to the return of euro sellers to the market, whose first goal is to reduce to the support area of 1.1294. A repeated test of this level may lead to a larger sale of EUR / USD to the minima at the area of 1.1265 and 1.1232, where I recommend taking profits. If the EUR / USD growth scenario takes place above 1.1319, the divergence will continue to form on the MACD indicator, which allows short positions to be considered on a rebound from both highs at 1.1358 and 1.1388. More in the video forecast for April 15 Indicator signals: Moving averages Trade is conducted in the region of 30 and 50 moving averages, which indicates a slowdown in the upward correction of the euro. Bollinger bands In the event of a decline in the euro in the afternoon, the support will be provided by the lower limit of the Bollinger Bands indicator around 1.1294. Against it will lead to a larger wave of euro decline. Description of indicators MA (moving average) 50 days - yellow MA (moving average) 30 days - green MACD: fast EMA 12, slow EMA 26, SMA 9 Bollinger Bands 20 The material has been provided by InstaForex Company - www.instaforex.com |
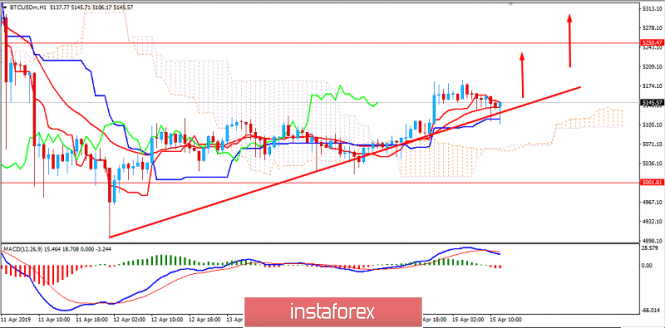
| BITCOIN Analysis for April 15, 2019 Posted: 15 Apr 2019 05:59 AM PDT Bitcoin is currently trapped in a trading range from $5,000 to $5,250. Recently, the price managed to gain certain bullish momentum after a drastic dip towards $5,000. The price maintains the trend line which is holding the price as support from where the price is going to push higher with a target towards $5,250. Later if a daily close is seen above this level, then further upward pressure is expected. The price above the Kumo Cloud may fluctuate and correct itself as the volatility still persists. For clearly impulsive bullish pressure, a break above $5,250 is required. Holding above $5,000 indicates a further bullish bias with a target towards $5,500 and later towards $6,000 in the future. SUPPORT: 4,800-80, 5,000 RESISTANCE: 5,250, 5,500 BIAS: BULLISH MOMENTUM: VOLATILE
|
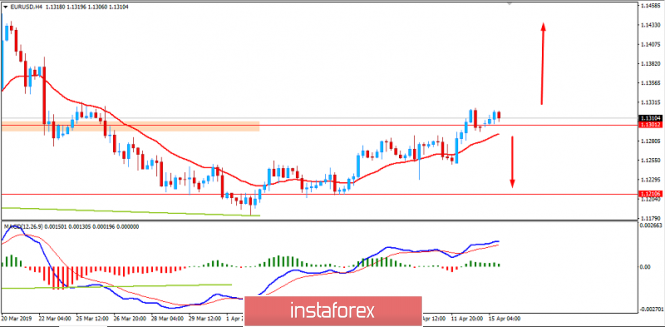
| The euro may be happy to grow but there are too many obstacles in its way Posted: 15 Apr 2019 05:49 AM PDT
Even despite the pessimistic notes that were present in the speech of the ECB President Mario Draghi following the regular meeting of the regulator on Wednesday, April 10, the common European currency managed to play about 100 points from the greenback and rise above $1.13 for the first time since March 26. Today, EUR/USD continues to trade over this mark. According to experts, the growth of EUR/USD was due to the postponement of Brexit, as well as the fact that the statistics for the eurozone published last week was better than the forecast. Thus, according to Eurostat, in February the volume of industrial production in the euro area decreased by 0.2% in monthly terms and by 0.3% in annual terms. Analysts expected that the first indicator will decrease by 0.6%, and the second – by 1%. However, this may not be enough to maintain optimism regarding the euro. First, the degree of trade tension between the United States and the Old World is rising. In response to Washington's threats to impose duties on European goods worth $11 billion, Brussels has already prepared a "list of retaliation" worth more than $12 billion. Secondly, the business activity indices in the manufacturing sector of Germany and the currency bloc as a whole, which will be released this Thursday, can confirm that the industry is no longer a driver for the growth of European GDP. The mood of traders can also spoil the data on business optimism from ZEW and the level of inflation in the euro area, which will be released this week Thus, in the case of worsening statistics, the "bears" on EUR/USD can revive again. It is assumed that if not immediately, then at least until the end of the month, the pair may go down, trying to test the April lows again in the 1.1180 area. However, before heading south, EUR/USD may reach the level of 1.1350. It is expected that in the medium term, the pair will decline against the background of the increasing difference in the economic performance of the eurozone and the United States, as well as due to the varying degree of "softness" of the monetary policy of the Fed and the ECB. The material has been provided by InstaForex Company - www.instaforex.com |
| Fundamental Analysis of EURUSD for April 15, 2019 Posted: 15 Apr 2019 05:45 AM PDT Despite the previous gains of the greenback, the euro has managed to gain a sustainable momentum recently which is expected to lead to the further bullish movement of the pair, even though the eurozone is being affected by the economic slowdown. The eurozone is currently looking forward to setting the trade talks with the United States releasing the pressure of Brexit after the delay till October was agreed. The European Union gave the green light to start the trade negotiations with the US to agree on trade tariffs between them. Negotiations are anticipated to start quite soon, though certain tensions on both sides are still there. Thus, the US has already accused the EU of not acting in good faith and delaying the talks. Recently, European Commissioner Pierre Moscovici spoke about the eurozone's budget noting that it needs to be more developed and realistic. Even though the first step has been already done, a proper budget which can withstand economic shocks is currently the biggest need of the European economy. Ahead of the Flash Services and Manufacturing PMI reports from France, Germany, and the eurozone, this week is expected to bring positive results that may lead to further gains in the coming days if the expectations are met. On the USD side, the Consumer Price Index for All Urban Consumers of the USA has increased by 0.4% in March on a seasonally adjusted basis after a rise of 0.2% in February. Notably, the all items index has increased by 1.9 percent before the seasonal adjustment over the last 12 months. In the FOMC minutes of the previous weeks, the FED discussed the options to end the reduction in the Federal Reserve's securities holdings by the end of September 2019. The Fed also expected the GDP to show a significant bounce in the second quarter of 2019 together with strong data from the Labor Market. Moreover, the further interest rate hike depending on the economic conditions was discussed as well. The unemployment rate was 3.8% in February, while the declining industrial production rebounded in the same month. The manufacturing output has also decreased during the last 2 months. Today FOMC member Evans is going to speak about the further monetary policy and short-term interest rate decision. However, it is not likely to trigger any major changes in the US dollar's movement. The Empire State Manufacturing Index is expected to increase to 8.1 from the previous figure of 3.7. Ahead of Thursday's Retail Sales report which is expected to show a rise to 0.9% from the previous value of -0.2%, certain volatility and correction may take place, while meeting the expectation will lead to impulsive momentum on the greenback's side. Yet, it does not promise to be stable considering this week's economic reports. Now, let us look at the technical view. The price is currently residing above the 1.1300 area with a daily close which indicates the further bullish sentiment in the coming days. It is likely to lead the price towards 1.1450 and then to 1.1500 resistance area. The bullish bias is expected to continue as long as the price remains above the 1.1200 area. On the other side, a breakout below 1.1300 with a daily close will slow the upward movement, but the sentiment will still be bullish.
|
| GBP/USD: plan for the American session on April 15. The pound remains in the wide side channel Posted: 15 Apr 2019 05:36 AM PDT To open long positions on GBP/USD you need: Buyers of the pound managed to form a false breakout from the support level of 1.3085, which I paid attention to in my morning review. Now their task is to break and consolidate above the upper limit of the side channel 1.3130, which will allow to resume the uptrend and update new highs in the area of 1.3160 and 1.3195, where I recommend fixing the profit. In the scenario of a repeated decline of the pound in the afternoon, long positions are best to return to the rebound from the lower border of the channel in the area of 1.3052. To open short positions on GBP/USD you need: We see that the average border of the wide side channel, which I paid attention to in my morning review, is quite blurred, so it is best to open short positions on the pound after the test of the upper limit of 1.3130 or a rebound from the new weekly maximum in the area of 1.3160. The main goal of the sellers will be to reduce to the lower border of the channel to the area of 1.3052 and update the minimum in the area of 1.3021, where I recommend fixing the profit. Indicator signals: Moving Averages Trading is conducted in the area of 30 and 50 moving averages, which indicates the lateral nature of the market. Bollinger bands In the scenario of the pound decline, the lower border of the Bollinger Bands indicator in the area of 1.3065 will act as support. The break of the upper border at 1.3115 may strengthen the demand for GBP/USD. Description of indicators
|
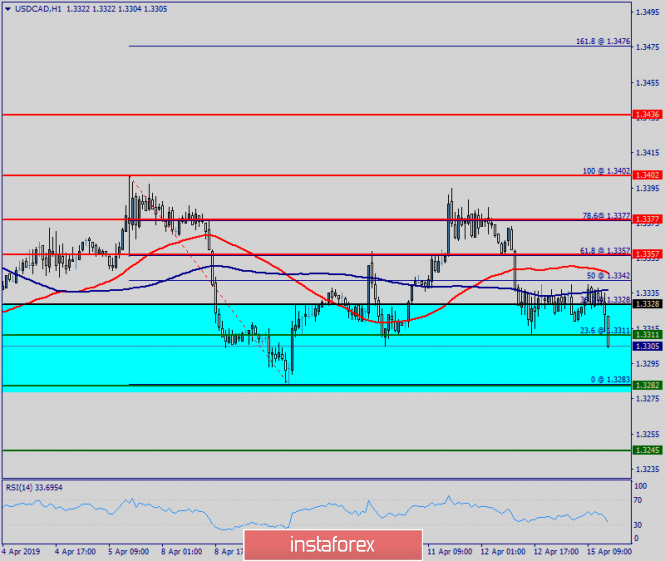
| Technical analysis of USD/CAD for April 15, 2019 Posted: 15 Apr 2019 05:29 AM PDT Overview: Pivot point: 1.3328. The USD/CAD pair continues to move upwards from the level of 1.3228. Yesterday, the pair rose from the level of 1.3228 (the level of 1.3228 coincides with a ratio of 38.2% Fibonacci retracement) to a top around 1.3357. Today, the first support level is seen at 1.3228 followed by 1.3311, while daily resistance 1 is seen at 1.3377. According to the previous events, the USD/CAD pair is still moving between the levels of 1.3228 and 1.3402; for that we expect a range of 174 pips (1.3402 - 1.3228). On the one-hour chart, immediate resistance is seen at 1.3357, which coincides with the double top. Currently, the price is moving in a bullish channel. This is confirmed by the RSI indicator signaling that we are still in a bullish trending market. The price is still above the moving average (100), Therefore, if the trend is able to break out through the first resistance level of 1.3357, we should see the pair climbing towards the daily resistance at the levels of 1.3377 and 1.3402. It would also be wise to consider where to place stop loss; this should be set below the second support of 1.3282. The material has been provided by InstaForex Company - www.instaforex.com |
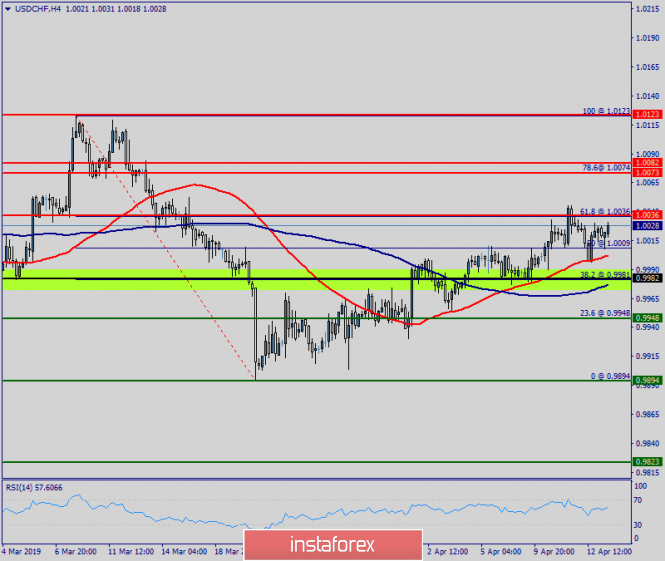
| Technical analysis of USD/CHF for April 15, 2019 Posted: 15 Apr 2019 05:26 AM PDT Overview: The USD/CHF pair continues moving in a bullish trend from the support levels of 0.9895 and 0.9948. Currently, the price is in an upward channel. This is confirmed by the RSI indicator signaling that the pair is still in a bullish trend. As the price is still above the moving average (100), immediate support is seen at 0.9948 coinciding with a golden ratio (23.6% of Fibonacci). Consequently, the first support is set at the level of 0.9948. So, the market is likely to show signs of a bullish trend around 0.9948. In other words, buy orders are recommended above the golden ratio (0.9948) with the first target at the level of 0.9983. Furthermore, if the trend is able to breakout through the first resistance level of 0.9983, we should see the pair climbing towards the double top (1.0036) to test it. It would also be wise to consider where to place a stop loss; this should be set below the second support of 0.9895. The material has been provided by InstaForex Company - www.instaforex.com |
| Posted: 15 Apr 2019 05:17 AM PDT As a result of last week, the US dollar fell against the major currencies for the exception of traditional safe-haven currencies, particularly the Japanese yen and the Swiss franc. Coordinated movements of major currencies in tandem with the US dollar are explained by the same investors' expectations for which the Fed's proposed actions regarding the monetary policy outlook are still a guide. This is a high probability that the regulator will continue to wait for the national economy, as well as globally. Also, a significant role in easing the US dollar is played by postponing Brexit until October of this year. Although it retains a factor of uncertainty, it increases the hopes of supporters of maintaining Britain in the EU, which has a positive effect on the pound sterling rate. One more weighty and negative reason for the dollar is the preservation of hopes that negotiations on trade between Washington and Beijing will be achieved. And again, although they are not expected to do something super positive, the mere fact of stopping the escalation of a trade conflict and the introduction of contractual trade into a certain course is already positive for financial markets and supports the demand for risky assets, which also contributes to the appreciation euro currencies and commodity group currencies. In this regard, it is important to understand whether the further weakening of the dollar will continue. In our opinion, despite the statements by the Fed and many members of the Central Bank including the head Jerome Powell himself, who argued that the rates will not rise anymore, there is a possibility that inflationary pressure will increase. In any case, the inflation data published last week showed a sharp upward jump. Moreover, we can assume here that if it continues to rise then the Fed will have to raise rates at least once more this year. The Fed understands this and likely to pause while continuing to monitor the situation. Assessing the overall picture, we believe that the lateral dynamics in the foreign exchange market will continue for some time. Forecast of the day: The AUD/USD pair was adjusted downward after reaching a local maximum. If it stays below the level of 0.7175 and drops below the level of 0.7160, there is a probability of continuing the correction to 0.7125. The USD/JPY pair also had a downward correction as it was below the level of 112.00 and largely fell to 111.55, which will correspond to 23% Fibonacci retracement. Overcoming this mark will lead to a continuation of the fall to 111.30. |
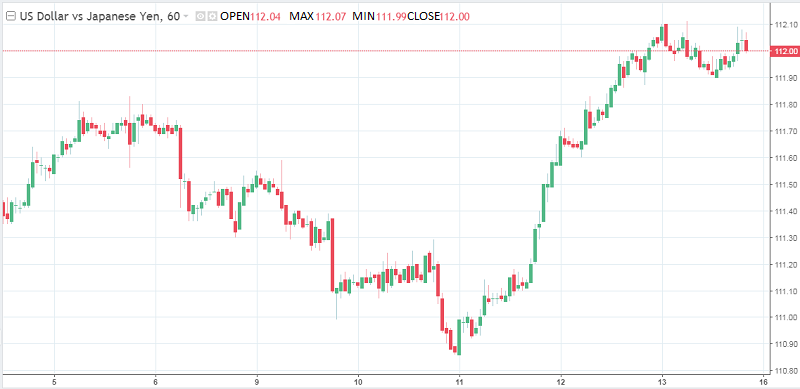
| The Japanese currency depreciates against the background of positive on the markets Posted: 15 Apr 2019 05:06 AM PDT
On Monday, April 15, the national currency of Japan is trading near the annual minimum. The reasons for this, experts believe, are an improvement in the situation on world markets and a positive start to the corporate profits season in the USA. Recall that the yen is traditionally a safe asset that loses its position against the background of relative well-being in the global market. At the moment, the USD/JPY rate in Asian trading reached a maximum of 112.10 and then dropped to 111.93. The Swiss franc, which is also considered an asset of the safe zone, has fallen in price against the European currency. According to statistics released by Chinese authorities last Friday, the Celestial Empire faced a sharp increase in exports. At the same time, there was a significant increase in the volume of new bank loans in the country. The volume of imports of China remains weak, experts emphasize. Current statistics have strengthened investors in the opinion that the slowdown in the Chinese economy has already reached the worst point. In general, there are positive sentiments in the global market. Last Friday, the US stock market showed strong growth. The reasons for this were the strong earnings report of the largest bank JPMorgan and the rise in prices for TheWalt Disney Co. by 11.5%. As a result, the S & P 500 broad market index has reached record levels in the past six months. This became a catalyst for the growth of positive sentiment in Asian markets, analysts believe. According to estimates by a number of currency market experts, the potential for strengthening the US dollar is limited in this situation. According to Minori Uchida, a leading analyst at MUFG Bank, at the moment market players hold a large volume of long positions in US currency. According to the calculations of the US Futures Trading Commission, the balanced long position on the US dollar against the yen is at its highest level in the last three months. |


| You are subscribed to email updates from Forex analysis review. To stop receiving these emails, you may unsubscribe now. | Email delivery powered by Google |
| Google, 1600 Amphitheatre Parkway, Mountain View, CA 94043, United States | |
No comments:
Post a Comment