Forex analysis review |
- Control zones GBPUSD 07/31/19
- Fractal analysis of major currency pairs on July 31
- Even if D. Trump declares a "crusade" against the dollar, it's not a fact that the Fed will join him
- Fed: Investors will be disappointed
- The "heavy" sale of the pound spread to Tuesday, aiming for 1.20
- EUR/USD. Calm before the storm: the pair froze in the flat against the background of conflicting data
- Oil: "bears" went too far
- July 30, 2019 : GBP/USD Intraday technical analysis and trade recommendations.
- July 30, 2019 : EUR/USD demonstrates short-term bullish outlook above 1.1115.
- EURUSD: Another "portion" of economic data indicates the probability of interest rate reduction. Chinese authorities provoke
- GBP/USD: plan for the American session on July 30. Correction for the pound is unlikely to be very long
- EUR/USD: plan for the American session on July 30. Inflation in Germany gave a break to buyers of the euro
- EUR/USD ready to decline even lower
- Technical analysis of EUR/USD for July 30, 2019
- Technical analysis of AUD/USD for July 30, 2019
- BTC 07.30.2019 - Bearish flag in creation
- Gold 07.30.2019 - Key resistance at the price of $1.430 on the test
- USD/JPY analysis for July 30, 2019 - Downward momentum, more downside yet to come
- Trading recommendations for the EURUSD currency pair - placement of trading orders (July 30)
- Brent crude seeks to the top with the goal of $65
- Analysis of BITCOIN for July 30, 2019
- GBP/USD might reverse soon
- Analysis of EUR/TRY for July 30, 2019: price to push lower towards 6.00 again?
- Analysis of EUR/USD for July 30, 2019
- GBP / USD: Will the Bank of England see a pound?
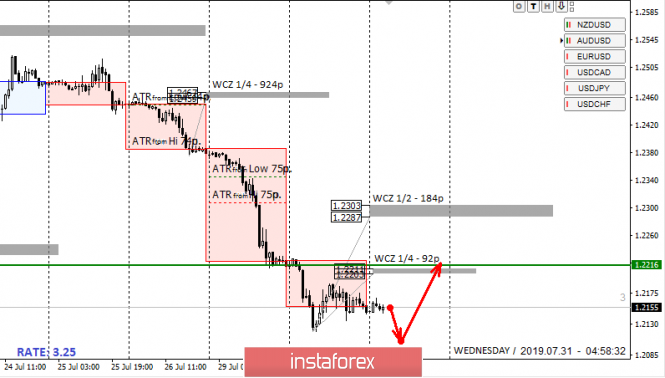
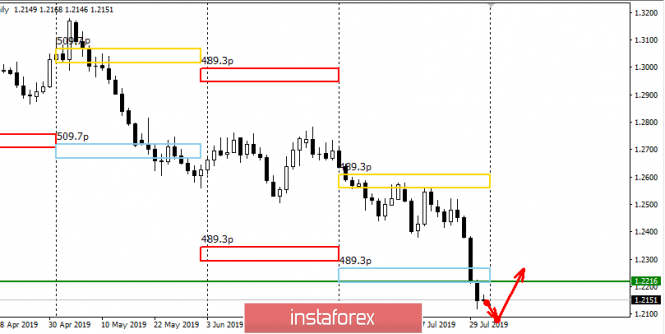
| Posted: 30 Jul 2019 07:47 PM PDT Today, the pair is trading outside the monthly CZ of July and the range of the average move of the week. This allows you to close all short positions and look for opportunities to enter correctional purchases. The probability of a return to the level of 1.2216 is 90%, so the "false breakout" pattern of yesterday's low should be used to enter the trade today. Buying the pair from current levels will not be profitable, since the size of the stop will not make it possible for you to get a profitable profit risk ratio. An alternative model will be the continuation of the fall, which will entail a removal from the monthly control zone and an increase in the size of the correction model. Selling outside the monthly CZ is not strictly recommended, since it has a 10% chance of working out. Daily CZ - daily control zone. The area formed by important data from the futures market, which change several times a year. Weekly CZ - weekly control zone. The zone formed by important marks of the futures market, which change several times a year. Monthly CZ - monthly control zone. The zone, which is a reflection of the average volatility over the past year. The material has been provided by InstaForex Company - www.instaforex.com |
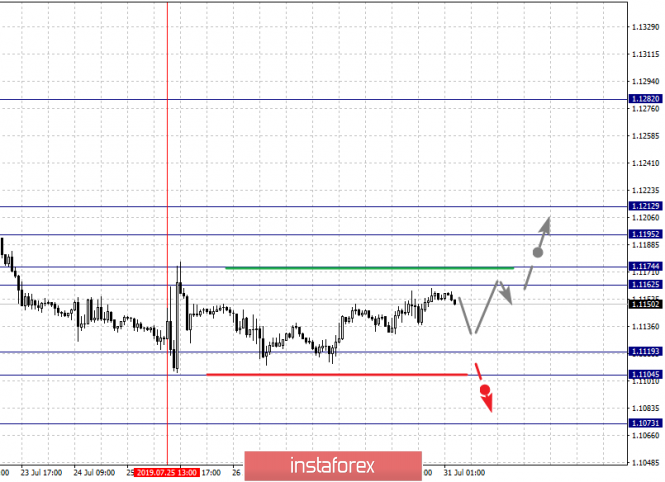
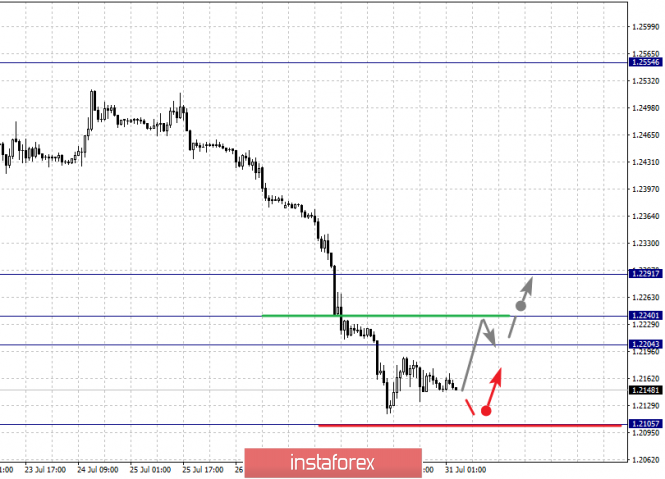
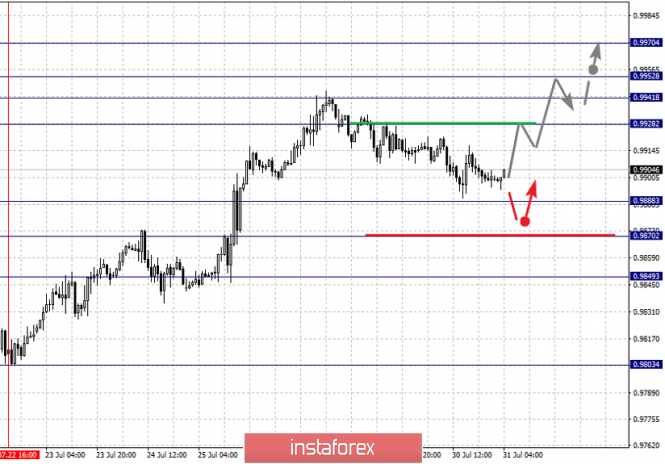
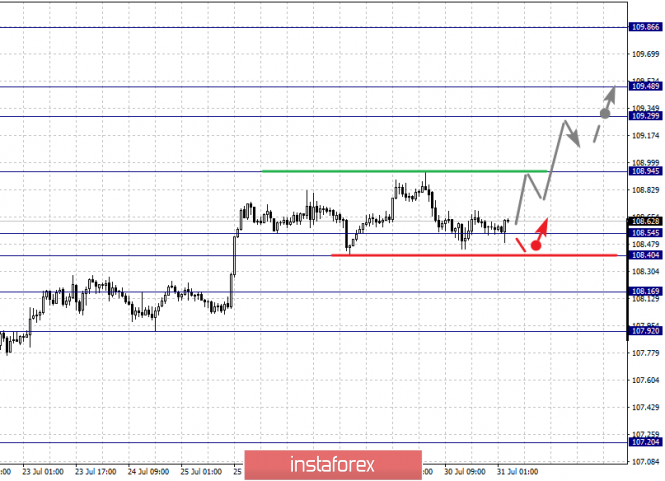
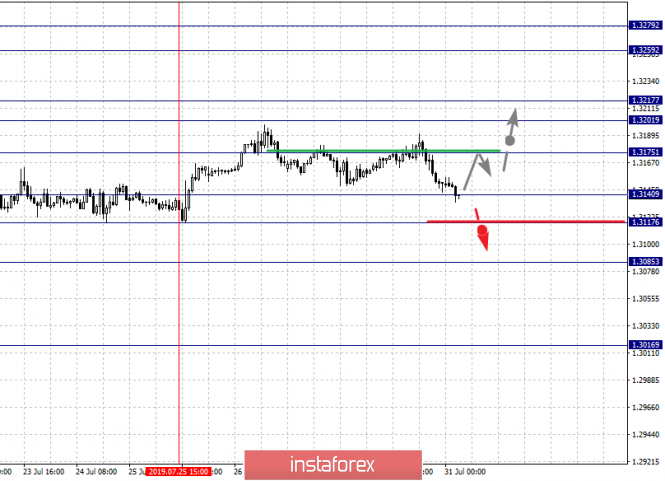
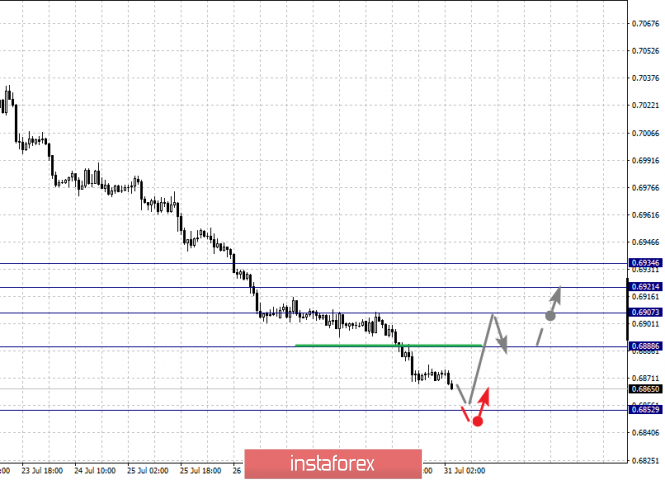
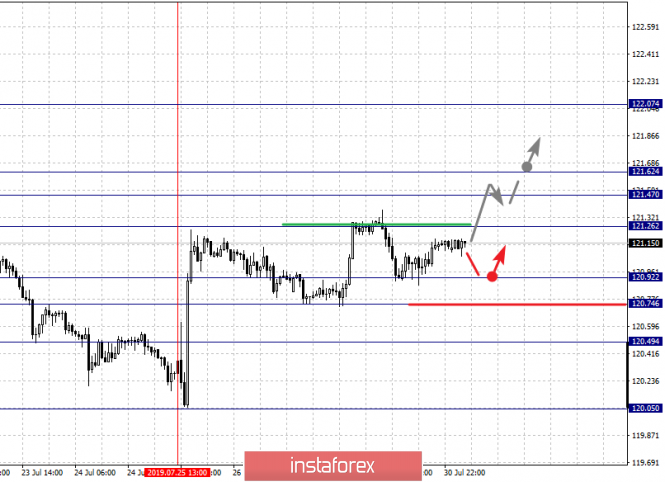
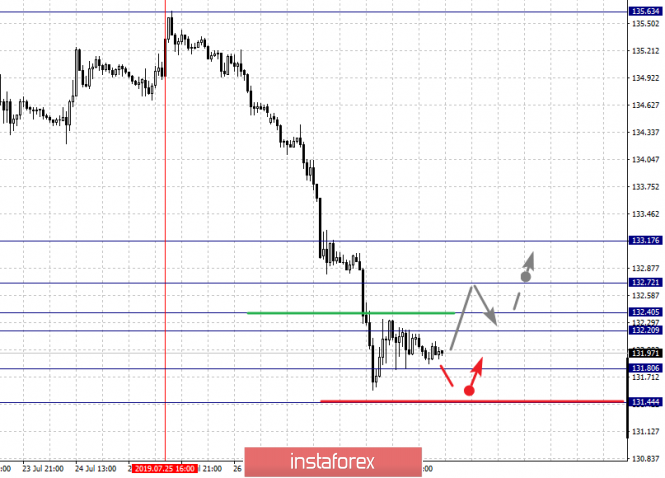
| Fractal analysis of major currency pairs on July 31 Posted: 30 Jul 2019 06:47 PM PDT Forecast for July 31: Analytical review of H1-scale currency pairs: For the euro / dollar pair, the key levels on the H1 scale are: 1.1212, 1.1195, 1.1174, 1.1162, 1.1119, 1.1104 and 1.1073. Here, the price entered an equilibrium state. The continuation of the movement to the top is expected after the price passes the noise range 1.1162 - 1.1174. In this case, the goal is 1.1195, wherein price consolidation is near this level. For the potential value for the top, we consider the level of 1.1212. Short-term downward movement is possible in the range of 1.1119 - 1.1104. The breakdown of the latter value will allow us to expect movement towards a potential target - 1.1073. From this level, we expect a rollback to the top. The main trend is the local downward structure of July 18, the stage of correction. Trading recommendations: Buy 1.1175 Take profit: 1.1195 Buy 1.1197 Take profit: 1.1212 Sell: 1.1119 Take profit: 1.1105 Sell: 1.1103 Take profit: 1.1075 For the pound / dollar pair, the key levels on the H1 scale are: 1.2291, 1.2240, 1.2204 and 1.2105. Here, the price is near the limit value (1.2105) for the downward structure of July 19. Also, at the moment, we expect a correction movement with the subsequent formation of the initial conditions for the top. Short-term upward movement is possible in the range of 1.2204 - 1.2240. The breakdown of the last value will lead to a prolonged correction. Here, the goal is 1.2291. Up to this level, we expect the top of the ascending structure to be formed. The main trend is the downward cycle of July 19, we expect to go into correction. Trading recommendations: Buy: 1.2204 Take profit: 1.2240 Buy: 1.2242 Take profit: 1.2290 Sell: Take profit: Sell: Take profit: For the dollar / franc pair, the key levels on the H1 scale are: 0.9970, 0.9952, 0.9941, 0.9928, 0.9888, 0.9870 and 0.9849. Here, we are following the development of the ascending structure of July 22. At the moment, the price is in correction. The resumption of the upward trend is possible after the breakdown of the level of 0.9928. In this case, the target is 0.9941. Meanwhile, in the range of 0.9941 - 0.9952, there is a short-term upward movement, as well as consolidation. For the potential value for the top, we consider the level of 0.9970. After reaching which, we expect a rollback. The level of 0.9888 is the key support for the upward trend. Its breakdown will lead to the development of a downward structure of July 26. In this case, the first target is 0.9870, wherein consolidation is near this level. For the potential value for the bottom, we consider the level of 0.9849. After reaching which, we expect a rollback to the top. The main trend - the ascending structure of July 22, the stage of deep correction. Trading recommendations: Buy : 0.9928 Take profit: 0.9940 Buy : 0.9953 Take profit: 0.9970 Sell: 0.9888 Take profit: 0.9872 Sell: 0.9868 Take profit: 0.9850 For the dollar / yen pair, the key levels on the scale are : 109.86, 109.48, 109.29, 108.94, 108.54, 108.40, 108.16 and 107.92. Here, we are following the development of the ascending structure of July 18. The continuation of the movement to the top is expected after the breakdown of the level of 108.95. In this case, the goal is 109.29. Meanwhile, in the range of 109.29 - 109.48, there is a short-term upward movement, as well as consolidation. We consider the level of 109.48 to be a potential value for the top. Upon reaching this level, we expect consolidation as well as a rollback to the bottom. Short-term downward movement is possible in the range of 108.54 - 108.40. The breakdown of the last value will lead to a prolonged correction. Here, the goal is 108.16. This level is a key support for the upward structure. Its price passage will have to form the initial conditions for the downward cycle. Here, the potential target is 107.92. The main trend: the ascending structure of July 18. Trading recommendations: Buy: 108.95 Take profit: 109.29 Buy : 109.30 Take profit: 109.46 Sell: 108.54 Take profit: 108.42 Sell: 108.38 Take profit: 108.16 For the Canadian dollar / US dollar pair, the key levels on the H1 scale are: 1.3279, 1.3259, 1.3217, 1.3201, 1.3175, 1.3140, 1.3117 and 1.3085. Here, the continuation of the upward trend is possible after the breakdown of the level of 1.3175. In this case, the target is 1.3201. The passage at the cost of the noise range 1.3201 - 1.3217 must be accompanied by a pronounced upward movement. In this case, the target is 1.3259. For the potential value for the top, we consider the level of 1.3279. After reaching which, we expect consolidation, as well as a rollback to the bottom. Short-term downward movement is possible in the range of 1.3140 - 1.3117. The breakdown of the latter value will lead to the development of a downward structure. Here, the potential target is 1.3085. The main trend is the local ascending structure of July 25. Trading recommendations: Buy: 1.3175 Take profit: 1.3201 Buy : 1.3218 Take profit: 1.3257 Sell: 1.3138 Take profit: 1.3118 Sell: 1.3116 Take profit: 1.3087 For the Australian dollar / US dollar pair, the key levels on the H1 scale are : 0.6934, 0.6921, 0.6907, 0.6888 and 0.6852. Here, the price is near the limit values for the downward cycle of July 18, and we expect to go into a correction. The development of the ascending structure is possible after the breakdown of the level of 0.6888. In this case, the target is 0.6907. The breakdown of which, in turn, will allow us to count on the movement to the level of 0.6921. For the potential value for the top, we consider the level of 0.6934. Upon reaching which, we expect pronounced initial conditions for the upward cycle. The breakdown of the level of 0.6852 will be accompanied by an unstable downward movement, and here, we do not consider subsequent targets until the correction is made. The main trend - the downward structure of July 18. Trading recommendations: Buy: 0.6888 Take profit: 0.6907 Buy: 0.6908 Take profit: 0.6920 Sell : Take profit : Sell: Take profit: For the euro / yen pair, the key levels on the H1 scale are: 122.07, 121.62, 121.47, 121.26, 120.92, 120.74 and 120.49. Here, we are following the formation of the ascending structure of July 25. The continuation of the movement to the top is expected after the breakdown of the level of 121.26. In this case, the first target is 121.47. Meanwhile, we expect the formation of a pronounced structure of the initial conditions for the ascending cycle to the level of 121.62. For the potential value for the top, we consider the level of 122.07. The movement to which is expected after the breakdown of the level of 121.62. Short-term downward movement is possible in the range of 120.92 - 120.74. The breakdown of the latter value will lead to a prolonged correction. Here, the goal is 120.49. This level is a key support for the top. The main trend is the formation of the initial conditions for the upward cycle of July 25. Trading recommendations: Buy: 121.26 Take profit: 121.45 Buy: 121.64 Take profit: 122.05 Sell: 120.72 Take profit: 120.54 Sell: 120.45 Take profit: 120.10 For the pound / yen pair, the key levels on the H1 scale are : 133.17, 132.72, 132.40, 132.20, 131.80 and 131.44. Here, the price is the will of the limit values for the downward structure of July 25, and therefore, we expect movement in the correction zone. The development of an upward trend is possible after the passage of the price to the noise range 132.20 - 132.40. Here, the goal is 132.72. For the potential value for the top, we consider the level of 133.17, to which, we expect the registration of a pronounced structure of the initial conditions. Short-term downward movement is possible in the range of 131.80-113.44. From here, we expect a key reversal to the top. The breakdown of the level of 131.44 will be accompanied by an unstable development of the trend, and so far, we do not set further goals for the downward structure. The main trend - the downward structure of July 25. Trading recommendations: Buy: 132.40 Take profit: 132.70 Buy: 132.74 Take profit: 133.15 Sell: 131.76 Take profit: 131.50 The material has been provided by InstaForex Company - www.instaforex.com |
| Even if D. Trump declares a "crusade" against the dollar, it's not a fact that the Fed will join him Posted: 30 Jul 2019 04:49 PM PDT According to analysts, the Fed is in a rather difficult situation: the market does not want to disappoint, and the recession must be prevented, and here, US President Donald Trump dreams of weakening the greenback and believes that the regulator should aggressively reduce rates. When last Friday Larry Kudlow, the chief economic adviser to the head of the White House, said that the owner of the Oval Office had abandoned the idea of conducting currency interventions to reduce the value of the US currency, the dollar bulls sighed with relief. However, D. Trump later said that he had not yet made a firm decision on this issue. According to him, having a strong dollar is great, but it makes US exports more expensive. Obviously, after two years of trade wars, the American leader finally understood the simple truth: it was the national currency rate that was the key to reducing the country's trade deficit. It remains only to wait for D. Trump's insight about the fact that the growth of the dollar is to some extent associated with trade wars. However, abandoning them without a resounding victory is likely to lead to increased criticism from the Democrats, and the price may be a second term of the presidency. In addition, the US president has no inclination to admit his mistakes and abandon his ideas. Instead, he pushes the central bank to take action, which immediately finds a response from the derivatives market, which expects that the federal funds rate will drop to 1.75% by the end of the year. Therefore, reducing the rate by only 25 basis points in July may disappoint investors. Blackstone strategist Joseph Zidle believes that the market expects too much from the Fed. "Even the S&P 500's rally to 3000 is not really due to fundamental factors, but to hopes for additional liquidity, which the Fed's aggressive easing of monetary policy will provide," he said. Moreover, it is not typical for the Fed to start a campaign to stimulate at record highs in the stock market. The regulator usually waited for the end of the rally and the warning signals of the key indicators. Does the Fed have compelling arguments for easing monetary policy without taking into account market pressure and D. Trump? It is possible that the US central bank is afraid to follow the path of its Japanese colleague, who for many years, even with the help of a large-scale monetary stimulus could not defeat deflation, at the moment it has almost exhausted its "arsenal" and is now unable to push consumer prices to the target of 2%. Europe is on the same path, which is very difficult to turn off. Apparently, the reluctance to repeat the mistakes of others is what forces the Fed to stimulate the US economy, which is doing so well that theoretically it could lead to its overheating. In addition, the Fed is well aware of the situation and evaluates the current dollar growth as one of the risks to the US economy. The main question now is how far the regulator is ready to go for the greenback's devaluation. For a significant weakening of the US currency, the central bank must announce a cycle of rate cuts. It is possible that the Fed will only make a nominal concession to D. Trump, reducing rates once, and will wash his hands on it. In the event that the Fed actually refuses to weaken the dollar, we can expect the US to withdraw from the G20 agreement on the absence of competitive currency devaluation, which marks the beginning of a new era of currency wars. The material has been provided by InstaForex Company - www.instaforex.com |
| Fed: Investors will be disappointed Posted: 30 Jul 2019 04:38 PM PDT Reducing the key rate range by a quarter of a percentage point can be considered a decided matter, which, in general, the markets do. However, in reality, anything can happen. If the Fed does not meet the expectations of investors, then hysteria will begin. By the way, the owner of the White House has already demonstrated his emotional attitude towards the future decision of the Federal Reserve. Donald Trump ordered to definitely lower rates, and more aggressively. It is not yet clear what the central bank will do, while the dollar missed the next tweet of the US president and continued to grow. Currently, the US currency remains the most profitable among its main competitors. Given the steady growth of the US economy, record low unemployment and restrained inflation, the FOMC members will have to give a kind of "preventive coloring" to the policy easing. The fact is that the rate cut by 25 bp will not provide the necessary insurance for the economy. If the goal is only to normalize the yield curve (we are talking about reducing the yield on short-term bonds below long-term issues), then probably reducing the rate by a quarter of a point will help. The difference in rates for 3-month and 10-year Treasuries has narrowed to about this value. However, trying to get away from recession does little to stimulate the economy. Investors are not just waiting for further rounds of monetary policy easing. The probability of lowering the rates at the September meeting to 1.75–2.00 is estimated at 70%. In December, the chances of falling to 1.50–1.75 or below exceed 50%. Time to act The response of traders to the decision on rates will depend on the text of the FOMC statement. And first of all, on how Jerome Powell explains the position of the Committee representatives. A hint of further easing will be found in his comments, in which attention will be paid to pressure factors and economic risks, especially against the background of a trade war. If the Fed understands that easing by 25 bps will not be enough, why not get ahead of events and reduce rates by 50 bps at once. Such a bold decision will be effective and will provide the central bank with sufficient insurance to support growth. Nothing of what the Fed is going to do in the coming days will be able to accelerate inflation to a target of 2%, while an easing by 50 bp could be a catalyst for price growth. I don't think Powell would take that step. The only thing that traders should hope for is that it will allow further policy easing. Recently, Jerome Powell often changes his views. At first, he advocated a tightening of the policy, then it was time for a "wait-and-see" position and stable rates, and now he practically guarantees a reduction in rates. What is this - impermanence or intrigue? The material has been provided by InstaForex Company - www.instaforex.com |
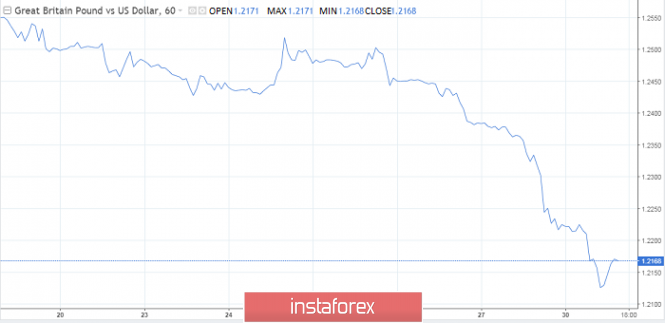
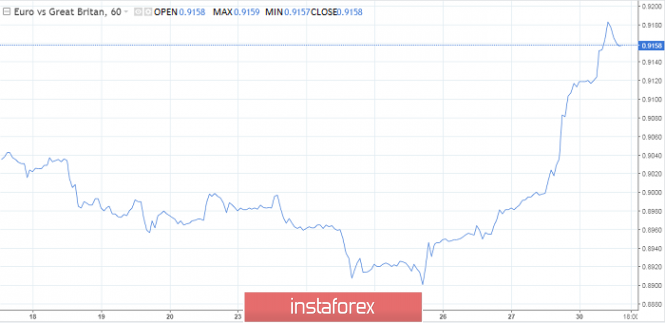
| The "heavy" sale of the pound spread to Tuesday, aiming for 1.20 Posted: 30 Jul 2019 04:20 PM PDT Pound traders are focusing on the psychological level of 1.21. If bears manage to eliminate this obstacle, then they will switch to lower levels - 1.20 and 1.1986. At this very spot, the market hit bottom after the Brexit referendum in June 2016. Any closing below may open the way to the value of 1.19. The trend for the pound remains bearish, both in the short and in the medium term. The pair's fall to a new low today contributed to the strengthening of disturbing rhetoric against Brexit. Boris Johnson reiterated that the May deal, in which there was a point about the border in Ireland and which failed three times in the British Parliament, no longer exists. The prime minister made it clear that he will not resume negotiations with the EU until Brussels changes its position on the issue of the border with Ireland. British Foreign Secretary Dominic Raab said that European officials are showing unprecedented stubbornness, while the British side wants a compromise solution and a deal. Aggressive Brexit is undesirable, but so far there is no other way out. The current situation around the pound is extremely unstable. As in previous episodes three years ago after the referendum, the British currency is very sensitive to any headlines in Brexit's news feed. Transactions in the foreign exchange market amid moderately positive messages can be supported by the desire of traders to buy the pound at record low levels. However, the fall is now aggravated by the massive triggering of stop orders, as evidenced by the rather ragged dynamics of the GBP/USD pair during the Asian session. Several stages of pulling down quotes by 20 points per minute were recorded. As for the EUR/GBP pair, it jumped 3.2% since Johnson's first comments as prime minister. Historically, the pair feels insecure at levels above 0.9000. Over the last decade, the euro in conjunction with the pound appeared in the area of 0.9200 only during periods of severe market turbulence. The focus of traders has quickly shifted from the British currency to the euro, which caused the pair to pull back as soon as market shocks gave way to long-term sterling purchases on downturns and a weaker single currency. The fall of the pound was the reason for the growth of British stocks. Since the beginning of the week, the FTSE100 gained 2.2%, approaching annual highs. The rise in the index from Friday is 3.4%, which exceeds the scale of the weakening pound. It seems that stock markets are not yet very concerned about the long-term prognosis of the negative effects on the economy. All the attention of the foreign exchange market, apparently, is on the side of the British currency. Except for its 2% fall from the beginning of the week, fluctuations in the main exchange rates look restrained. Traders prefer not to make unnecessary movements, and wait for further signals from the US Federal Reserve and the economy, as well as the possible results of trade negotiations. The material has been provided by InstaForex Company - www.instaforex.com |
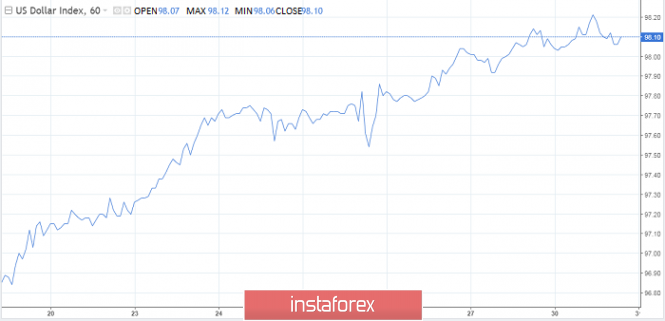
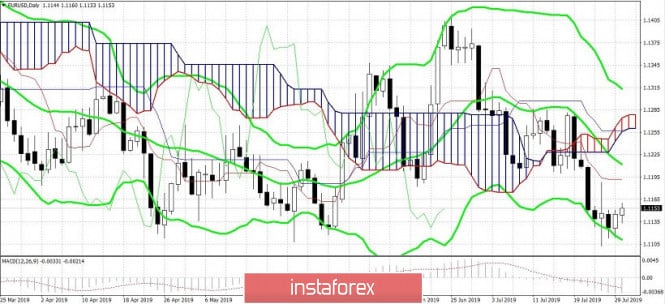
| Posted: 30 Jul 2019 04:05 PM PDT The euro-dollar pair froze in anticipation of the main event of this week - the July Fed meeting, the results of which we will know tomorrow. But today, traders traded against the background of controversial macroeconomic statistics, which came from Europe and the United States. The US president also has a definite influence on the market with his harsh statements against China, despite the talks that started in Shanghai today. The ambiguous fundamental picture does not make it possible for dollar bulls to continue the downward trend, while the European currency is not capable of even more or less a large-scale correction. As a result, EUR/USD fluctuates in the middle of the 11th figure in anticipation of powerful news drivers. Tuesday's European trading session ended in favor of the euro - the pair's price rose to a mark of 1.1160. Traders were pleased with relatively good data on the growth of French GDP: the figure rose to 1.3%. The indicator is growing for the second quarter in a row after a 4-quarter decline period. Although the growth was low and predictable, in the current situation, the euro responds positively even to minimal hints of a recovery in the eurozone. Especially since, following the French data, Germans followed, who also came out in the "green zone". A key indicator of inflation was published in Germany today - the consumer price index. In monthly terms, it came out at the level of 0.5%, exceeding the forecast level (indicator growth for the second month in a row). In annual terms, a similar dynamics was recorded - the index continued the positive trend of June, rising to 1.7% in July. These figures were published on the eve of the release of the European inflation indicator, therefore, they provided some support for the euro. It can be assumed that tomorrow's data will also come out better than expected, whereas, according to preliminary forecasts, the CPI will slow down to 1%, while the core index will go down to 0.9%. Despite little support from European statistics, the correctional growth of EUR/USD did not last long but only for just a few hours. During the US session, the price returned to previous positions and even updated its daily low. Dollar bulls cheered after the publication of the indicator of consumer confidence in the United States. After a decline to two-year lows, the indicator jumped to 7-month highs, that is, to a mark of 135.7 points. The last time the index was at such heights was in November last year, so the dollar index responded to this fact with an increase of 98 points to the boundary. However, the US trading session has not been without unpleasant surprises from macroeconomic reporting. The Fed's most "favorite" inflation indicator, the RSE, showed rather weak growth, reinforcing fears about a rise in US inflation as a whole. The main index of personal consumption expenditures has fluctuated in the range of 1.5% -1.6% since March of this year, and according to general forecasts of experts, today it should have shown an increase to 1.7%. But the real numbers disappointed - the figure remained within the designated band (1.6%). On a monthly basis, stagnation has also been recorded - since April, the RFE has reached 0.2% m/m. Although this result is not catastrophic, the dollar still suspended its growth throughout the market, including paired with the euro. Inflation is still the "weak link" in the US economy, so traders remain concerned about the possible reaction of the Fed. According to the baseline forecast, the Fed will lower the rate by 25 points tomorrow, after which it will take a wait-and-see position. But political pressure from the White House, as well as weak inflation, make investors nervous in the run-up to the July meeting. And although the likelihood of reducing the rate by 50 points at once is extremely small, Powell may announce further steps to ease monetary policy. The today's release of RSE once again reminded traders of such a probability. Also, one should not forget about external fundamental factors that also influence the position of the Fed members. Today the next round started (the 12th in a row for the entire period of the trade war) of the US-China trade negotiations. Despite the fact that the negotiation process has just begun, Donald Trump has already expressed his skepticism about his prospects. He suggested that the Chinese are deliberately delaying time, avoiding the escalation of the trade conflict and at the same time hoping for a change of power in the United States next year. At the same time, Trump warned that if during the period of his first cadence the parties do not conclude a trade agreement, then during the second cadence (in reality of which he has no doubt, contrary to numerous opinion polls, not in his favor), the deal will be concluded on more stringent conditions for China or not will be concluded at all. Also, the US president made it clear that the current trade negotiations are unlikely to end effectively, although at the same time he expressed optimism about the possible outcome of the negotiation process as a whole. Thus, the prevailing fundamental picture is contradictory. The dollar is under pressure from possible actions (intentions) on the part of the Fed, while the euro is in anticipation of key inflation data. As a result, most EUR/USD traders preferred to take a wait-and-see position, after which the pair's price froze in the flat. But this calm promises to be short-lived: if tomorrow the head of the Federal Reserve hints at maintaining the status quo after the rate has been reduced, the dollar will strengthen its growth and, together with the euro, will enter the 10th figure. If Powell does not exclude the option of reducing the rate in September (or at any meeting until the end of the year), the EUR/USD pair will return to the first resistance level of 1.1210 - this is the middle line of the Bollinger Bands indicator on the daily chart. The material has been provided by InstaForex Company - www.instaforex.com |
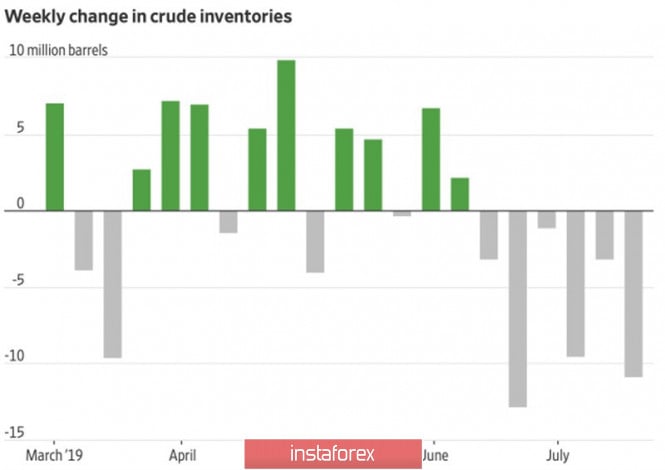
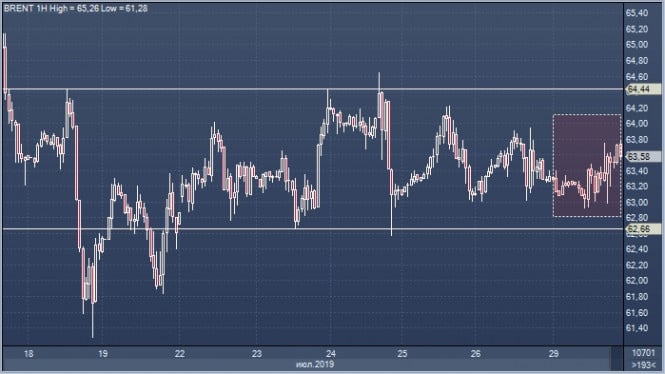
| Posted: 30 Jul 2019 03:51 PM PDT When traders have doubts, they begin to close positions. The main "bearish" driver in the oil market is considered to be the reduction in global demand under the influence of trade wars and a slowdown in the global economy. Nevertheless, the fastest growth in consumer spending since 2017 in the United States in the second quarter, as well as six consecutive weeks of a decline in US black gold reserves, indicate that demand in the leading country of the world is all right. And then there is the Fed with its intention to stimulate an already non-weak economy by lowering the federal funds rate. Have the bears overdone selling Brent and WTI? The influential London-based broker PVM said that at present there is such a situation on the market that oil can easily both grow by $30 and fall by $30 per barrel. Everything will depend on which driver the market will choose. If the conflict between the West and Iran, which is fraught with the overlap of the Strait of Hormuz, the most important waterway for suppliers of black gold, then Victoria is celebrated by the bulls. If the reduction in global demand - bears. In this regard, any deviation from one of the two above scenarios becomes a pretext for closing positions. In the week to July 19, US stocks dropped by more than 10 million barrels to its lowest level since March. Supply is clearly not keeping up with the demand. Good news for fans of black gold. Dynamics of US oil reserves The North Sea variety has been growing for the third consecutive trading session due to strong statistics on the United States, the resumption of trade negotiations between Washington and Beijing, and hopes for the first federal fund rate cut since 2008. At the same time, Donald Trump continues to criticize the US Federal Reserve. So far, it has acted incorrectly, allowing competitors to stimulate their own economies with the help of devaluation. Even reducing the cost of borrowing by 25 bp will not be enough, but America will still win! The derivatives market estimates the likelihood of aggressive monetary expansion in July at 26-27%, which is not so little. The Fed can really reduce the rate by 50 bp, and then take a long pause. In this scenario, the assets of the commodity market will receive a new reason for optimism. On the contrary, a modest easing of monetary policy has already been taken into account in the quotations of financial instruments, therefore only Jerome Powell is able to prevent the collapse of stock indices. For this, dovish rhetoric and an open door to further monetary expansion are necessary. From oil, I also expect a violent reaction to the announcement of the outcome of the July meeting of the FOMC. Firstly, they will affect the US dollar (Brent and WTI are listed in this currency), and secondly, they will allow us to predict the improvement or deterioration of the US oil demand. Technically, bears of the North Sea variety could not bring quotes outside the triangle, which is the first sign of their weakness. In order to continue the rally, bulls need to gain a foothold above $64.1 per barrel, and then take the resistance at $65.9 and $67.5 by storm. The material has been provided by InstaForex Company - www.instaforex.com |
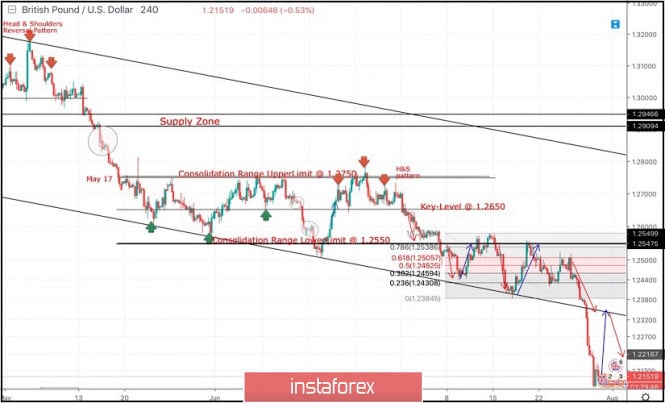
| July 30, 2019 : GBP/USD Intraday technical analysis and trade recommendations. Posted: 30 Jul 2019 08:39 AM PDT
Since May 17, the previous downside movement within the depicted bearish channel came to a pause allowing the recent sideway consolidation range to be established between 1.2750 - 1.2550 with a prominent key-level around 1.2650. On July 5, a bearish range breakout was demonstrated below 1.2550 (the lower limit of the depicted consolidation range). Hence, quick bearish decline was demonstrated towards the price zone of 1.2430-1.2385 (where the lower limit of the movement channel came to meet the GBPUSD pair). In July 18, a recent bullish movement was initiated towards the backside of the broken consolidation range (1.2550) where another valid SELL entry was offered two weeks ago. As anticipated, bearish persistence below 1.2460 (38.2% Fibonacci levels) and 1.2430 (38.2% Fibonacci Level) enhanced further bearish decline towards 1.2350. Moreover, Bearish breakdown below 1.2350 facilitated further bearish decline towards 1.2320, 1.2270 and 1.2125 which correspond to significant key-levels on the Weekly chart. The current price levels are quite risky/low for having new SELL entries. That's why, Previous SELLERS should have their profits gathered and Stop Loss lowered to secure more profits. Currently, The price zone of 1.2320 - 1.2350 now stands as a prominent SUPPLY zone to be watched for new SELL positions if any bullish pullback occurs soon. Trade Recommendations: Intraday traders should look for early signs of bullish rejection around the current price levels (1.2125) for a counter-trend BUY entry. Conservative traders should wait for a bullish pullback towards 1.2320 - 1.2350 for new SELL entries. S/L should be placed above 1.2430. Initial T/P level to be placed around 1.2279 and 1.2150. The material has been provided by InstaForex Company - www.instaforex.com |
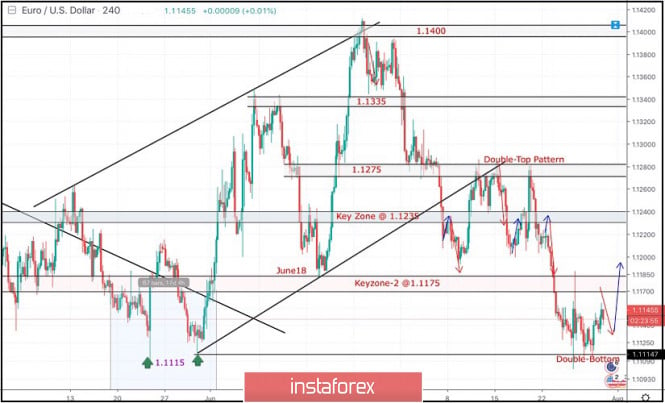
| July 30, 2019 : EUR/USD demonstrates short-term bullish outlook above 1.1115. Posted: 30 Jul 2019 07:48 AM PDT
Back in June 24, the EURUSD looked overbought around 1.1400 facing a confluence of supply levels. Thus, a bearish movement was initiated towards 1.1275 followed by a deeper bearish decline towards 1.1235 (the lower limit of the newly-established bullish channel) which failed to provide enough bullish support for the EUR/USD. In the period between 8 - 22 July, sideway consolidation range was established between 1.1200 - 1.1275 until a double-top reversal pattern was demonstrated around the upper limit. Recent Bearish breakdown of the pattern neckline confirmed the short-term trend reversal into bearish towards 1.1175. Fortunately, evident bearish momentum (bearish engulfing H4 candlestick) could bring the EURUSD back below 1.1235 which stands as an Intraday Supply zone to be watched for Intraday SELL entries upon any upcoming bullish pullback. HOWEVER, Early bearish breakdown below 1.1175 facilitated further bearish decline towards 1.1115 (Previous Weekly Low) where evident bullish rejection was recently demonstrated on July 25. That's why, Intraday bullish pullback was demonstrated towards 1.1175-1.1200 where a valid SELL entry was suggested in a previous article. It's already running in profits. Yesterday, bearish persistence below 1.1115 was mandatory to allow further bearish decline initially towards 1.1025. However, the EUR/USD pair failed to establish a successful breakdown below 1.1115. Instead, a short-term bullish double-bottom pattern was established around 1.1115 (Weekly Low). The EUR/USD remains trapped between the depicted zones (1.1115-1.1175) where a bullish pullback towards 1.1175 should be expected in the near future. Conservative traders can look for a bullish Head & Shoulders pattern being demonstrated as an early sign of intermediate-term trend reversal. Trade recommendations : Intraday traders who missed the initial trade, another SELL entry can be taken upon bullish pullback towards 1.1175 with initial bearish target around 1.1130. Conservative traders should wait for a bullish breakout above 1.1175 for a valid BUY entry with initial bullish target around 1.1235. The material has been provided by InstaForex Company - www.instaforex.com |
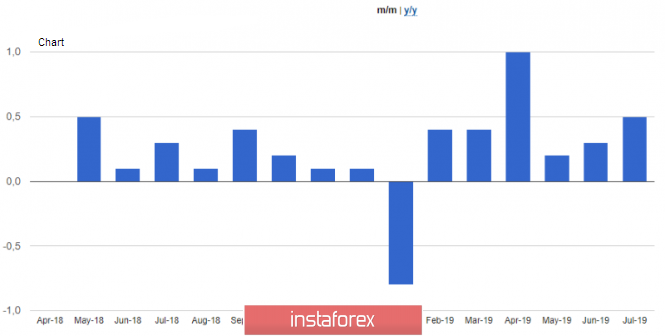
| Posted: 30 Jul 2019 07:21 AM PDT The eurozone data released in the morning did not make any significant changes in the market situation but pointed to the necessary changes in the course of monetary policy. Despite the fact that German consumer sentiment is likely to worsen in August of this year, and this will happen against the backdrop of a slowdown in the global economy, the euro strengthened slightly before the publication of the Fed's interest rate decision, which will be known tomorrow. The report of the GfK research group noted the risks of trade conflicts and uncertainty of Brexit prospects, which puts direct pressure on consumer sentiment. According to the data, the leading index of consumer confidence GfK in August 2019 fell to 9.7 points against 9.8 points in July. The data completely coincided with the forecasts of economists. The index of economic expectations in July fell to -3.7 points from 2.4 points in June, the index of propensity to buy fell to 46.3 points. Data on the assessment of their prospects by eurozone companies may affect the decision of the European Central Bank on monetary policy, as the weakening of confidence in companies confirms the need for policy easing. A special problem is noted by companies in the manufacturing industry, where the level of pessimism has reached a very high value. According to the report of the European Commission, the indicator of sentiment in the eurozone economy in July 2019 fell to 102.7 points against 103.3 points in June. As noted above, the eurozone manufacturing sentiment indicator fell immediately to -7.4 points in July from -5.6 points in June, and capacity utilization fell to 81.9% in April from 82.8% in January. Let me remind you that last week, weak indices of supply managers also came out, which together indicates a slowdown in economic growth and increases the likelihood of easing the ECB's policy in the near future. Many experts now expect the Central Bank to lower rates in September this year. Preliminary data on inflation in Germany provided only temporary support for the euro, but it was not possible to get beyond even the intermediate resistance level of 1.1150. According to the report, the consumer price index (CPI) of Germany in July 2019 increased by 0.5% compared to June and by 1.7% compared to the same period of 2018. Economists had expected growth of only 0.3% and 1.5%, respectively. As for the harmonized index according to the EU standard, consumer prices in July increased by 0.4% and by 1.1% per annum. Today, there was news from the Chinese Politburo, which stated that the economy faces new risks and challenges, as well as increased downward pressure, which requires additional incentives. It is expected that the Chinese authorities will stabilize investments in the manufacturing industry, as well as will begin to stimulate medium and long-term financing of plants and private companies. The Politburo also promised to effectively deal with the consequences of trade disputes with the United States and stimulate domestic demand. Apparently, the US President Donald Trump did not like the new course of the PRC much, since immediately after the Politburo report, he warned China about a much tougher trade deal that would be proposed if he was elected for a second term, thereby hinting at the need to agree to the current conditions. Also, the American President drew attention to the fact that China is behaving very badly and does not fulfill its promises to purchase agricultural products, an agreement on which was reached during the recent negotiations. As for the current technical picture of the EURUSD pair, serious changes in the market will take place tomorrow, when the Federal Reserve announces its decision on interest rates. In the meantime, the growth of the trading instrument is limited by the resistance of 1.1150, the breakthrough of which can only briefly strengthen the upward correction in risky assets, which will lead to the update of the larger level of 1.1185, formed last week. In the case of a return of pressure on the European currency, and such a scenario is more likely, support will be provided by a weekly minimum in the area of 1.115 or a larger area of 1.1090, from which profit taking before the important decision of the Fed will be visible in the market. The material has been provided by InstaForex Company - www.instaforex.com |
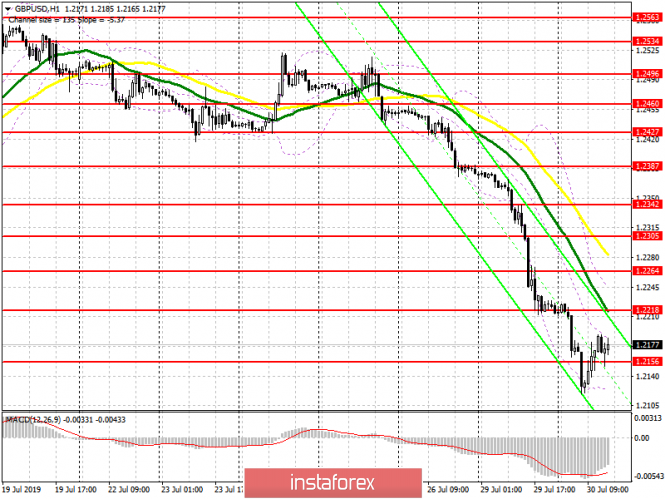
| Posted: 30 Jul 2019 06:35 AM PDT To open long positions on GBP/USD, you need: Buyers of the pound are in no hurry to return to the market, and the current small growth is associated with profit-taking on short positions after a major drop formed at the end of last week. Buyers formed intermediate support in the area of 1.2156, and all emphasis is now placed on it. The formation of a false breakout in this range in the second half of the day can lead to further growth of GBP/USD in the resistance area of 1.2218, where I recommend taking the profit. However, the key goal will be the resistance of 1.2264, where bears will try to build the upper limit of the downward channel. In the scenario of further GBP/USD decline and return to the support level of 1.2156, it is best to return to long positions after updating the monthly minimum in the area of 1.2100 or a rebound from larger support of 1.2040. To open short positions on GBP/USD, you need: Sellers cannot yet worry about the current upward correction, and even large "gaps" in the resistance area of 1.2218 and 1.2264 will not lead to a change in the current trend. You can open short positions on a false breakout from the first level of 1.2218, and sell immediately on a rebound from the maximum of 1.2264, where sellers will build the upper limit of the current downward channel. However, the main scenario for the continuation of the downward trend will be a return to the support level of 1.2156, which will lead to an update of the monthly lows of 1.2100 and 1.2040, where I recommend taking the profit. Any statements by the new British Prime Minister on the UK's withdrawal from the EU without an agreement will continue to have a negative impact on the pound. Indicator signals: Moving Averages Trading is below 30 and 50 moving averages, which indicates a further decline in the pair. Bollinger Bands In the case of an upward correction, the upper limit of the indicator in the area of 1.2240 will act as a resistance.
Description of indicators
|
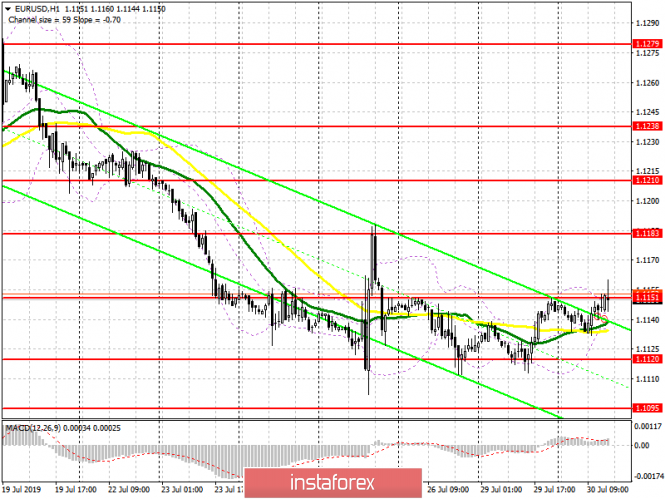
| Posted: 30 Jul 2019 06:34 AM PDT To open long positions on EURUSD, you need: The absence of important fundamental statistics, apart from the indicator of consumer confidence, which remained at a negative level in the eurozone, led to the preservation of low market volatility, and inflation data in Germany returned the pair to a major resistance of 1.1151, which I drew attention to in my morning review. Only a breakthrough and consolidation above this range will allow the bulls to count on the continuation of the upward correction in the area of the upper boundary of the wide side channel of 1.1183, where I recommend taking the profit. If the bulls are not able to get to the level of 1.1151, I recommend returning to long positions only after updating the intermediate support of 1.1120 or to rebound from the lower border of the side channel in the area of 1.1095. To open short positions on EURUSD, you need: Once again, the bears will count on a breakthrough of the support of 1.1120, which could not be done yesterday in the absence of important fundamental statistics. Fixing below this level will give a new impetus to the downward trend, which will lead to new lows in the area of 1.1095 and 1.1068, where I recommend taking the profits. The formation of a false breakout in the resistance area of 1.1151, which bears are now trying to form, will be a signal to open short positions in EUR/USD. However, much will depend on the data that will be released on consumer confidence in the US in the afternoon. Good performance will return to the euro seller's market. With a weak report and the growth of EUR/USD above the resistance of 1.1151, it is best to return to short positions on the rebound from the maximum of 1.1183 or from a larger area of 1.1210. Indicator signals: Moving Averages Trading is conducted in the area of 30 and 50 moving averages, which indicates the lateral nature of the market. Bollinger Bands Volatility is low, which does not give signals to enter the market.
Description of indicators
|
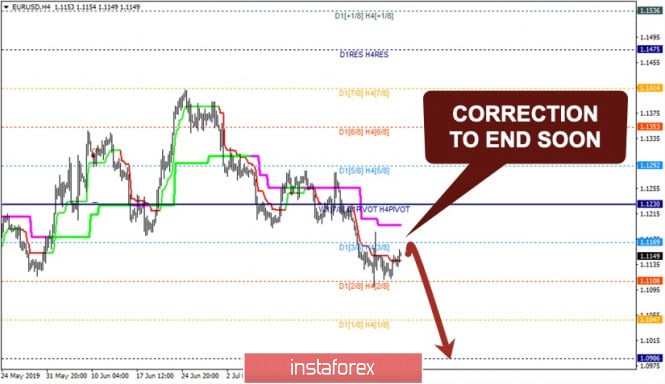
| EUR/USD ready to decline even lower Posted: 30 Jul 2019 06:19 AM PDT
The short-term outlook for EUR/USD remains bearish. The pair has fixated under 3/8 Murrey Math Level that brings more evidence for the current scenario. Previously, the price met resistance at the 7/8 MM Level, which led to the current decline. Super Trend Lines have formed a 'Bearish Cross' little later on. At the same time, the price is moving sideways in a range between Super Trend Lines. So, the market is going to test 3/8 MM Level once again in the coming hours. The subsequent pullback from this level could be a starting point for another decline. If 3/8 MM Level turns out to be broken, all eyes will be on the higher Super Trend Line (from the Daily chart), which could act as resistance as it happened a few times before. The main bearish target is 0/8 MM Level, which is confirmed by the Daily chart. Meanwhile, we also should pay attention to 1/8 MM Level, which could stop the bearish rally as 7/8 MM Level did the same for the last upward price movement. Finally, fixating below the Super Trend Line will be essential confirmation for the outlook. The bottom line is that EUR/USD remains bearish and the current consolidation is likely to be just a correction. Thus, we're probably going to see the market even lower in the near future. The material has been provided by InstaForex Company - www.instaforex.com |
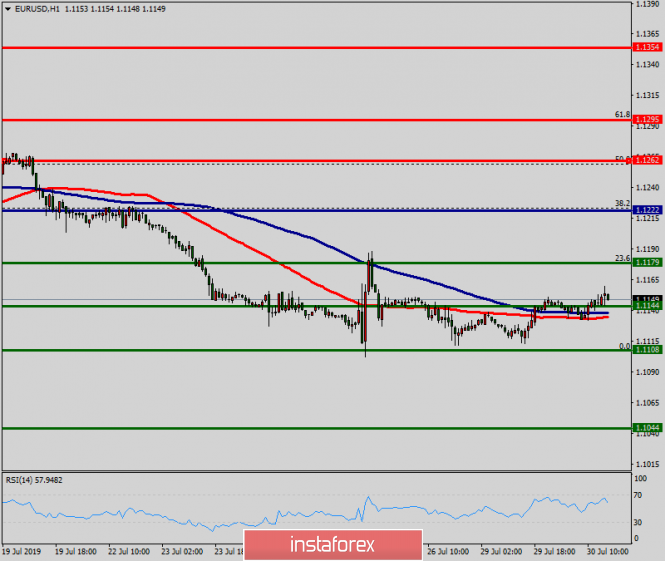
| Technical analysis of EUR/USD for July 30, 2019 Posted: 30 Jul 2019 06:05 AM PDT The EUR/USD pair continues to move upwards from the level of 1.1179/1.1222 (support zone). Last week, the pair rose from the level of 1.1179 to a top around 1.1222 (currently price is set at the 1.1234 price). Today, the first resistance level is seen at 1.1262 followed by 1.1295, while daily support 1 is seen at 1.1179 (23.6% Fibonacci retracement). According to the previous events, the EUR/USD pair is still moving between the levels of 1.1179 and 1.1295; so we expect a range of 116 pips. Furthermore, if the trend is able to break out through the first resistance level at 1.1222, we should see the pair climbing towards the double top (1.1295) to test it. Therefore, buy above the level of 1.1179 with the first target at 1.1262 in order to test the daily resistance 1 and further to 1.1295. Also, it might be noted that the level of 1.1295 is a good place to take profit because it will form a double top. On the other hand, in case a reversal takes place and the EUR/USD pair breaks through the support level of 1.1179, a further decline to 1.1108 can occur which would indicate a bearish market. The material has been provided by InstaForex Company - www.instaforex.com |
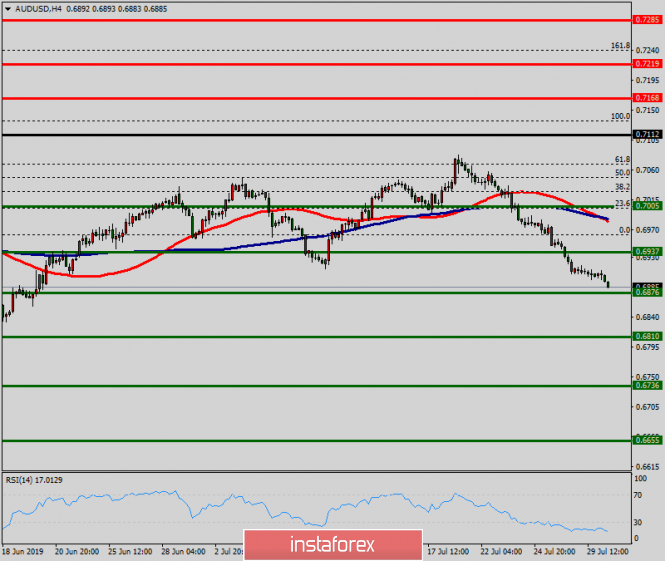
| Technical analysis of AUD/USD for July 30, 2019 Posted: 30 Jul 2019 06:01 AM PDT The AUD/USD pair is set above strong support at the levels of 0.6876 and 0.6810. This support has been rejected four times confirming the uptrend. The major support is seen at the level of 0.6810, because the trend is still showing strength above it. Accordingly, the pair is still in the uptrend in the area of 0.6810 and 0.6876. The AUD/USD pair is trading in the bullish trend from the last support line of 0.6876 towards thae first resistance level of 0.6937 in order to test it. This is confirmed by the RSI indicator signaling that we are still in the bullish trending market. Now, the pair is likely to begin an ascending movement to the point of 0.6937 and further to the level of 0.7005. The level of 0.7005 will act as the major resistance and the double top is already set at the point of 0.7005. At the same time, if there is a breakout at the support level 0.6810, this scenario may be invalidated. The material has been provided by InstaForex Company - www.instaforex.com |
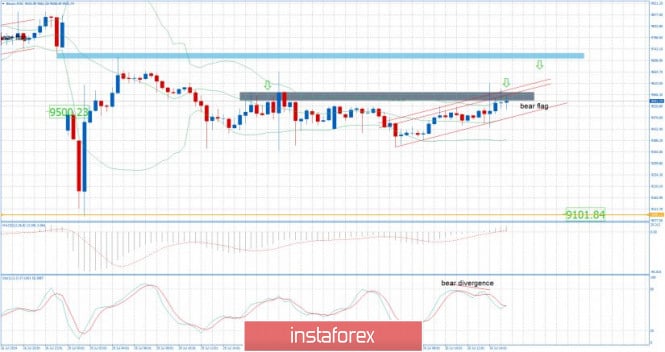
| BTC 07.30.2019 - Bearish flag in creation Posted: 30 Jul 2019 05:52 AM PDT Industry news: Announced by Pundi X in a blog post on Monday, the firms have entered a symbiotic relationship regarding their wallet tech, with Pundi X integrating with Samsung's Blockchain Wallet and making its XWallet available to the Galaxy S10 phone's blockchain app options. "This presents a unique opportunity to push blockchain technology and blockchain-based digital assets into the mainstream, reaching the millions of Samsung smartphone users around the world," firm says in the post. Technical view:
BTC is trading sideways at the price of $9.550 and it seems like it is building a bear flag for more downside. Pat attention on important resistance levels at $9.600 and $9.700. Technical picture: Red rising line – Bear flag pattern in creation Gray rectangle – Resistance 1 ($9.600) Blue rectangle – Resistance 2 ($9.700) Orange horizontal line – Main swing low ($9.101) Stochastic oscillator is showing bearish divergence, which is sign for potential buyers exhaustion near the level of $9.600. My advice is to watch for selling opportunities with the downward target at $9.101. The material has been provided by InstaForex Company - www.instaforex.com |
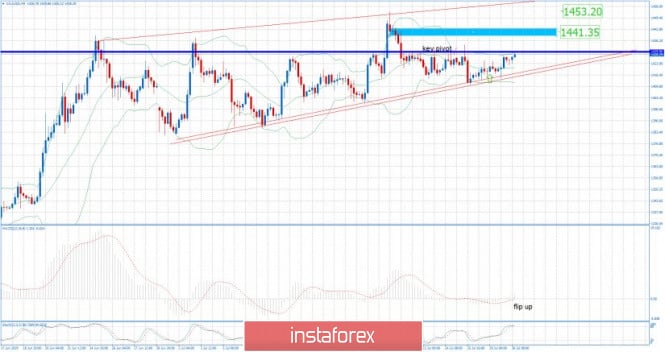
| Gold 07.30.2019 - Key resistance at the price of $1.430 on the test Posted: 30 Jul 2019 05:33 AM PDT Gold is testing the key pivot resistance at the price of $1.430. The potential break upside may lead us to the levels at $1.441 and $1.453. Technical picture:
Red rising line – Support trend line (successfully held) Blue – Resistance 1 ($1.441) Upper rising line – Resistance 2 ($1.453) MACD oscillator is showing the UP flip and the slow line did turn from bearish into bullish, which is positive sign for further upside. I found fourth successful rejection of the important rising support trend line, which adds more potential strength on the Gold. Watch for buying opportunities with the upward targets at $1.441 and $1.453. The material has been provided by InstaForex Company - www.instaforex.com |
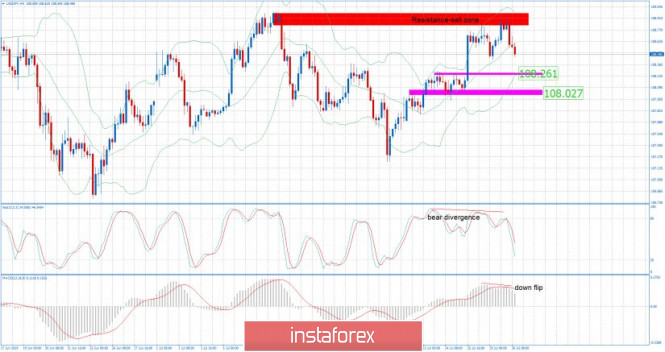
| USD/JPY analysis for July 30, 2019 - Downward momentum, more downside yet to come Posted: 30 Jul 2019 05:15 AM PDT USD/JPY did trade did exactly what I expected yesterday. The key resistance zone at the price of 108.90 was the key level for sellers to establish short position. Since there was a strong rejection of the resistance in the background and good supply entered on the market, my advice is still to watch for selling on the rallies. Technical picture:
Red rectangle – Key resistance 108.92 Pink rectangle – Support 1 (108.26) Pink rectangle – Support 2 (108.02) Stochastic oscillator showed us the bearish divergence in the background, which was good indication for the further downside. Fast and Slow line of the Stochastic oscillator are going more downside. MACD oscillator did showed the bearish divergence and the slow line flip to the downside, which is another confirmation for the downside. Important support levels to watch are set at the price of 108.26 and 108.02. The material has been provided by InstaForex Company - www.instaforex.com |
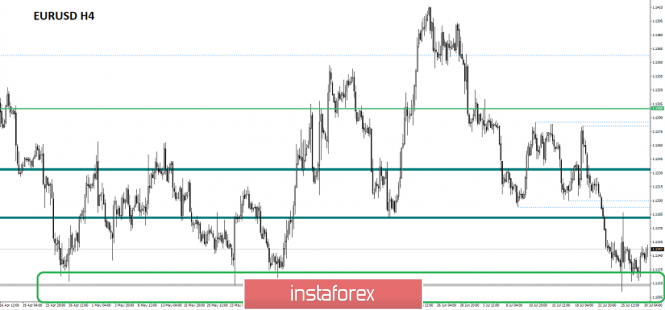
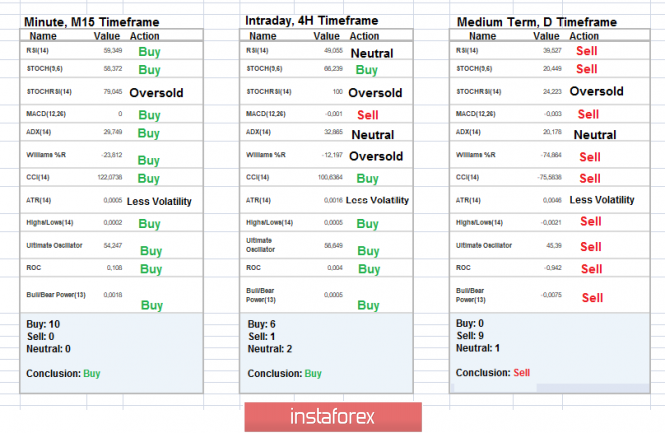
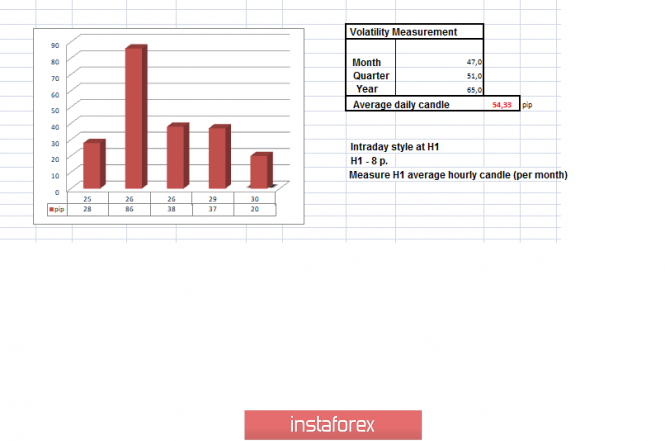
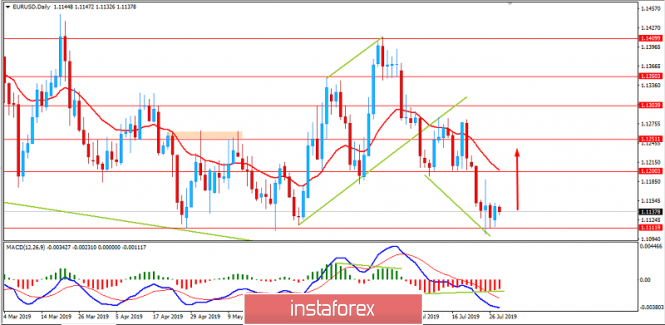
| Trading recommendations for the EURUSD currency pair - placement of trading orders (July 30) Posted: 30 Jul 2019 04:30 AM PDT Over the previous trading day, the euro / dollar currency pair showed a low volatility of 37 points, as a result, it continued to form a cluster within an important coordinate. From the point of view of technical analysis, we see that the quotation, after a close approach to the key range level of 1,1100, has entered a deceleration phase and, as a fact, forms a cluster of 1.1110 / 1.1150, as if taking a pause on the eve of an important event. As discussed in the previous review , traders continue to hold a wait-and-see attitude, analyzing the fixation points and the breakdown of the existing cluster. Considering the trading chart in general terms (daily timeframe), we see that the recovery of the global downward trend is hampered by the range level of 1,1100, restraining the pressure of sellers. The information background of the previous day did not contain any solid statistics about Europe and the United States. In it we have the next statements about the ill-fated Brexit. What was told? British Prime Minister Boris Johnson once again demonstrated his desire to leave the EU on October 31, no matter what. We will notice that England is ready to reconsider the agreement, since it considers the current agreements to be "dead." I note that in the recent past, the head of the European Commission, Jean-Claude Juncker, reminded Boris Johnson that the EU's position on the agreement is unchanged and the current agreement on withdrawal is the best and only possible deal. Obviously, this kind of position of the EU does not suit England and will never be arranged, and it's not worth waiting for the "Miracle on the Hudson". This is probably one of the reasons why Britain allocated 100 billion pounds to a large-scale advertising campaign in honor of preparing a country's exit without a deal. As the foreign exchange market reacted to the entire information background, in particular, the reaction took place exclusively in the US currency in the form of a rapid fall, while other currencies, such as, for example, the euro, take a waiting position, interpreting everything that happens. Today, in terms of the economic calendar, we have only statistics on the United States regarding personal income and expenses, which should grow by 0.4% and 0.3%. The key event of the week awaits us tomorrow in the Fed meeting. Further development Analyzing the current trading chart, we see that the accumulation process still remains on the market, forming an amplitude fluctuation within the limits of 1.1110 / 1.1150. Traders, in turn, continue to analyze the price fixing points, being out of the market. It is likely to assume a temporary preservation of the current oscillation with the analysis of fixation points. Based on the available information, it is possible to decompose a number of variations, let's consider: - Positions for the purchase, we consider in the case of fixing a clear price higher than 1,1150. - We consider selling positions after clearly fixing the price lower than 1,1100. Indicator Analysis Analyzing a different sector of timeframes (TF), we see that indicators in the short and intraday perspective have an upward interest due to current accumulation. The medium-term perspective maintains the downward interest in the market, due to the general background. Weekly volatility / Measurement of volatility: Month; Quarter; Year Measurement of volatility reflects the average daily fluctuation, based on monthly / quarterly / year. (July 30 was based on the time of publication of the article) The current time volatility is 20 points. It is likely to assume that in the event of a cluster breakout, volatility may increase. Key levels Zones of resistance: 1.1180 *; 1,1300 **; 1.1450; 1.1550; 1.1650 *; 1.1720 **; 1.1850 **; 1.2100. Support areas: 1,1100 **; 1.1000 ***; 1.0850 **. * Periodic level ** Range Level *** Psychological level **** The article is based on the principle of conducting a transaction, with daily adjustment. The material has been provided by InstaForex Company - www.instaforex.com |
| Brent crude seeks to the top with the goal of $65 Posted: 30 Jul 2019 03:51 AM PDT During the Monday auction on July 29, the cost of Brent crude oil showed a positive trend against the background of a possible reduction in the Fed rates. The uptrend continued on Tuesday. In many ways, he was helped by statements by the American president, Donald Trump, about the insufficiency of a small cut in the Fed's rates. According to the observations of experts, Brent crude quotations opened the trading week on a positive note, recovering to $64 a barrel. Currently, black gold is trading in the range of $ 64.17 to $ 64.25 per barrel. According to analysts' calculations, only a confident fixation of quotations above $65 per barrel will help break the downward trend and Brent is balancing near to it. The oil prices were supported by rising tensions in the Middle East, which returned to the previous concerns of the market about a disruption in the supply of raw materials. In addition to events in the Middle East, statistics on US oil reserves from the American Petroleum Institute (API) is capable of having a positive impact on Brent quotes. On Tuesday, the agency will present its assessment of the weekly change in stocks of raw materials. In case of their decrease, Brent will get an excellent opportunity to rise to $65 per barrel. According to a leading strategist at RJO, Phillip Streible, the global demand for black gold remains low. In order for oil quotes to be above current levels, China needs to increase purchases and the demand in the US should increase even more, analyst said. |
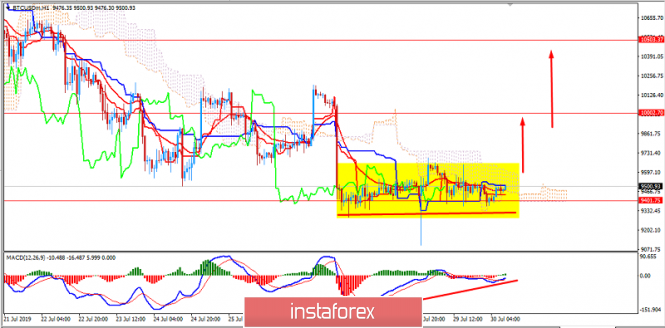
| Analysis of BITCOIN for July 30, 2019 Posted: 30 Jul 2019 03:29 AM PDT Bitcoin consolidation has been expanding since the price reached the $9,400 support after impulsive bearish pressure. After breaking below $10,000 with a daily close, the price is expected to push towards $8,500 observing the momentum. In light of the recent price correction, a counter-move to push towards $10,000 is more probable. After a sharp decline, the bitcoin price found support near $9,120. There has been a very little movement in Bitcoin prices over the past 24 hours. It has ranged between $9,600 and $9,430 in a very tight channel with little indication of a breakout in either direction. A trade volume is dropping off, currently down to $13 billion. BTC is holding on to support at the moment as the two-day consolidation rolls into a third one. From its peak of $13,800 last month, BTC has declined 31 percent to current prices. This would be a perfectly normal reaction from the parabolic price rise in recent weeks. In fact, BTC has experienced greater corrections of up to 40 percent, so further losses could be imminent. The key thing to note on the larger time frame charts is the lower lows. The bull market remains established, provided that Bitcoin does not plunge below $6k which could mean a major trend reversal. A drop to $8k would still mean that BTC has surged 100 percent in four months this year. This volatile week has marked an extension of the downward pressure that Bitcoin first incurred in late-June when BTC sharply moved to $13,800. This move has significantly bolstered bears and has jeopardized the upwards momentum that Bitcoin has faced since earlier this year. Additionally, this choppy price action over the past several weeks has allowed BTC to establish a new price range roughly between $9,350 and $9,650 which is likely to persist in the near future. To sum it up, Bitcoin still has chances to push higher as it remains above $8,500-9,000 with a daily close in the coming days. Currently trading above $9,400 indicates further upward pressure and consolidation explains the volatility and indecision in the Bitcoin market. Ahead of Fed's rate cut tomorrow, the crypto market is set to trade under higher volatility. Nevertheless, Bitcoin has a greater probability to surge higher in the short term. TECHNICAL OVERVIEW: The price is currently trading at the level slightly above $9,400 being held by dynamic levels as resistance. The price is trading inside the Kumo Cloud dynamic resistance which is needed to be broken above for further upward pressure to push the price to $10,000 or higher in the coming days. The price also formed Bullish Divergence along the way which also signals upward pressure. As the price remains above $8,500-9,000 with a daily close, BTC is likely to extend further upward pressure.
|
| Posted: 30 Jul 2019 03:19 AM PDT
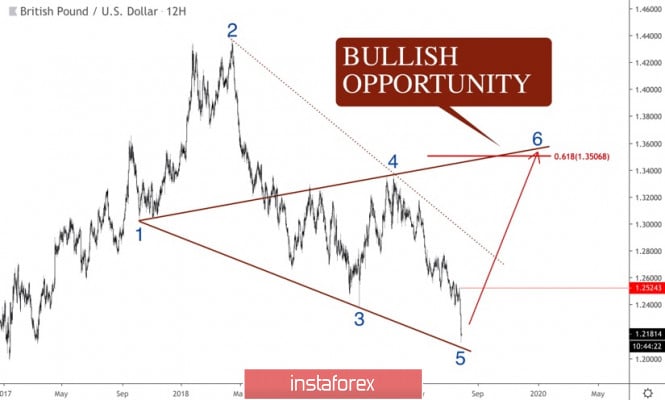
There's a possible bullish Wolfe Wave formation in GBP/USD. The price has almost achieved 1-3 Line, which is enough to consider the pattern finished. However, we should be ready to see a further decline towards 1-3 Line, which could act as support. Thus, this significant bullish opportunity requires confirmation such as an upward pullback towards upcoming wave 6. Additionally, we should watch the last local high 1.2524 as a confirmation level for the bullish outlook. 2-4 Line is also an important level; if the price goes through it, the scenario will be eventually confirmed. The main bullish target is 1-4 Line and the 0.618 retracement level of the last decline at 1.3506. The subsequent pullback from these levels could lead to another dramatic bearish decline. The bottom line is that GBP/USD has a significant bullish opportunity which requires confirmation. 1.2524 is far away from the current price, so we should wait for a local upward pullback from 1-3 Line at least. If this pullback arrives, there'll be more evidence for this scenario. The material has been provided by InstaForex Company - www.instaforex.com |
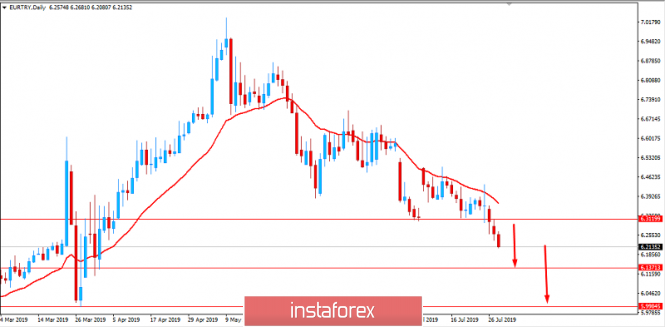
| Analysis of EUR/TRY for July 30, 2019: price to push lower towards 6.00 again? Posted: 30 Jul 2019 03:04 AM PDT The Turkish lira has been quite impulsive with the recent gains against the euro which has managed to dominate with non-volatile bearish momentum in place. The euro that been struggling with the economic challenges recently is expected to lose momentum against TRY in the coming days. The ECB kept the interest rates unchanged with the deposit rate at -0.4% and the main refinancing rate at 0.0%. Mario Draghi also indicated that there was a possibility of the further monetary policy easing on a later date. Moreover, the ECB has also assessed that the outlook for the European economy was getting worse day by day. The Governing Council pointed a reinvestment of the principal payments from maturing securities purchased under the asset purchase program for an extended period of time. As the inflation rate is persistently below the target levels, the ECB has also underlined the need for a highly accommodative stance of the monetary policy Before the ECB Press Conference, Germany's Social Democrat Finance Minister Scholtz rejected any pressure to increase fiscal spending. Besides the monetary policy measured by the ECB, fiscal support might be needed to cope with the current economic weakness. Admittedly, it still may difficult to introduce negative nominal interest rates, but if required Germany is expected to provide fiscal stimulus refuses. On the other hand, the Turkish central bank mentioned that the primary target of the TCMB was to maintain the price stability objectives along with the financial stability. The financial regulator has also explained the released data and provided an outlook for the near-term economic conditions. The inflation has been following the downward pressure on the back of a deceleration in unprocessed food and energy prices, along with the contribution from domestic demand and the tight monetary policy. The consumer price index on a yearly basis has peaked last October near 25.25% and decreased to 15.72% in June. The central bank's survey of inflation expectations over the next 12 months fell to 13.90% from nearly 16.5% at the end of last year. New governor Murat Uysal noted there was the room for maneuver in the monetary policy and came up with a frontloaded 425bp easing by considering the current inflation outlook. The economic confidence in Turkey has shown weakness The index decreased to 80.7 from 83.4, indicating uncertainty about the economic development. This week, the trade balance will be published along with the foreign arrivals of June. As of the current scenario, TRY, having better fundamentals, is expected to sustain the bearish momentum over EUR which may continue pushing much lower in the coming days without much of the bullish intervention in the process. TECHNICAL OVERVIEW: The price has resided below 6.32 area with a daily close. A retest is possible while the price is being held by the dynamic level of 20 EMA as the resistance. The preceding trend is strongly bearish and is expected to push further lower with a target towards 6.00 support area in the coming days. Though 6.1370 area can prove to be an obstacle for the upcoming bearish pressure, it is not quite strong to stop such an impulsive non-volatile preceding bearish trend.
|
| Analysis of EUR/USD for July 30, 2019 Posted: 30 Jul 2019 02:51 AM PDT EUR/USD has been going through corrections amid higher volatility after reaching the support area of 1.1120 ahead of long-awaited policy meeting of the Federal Reserve. The Federal Open Market Committee is widely expected to cut its interest rate by 25 points despite many signs of strength in the US economy. The global crisis is just around the corner. On Monday, President Donald Trump again targted the central bank appealing for more aggressive monetary easing. In this context, there is a strong likelihood of a rate cut. Fed's policymakers have made clear the nation's labor market looks pretty solid. Some of them have said the Fed may cut rates just once this time. Currently there is no clear consensus from Fed officials about why they need to cut rates in the first place, particularly with the US unemployment rate at near a 50-year low. The American economy is going on as the best-in-class performer among developed nations. US consumer prices rose 1.5% in the 12 months through May, the same rate it has averaged since the Great Recession ended in June 2009. The Fed wants inflation at 2%, and weak price gains have become a defining characteristic of what is already the longest US economic expansion on record. Inflationary pressures were higher in 1995, 1998, and 2007. Additionally, the upcoming rate cut is going to open doors for a further rate cut though the economy does not need it. Trade talks between the US and China are due to resume today with US trade representative Robert Lighthizer and Treasury secretary Steven Mnuchin travelling to Shanghai. Vice Premier Liu He is going to lead the talks for China. The previous round of the talks collapsed in May and Trump increased tariffs on $200bn of Chinese imports to 25% from 10% and threatened to slap 25% tariffs on a further $300bn worth of products. Additionally, this week the US jobs report for July will steal the spotlight with a consensus forecast for the economy to add 160,000 jobs, fewer than 224,000 in June. The unemployment rate is expected to tick down to 3.6%, while average hourly earnings are forecast to rise 0.2% month-on-month and 3.2% year-on-year. On the other hand, the eurozone's manufacturing sector continues to struggle. European Central Bank President Mario Draghi commented that the economic outlook is becoming "worse and worse". Thus, analysts expect signs of weaker growth in the euro area. Euro traders will be looking ahead to tomorrow's release of the year-on-year flash German inflation figures for July which are expected to decrease from 1.5% to 1.3%. It seems as though the ECB is in no rush to push interest rates into the negative territory as the officials mull the "nuances" associated with its non-standard measures However, it seems as though the Governing Council will continue to endorse a dovish forward guidance as the Governing Council "stands ready to adjust all of its instruments, as appropriate, to ensure that inflation moves towards its aim in a sustained manner." It may be only a matter of time before the ECB implements a negative interest rate policy (NIRP) for the Main Refinance Rate, its flagship benchmark for borrowing costs. President Mario Draghi steps down at the end of October and the upcoming change in leadership may produce headwinds for EUR as the central bank struggles to fulfil its mandate for price stability. TECHNICAL OVERVIEW: The price is currently trading just above 1.1120 support area with an impulsive bullish inside bar while also forming a Bullish Continuous Divergence along the way. The price is expected to push higher towards 1.1200-50 resistance area as it remains above the support area with a daily close. The price support of 1.1120 has managed to hold the price earlier. So, this support area is expected to play a vital role for upcoming volatility during the rate cut announcement tomorrow.
|
| GBP / USD: Will the Bank of England see a pound? Posted: 30 Jul 2019 02:47 AM PDT
The course of the British currency against the US dollar has fallen to a minimum since the beginning of 2017 against the background of the preparation of the UK government for the unorganized withdrawal of the country from the EU. Apparently, London is ready to act tough and mercilessly. Most likely, such a scenario will become a reality - after all, B. Johnson was the one who "sharpened" his office. It should be noted that the newly appointed prime minister was able to carry out the most large-scale change of government in the modern history of Great Britain without transferring power from one party to another, appointing his people to key posts. In addition, B. Johnson formed a group of ministers charged with the task of conducting Brexit by any possible means and which was already called the "military office". Meanwhile, the EU does not intend to resume negotiations with Foggy Albion under the terms of Brexit, however, according to experts, with the arrival of B. Johnson, the former paradigm, calculated on the "compromise" position of Theresa May, collapsed. Now, Brussels will have to reckon with the new alignment of forces, and it seems that the alliance will have to find a way out of the impasse. As for B. Johnson and his team, they are ready to build new relations with the EU. "We can make a new deal, but we have to prepare for a" tough "Brexit, if this cannot be done without. We just want to say that "backstop" is a bad idea. It is no longer relevant and should be abandoned, just like the current agreement on leaving the UK from the EU, but we are able to make a new deal, "the British Prime Minister said . "We want to improve the agreements with our partners in the EU, but for this, we need to cancel the undemocratic backstop," said United Kingdom Foreign Secretary Dominic Raab. He also said that, if necessary, the country should be ready to conduct operations based on the current tariffs of the World Trade Organization (WTO) before concluding free trade deals with other states. "The recent comments of D. Raab and B. Johnson were hardly encouraging investors. The GBP / USD pair broke long-term support at a low of 1.24 last week, and the last real support - at least 2016 - is at the level of 1.1840, "said Sean Osborne of Scotiabank. The British currency has undergone a serious sale of growing fears about Brexit without a deal, but the problems of the pound do not end there. It is expected that this Thursday the Bank of England may signal that it is unlikely to raise the interest rate in the coming months, which may put additional pressure on the British currency. Derivatives market lays in quotes more than 60% probability that the British Central Bank. It will reduce the interest rate by 25 basis points by December due to the fact that the country can leave the EU without an agreement. For comparison: in June, the chances of such a reduction were estimated at only 20%, since the regulator ignored global trends and indicated the need for a rate increase in the coming years. "With Boris Johnson, who has now become Prime Minister of Great Britain, the Brexit saga should resume. The shift of the Bank of England towards a neutral position - almost giving up hopes for further normalization - will leave little as support for the British currency, " said JPMorgan strategists. The material has been provided by InstaForex Company - www.instaforex.com |
| You are subscribed to email updates from Forex analysis review. To stop receiving these emails, you may unsubscribe now. | Email delivery powered by Google |
| Google, 1600 Amphitheatre Parkway, Mountain View, CA 94043, United States | |






No comments:
Post a Comment