
Forex analysis review |
- Fractal analysis of major currency pairs on August 1
- #USDX vs EUR / USD vs GBP / USD vs USD / JPY. Comprehensive analysis of movement options from August 01, 2019. Analysis of
- GBP/USD: London is trying to play the hard Brexit card. Would Brussels believe it?
- Softness, stiffness, obscurity. What will the Fed choose?
- Get to the bottom: Bitcoin could crash to $4,000 before a new takeoff
- GBP/USD. "Super Thursday" will not help the pound
- Gold: buy cheaper, sell more!
- EURUSD rate - complex thoughts before the Fed meeting
- July 31, 2019 : EUR/USD Intraday technical analysis and trade recommendations.
- July 31, 2019 : GBP/USD Intraday technical analysis and trade recommendations.
- What will happen to the dollar in each of the four scenarios the Fed
- BTC 07.31.2019 - Resistance zone on the test
- Technical analysis of AUD/USD for July 31, 2019
- Technical analysis of USD/CAD for July 31, 2019
- EUR/USD for July 31,2019 - Support on the test
- Technical analysis of NZD/USD for July 31, 2019
- Technical analysis of USD/CHF for July 31, 2019
- Gold 07.31.2019 - Broken important pivot at $1.430
- EURUSD: there is some evidence that the ECB needs to lower rates and launch an asset repurchase program
- GBP/USD: plan for the American session on July 31. There are no buyers for the pound, and sellers are waiting for the Fed's
- EUR/USD: plan for the American session on July 31. Eurozone data was expected to be ignored
- Overview of GBP/USD on July 31st. The forecast for the "Regression Channels". The nearest neighbors of Great Britain are
- Overview of EUR/USD on July 31st. The forecast for the "Regression Channels". The reduction in the Fed rate is not a panacea
- Forecast for Bitcoin and US dollar on July 31. Bitcoin, the most ambiguous tool, can move into growth again
- Forecast for EUR/USD and GBP/USD on July 31. The collapse of the pound overshadows the Fed meeting
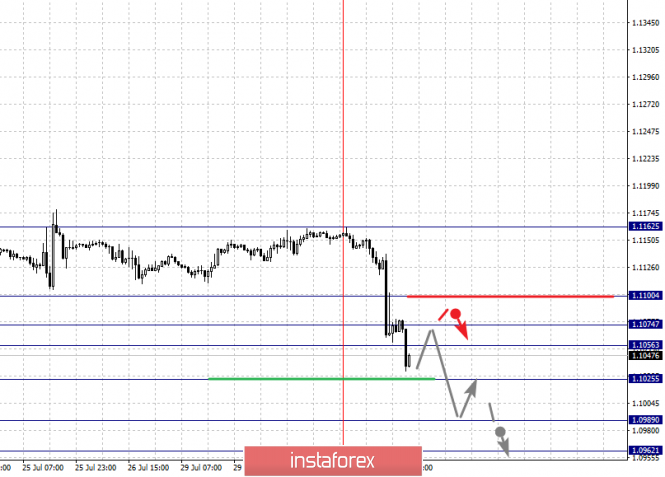
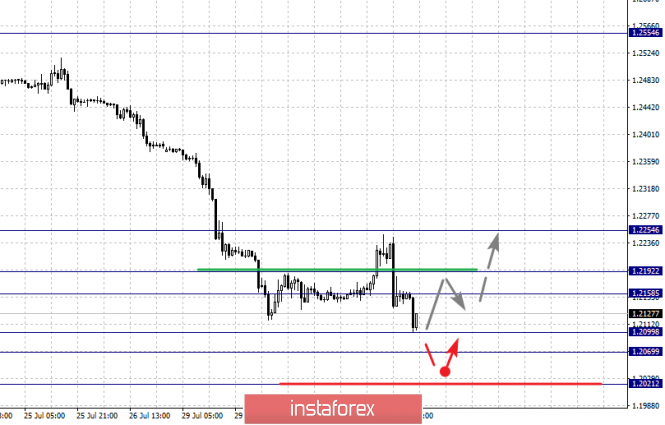
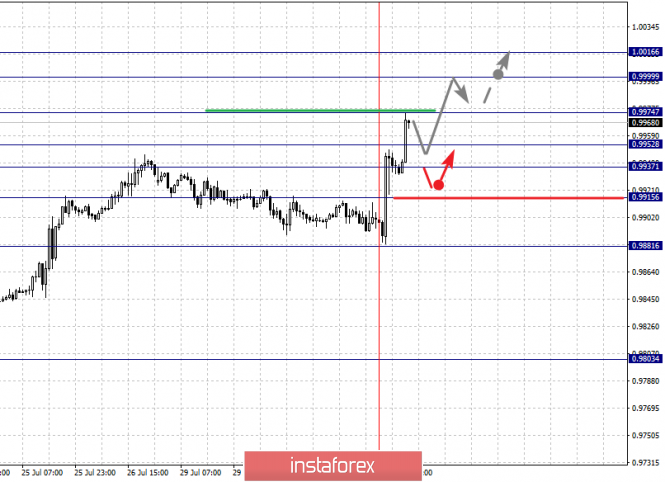
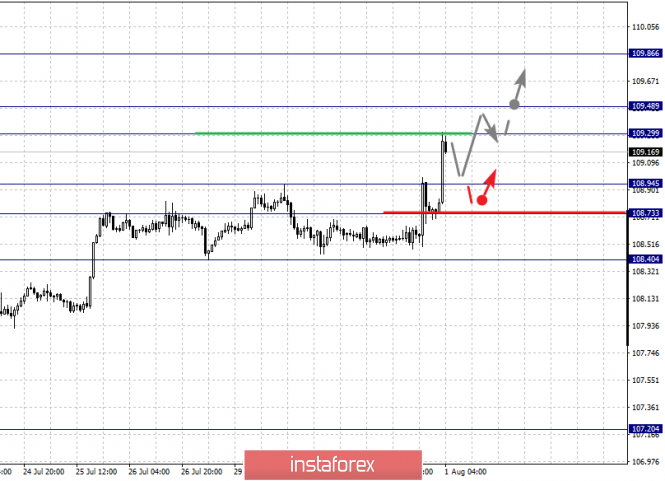
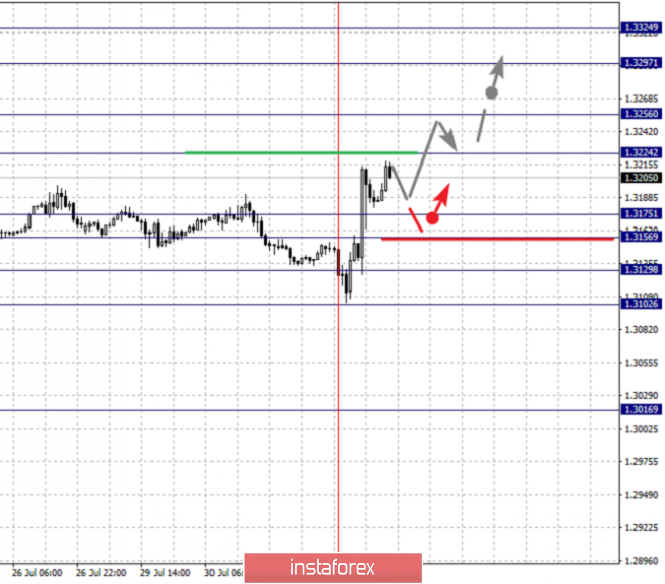
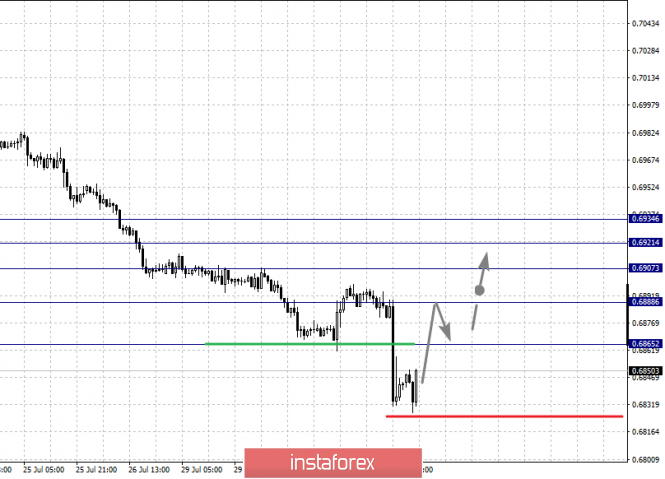
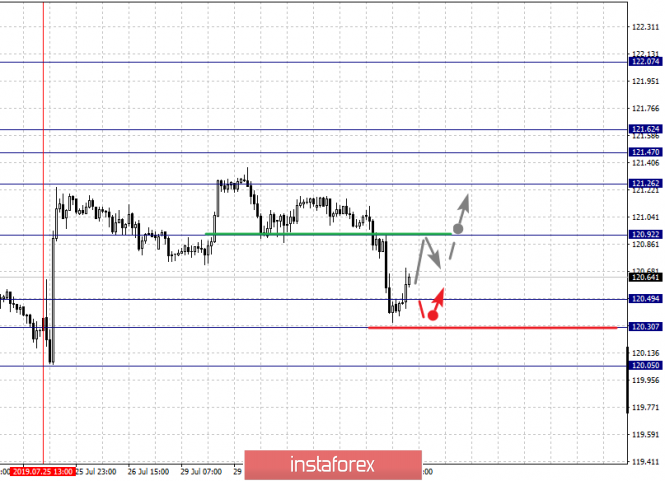
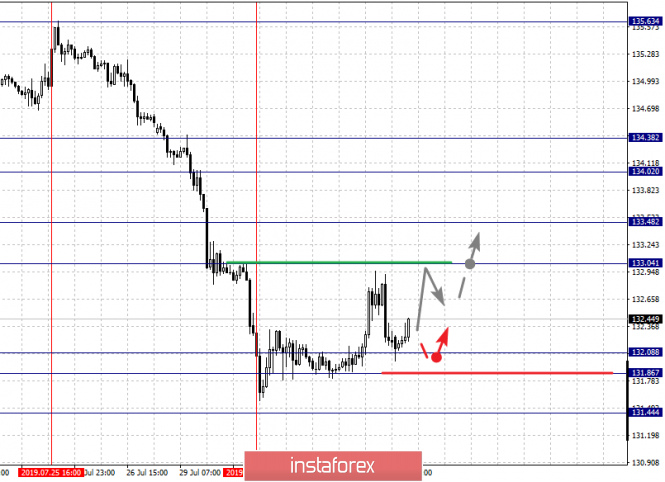
| Fractal analysis of major currency pairs on August 1 Posted: 31 Jul 2019 07:32 PM PDT Forecast for August 1: Analytical review of H1-scale currency pairs: For the euro / dollar pair, the key levels on the H1 scale are: 1.1100, 1.1074, 1.1056, 1.1025, 1.0989 and 1.0962. Here, the subsequent targets for the downward movement are determined from the downward local structure on July 31. The continuation of the movement to the bottom is expected after the breakdown of the level of 1.1025. In this case, the target is 1.0989. Consolidation is near this level. For the potential value for the bottom, we consider the level of 1.0962. After reaching which, we expect a rollback to the correction. Short-term upward movement is possibly in the range of 1.1056 - 1.1074. The breakdown of the latter value will lead to a prolonged correction. Here, the goal is 1.1100. This level is a key support for the downward structure. The main trend is the local downward structure of July 31. Trading recommendations: Buy 1.1056 Take profit: 1.1073 Buy 1.1076 Take profit: 1.1100 Sell: 1.1025 Take profit: 1.0990 Sell: 1.0987 Take profit: 1.0962 For the pound / dollar pair, the key levels on the H1 scale are: 1.2254, 1.2192, 1.2158, 1.2099, 1.2069 and 1.2021. Here, we are following a downward cycle of July 19th. Short-term movement to the bottom is expected in the range of 1.2099 - 1.2069. The breakdown of the last value will allow to expect movement to the potential target - 1.2021. From this level, we expect a departure to the correction. Short-term upward movement is possibly in the range of 1.2158 - 1.2192. The breakdown of the latter value will lead to the formation of the initial conditions for the top. Here, the potential target is 1.2254. The main trend is the downward cycle of July 19. Trading recommendations: Buy: 1.2158 Take profit: 1.2191 Buy: 1.2194 Take profit: 1.2254 Sell: 1.2099 Take profit: 1.2070 Sell: 1.2067 Take profit: 1.2025 For the dollar / franc pair, the key levels on the H1 scale are: 1.0016, 0.9999, 0.9974, 0.9952, 0.9937, 0.9915 and 0.9881. Here, the subsequent targets for the upward movement were determined from the local structure on July 31. The continuation of the movement to the top is expected after the breakdown of the level of 0.9974. In this case, the target is 0.9999. For the potential value for the top, we consider the level of 1.0016. After reaching which, we expect consolidation. Short-term downward movement is possibly in the range of 0.9952 - 0.9937. The breakdown of the latter value will lead to in-depth correction. Here, the target is 0.9915. This level is a key support for the local ascending structure of July 31. The main trend is the local ascending structure of July 31. Trading recommendations: Buy : 0.9975 Take profit: 0.9999 Buy : 1.0000 Take profit: 1.0016 Sell: 0.9952 Take profit: 0.9938 Sell: 0.9935 Take profit: 0.9917 For the dollar / yen pair, the key levels on the scale are : 109.86, 109.48, 109.29, 108.94, 108.73 and 108.40. Here, we are following the development of the ascending structure of July 18. Short-term upward movement is expected in the range of 109.29 - 109.48. The breakdown of the last value should be accompanied by a pronounced upward movement. Here, the goal is 109.86. Upon reaching this level, we expect a rollback to the bottom. Short-term downward movement is possibly in the range of 108.94 - 108.73. The breakdown of the latter value will lead to a prolonged correction. Here, the goal is 108.40. This level is a key support for the upward structure. The main trend: the ascending structure of July 18. Trading recommendations: Buy: 109.30 Take profit: 109.46 Buy : 109.50 Take profit: 109.84 Sell: 108.94 Take profit: 108.75 Sell: 108.70 Take profit: 108.45 For the Canadian dollar / US dollar pair, the key levels on the H1 scale are: 1.3324, 1.3297, 1.3256, 1.3224, 1.3175, 1.3156, 1.3129 and 1.3102. Here, the next targets for the top are determined from the local ascending structure on July 31. The continuation of the movement to the top is expected after the breakdown of the level of 1.3224. Here, the goal is 1.3256. Consolidation is near this level. The breakdown of the level 1.3257 should be accompanied by a pronounced upward movement. Here, the target is 1.3297. We consider the level of 1.3324 to be a potential value for the top. Upon reaching this level, we expect consolidation as well as a rollback to the bottom. Short-term downward movement is possibly in the range of 1.3175 - 1.3156. The breakdown of the latter value will lead to a prolonged correction. Here, the goal is 1.3129. This level is a key support for the top. The main trend is the local ascending structure of July 31. Trading recommendations: Buy: 1.3225 Take profit: 1.3255 Buy : 1.3257 Take profit: 1.3295 Sell: 1.3175 Take profit: 1.3156 Sell: 1.3153 Take profit: 1.3130 For the Australian dollar / US dollar pair, the key levels on the H1 scale are : 0.6934, 0.6921, 0.6907, 0.6888 and 0.6852. Here, we expect a return to the correction after the breakdown of the level of 0.6865. In this case, the first target is 0.6888. The breakdown of the level of 0.6888 will lead to the subsequent development of the ascending structure. In this case, the target is 0.6907. The breakdown of which, in turn, will allow us to count on the movement to the level of 0.6921. For the potential value for the top, we consider the level of 0.6934. Upon reaching which, we expect pronounced initial conditions for the upward cycle. For the downward movement, we do not yet consider subsequent targets. The main trend is the downward structure of July 18, we expect a withdrawal to the correction. Trading recommendations: Buy: 0.6865 Take profit: 0.6885 Buy: 0.6888 Take profit: 0.6907 Sell : Take profit : Sell: Take profit: For the euro / yen pair, the key levels on the H1 scale are: 122.07, 121.62, 121.47, 121.26, 120.92, 120.49, 120.30 and 120.05. Here, the cancellation of the ascending structure of July 25 is possible after the breakdown of the level of 120.30. In this case, the first target is 120.05. We expect a short-term downward movement in the range of 120.49 - 120.30. The continuation of the upward trend on the H1 scale is possibly after a breakdown of the level of 120.92. In this case, the first target is 121.26. The breakdown of which, in turn, will allow us to count on movement towards the noise range of 121.47 - 121.62. The main trend is the formation of the initial conditions for the upward cycle of July 25, the stage of deep correction. Trading recommendations: Buy: 120.92 Take profit: 121.24 Buy: 121.28 Take profit: 121.47 Sell: 120.49 Take profit: 120.30 Sell: 120.28 Take profit: 120.07 For the pound / yen pair, the key levels on the H1 scale are : 134.02, 133.48, 133.04, 132.08, 131.86 and 131.44. Here, the price is in the adjustment area of the downward structure on July 25th. The continuation to the bottom is possibly after the price passes by the noise range 132.08 - 131.86. Here, the potential target is 131.44. From this level, we expect another rollback to the top. A more thorough development of the adjustment structure is expected after the breakdown of the level of 133.04. Here, the first target is 133.48. Consolidation is near this level. The breakdown of the level of 133.48 should be accompanied by a pronounced upward movement to the level of 134.02. The main trend is the downward structure of July 25, the stage of correction. Trading recommendations: Buy: 133.04 Take profit: 133.45 Buy: 133.50 Take profit: 134.00 Sell: 131.86 Take profit: 131.50 The material has been provided by InstaForex Company - www.instaforex.com |
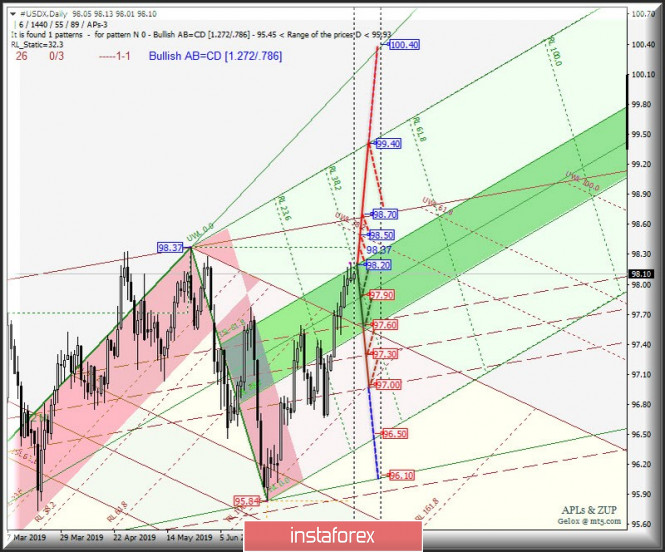
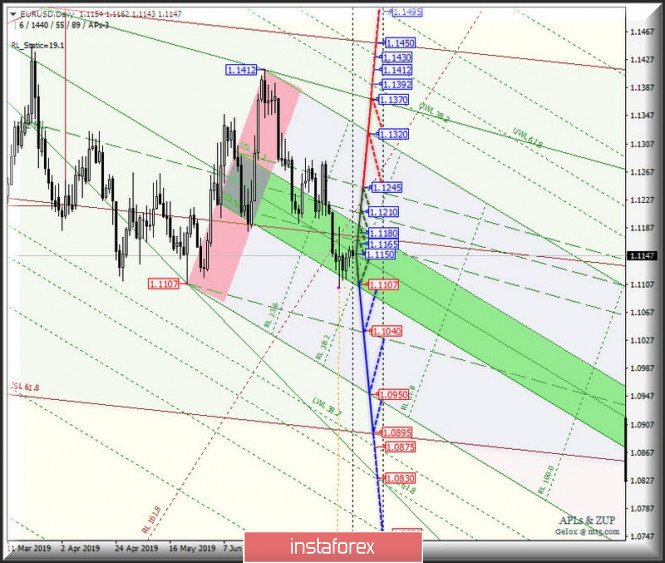
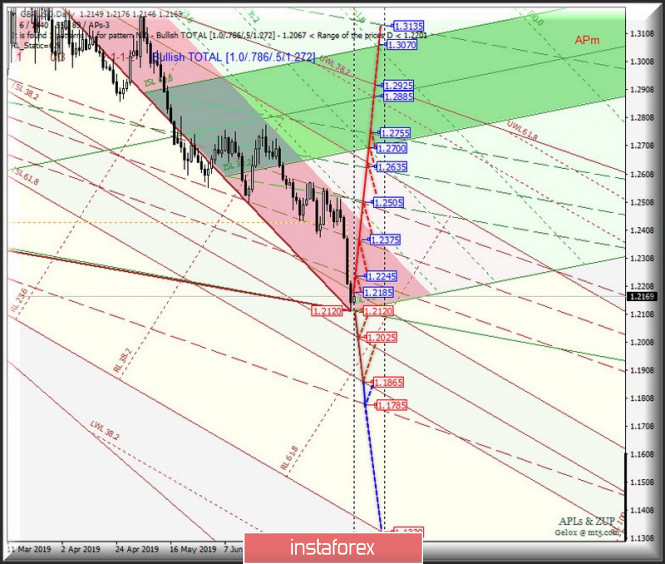
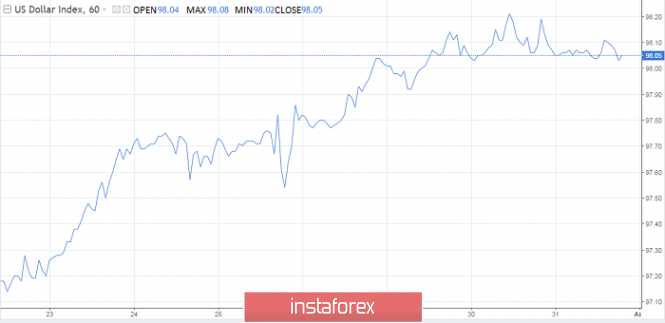
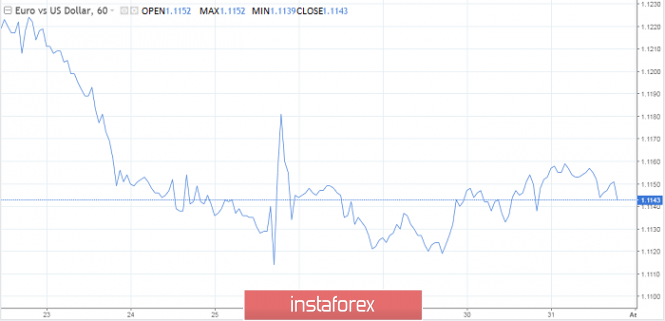
| Posted: 31 Jul 2019 05:20 PM PDT Let me bring to your attention the comprehensive analysis of the options of movement #USDX, EUR / USD, GBP / USD and USD / JPY from August 01, 2019. The proportion of these instruments in the calculation of the dollar index is 83.1%. Minor (Daily timeframe) ____________________ US dollar Index On August 1, 2019 the development of the dollar index movements #USDX will be determined by the processing and the direction of the breakdown of the boundaries of equilibrium zone (98.20 - 97.90 - 97.60) Minuette operational scale fork. Look at the animated graphics for the markup movement within this zone. The breakdown of the support level of 97.60 at the lower boundary of the ISL38.2 equilibrium zone of the Minuette operational scale fork will determine the development of the dollar index movement in the 1/2 Median Line channel (97.60 - 97.30 - 97.00) of the Minor operational scale fork. On the other hand, during the breakdown of the upper boundary of ISL61.8 (resistance level of 98.20) of the Minuette operating scale fork, the upward movement of #USDX can be continued to the targets - maximum 98.37 - warning line UWL38.2 Minor (98.50) - control line UTL Minor (98.70) with the prospect of reaching the final FSL Minuette lines (99.40). The markup of the #USDX movement options from August 01, 2019 is shown in the animated graphic. ____________________ Euro vs US dollar The development and direction of the breakdown of the equilibrium zone (1.1107 - 1.1150 - 1.1180) of the Minuette operational scale fork on August 2019 will determine the further development of the movement of the single European currency EUR / USD. See the details of the movement within this zone in the animated graphic. The breakdown of the upper boundary of ISL38.2 (resistance level of 1.1180) of the equilibrium zone of the Minuette operational scale fork will determine the further development of the movement of the single European currency in the 1/2 Median Line channel Minuette (1.1165 - 1.1210 - 1.1245), and if there will be a breakdown of the upper boundary (1.1245) of this channel, then the upward movement can be continued to the initial SSL (1.1320) and control UTL (1.1370) lines of the Minuette operating scale fork. Meanwhile, if EUR / USD breaks through the lower boundary of the ISL61.8 (support level of 1.1107) of the Minuette equilibrium zone of the fork, this will make it possible to continue the development of the downward movement of EUR / USD to the final Schiff Line (1.1040) and to the final FSL line (1.0950) Minuette operational scale fork. The details of the EUR / USD movement options are shown in the animated graphic. ____________________ Great Britain pound vs US dollar From August 1, 2019, Her Majesty's GBP / USD currency will begin to develop movement depending on the direction of the range breakdown :
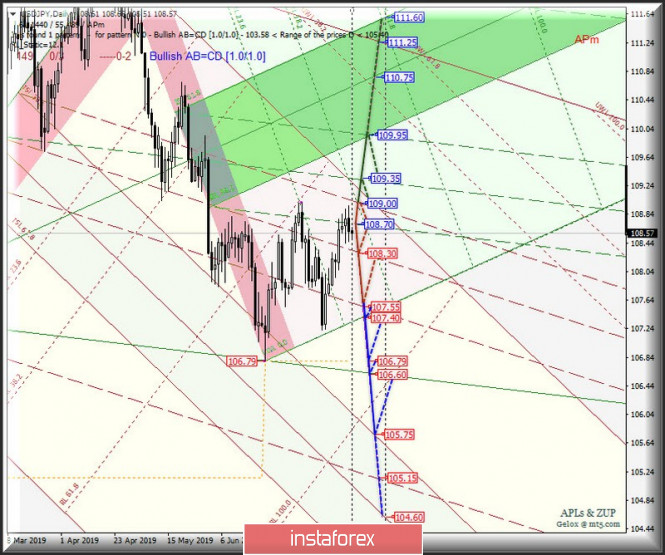
The breakdown of the resistance level of 1.2185 at the upper boundary of the ISL38.2 equilibrium zone of the Minor operational scale fork will direct the development of the GBP / USD movement to the boundaries of the 1/2 Median Line channels of the Minor operational scale forks (1.2245 - 1.2375 - 1.2505) and Minuette (1.2505 - 1.2635 - 1.2755). In the case of the breakdown of the initial SSL line (support level of 1.2120) of the Minuette operational scale fork, it will be possible to continue the development of the downward movement of Her Majesty's Currency towards the targets - the Median Line Minor (1.2025) - the lower boundary of the ISL61.8 (1.1865) equilibrium zone of the Minor operational scale fork - the final Schiff Line Minor (1.1785). The details of the GBP / USD movement can be seen in the animated graphic. ____________________ US dollar vs Japanese yen Starting from August 1, 2019, the movement of the "rising sun country" currency movement will be determined by the testing and direction of the breakdown of the boundaries of 1/2 Median Line channel (107.55 - 108.30 - 109.00) of the Minor operational scale fork. The movement options inside this channel are shown in animated graphics. A combined breakdown of the lower boundary of the 1/2 Median Line channel (support level of 107.55) of the Minor operational scale and the initial SSL line (107.40) of the Minuette operational scale will make it possible to continue the development of the downward movement USD / JPY to targets - local minimum 106.79 - control line LTL Minuette (106.60) - the upper boundary of the ISL38.2 (105.75) equilibrium zone of the Minuette operational scale fork. If the breakdown of the upper boundary of the 1/2 Median Line channel (resistance level of 109.00) of the Minor operational scale is taken, then the movement of the rising sun currency will be directed to the 1/2 Median Line Minuette (109.35) and to the boundaries of the equilibrium zone (109.95 - 110.75 - 111.60) Minuette operational scale fork. The details of the USD / JPY movement are presented at the animated graphic. ____________________ The review was compiled without taking into account of the news background. The opening of trading sessions of the main financial centers does not serve as a guide to action (placing orders "sell" or "buy"). The formula for calculating the dollar index is: USDX = 50.14348112 * USDEUR0.576 * USDJPY0.136 * USDGBP0.119 * USDCAD0.091 * USDSEK0.042 * USDCHF0.036. where power ratios correspond to the weights of currencies in the basket: Euro - 57.6% ; Yen - 13.6% ; Pound sterling - 11.9% ; Canadian dollar - 9.1%; Swedish krona - 4.2%; Swiss franc - 3.6%. The first coefficient in the formula gives the index value to 100 on the starting date - March 1973, when the main currencies began to be freely quoted relative to each other. The material has been provided by InstaForex Company - www.instaforex.com |
| GBP/USD: London is trying to play the hard Brexit card. Would Brussels believe it? Posted: 31 Jul 2019 05:07 PM PDT The British currency entered free fall mode amid the fact that the new Prime Minister of the United Kingdom, Boris Johnson, made it very clear that the country would withdraw from the European Union at the end of October, even without a deal. It should be noted that the passion around Brexit exciting the market is not the first time. Immediately after the referendum on Great Britain's membership in the EU back in 2016, the pound sterling collapsed by more than 10% against the US dollar, and the fall was repeated in the autumn of the same year when Theresa May (now the former prime minister) signaled that she does not intend to delay the process of the country's withdrawal from the bloc. Then, when investors believed that the government and the Parliament of the country were aiming for an orderly Brexit, the British currency rate stabilized. In April 2018, the pound even briefly touched a high of $1,434, - only 3.6% below the level marked before the referendum. Apparently, investors are once again sounding the alarm. "This time, the outcome of the British currency was at its highest since December 11 last year, when concerns about Brexit were at a peak without a deal," analysts at Royal Bank of Canada said. "The ghost of Brexit is once again putting pressure on the pound. The market is becoming increasingly worried about B. Johnson's "hard" position regarding negotiations with Brussels, especially after the new prime minister's readiness to withdraw from the EU by the end of October with or without a deal, "said Antje Prake, currency strategist at Commerzbank. "We still do not consider the UK withdrawal without a deal from the alliance as a baseline scenario, but the news background - political and economic - is likely to get worse, therefore the sterling still has room to fall," JPMorgan Asset Management believes. UniCredit economists expect that B. Johnson may call early general elections in early September to get a mandate to secede Great Britain from the EU without an agreement. Over the past month, the British currency has lost more than 4% in weight. The GBP/USD pair still risks moving down. According to analysts, the 1.2000 level is now psychologically important. The situation is compounded by Boris Johnson's failure to hold contact with any leaders of the EU, while they will not resume talks with London on the terms of the divorce. The European side, in turn, insists that the only possible agreement is the one that was developed with the participation of former Prime Minister T. May. On the eve of the publication The Sun, citing sources in the European Commission, reported that the EU considered the hard rhetoric of the new British Prime Minister Boris Johnson, as well as his assurances of readiness to make Brexit before October 31 at any cost, a bluff. "It is difficult to estimate now how far the parties are ready to go in this confrontation, and while it lasts, the pound plays the role of an exhaust valve. However, it is obvious that the euro will also experience negative effects, and the EUR/USD pair may not hold the level of 1,1100. The matter has not yet reached the possible hard Brexit, and the German export machine is almost on its knees. The United Kingdom is almost equal to China in terms of importance for German exports, its share being approximately 7%. For the entire European Union, exports to the United Kingdom are an impressive £345 billion. Is the EU ready to cause a recession in itself, punishing one of its largest buyers?" said analysts at Saxo Bank. "News of a concession of the position of any of the parties would be favorable for the pound. Since B. Johnson placed everything on the implementation of Brexit not by hook or by crook, rather, it will be a message that the European side agrees to the resumption of negotiations. Then a stabilization or even growth is possible for the pound in the near future," they added. The material has been provided by InstaForex Company - www.instaforex.com |
| Softness, stiffness, obscurity. What will the Fed choose? Posted: 31 Jul 2019 04:47 PM PDT Market participants pledged a quarter point reduction in quotes. Few doubt the development of this scenario. Therefore, traders are mostly interested in Jerome Powell's speech at the moment, in which they expect to catch clues on how much the regulator is ready to continue the chosen line of monetary policy. Today, it will not be easy for the US Federal Reserve to manage market expectations. In recent years, there has been a big gap between the expectations of market participants and the Fed's forecasts. The central bank is trying to tune traders to a more stringent policy, whereas softness is preferable for the market. Now these two points of view have gone towards rapprochement, which has been the most significant market driver since October 2018. In the past few weeks, the dollar has been influenced by a reassessment of the likelihood of aggressively easing monetary policy. However, the likelihood of such a scenario development has noticeably decreased - from 60% to 20%. Which way will the US regulator take? The most realistic are the two options, but the third one is possible. Softness If the regulators hint that they, like the debt market, are cautious about the future, then shares will continue to grow. Low rates have a positive effect on business activity, fueling demand. In this scenario, the yield of government bonds will fall, however, like the dollar. Such a shift in the central bank's rhetoric is able to launch a trend for months of weakening the US currency. The dollar index can lose 9% and go to 89. In this case, the 1.23 mark will appear on the horizon before the EUR/USD pair. Donald Trump should be pleased. This is a dubious pleasure for the Fed because its independence will be called into question. Obscurity Most likely, Jerome Powell will open all the doors and catch up with the fog, and then market participants will think on their own. Perhaps the Fed chairman will say that the future path is not predetermined, the central bank's decision depends very much on the state of the world and the US economy. This result will leave the stock markets near highs, the dollar index stalled around the mark of 98. Traders at this time will try to extract the necessary information from the data on the labor market. The outcome of trade negotiations will also play an important role. In this case, the euro will have to fight for the 1.10 mark. The reaction of the foreign exchange market could well be harsh, but not for long, emotions will quickly subside and make room for the mind. The trend change for the dollar is not expected. Stiffness It is quite possible that today's symbolic easing of politics will become a one-off measure and there will be no hint of further relief. Markets are hardly ready for such a surprise. The dollar will jerk up. The upward trend in USDX can accelerate and by the end of the year will send it to 103, and EUR/USD - to 1.04 or 1.05. Even more unexpected and extreme will be signals that the regulator is considering a rate hike in the near future if trade negotiations with China succeed. The material has been provided by InstaForex Company - www.instaforex.com |
| Get to the bottom: Bitcoin could crash to $4,000 before a new takeoff Posted: 31 Jul 2019 04:37 PM PDT According to the calculations of the leading cryptanalyst Alessio Rastani, at the moment Bitcoin can fall to $4000 before reaching a new record high in 2020. The analyst fears that the excessive optimism of crypto investors prevents them from objectively assessing the situation on the market. On Tuesday, July 30, BTC was trading at $9,570. Later, the number one cryptocurrency was in the price range from $9593 to $9685. Over the past day, the value of the digital asset has not changed much, the BTC domination index has consolidated at 64.3%. If on Wednesday, July 31, the level of average prices will once again support the BTC/USD pair, then bitcoin's recovery will continue, analysts are certain. Most analysts agree that Bitcoin will adjust in the range of $8,500 to $ 8,000, after which there will be a long period of consolidation. Then we should expect a new parabolic rally from $20,000 to $30,000 as the halving approaches in May 2020, analysts say. According to A. Rastan, the current BTC correction can be completed at much lower levels than previously thought. The analyst does not exclude the emergence of a dizzying price "roller coaster", because of which Bitcoin will first collapse to $1,800– $1,600, and then return to $14,000– $20,000. However, this scenario is unlikely, analysts say. A cryptanalyst predicts a change in the Bitcoin price trend in the range of $4,000- $6,500 and the beginning of its growth to a new record high in the middle of 2020. Many analysts pay attention to the difficulties that the number one cryptocurrency is experiencing when trying to recover above the level of $10,000. In this situation, the digital asset begins to slip in the range from $9,400 to $9,800. This indicates a high probability of falling to the next level of $9000, analysts say. However, the market situation will largely depend on the number of new players and their rates, which can start both the process of pulling down and also contribute to the growth of Bitcoin, analysts conclude. The material has been provided by InstaForex Company - www.instaforex.com |
| GBP/USD. "Super Thursday" will not help the pound Posted: 31 Jul 2019 04:21 PM PDT The pound-dollar pair demonstrated correctional growth today after updating its annual low and reaching two-year price troughs. Bears of GBP/USD could not enter the 20th figure, after which the bulls seized the initiative and nearly 100 points passed in a day. This dynamic is mainly due to technical factors - an overabundance of short positions in the British currency makes itself felt. In addition, the market "remembered" that the prime minister of Britain, with all his desire, cannot single out the country from the EU - this requires the approval of the Parliament. Ironically, the House of Commons, after several years of confrontation with the government of Theresa May and Brussels, can become an unexpected ally of the Europeans, stopping the implementation mechanism of the chaotic Brexit. Deputies have already taken preventive measures by adopting an amendment to the law on self-government in Northern Ireland. This provision does not allow the prime minister to stop the Parliament's work, which can quickly block withdrawal from the EU without an agreement. In turn, Johnson can decide on early Parliamentary elections, hoping to get the majority under control. There are several other scenarios, one of which is the announcement of a vote of no confidence in the newly minted premier. In any case, Johnson faces a difficult struggle within the walls of the British Parliament, whose members, as we recall, did not support the option of a "hard" Brexit during a signal vote at the beginning of this year. This disposition made it possible for the pound to move away from the level of two-year lows. On the other hand, the British currency continues to be under strong background pressure, as Brexit prospects remain dim - even if Parliament does not allow Johnson to withdraw the country from the Alliance without an agreement on October 31. London and Brussels are still at different poles on many issues - which includes the fate of the Irish border. Therefore, this political rebus will remain unresolved in any case - until one of the parties makes substantial concessions. Given the current situation, any growth in the British currency should be treated with caution. Here it is worth recalling that the so-called "super-Thursday" is expected tomorrow, when several important events take place within a day: the Bank of England meeting, the release of the quarterly report on inflation and the publication of a summary of monetary policy. The news marathon is completed by Mark Carney, who will hold an extended press conference. Such a "news jackpot" is relatively rare, so traders are unlikely to ignore it, despite the undeniable priority of the Brexit issue. However, these issues can not be separated from each other. Last year, the head of the Bank of England warned of the extremely negative consequences of a hard Brexit. In particular, he said that if Britain withdraws from the EU without a deal, then the country will have to rely on the conditions of the WTO. The head of the English regulator even admitted the likelihood that the monetary policy in this case would be revised in the direction of easing. Since then, Carney's rhetoric has not undergone any fundamental changes. He does not tire of repeating that the prospects for monetary policy depend primarily on the prospects for the negotiation process. Moreover, the transfer of Brexit in this context will also not be an acceptable solution, since in this case the period of uncertainty will only be extended. In other words, the English regulator unequivocally associated a further increase in the interest rate with a soft Brexit, and Mark Carney consistently advocated this causal relationship. Given the recent events, the head of the Bank of England is unlikely to toughen his rhetoric - on the contrary, he can describe in more detail the prospects for the chaotic scenario. That is why tomorrow's inflation report and monetary policy summary will play a secondary role, and the focus of GBP/USD traders will be on Carney's rhetoric. Also, do not forget that the English regulator closely monitors the dynamics of the global trade war. Let me remind you that the 12th round of talks between Beijing and Washington was completed ahead of schedule today. The parties noted "some progress" and agreed to meet again in September. The market clearly expected more from this meeting, so anti-risk sentiments returned to the market. This factor can also affect the mood of the members of the English regulator, reinforcing their "dovish" attitude. Thus, the "super-Thursday" is unlikely to help the British currency in restoring its position. Against the background of the Brexit lull, the pound will follow the US currency in anticipation of the next news drivers. Therefore, the trading strategy for the GBP/USD pair remains unchanged - short positions for any more or less large-scale correctional growth. The material has been provided by InstaForex Company - www.instaforex.com |
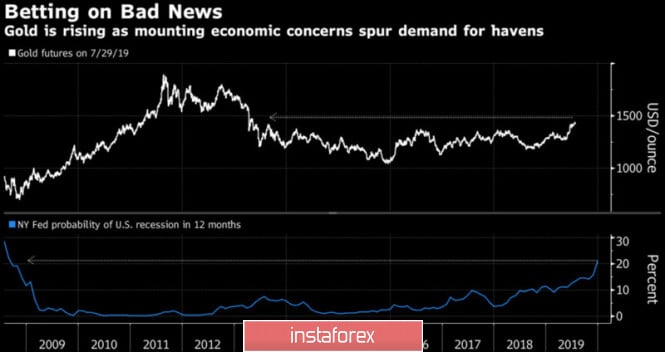
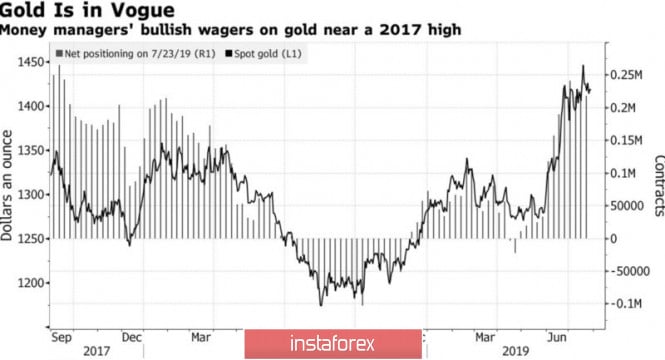
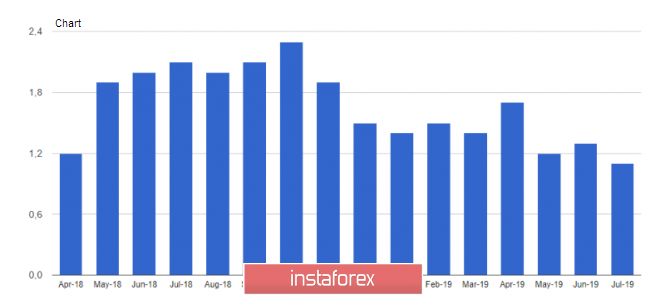
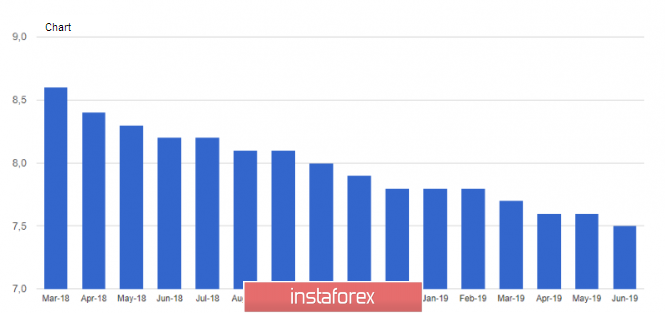
| Posted: 31 Jul 2019 03:46 PM PDT Gold came fully armed to the US Federal Reserve meeting. Investors are confident that the central bank will lower the federal funds rate by 25 bp and are also expecting to receive an answer from Jerome Powell to the question whether the Fed will limit itself to one act of monetary expansion or start its cycle. In the first case, the US dollar will receive an excellent opportunity for growth, in the second it will be sold off. Given the close correlation of the precious metal with the US currency, one should expect a violent reaction from XAU/USD to the results of the FOMC meeting. According to Commerzbank, a serious correction will not happen even if gold subsides due to the Fed's unwillingness to give the market what it expects. The bank recommends using the fall in XAU/USD quotes for purchases and nods at the background that is favorable for the precious metal. Indeed, the conflict in the Middle East, Brexit and uncertainty in the trade negotiations between the US and China have brought the political risk index back to the area of multi-year highs. Iran threatens to block the Strait of Hormuz, new British Prime Minister Boris Johnson is ready to deliver an ultimatum to the EU, and Donald Trump is aggravating the situation during the negotiations of the US delegation in Shanghai. According to the owner of the White House, the Chinese are not fulfilling their obligations to increase purchases of agricultural products in the United States. They say one thing, but they do something completely different. Global Political Risk Index Dynamics According to one of the best forecasters of Bloomberg for gold, Societe Generale, the precious metal will grow as the probability of a recession in the United States increases. The indicator from the Federal Reserve Bank of New York shows that the chances of a downturn in the US economy over the next 12 months have risen to their highest since 2008. Societe Generale notes that the end of the economic cycle will lead to a weaker US dollar, which is good news for XAU/USD bulls. Speculators are increasing their long positions, while ETF fans have increased their stocks of specialized exchange funds to 2,350.1 tons, the highest level since April 2013. Dynamics of gold and speculative positions The White House's criticism over the Fed provides support to the precious metal. According to Donald Trump, the central bank is obliged to lower the federal funds rate from 2.5% to 1.5% and stop the balance reduction process. Jerome Powell and his colleagues acted incorrectly, tightening monetary policy too quickly. It's time to get back on track. Despite the fact that the Fed does not depend on the president, the wishes of the latter come to life: at the end of 2018 Trump spoke of the need to halt the process of monetary tightening, and the Fed paused at the beginning of 2019. Why did the turn of demands for a reduction in the federal funds rate come? The derivatives market is confident that it will fall by 25 bps in July and September. Technically, the bears' inability to bring gold quotes to support at $1,408 and $1,402 per ounce was the first sign of their weakness. If the bulls manage to bring the precious metal beyond the upper limit of the red triangle, and then manage to rewrite the July high, the risks of implementing the target by by 161.8% according to the AB = CD pattern will increase. The material has been provided by InstaForex Company - www.instaforex.com |
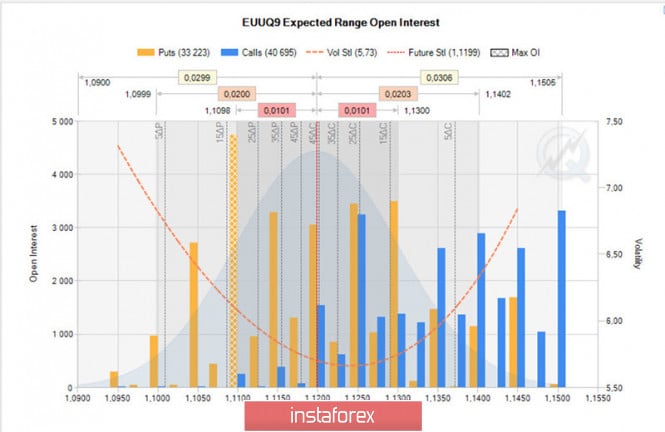
| EURUSD rate - complex thoughts before the Fed meeting Posted: 31 Jul 2019 03:46 PM PDT Hello. The depreciation of the euro against the US dollar has set a task for traders that requires a non-trivial solution, and, looking at what is happening now, I want to exclaim - "Do not panic, but do panic!". I'll say right away that I'm not a magician, I don't know how to foresee the course, however, with some knowledge I can assume what will happen next and try to work out an algorithm of actions with which I will introduce to those who will read this article. Judging by what is happening with EURUSD, it can be assumed that most traders are now at a loss. Following Murphy's law, which is better known as the law of meanness, we should assume the worst - If something can go wrong, it will. Since I know very well how traders behave, I can safely assume that, in terms of the EURUSD recovery, most of them were averaged as the European currency depreciated and now they have huge positions to buy the euro, which is fraught with great trouble. I must say, I have no directions for those who do not follow the rules of money management, medicine is powerless here. However, for those who adhere to these rules, we will consider the option of further pulling down the rate of the European currency in order to determine its possible parameters, for which we use the data kindly provided to us by the CME exchange (Fig. 1). The diagram, which reflects the state of the market as of July 30, shows the option strikes and the distribution of traders' expectations for the CME exchange. The futures price is 42 points higher than the values we see in our InstaForex terminals, around the level of 1.12. As you can see, put options have built strong support levels on values - 1.12, 1.1150, 1.11 and 1.1050. The highest level of support is currently located at 1.11, which for the spot market (quote in the terminal) means the level of 1.1050. Figure 1: Probability distribution of the EUUQ9 option contract expiring on August 9 It is believed that options sell only large structures (although this, of course, is not always the case), therefore lowering prices below the put option levels will result in the fact that big traders will suffer and be forced to sell futures at prices that are obviously unprofitable. At the same time, the Max Pain (maximum pain) point in which option buyers lose the premium paid is now at 1.13. This means that if by the time the option is closed (August 9), the futures price will reach the level of 1.13 (1.1250 spot), the sellers of the options will win, and the buyers will have the greatest loss. This arrangement of the futures and option strikes seems to indicate that the EURUSD rate should go up, not down, but there is another point that must be taken into account - this is the time when the option contracts expire, and they expire on August 9. In other words, option sellers need the price to be as close as possible to the 1.13 level exactly on August 9, and they are not particularly interested in what the price will do until that time. Now look at the bell-shaped probability distribution curve, colored in gray. This curve represents the distribution of the course and shows us the 68% probability of closing the euro futures in the range of 1.1098-1.1300, and 95% probability of closing the futures in the range 1.09-1.1402. Let's see what this means for us? With a probability of 70%, we can assume that the EURUSD exchange rate on August 9 will be in the range of 1.1050-1.1250 and with a 95% probability it will close in the range of 1.0850-1.1350. Now we take an important assumption. We should take into account that the market is not static, and with the change in the euro, the probability ranges and open interest on the strikes of option contracts will also change, but since there are only a few days left until the option expires, we can ignore this. Based on the foregoing, we can make significant conclusions: until August 9, the euro futures contract may drop to the value zone of 1.11 (1.1050) or even lower, and then return to the level of 1.13 (1.1250). Moreover, its movement in this range can be chaotic. Now let's take a look at the chart of the EURUSD rate in the terminals of InstaForex Company. If you bought the euro, and since you are reading this article, you probably did, where did you put your stop, at what level? The answer is you would put the stop below the 1.11 level. What is a stop order in your case? This is for you, it is an order to close losses, and for everyone else it is an order to sell the EURUSD rate at a price below the 1.11 level. Now answer yourself the question: if you were a market maker and wanted to withdraw the price to the level of 1.1250 by the 9th day, then where would you like to buy EURUSD, at what rate? That's right, at the rate below 1.11. Considering the above, there is a very high probability that after the announcement of the Fed's decision, the EURUSD rate will drop to the level of 1.1050. Where there are stop orders, where most traders will suffer losses, and some of them will receive a margin. Yes, yes, this is what awaits the traders, who for some reason decided that they are the smartest, and therefore do not comply with the risks. Personally, as someone who is interested, I would very much like the EURUSD rate to soar up to the sky following the Fed meeting, but I think that, unfortunately, this will not happen, so today I took steps to minimize my losses. Hoping for the best, prepare for the worst, and may we all be lucky. The material has been provided by InstaForex Company - www.instaforex.com |
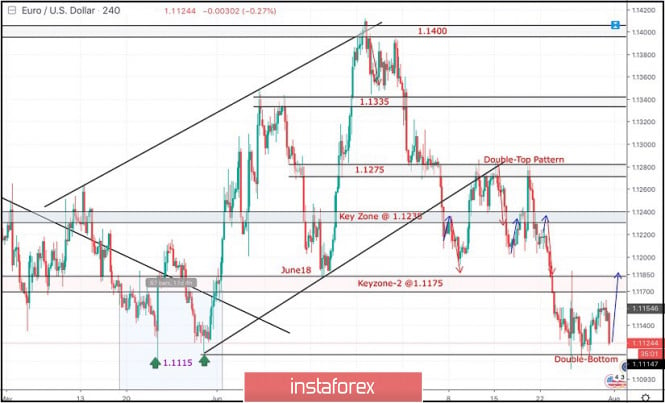
| July 31, 2019 : EUR/USD Intraday technical analysis and trade recommendations. Posted: 31 Jul 2019 09:43 AM PDT
Back in June 24, the EURUSD looked overbought around 1.1400 facing a confluence of supply levels. Thus, a bearish movement was initiated towards 1.1275 followed by a deeper bearish decline towards 1.1235 (the lower limit of the newly-established bullish channel) which failed to provide enough bullish support for the EUR/USD. In the period between 8 - 22 July, sideway consolidation range was established between 1.1200 - 1.1275 until a double-top reversal pattern was demonstrated around the upper limit. Recent Bearish breakdown of the pattern neckline confirmed the short-term trend reversal into bearish towards 1.1175. Fortunately, evident bearish momentum (bearish engulfing H4 candlestick) could bring the EURUSD back below 1.1235 which stands as an Intraday Supply zone to be watched for Intraday SELL entries upon any upcoming bullish pullback. HOWEVER, Early bearish breakdown below 1.1175 facilitated further bearish decline towards 1.1115 (Previous Weekly Low) where evident bullish rejection was recently demonstrated on July 25. That's why, Intraday bullish pullback was demonstrated towards 1.1175-1.1200 where a valid SELL entry was suggested in a previous article. It's already running in profits. This week, bearish persistence below 1.1115 was mandatory to allow further bearish decline initially towards 1.1025. However, the EUR/USD pair failed to establish a successful breakdown below 1.1115. Instead, a short-term bullish double-bottom pattern was established around 1.1115 (Weekly Low). The EUR/USD remains trapped between the depicted zones (1.1115-1.1175) where a bullish pullback towards 1.1175 should be expected in the near future. Conservative traders should look for a bullish Head & Shoulders pattern being demonstrated around the current price levels as an early sign of intermediate-term trend reversal where the right shoulder of the pattern is probably being established around 1.1125. Trade recommendations : Conservative traders should wait for a bullish breakout above 1.1175 for a valid BUY entry with initial bullish target around 1.1235. Risky traders can have a BUY entry anywhere around the current price levels (1.1124). Initial bullish target should be placed at 1.1170 with tight S/L to be located below 1.1090. The material has been provided by InstaForex Company - www.instaforex.com |
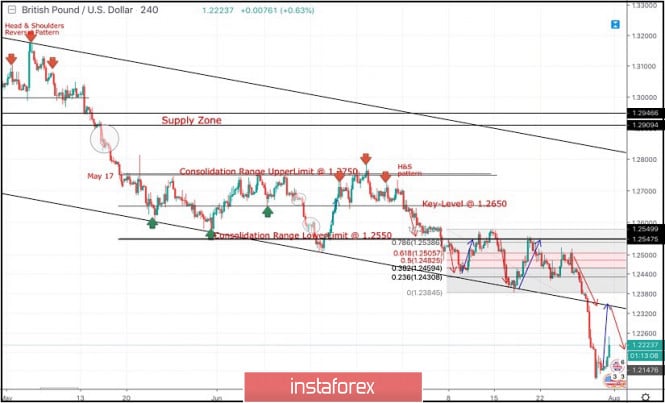
| July 31, 2019 : GBP/USD Intraday technical analysis and trade recommendations. Posted: 31 Jul 2019 08:57 AM PDT
Since May 17, the previous downside movement within the depicted bearish channel came to a pause allowing the recent sideway consolidation range to be established between 1.2750 - 1.2550 with a prominent key-level around 1.2650. On July 5, a bearish range breakout was demonstrated below 1.2550 (the lower limit of the depicted consolidation range). Hence, quick bearish decline was demonstrated towards the price zone of 1.2430-1.2385 (where the lower limit of the movement channel came to meet the GBPUSD pair). In July 18, a recent bullish movement was initiated towards the backside of the broken consolidation range (1.2550) where another valid SELL entry was offered two weeks ago. As anticipated, bearish persistence below 1.2460 (38.2% Fibonacci levels) and 1.2430 (38.2% Fibonacci Level) enhanced further bearish decline towards 1.2350. Moreover, Bearish breakdown below 1.2350 facilitated further bearish decline towards 1.2320, 1.2270 and 1.2125 which correspond to significant key-levels on the Weekly chart. The current price levels are quite risky/low for having new SELL entries. That's why, Previous SELLERS were advised to have their profits gathered. Recently, weak signs of bullish recovery were demonstrated around 1.2125. This May push the GBPUSD to retrace towards 1.2260 then 1.2320 if sufficient bullish momentum is maintained On the other hand, The price zone of 1.2320 - 1.2350 now stands as a prominent SUPPLY zone to be watched for new SELL positions if the current bullish pullback pursues towards it. Trade Recommendations: Intraday traders were advised to look for early signs of bullish rejection around the price levels of 1.2125 for a counter-trend BUY entry. Conservative traders should wait for the current bullish pullback to pursue towards 1.2320 - 1.2350 for new SELL entries. S/L should be placed above 1.2430. Initial T/P level to be placed around 1.2279 and 1.2150. The material has been provided by InstaForex Company - www.instaforex.com |
| What will happen to the dollar in each of the four scenarios the Fed Posted: 31 Jul 2019 07:55 AM PDT
The Fed intends to lower interest rates for the first time after the crisis, the regulator is preparing the markets for this event in July. There are two main reasons for this: weak inflation and tensions in world trade. While the markets are arguing about the rate of rate cuts, Fed officials look at what is happening in different ways. Consider the four scenarios of the Fed's decision and the dollar's reaction. 1) One-time rate reduction — USD up If the Fed reduces the rate as insurance and does not take any further steps, the dollar will grow. This scenario is most likely, given the latest economic data. The dollar is likely to rise in all directions with a noticeable rise against the euro, which is vulnerable after the ECB opened the door to a new stimulus. The pound will also suffer, but this scenario will not affect the yen, perhaps there will be a slight drop. 2) Reduce and "open the door" — USD down The Fed can "open the door" to further lower rates — adhering to market expectations — without taking any concrete steps. Powell, citing growing uncertainty, may announce new moves this year. In this scenario, which has an average probability, the dollar is likely to fall, but not critically, in the end, the markets expect further cuts. The depreciation of the dollar will be uniform in all directions. 3) Reduction by 50 bp — the fall of the USD To calm the markets, Powell can choose a shock reduction of 50 basis points. Even if he says that no further action is expected, a significant rate cut is likely to have a serious negative impact on the dollar. This scenario is unlikely, as the Fed values its reputation. In this scenario, commodity currencies such as the Canadian and Australian dollars may be on the wave due to increased risk appetite, which may cover the stock markets. In this case, a safe haven will lose ground. 4) There will be no reduction — USD growth Another low-probability scenario. Recent optimistic data will force the Fed to hold its position and only "open the door" to lower rates in September. In this scenario, the dollar will grow rapidly. Its chances are extremely small, as it contradicts a clear signal to the markets, but this cannot be ruled out. Commodity currencies could suffer from a massive sell-off along with the euro and the pound. The yen and possibly the Swiss franc may surpass the US dollar. The material has been provided by InstaForex Company - www.instaforex.com |
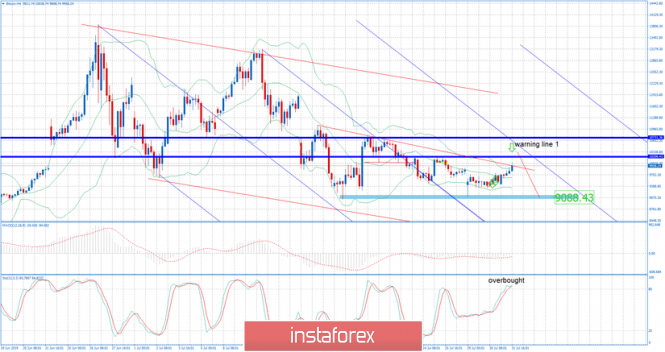
| BTC 07.31.2019 - Resistance zone on the test Posted: 31 Jul 2019 07:26 AM PDT Industry news: While other cryptocurrency exchanges work on the development within their exchange, Kraken took a huge leap as it acquired Interchange, accounting reconciliation and reporting service provider for cryptocurrency hedge funds, asset managers, and fund administrators. The exchange did not disclose any financial details about the deal. BTC did rally to the level of $10.000 and there is a good resistance there. Resistance trendline and previous swing high are great area for potential selling opportunities. My advice is to watch for selling opportunities. Technical picture:
Blur rectangle – Support ($9.080) Blue horizontal line – Resistance ($10.200) Blue horizontal line – Resistance 2 ($10.730) Blue line – Pitchfork warning line 1 On the 4H time-frame I found that Stochastic oscillator is in overbought condition and that there is potential down flip, which is sign that buying at this stage looks risky. MACD oscillator is still in the negative territory below the zero, which is another indication for potential downside. The material has been provided by InstaForex Company - www.instaforex.com |
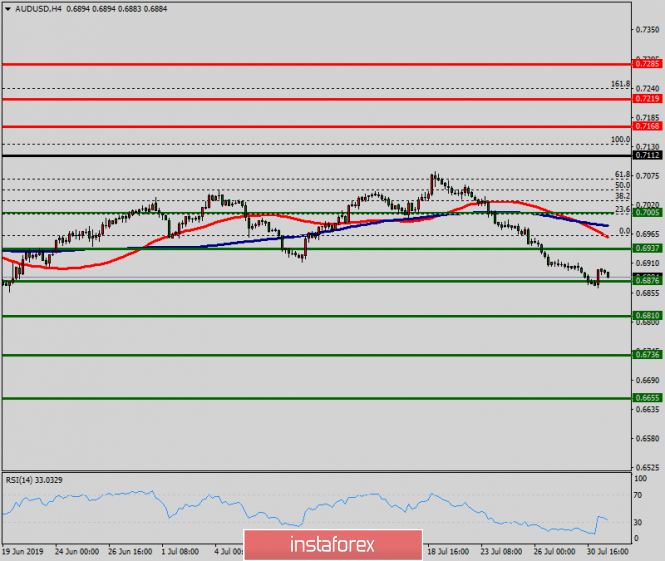
| Technical analysis of AUD/USD for July 31, 2019 Posted: 31 Jul 2019 07:01 AM PDT The AUD/USD pair is set above strong support at the levels of 0.6876 and 0.6810. This support has been rejected four times confirming the uptrend. The major support is seen at the level of 0.6810, because the trend is still showing strength above it. Accordingly, the pair is still in the uptrend in the area of 0.6810 and 0.6876. The AUD/USD pair is trading in the bullish trend from the last support line of 0.6876 towards thae first resistance level of 0.6937 in order to test it. This is confirmed by the RSI indicator signaling that we are still in the bullish trending market. Now, the pair is likely to begin an ascending movement to the point of 0.6937 and further to the level of 0.7005. The level of 0.7005 will act as the major resistance and the double top is already set at the point of 0.7005. At the same time, if there is a breakout at the support level 0.6810, this scenario may be invalidated. The material has been provided by InstaForex Company - www.instaforex.com |
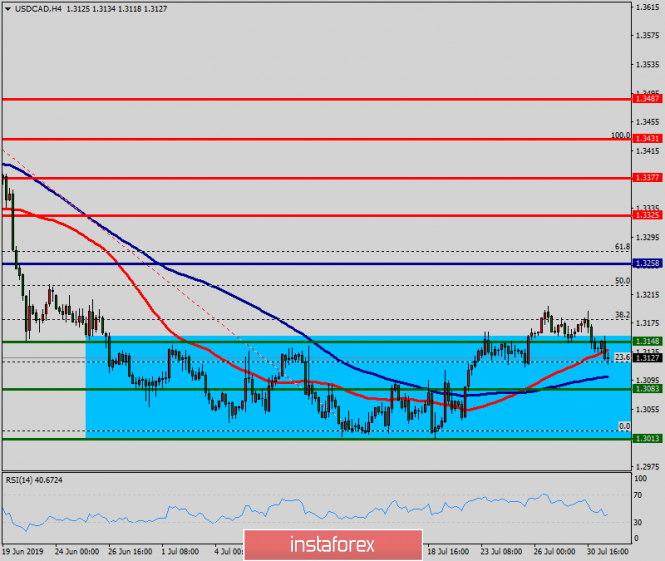
| Technical analysis of USD/CAD for July 31, 2019 Posted: 31 Jul 2019 06:57 AM PDT The USD/CAD pair continues to move downwards from the level of 1.3258. This week, the pair dropped from the level of 1.3258 (this level of 0.9965 coincides with the double top) to the bottom around 1.3148. Today, the first resistance level is seen at 1.3258 followed by 1.3325, while daily support 1 is found at 1.3148. Also, the level of 1.3258 represents a weekly pivot point for that it is acting as major resistance/support this week. Amid the previous events, the pair is still in a downtrend, because the USD/CAD pair is trading in a bearish trend from the new resistance line of 1.3258 towards the first support level at 1.3038 in order to test it. If the pair succeeds to pass through the level of 1.3038, the market will indicate a bearish opportunity below the level of 1.3038 in order to continue towards the point of 1.3013. However, if a breakout happens at the resistance level of 1.3325, then this scenario may be invalidated. The material has been provided by InstaForex Company - www.instaforex.com |
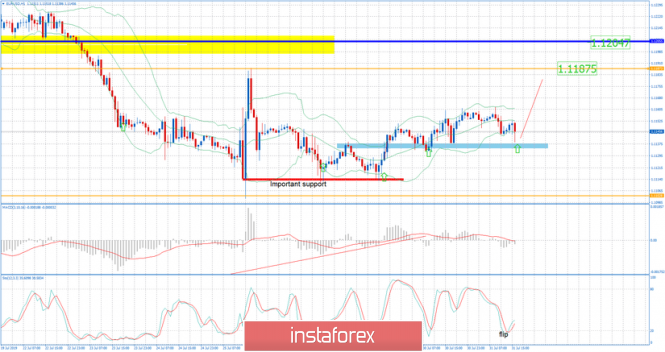
| EUR/USD for July 31,2019 - Support on the test Posted: 31 Jul 2019 06:53 AM PDT EUR has been trading exactly how I planned. The price tested my upward target at the price of 1.1150. Anyway, EUR did trade lower in past 10 hours but the key support is on the test 1.1135. The short-term trend is bullish due to higher highs and higher lowers in the background. Watch for potential buying opportunities. Technical picture:
Blur rectangle – Support 1 (1.1135) Orange horizontal line – Resistance (1.1187) Blue horizontal line – Resistance 2 (1.1205) Red rectangle – Key support (1.1100-1.1114) On the 4H time-frame I found that Stochastic oscillator got a flip up and that slow line is going higher, which is good sign for the further upside continuation. Additionally, there is the potential overbought condition on the Stochastic, which is another sign for the potential upside, Today is FOMC day and you should be more careful with your risk.The material has been provided by InstaForex Company - www.instaforex.com |
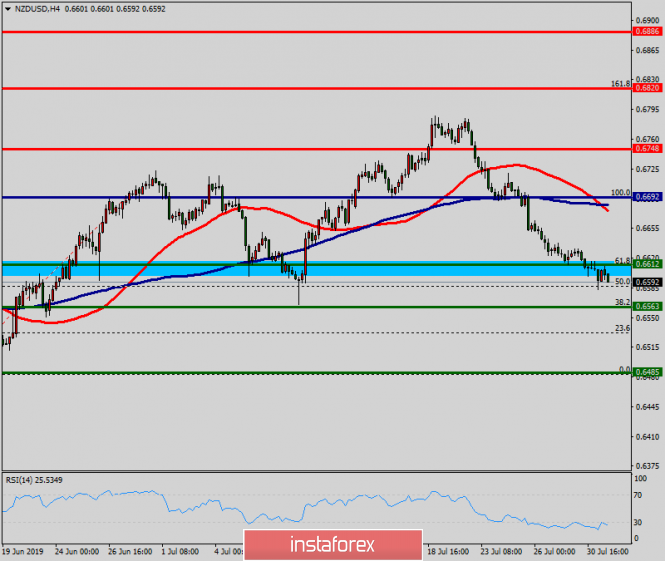
| Technical analysis of NZD/USD for July 31, 2019 Posted: 31 Jul 2019 06:42 AM PDT The NZD/USD pair broke the resistance that turned into strong support at the level of 0.6612. The level of 0.9966 coincides with a golden ratio (61.8% of Fibonacci), which is expected to act as a major support on the H1 chart today. Consequently, the first support is set at the level of 0.6612. Moreover, the RSI starts signaling an upward trend, and the trend is still showing strength above the moving average (100). Hence, the market is indicating a bullish opportunity above the area of 0.6612. So, the market is likely to show signs of a bullish trend around 0.6612 - 0.6650. In other words, buy orders are recommended above the ratio of 61.8% Fibonacci (0.6612) with the first target at the level of 0.6748 in order to test last bullish wave in the same time frame. If the pair succeeds to pass through the level of 0.6748, the market will probably continue towards the next objective at 0.6818. The daily strong support is seen at 0.6612. Thus, if a breakout happens at the support level of 0.6612/0.6600, then this scenario may be invalidated. The material has been provided by InstaForex Company - www.instaforex.com |
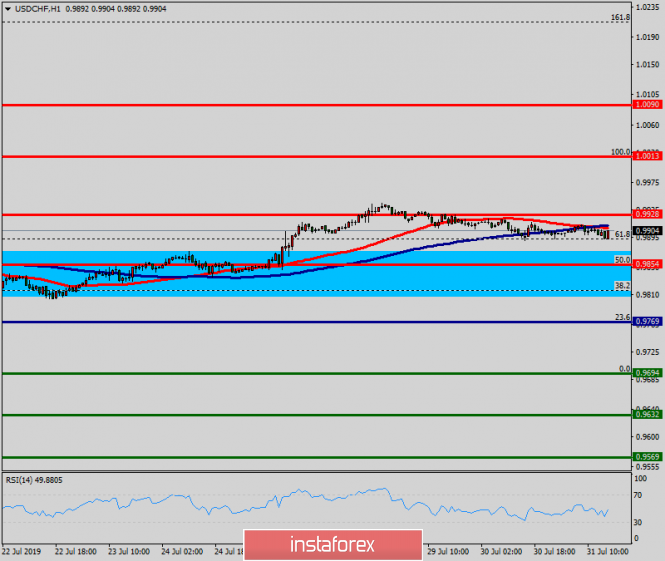
| Technical analysis of USD/CHF for July 31, 2019 Posted: 31 Jul 2019 06:39 AM PDT The USD/CHF pair is trading around the spot of 0.9920. The resistance is seen at the level of 0.9928 and 1.0013. Moreover, the price area of 0.9928 and 1.0013 remains a significant resistance zone. Therefore, there is a possibility that the USD/CHF pair will move downside and the structure of a fall does not look corrective. The trend is still below the 100 EMA for that the bearish outlook remains the same as long as the 100 EMA is headed to the downside. Thus, amid the previous events, the price is still moving between the levels of 0.9928 and 0.9770. If the USD/CHF pair fails to break through the resistance level of 0.9928, the market will decline further to 0.9694 as as the first target. This would suggest a bearish market because the RSI indicator is still in a negative spot and does not show any trend-reversal signs. The pair is expected to drop lower towards at least 0.9632 so as to test the daily support 2. On the other hand, if a breakout takes place at the resistance level of 1.0013, then this scenario may become invalidated. The material has been provided by InstaForex Company - www.instaforex.com |
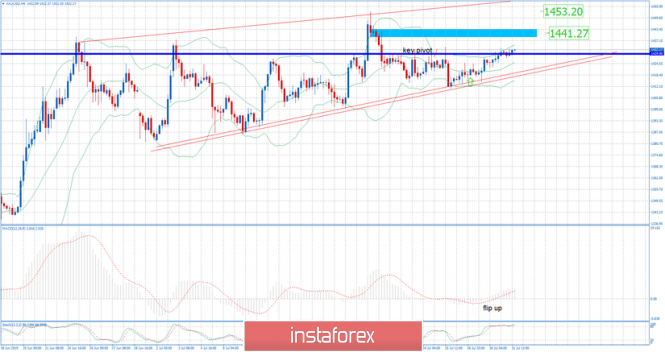
| Gold 07.31.2019 - Broken important pivot at $1.430 Posted: 31 Jul 2019 06:20 AM PDT Gold did trade higher exactly how I alerted you few days ago. The key pivot at the price of $1.430 is broken and there is a chance for larger up move. Pat attention to the important resistance levels at $1.441 and $1.453.. Technical picture:
Blur rectangle – Resistance 1 ($1.441) Upper red line – Resistance 2 ($1.453) Key pivot - $1.430 On the 4H time-frame I found that MACD oscillator got a flip up and that slow line is going higher, which is good sign for the further upside continuation. Stochastic got a fresh UP cross above the 80 level, which is indication of the strength on the Gold. My advice is to watch for buying opportunities with the targets at $1.441 and $1.453. Don't forget, it is a FOMC day so pay attention on your risk control. The material has been provided by InstaForex Company - www.instaforex.com |
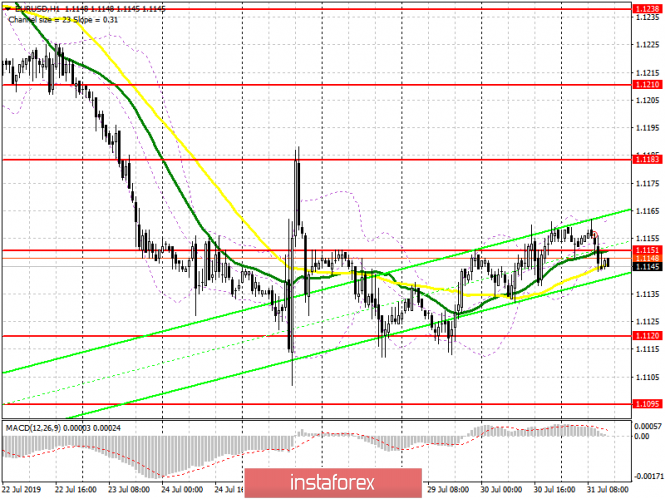
| Posted: 31 Jul 2019 06:16 AM PDT The data on the eurozone economy, released today in the first half of the day before the publication of an important Federal Reserve System interest rate decision, was ignored by the market, but indicated the need to ease monetary policy, which is likely to maintain pressure on the euro and further in the medium term, even with lower interest rates in the United States. I spoke in more detail about the prospects of the US dollar in this morning's review. Annual inflation in France fell sharply. Even despite the preliminary data, it is already possible to note deflation in July this year compared to June. According to the report, the preliminary consumer price index (CPI) in France in July of this year decreased by 0.2% compared to June and increased by only 1.1% compared to the same period in 2018. Economists had expected an even larger decrease of 0.3% compared with June and an increase of 1.2% per annum. As for the consumer price index harmonized by EU standards in France, it rose by 1.3% in July compared to July 2018, against 1.4% in June. In Italy, the preliminary consumer price index (CPI) in July rose only 0.1% compared to June and only 0.5% per annum, which almost coincided with the forecasts of economists. As for the overall indicator for the eurozone, the data also coincided with the forecasts of economists, which, of course, did not please the leadership of the European Central Bank, whose goal is the level of about 2.0%. According to the preliminary report, the consumer price index (CPI) of the eurozone in July rose 1.1% per annum against 1.3% per annum in June, which coincided with the expectations of economists. Core inflation, which does not take into account the volatile categories, showed an increase of only 0.9% per annum. Today, a report on the unemployment rate in Germany and the eurozone was also released. According to the data, the number of unemployed in Germany increased in July, which added problems to the European regulator, as the weakness of the labor market will necessarily result in a slowdown in economic growth. According to the data, the number of applications for unemployment benefits in Germany in July this year increased by 1,000, while economists had expected that in July the number of unemployed increased by 2,500. The bureau of statistics noted that the growth occurred mainly as a result of the summer holidays, but the demand of companies for new employees also slightly weakened. The overall unemployment rate in July was 5%, and the number of registered vacancies in July fell to 799,000, which is 24,000 less than a year earlier. The unemployment rate in the eurozone in June fell to 7.5%, against 7.6% in May this year, but this is not enough for inflation to start to gradually return to the level of 2.0%. The data also fully coincided with the forecasts of economists, which did not lead to any market changes. Weak growth of the eurozone economy, even if the data were preliminary, also indicates that it is time for the European Central Bank to take action and return to economic stimulus programs until growth has stopped at all. According to today's report, eurozone GDP in the 2nd quarter of this year showed a weak growth of 0.2% compared to the 1st quarter, and grew by only 1.1% compared to the 2nd quarter of 2018. The data completely coincided with the forecasts of economists. As for the current technical picture of the EURUSD pair, serious changes in the market will occur only in the late afternoon, when the Federal Reserve will announce its decision on interest rates. While trading is around the level of 1.1150, from which the main movement will be formed. It will be possible to talk about the change in the current short-term trend only after breaking through the level of 1.1185, which was formed last week, above which the maximums open around 1.240 and 1.1310. In the case of a return of pressure on the European currency, support will be provided by a weekly minimum in the area of 1.115 or a larger area of 1.1090. The material has been provided by InstaForex Company - www.instaforex.com |
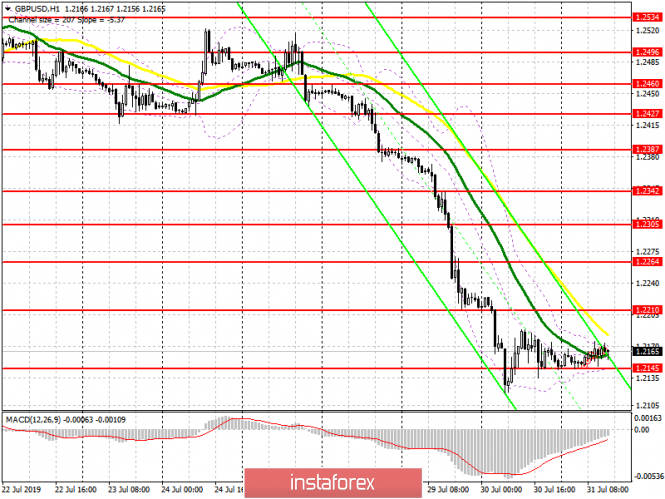
| Posted: 31 Jul 2019 06:16 AM PDT To open long positions on GBP/USD, you need: Trading remains above the support of 1.2145, where a false breakout was formed, which was a signal to open long positions in the expectation of continued growth of the pound in the area of larger resistance levels of 1.2210 and 1.2264, where I recommend taking the profit. If the area of 1.2145 is broken in the second half of the day, it is best to expect new long positions only after the update of the support of 1.2093 or a rebound from a larger minimum of 1.2040. The only thing that keeps sellers from new active actions is today's meeting of the Federal Reserve System, which is likely to lower interest rates, which will put temporary pressure on the US dollar. To open short positions on GBP/USD, you need: The triangle to which I paid attention in the morning review did not work. Also, the bears failed to gain a foothold below the support of 1.2145. Only a real breakout of this level can return the pressure on the pound, which will lead to a further decline in GBP/USD to the area of the lows of 1.2093 and 1.2040, where I recommend taking the profits. However, as noted above, today's decision of the Fed is holding back from more active sales of bears, so it is best to count on short positions after a small upward correction to the maximum area of 1.2210, provided that there is a false breakdown, or a rebound from the resistance of 1.2264. Indicator signals: Moving averages Trading is conducted in the area of 30 and 50 moving averages, which indicates a possible upward correction in the short term. Bollinger Bands Volatility is low, which does not give signals to enter the market.
Description of indicators
|
| EUR/USD: plan for the American session on July 31. Eurozone data was expected to be ignored Posted: 31 Jul 2019 06:16 AM PDT To open long positions on EURUSD, you need: A number of reports on inflation, GDP growth and unemployment in the eurozone were ignored by the market. First, all the data almost coincided with the forecasts of economists, and secondly, all the emphasis is on the publication of the Fed's decision on the interest rate, which is a more important event. Buyers failed to hold the support level of 1.1151, which I paid attention to in my morning review, which plunged the market into even more despondency. At the moment, the task of the bulls will be to return and consolidate above 1.1151, but everything will depend on the Fed's decision and comments that will follow. Growth above 1.1151 may lead to an update of the maximum of 1.1183, the breakdown of which will form a new upward wave to the area and will lead to a test of the levels of 1.1210 and 1.1238, where I recommend taking the profit. If the pressure on EUR/USD continues after the Fed statements, it is best to return to long positions after the test of the minimum of 1.1120 or to rebound from the level of 1.1095. To open short positions on EURUSD, you need: Bears coped with the morning task and returned to the level of 1.1151. However, as we can see on the graph, it did not lead to anything. Trade remains and will remain until the Fed's decision in the side channel, with very low volatility. EUR/USD decline in the area of the minimum of 1.1120, as well as its breakdown, will be a clear signal for a return to the market of sellers, which will lead to an update of the lows in the area of 1.1095 and 1.1068, where I recommend taking the profit. If the demand for the euro returns after the Fed's statements, it is best to return to short positions on a false breakout from the resistance of 1.1183 or on a rebound from a larger maximum of 1.1210. Indicator signals: Moving Averages Trading is conducted in the area of 30 and 50 moving averages, which indicates the lateral nature of the market. Bollinger Bands Volatility is low, which does not give signals to enter the market.
Description of indicators
|
| Posted: 31 Jul 2019 06:16 AM PDT 4-hour timeframe
Technical data: The upper linear regression channel: direction – down. The lower linear regression channel: direction – down. The moving average (20; smoothed) – down. CCI: -84.9076 It is very difficult to give any description of the first week of Boris Johnson's reign. During this week, the pound sterling managed to fall by 3.5 cents, Johnson himself – to make several contradictory statements and to heat relations with the European Union, putting him a few ultimatums, and the nearest neighbors of the UK, Northern Ireland and Scotland, are already dissatisfied with the new Prime Minister. Scottish Minister Nicola Sturgeon was not happy with the meeting with Johnson and believes that Boris is purposefully promoting the Kingdom to Brexit without a deal. And the Scots are very concerned about this, as well as a huge number of Britons, including the ordinary population, experts, politicians and the head of the Bank of England Mark Carney. Everyone understands that Brexit without a "deal" is a crushing blow to the UK economy. Therefore, few people support Johnson's policy. However, it is not necessary to ask the most obvious question: why then Johnson was elected Prime Minister if it was clear before the election which version of Brexit did he support? Still, Brexit – this is one of the pressing issues, and the management of the whole country can only be a force for a strong policy that enjoys the trust of party members. More charismatic personality than Johnson in the Conservative Party was not found. Perhaps Jeremy Hunt would be more tolerant in negotiations with the EU, but then the dialogue with Brussels could drag on for many years. In the meantime, not only the EU can lose the UK, but the UK – Scotland. Since Nicola Sturgeon reiterated that the country is preparing for a new referendum on independence. Nearest support levels: S1 – 1.2146 S2 – 1.2085 Nearest resistance levels: R1 – 1.2207 R2 – 1.2268 R3 – 1.2329 Trading recommendations: The GBP/USD currency pair continues the downward movement, so now it is still recommended to sell the pound sterling with targets at the levels of 1.2146 and 1.2085, before the Heiken Ashi indicator turns to the top. The market initiative continues to be in the hands of bears. It will be possible to buy the pound/dollar pair with the goals of 1.2390 and 1.2451 not earlier than the price consolidation above the moving average line. However, in the coming days, this development is not expected. In addition to the technical picture should also take into account the fundamental data and the time of their release. Explanation of illustrations: The upper linear regression channel – the blue line of the unidirectional movement. The lower linear regression channel – the purple line of the unidirectional movement. CCI – the blue line in the indicator regression window. The moving average (20; smoothed) is the blue line on the price chart. Murray levels – multi-colored horizontal stripes. Heiken Ashi is an indicator that colors bars in blue or purple. The material has been provided by InstaForex Company - www.instaforex.com |
| Posted: 31 Jul 2019 06:16 AM PDT 4-hour timeframe
Technical data: The upper channel of linear regression: direction – up. The lower channel of linear regression: direction – down. The moving average (20; smoothed) – down. CCI: 55.4765 The European currency has adjusted in the last two days to the moving average line and failed to overcome it. Since the Fed's possible decision to reduce the rate by 0.25% has already been made, traders have already taken it into account in the current euro/dollar rate. So, there is no need to wait for a special reaction to the market. Another thing – the performance of Jerome Powell. His rhetoric can be anything from our point of view. It can signal the whole course of monetary policy easing, which will involve several key rate cuts. He may note that macroeconomic indicators have improved in recent weeks. So far, we see no reason to reduce the rate by more than 0.5%. Accordingly, we believe that there will be a maximum of one more easing in 2019. And then everything will depend on the outcome of the trade confrontation between the States and China. Who will be the next President of the United States (2020)? From what will be macroeconomic statistics and, in particular, inflation and GDP. If all these factors are favorable to the dollar, the regulator will not have to go for new monetary policy easing. So the key question today is Jerome Powell's rhetoric. Meanwhile, the preliminary inflation value for July was published in the European Union, and this figure fell to 1.1%, and the basic value of the consumer price index fell to 0.9%. GDP for the second quarter, according to preliminary estimates in the quarter, fell to +0.2%, and in the annual – to 1.1%. And what is the significance of the Fed's rate cut for the euro with such macroeconomic statistics of the European Union? Nearest support levels: S1 – 1.1108 S2 – 1.1047 S3 – 1.0986 Nearest resistance levels: R1 – 1.1169 R2 – 1.1230 R3 – 1.1292 Trading recommendations: The EUR/USD currency pair has completed a round of upward correction around the MA. On July 31, therefore, it is recommended to sell the EUR/USD with targets at 1.1108 and 1.1047. It is recommended to buy the euro/dollar in small lots if the bulls manage to gain a foothold above the moving average line, with the first target Murray level of "4/8" - 1.1230. In addition to the technical picture should also take into account the fundamental data and the time of their release. Explanation of illustrations: The upper linear regression channel – the blue line of the unidirectional movement. The lower linear regression channel – the purple line of the unidirectional movement. CCI – the blue line in the indicator window. The moving average (20; smoothed) is the blue line on the price chart. Murray levels – multi-colored horizontal stripes. Heiken Ashi is an indicator that colors bars in blue or purple. The material has been provided by InstaForex Company - www.instaforex.com |
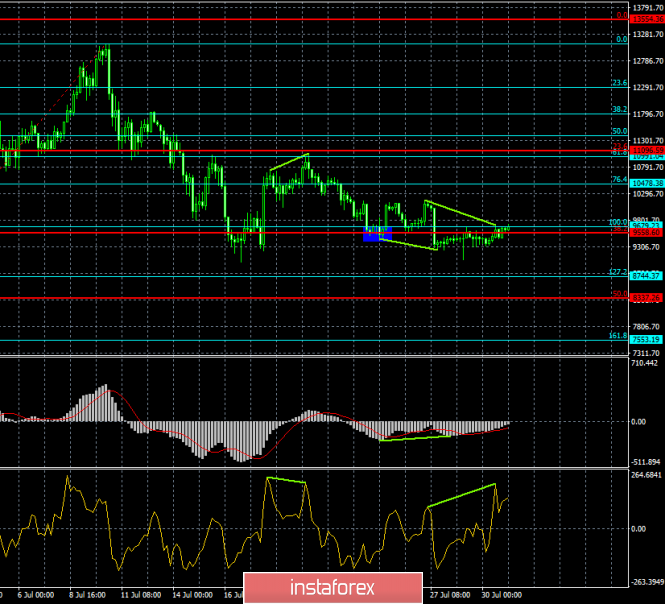
| Posted: 31 Jul 2019 06:16 AM PDT Bitcoin – 4H.
As seen on the 4-hour chart, Bitcoin made a return to the correction level of 100.0% ($9679). However, the bearish divergence of the CCI indicator allows traders to count on some Bitcoin fall in the direction of the Fibo level of 127.2% ($8744). However, the passage of the peak of that divergence will cancel it, and the growth of BTC will continue in the direction of the correction level of 76.4% ($10478). According to many experts, Bitcoin in the long term will only continue to rise in price. In 2020, there will be a reduction in the remuneration of miners for the mined block. Now, it is 12.5 BTC, and will be – 6.25 BTC. The last time a similar event happened, in 2016, Bitcoin prices soared 10 times. However, the question: Is it possible that an unconfirmed cryptocurrency, which is often used for illegal purposes, will rise in price simply on the basis of a decrease in supply? It seems so. Of course, halving will take place only next year, and the "cue" and other cryptocurrencies still cannot exist on their own. That is, if the governments of the largest countries of the world prohibit the turnover of cryptocurrencies, it will already entail the collapse of their value. Thus, we can say that Bitcoin is growing, because it is still allowed to do so. India, however, has already banned cryptocurrencies. Perhaps in the future, other countries will follow its example. The Fibo grid is based on the extremes of July 2, 2019, and July 10, 2019. Forecast for Bitcoin and trading recommendations: Bitcoin made a return to the correction level of 100.0% ($9679). Thus, I recommend selling the cryptocurrency with the target of $8744, with the stop-loss order above the level of 38.2%, if there is a new rebound from the level of 100.0%. I recommend buying Bitcoin with a view to $10478, and with a stop-loss order under the level of $9558, if the closing above the correction level of 38.2% is performed. The material has been provided by InstaForex Company - www.instaforex.com |
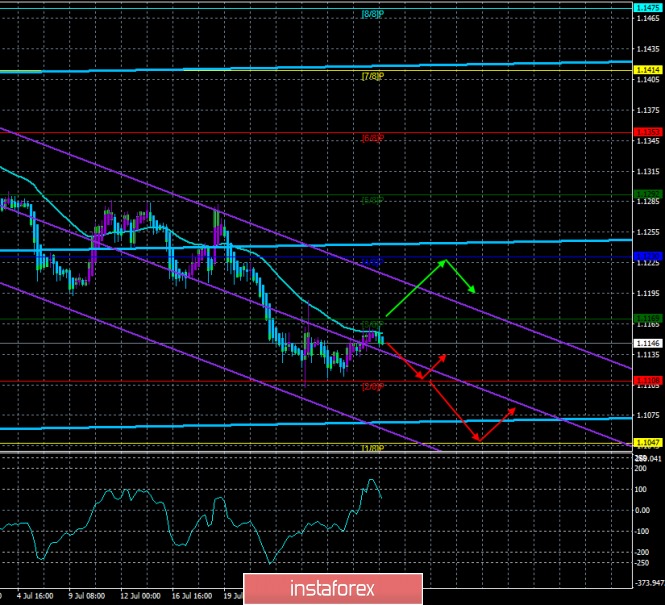
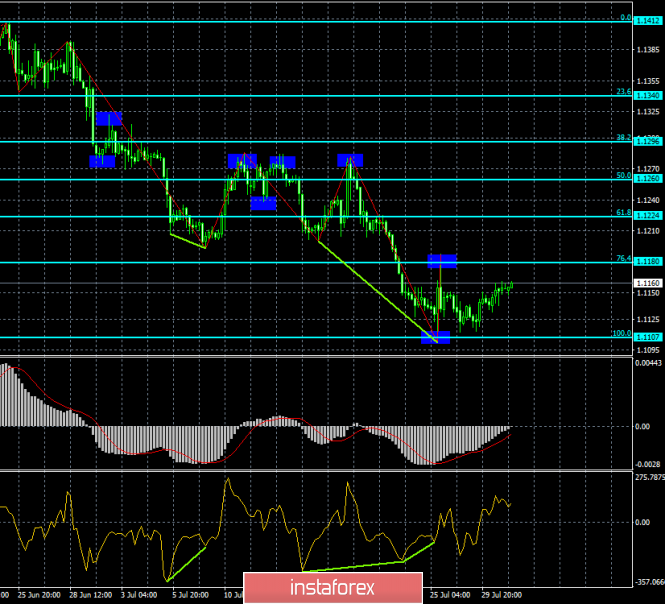
| Forecast for EUR/USD and GBP/USD on July 31. The collapse of the pound overshadows the Fed meeting Posted: 31 Jul 2019 06:16 AM PDT EUR/USD – 4H.
As seen on the 4-hour chart, the EUR/USD pair performed a reversal in favor of the euro currency and started the growth process in the direction of the correction level of 76.4% (1.1180). There are no emerging divergences today for the euro/dollar pair. The euro is growing ahead of the Fed meeting, where the key rate is likely to be reduced by 0.25%. This has been written many times, and the foreign exchange market has long taken into account this decline in the current rate. So the more important question now is Jerome Powell's rhetoric at the evening press conference. Recent macroeconomic indicators have shown an improvement, so I wonder if Powell will signal the need to further reduce the rate? Will he note again the growing threats to the world economy, the risks of the US economic recession, weak inflation, the threat of trade wars and so on? If you follow the new eurozone in 2019 or even a few drops, it could convince traders that the greenback won't need to buy in any case. Yesterday's news from America showed an increase of 0.3% in the level of spending and 0.4% in the level of income of citizens. This is no more and no less than the forecasts of experts and market expectations. The rebound of quotations from the Fibo level of 76.4% will allow traders to expect a reversal in favor of the US currency and a resumption of the fall in the direction of the correction level of 100.0% (1.1107). The Fibo grid is built on the extremes of May 23, 2019, and June 25, 2019. Forecast for EUR/USD and trading recommendations: The EUR/USD pair has begun to grow in the direction of the correction level of 76.4% (1.1180). I recommend selling the pair today with the target of 1.1107, with the stop-loss order above the level of 1.1180 if it will be rebounded from the level of 76.4%. I recommend buying the pair with the target of 1.1224 and stop-loss order under the level of 1.1180, if closing above the correction level of 76.4% is performed. GBP/USD – 4H.
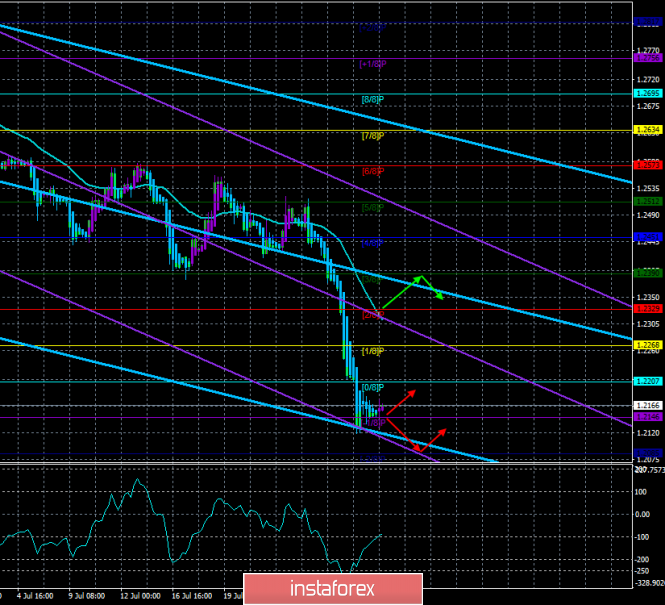
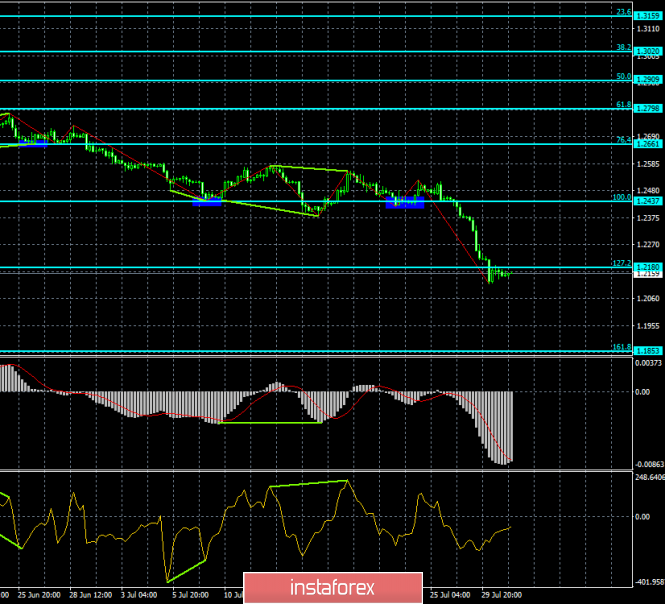
The pair GBP / USD has consolidated below the correctional level of 127.2% (1.2180). Why the pound falls can probably be explained now by any child. Hard Brexit is not just a threat to the welfare of the UK and its citizens. This is a complete rupture of relations with the European Union. And there are many ties between Britain and the Alliance. For example, London will lose all trade agreements with countries outside the EU, European laws will cease to operate in the UK. Some large companies have already left Britain because of the very vague future of the country. Potentially, it also means the introduction of duties on trade with the EU, reducing investment in the economy, the outflow of citizens, rising inflation, unemployment, budget deficit, and GDP reduction. And the consequences of Brexit without agreements will be visible for a long period of time. This is what the Chairman of the Bank of England Mark Carney has repeatedly warned about, and this is what the British Parliament had in mind when it refused to approve such a scenario under the government of Theresa May. However, there are no alternatives to tough Brexit. Thus, the best option would be to simply respond to news from the UK. If there are grounds to expect the resumption of negotiations with the European Union, it can have a beneficial effect on the pound. Hard Brexit will lead to an even greater collapse of the quotes of this currency. The Fibo grid is built on the extremes of January 3, 2019, and March 13, 2019. GBP/USD – 1H.
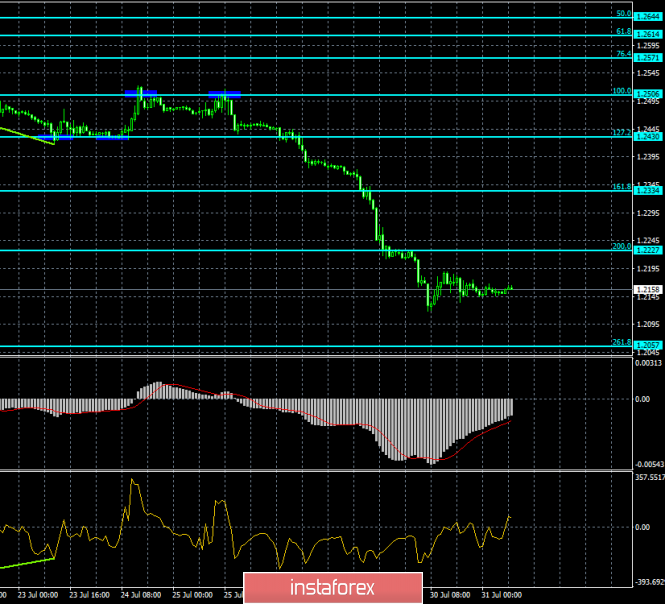
As seen on the hourly chart, the pound/dollar pair stopped falling in the direction of the correction level of 261.8% (1.2057). Today, the divergence is not observed in any indicator. The rebound of quotations from the Fibo level of 261.8% will allow counting on a reversal in favor of the English currency and some growth in the direction of the correction level of 200.0% (1.2227). The Fibo grid is based on the extremes of June 18, 2019, and June 25, 2019. Forecast for GBP/USD and trading recommendations: The GBP/USD pair continues the process of falling. Thus, I recommend selling the pair with a target of 1.2057, with the stop-loss order above the level of 1.2227. I recommend buying the pair with the target of 1.2227 and stop-loss order under the level of 261.8% (hourly chart) if it will be rebounded from the level of 1.2057. The material has been provided by InstaForex Company - www.instaforex.com |


| You are subscribed to email updates from Forex analysis review. To stop receiving these emails, you may unsubscribe now. | Email delivery powered by Google |
| Google, 1600 Amphitheatre Parkway, Mountain View, CA 94043, United States | |
No comments:
Post a Comment