Forex analysis review |
- Fractal analysis of major currency pairs on July 5
- GBP/USD: economy, protectionism and Brexit put a stick in the wheels for pound bulls
- EUR/USD: waiting for Friday and tips from the US labor market
- Why is a new report on the US labor market more important than the previous ones?
- EUR/USD. Calm before the storm: the market hid in anticipation of the Nonfarm report
- GBP/USD. 4th of July. Results of the day. Donald Trump can start currency wars with China and the European Union
- EUR/USD. 4th of July. Results of the day. Independence Day is quiet and peaceful. Markets in hibernation
- July 4, 2019 : GBP/USD Intraday technical analysis and trade recommendations.
- EURUSD near important Fibonacci support
- Gold 07.04.2019 - Downside is expected
- July 4, 2019 : EUR/USD Intraday technical analysis and trade recommendations.
- Gold price stays above short-term support
- EUR/USD for July 04,2019 - Sellers in control
- BTC 07.04.2019 - Major resistance at $12.000 on the test
- The yen will rise, and the US dollar will fall - Morgan Stanley
- What can the foreign exchange market expect from the negotiations between the US and China? Nothing!
- The dollar retreats against expectations of lower rates, there is no prospect for growth
- Wave analysis of EUR / USD and GBP / USD for July 4. Markets rest before NonFarm Payrolls
- Euro to weaken in case Lagarde is elected ECB President
- Burning forecast 07.04.2019 EURUSD and trading recommendation
- EURUSD: The US dollar retains its potential for growth, despite the diverse fundamental statistics
- Simplified wave analysis and forecast for GBP/USD, AUD/USD, and USD/CHF on July 4
- Forecast for Forex Market on July 4: Independence Day in the USA and low volatility
- Bitcoin. 12000 at the sight of buyers
- Forecast for EUR/USD and GBP/USD on July 4. Business activity in the EU is afloat, in Britain – falls into the abyss
| Fractal analysis of major currency pairs on July 5 Posted: 04 Jul 2019 07:21 PM PDT Forecast for July 5: Analytical review of H1-scale currency pairs:
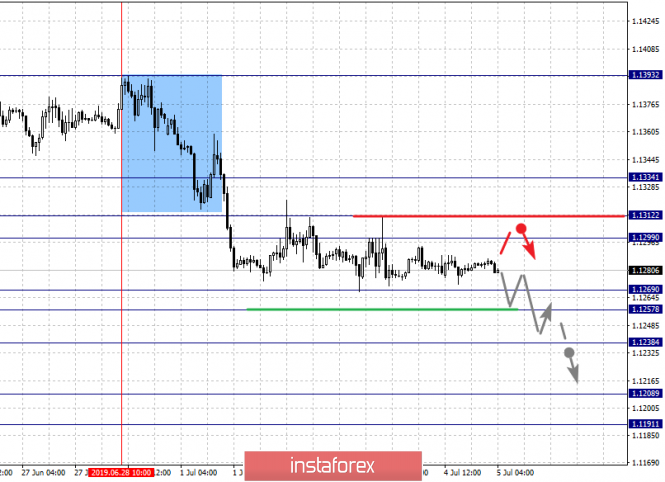
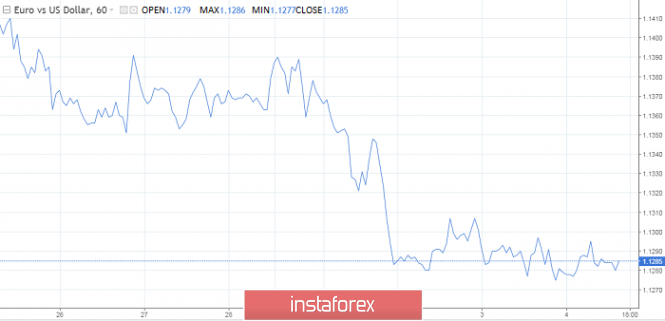
For the euro / dollar pair, the key levels on the H1 scale are: 1.1334, 1.1312, 1.1299, 1.1269, 1.1257, 1.1238, 1.1208 and 1.1191. Here, we continue to monitor the downward structure of June 28. The continuation of the movement to the bottom is expected after the price passes the noise range 1.1269 - 1.1257, and in this case the goal is 1.1238. Price consolidation is near this level. The breakdown at level 1.1236 will allow us to count on a pronounced movement to the level of 1.1208. For the potential value to the bottom, we consider the level of 1.1191, after reaching which, we expect a rollback to the top. Short-term upward movement is possible in the corridor 1.1299 - 1.1312. The breakdown of the latter value will lead to in-depth correction. Here, the goal is 1.1334. This level is a key support for the downward structure. The main trend - a local downward structure of June 28. Trading recommendations: Buy 1.1300 Take profit: 1.1311 Buy 1.1313 Take profit: 1.1334 Sell: 1.1257 Take profit: 1.1238 Sell: 1.1236 Take profit: 1.1210
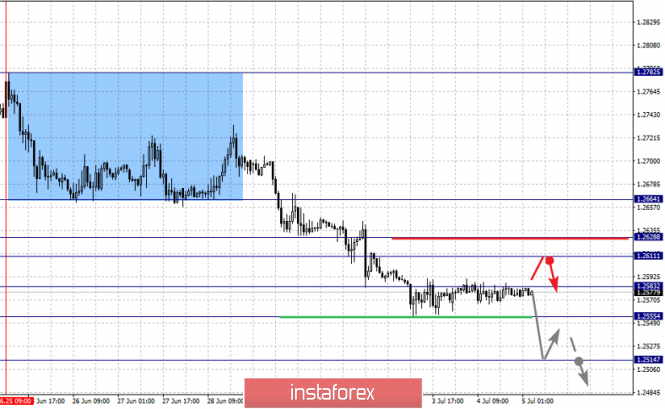
For the pound / dollar pair, the key levels on the H1 scale are: 1.2664, 1.2628, 1.2611, 1.2583, 1.2555 and 1.2514. Here, we are following the development of the downward structure of June 25th. Short-term downward movement is expected in the corridor 1.2583 - 1.2555. For a potential value to the bottom, we consider the level of 1.2514, after reaching which, we expect to go into a correction. Short-term upward movement is expected in the corridor 1.2611 - 1.2628. The breakdown of the last value will lead to a prolonged correction. Here, the target is 1.2664. This level is a key support for the downward structure. The main trend - the downward structure of June 25. Trading recommendations: Buy: 1.2611 Take profit: 1.2626 Buy: 1.2630 Take profit: 1.2664 Sell: 1.2581 Take profit: 1.2557 Sell: 1.2553 Take profit: 1.2516
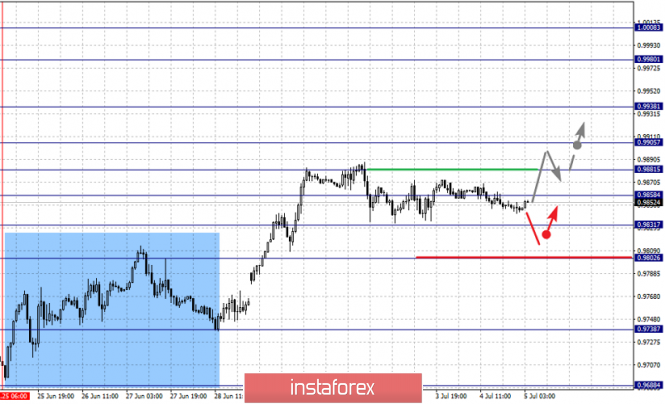
For the dollar / franc pair, the key levels on the H1 scale are: 1.0008, 0.9980, 0.9938, 0.9905, 0.9881, 0.9858, 0.9831 and 0.9802. Here, we continue to follow the development of the upward cycle from June 25, while at the moment, the price is in the correction. Continuation of the movement to the top is expected after the breakdown of 0.9881. In this case, the first goal is 0.9905. The breakdown of which will lead to the movement to the level of 0.9938. Price consolidation is near this level. The breakdown of the level of 0.9938 should be accompanied by a pronounced upward movement. Here, the target is 0.9980. For the potential value to the top, we consider the level of 1.0008, after reaching which, we expect consolidation, as well as a rollback to the correction. Consolidated movement is possible in the corridor 0.9858 - 0.9831. The breakdown of the latter value will lead to a prolonged correction. Here, the goal is 0.9802. This level is a key support for the top. Itts price will have to develop the downward structure. Here, the potential goal is 0.9738. The main trend is the upward cycle of June 25, the stage of correction. Trading recommendations: Buy : 0.9905 Take profit: 0.9936 Buy : 0.9939 Take profit: 0.9980 Sell: 0.9855 Take profit: 0.9833 Sell: 0.9829 Take profit: 0.9802
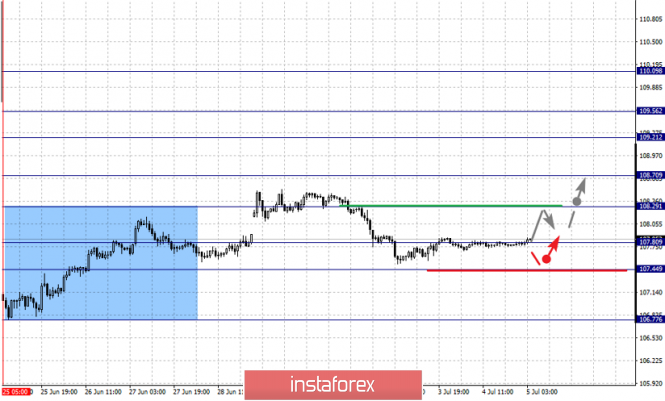
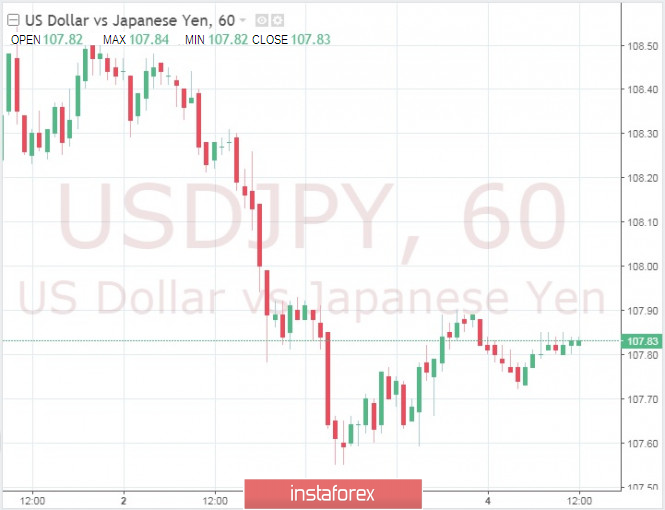
For the dollar / yen pair, the key levels on the H1 scale are : 110.09, 109.56, 109.21, 108.70, 108.29, 107.80, 107.44 and 106.77. Here, we continue to follow the development of the upward structure from June 25. At the moment, the price is in deep correction and is close to canceling this structure, for which a breakdown of the level of 107.44 is necessary, and in this case, the potential target is 106.77. Continuation of the movement to the top is expected after the breakdown at level 108.29. Here, the first goal is 108.70. The breakdown of which will allow and expect us to move to level 109.21. Short-term upward movement, as well as consolidation is in the corridor 109.21 - 109.56 . For the potential value to the top, we consider the level of 110.09, and the movement to which is expected at level 109.56 after the breakdown. The main trend: the ascending structure of June 25, the stage of deep correction. Trading recommendations: Buy: 108.30 Take profit: 108.70 Buy : 108.74 Take profit: 109.20 Sell: 107.41 Take profit: 107.00
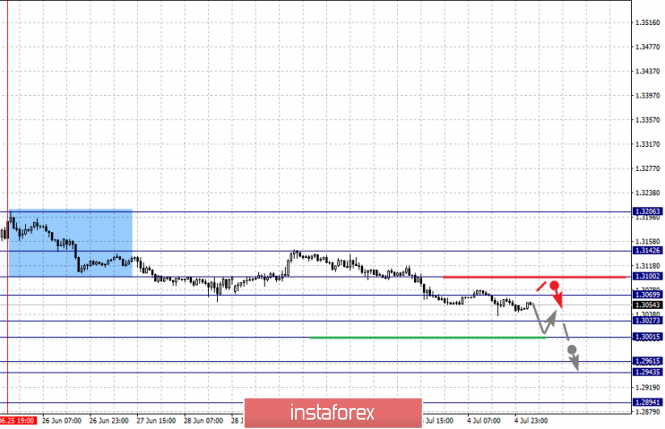
For the Canadian dollar / US dollar pair, the key levels on the H1 scale are: 1.3142, 1.3100, 1.3069, 1.3027, 1.3001, 1.2961, 1.2943 and 1.2894. Here, we continue to monitor the local downward structure of June 25. Short-term downward movement is expected in the corridor 1.3027 - 1.3001. The breakdown of the latter value should be accompanied by a pronounced downward movement. Here, the target is 1.2961. Price consolidation is in the corridor 1.2961 - 1.2943. For the potential value to the bottom, we consider the level of 1.2894, and after reaching this level, we expect a rollback to the top. Short-term upward movement is possible in the corridor 1.3069 - 1.3100. The breakdown of the latter value will lead to a prolonged correction. Here, the goal is 1.3142. This level is a key support for the downward structure. The main trend is a local downward structure from June 25. Trading recommendations: Buy: 1.3070 Take profit: 1.3100 Buy : 1.3102 Take profit: 1.3140 Sell: 1.3027 Take profit: 1.3003 Sell: 1.2998 Take profit: 1.2961
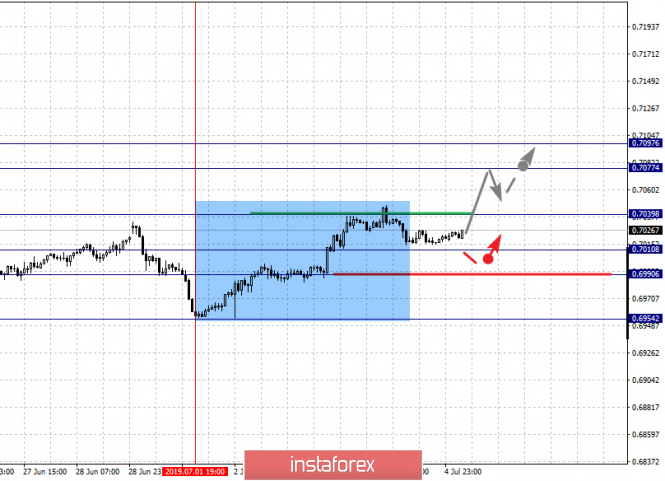
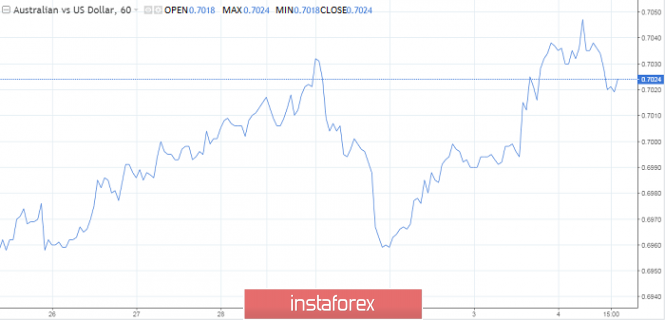
For the Australian dollar / US dollar pair, the key levels on the H1 scale are : 0.7097, 0.7077, 0.7039, 0.7010, 0.6990 and 0.6954. Here, the price has issued a local structure for the top of July 1. Continuation of the movement to the top is expected after the breakdown to the level of 0.7039. In this case, the target is 0.7077. For the potential value to the top, we consider the level of 0.7097, and upon reaching this level, we expect a consolidated movement in the corridor of 0.7077 - 0.7097, as well as a rollback to the bottom. Short-term downward movement is possible in the corridor 0.7010 - 0.6990. The breakdown of the latter value is necessary for the formation of a downward structure. Here, the potential target is 0.6954. The main trend is a local rising structure of July 1. Trading recommendations: Buy: 0.7040 Take profit: 0.7076 Buy: 0.7077 Take profit: 0.7096 Sell : 0.7010 Take profit : 0.6992 Sell: 0.6988 Take profit: 0.6959
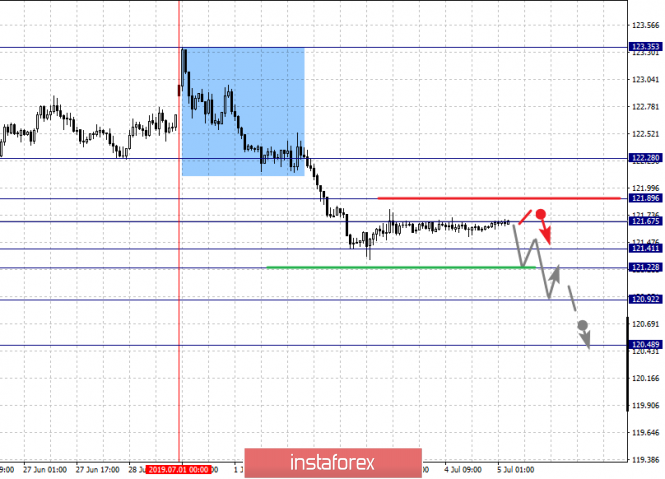
For the euro / yen pair, the key levels on the H1 scale are 122.28, 121.89, 121.67, 121.41, 121.22, 120.92 and 120.48. Here, we continue to follow the downward cycle of July 1. Continuation of the movement to the bottom is expected after passing by the price of the noise range 121.41 - 121.22, and in this case, the goal is 120.92, near this level is price consolidation. For the potential value to the bottom, we consider the level of 120.48, and after reaching which, we expect a rollback to the top. Short-term upward movement is expected in the corridor 121.67 - 121.89. The breakdown of the last value will lead to a prolonged correction. Here, the goal is 122.28. This level is a key support for the downward structure. The main trend is the downward cycle of July 1. Trading recommendations: Buy: 121.67 Take profit: 121.87 Buy: 121.94 Take profit: 122.28 Sell: 121.22 Take profit: 120.94 Sell: 120.90 Take profit: 120.50
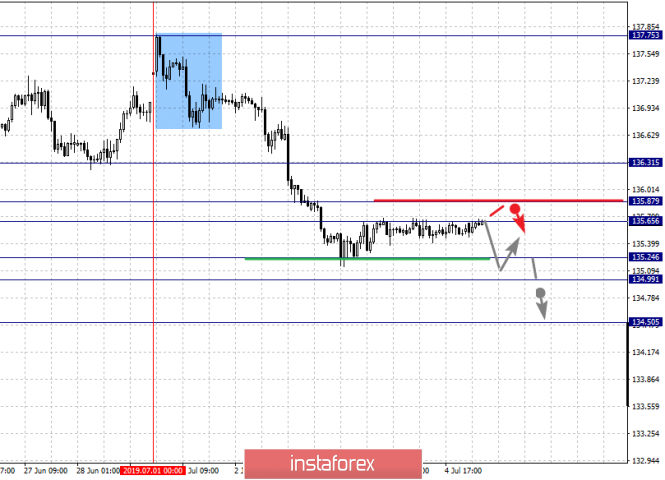
For the pound / yen pair, the key levels on the H1 scale are : 136.31, 135.87, 135.65, 135.24, 134.99 and 134.50. Here, we are following a downward cycle of July 1. Short-term downward movement is expected in the range of 135.24 - 134.99. The breakdown of the last value will allow and expect a movement towards a potential target - 134.50, and after reaching this level, we expect a rollback to the top. Short-term upward movement is possible in the range of 135.65 - 135.87. The breakdown of the latter value will lead to a prolonged correction. Here, the target is 136.31. This level is a key support for the downward structure. The main trend is the downward cycle of July 1. Trading recommendations: Buy: 135.65 Take profit: 135.85 Buy: 135.90 Take profit: 136.30 Sell: 135.24 Take profit: 135.00 Sell: 134.95 Take profit: 134.50 The material has been provided by InstaForex Company - www.instaforex.com |
| GBP/USD: economy, protectionism and Brexit put a stick in the wheels for pound bulls Posted: 04 Jul 2019 04:51 PM PDT For a long time, bulls on GBP/USD did not succeed in spreading their wings because of politics, but when the British economy began to slow down, it seemed that they started to realize that the case smelled like kerosene. In June, business activity in the UK manufacturing sector fell to its lowest level in the last six years, and in the construction sector to the lowest level since 2009. The composite PMI index of the country sank below the critical level of 50 points for the first time since the referendum on the membership of the United Kingdom in the European Union. The derivatives market reacted to a slowdown in business activity with an increase in the likelihood of monetary policy easing by the Bank of England in 2019 (from 25% in late June to the current 53%). Investors expect that by August 2020, the regulator will reduce the interest rate to 0.5%. The BoE monetary easing is also likely to help increase the rate of monetary easing by stating that protectionism is slowing the global economy and forcing central banks to take measures such as lowering interest rates. According to the Bank of England, the already implemented US and China tariffs will slow down the British economy by 0.1%. It is assumed that if the White House imposes duties on cars imported to America from the EU, the British GDP will lose 0.4%. However, the United Kingdom suffers not only from American protectionism, but also from Brexit. The increased chances of Boris Johnson winning the fight for the chair of the country's cabinet, combined with the deterioration of macroeconomic statistics for the UK and the increased likelihood of lower interest rates, the BoE is quite capable of sending the GBP/USD pair to June lows. UniCredit analysts note that the near-term outlook for the British currency leaves much to be desired, but they believe that London and Brussels will eventually reach a compromise, and this will provide a good impetus for the pound to recover. Although the bank lowered its forecast for GBP/USD at the end of 2019 from 1.40 to 1.38, it still implies a rally in the pair. Analysts Svenska Handelsbanken, in turn, believe that by the end of this year, the pound sterling will strengthen against the dollar to $1.33. According to them, the deadline for Brexit will once again be postponed after October 31, and the idea of holding a second referendum will come to the fore. The material has been provided by InstaForex Company - www.instaforex.com |
| EUR/USD: waiting for Friday and tips from the US labor market Posted: 04 Jul 2019 04:44 PM PDT Since the beginning of the week, the EUR/USD pair cannot determine the direction of movement against the background of a mixed information background. A series of disappointing data on the US economy shook the belief of the EUR/USD bears that the Fed retains a passive position in July. However, Richmond Fed President Tom Barkin made a statement that it was too early for the regulator to adjust monetary policy forced investors to turn their attention to the US currency again. The decline in business activity in the services sector in the United States to a trough over the past two years is 55.1, a modest increase in employment in the non-agricultural sector of the United States (+102 thousand) and an increase in the country's foreign trade deficit favor the discussion about Bets at the next FOMC meeting promise to be hot. In addition, investors continue to assess the results of the recent summit of EU leaders, at which there was a choice to nominate IMF managing director Christine Lagarde for the presidency of the ECB. After it was announced that she would replace Mario Draghi as head of the ECB, analysts were even more convinced that the regulator would loosen monetary policy in the coming months. In their opinion, the key interest rate will be lowered by 10 basis points to -0.50%, and from November resume the program of quantitative easing (QE) or net asset purchases in the amount of €30 billion per month. These are undoubtedly negative factors for the euro, and if the Fed again postpones the decision on easing monetary policy, the EUR/USD pair will be prone to further decline, being under double pressure. Although many investors believe that this year the Fed will lower the interest rate more than once, the leaders of the US central bank have not yet confirmed this. Moreover, Richmond Federal Reserve Bank President Tom Barkin said that it is too early to judge whether the Fed will slow down the global economy to lower the interest rate at the next meeting scheduled for July 30-31. According to him, the US economy is still very strong, and the inflation rate is slightly below 2% - why not refrain from reducing the rate? Investors are now waiting for the publication of the June report on the US labor market, which will be released tomorrow and shed light on how the players are right in expectations regarding the rate cut at the July Fed meeting. It is assumed that ahead of this release, the EUR/USD pair will not leave the trading range of 1.12-1.14. The material has been provided by InstaForex Company - www.instaforex.com |
| Why is a new report on the US labor market more important than the previous ones? Posted: 04 Jul 2019 04:44 PM PDT Monthly data on the number of people employed in the US non-farm sector, as a rule, have a strong impact on the dollar and other major currencies of the world. The Friday report could play an even more important role. Due to the celebration of Independence Day, many traders in the United States left for the weekend, and trading volume in the market was reduced. The process involves mostly younger players who are unlikely to make large-scale transactions. The June report on the state of the labor market is extremely important because the Fed has openly hinted at the possibility of reducing the rate, and including the timing of easing policy, will depend on the data. If the growth in the number of jobs does not reach forecasts, then investors will immediately begin to prepare for lower rates this month. Despite the fact that the market lays an absolute probability of easing policy in July, a moderate decline in the dollar indicates their uncertainty and unwillingness to reduce rates. Weak employment figures could lead to a collapse of the US currency. There is one reason why the US dollar is now stronger than it could be. The fact is that experts predict a recovery in the growth rate of the number of people employed this month. This was repeatedly said by officials, in particular, the head of the Federal Reserve Bank of St. Louis, James Bullard. Recall that the May report was extremely alarming. Back then only 75 thousand jobs were created, wage growth slowed, and this trend was recorded for the third consecutive month. Yes, the US economy is slowing down, but it's hard to imagine that less than 80 thousand jobs have been created in the country for two months straight months. Nevertheless, the dollar should be in lower positions, given the recent drop in Treasury yields. On Wednesday, the 10-year Treasury yield fell to its lowest level in 2.5 years. If you pay attention to leading indicators, the prospects for the labor market are mixed. Indeed, the ADP reported a more rapid increase in the number of people employed in the private sector, but the figure did not reach market forecasts. According to ISM, the number of people employed in the service sector grew more slowly than last month, but in May, the company mistakenly predicted strengthening, so the estimate for the current month may be a correction after the past. The mood in the markets has become worse, and the monthly average figures for the number of applications for unemployment benefits have increased. The main reason for expecting a positive report is poor performance in the previous month. How data will affect currency pairs In case of growth in the number of employed by 165 thousand and an increase in wages by 0.3%, EUR/USD, AUD/USD and NZD/USD will become the best currency pairs for trading. The ECB is not yet ready to cut rates, but the chances of easing policy by the end of the summer are very high. Banks in Australia and New Zealand clearly signaled the need for further rate cuts. The softest position of these two regulators makes the aussies and kiwis vulnerable to a correction against the background of good US employment data. If we see the figures from 135 thousand to 165 thousand, but at the same time the data for the last month will be revised upwards, the greenback's reaction will depend on the growth rate of wages and the level of unemployment. On good performance, the dollar in conjunction with the euro will go up. The greenback will also rise in price in pairs with Australian and New Zealand dollars. In this scenario, the USD/JPY quotes will grow, but this pair is less attractive. The fact is that traders may doubt how strongly a moderate increase in indicators will affect the decision of Fed officials. There is another scenario: an increase in the number of employed by less than 135 thousand without accelerating the growth of wages and a significant revision of the May data. In this case, the USD/JPY and USD/CHF pair will be suitable for trading. The first one is likely to fall below 107, and the second can plummet below 0.9750. With the release of mixed data on the labor market (employment growth will accelerate, but wage growth will slow down or unemployment will rise), the dollar's response will depend on which of the changes will be the most unexpected for the market. The material has been provided by InstaForex Company - www.instaforex.com |
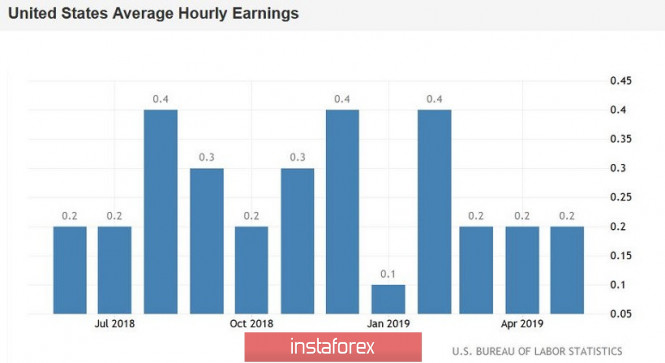
| EUR/USD. Calm before the storm: the market hid in anticipation of the Nonfarm report Posted: 04 Jul 2019 04:34 PM PDT Today, the windless weather on the foreign exchange market: the European session was not rich in macroeconomic reports, and the US trading platforms are completely closed: Independence Day is celebrated in the United States. The nearly empty economic calendar allows you to take a wait-and-see position, especially on the eve of Friday's releases, which will certainly provoke strong volatility. It is noteworthy that on the eve of a "stormy Friday" the market ignored a rather alarming signal, which was voiced by US President Donald Trump. He again accused China and Europe of using currency manipulations, also complaining that Washington only obediently observes this process. The Chinese Foreign Ministry has already responded to this statement by Trump, publishing a concise refutation of the voiced accusations. Brussels ignored the words of the American president, although the reaction of Europe would hardly be different from the Chinese. On the one hand, the situation has exhausted itself - Donald Trump often voices his thoughts or complaints with the help of Twitter. On the other hand, the concern of the US president about this issue is alarming for some currency strategists (in particular, Bank of America), given Trump's ability to take unconventional steps in his policy. Therefore, after the head of the White House once again accused Europe and China of manipulating currency, experts began saying that the president could initiate the use of currency intervention in the coming months. Analysts estimate the likelihood of this scenario in different ways. But almost all of the economists surveyed by Bloomberg do not exclude such a scenario. Especially - if the Fed in July does not reduce the interest rate, and the ECB, in turn, will prepare the ground for the introduction of additional incentives in the autumn. As some currency strategists believe, the White House needs a substantial dollar drawdown across the entire market - by 10-20%. In the context of the euro-dollar pair, this means that the price should rise to levels five years ago, to the area of 1.31-1.37, up to level 40. Naturally, this will cause a domino effect - eurozone inflation is not the only thing that will suffer, but the entire EU economy as a whole, after which the ECB will resort to appropriate mitigation measures. But, as they say, "in war - as war": by launching a flywheel of currency manipulations, the White House will understand perfectly well that central banks of other countries will take a defensive position, devaluing their currencies. As you know, there are several types of interventions, among them sterilized and unsterilized. In the first version of the intervention, the New York Fed will acquire or sell securities on the open market, but will not interfere with monetary policy. Unsterilized intervention directly affects the money supply and rates. And if during sterilized currency intervention the value of the monetary base is maintained, in the second case, the intervention leads to a change in the monetary base. What kind of tool the White House will apply is an open question, and it has become increasingly discussed in the foreign exchange market. According to many analysts, Trump's rhetoric in this regard will only become tougher in the near future. But the traders actually ignored the important, in my opinion, signal from the US president. The market is focused on the upcoming events, namely the Nonfarm, which will be published tomorrow. According to preliminary forecasts, the growth rate of people employed in the non-agricultural sector will grow to "acceptable" values, that is, to 164 thousand. This is much less than the levels at which the indicator went out during the past year and the first quarter of the current year: the indicator practically did not fall below the 200 thousandth mark, and often exceeded the 300 thousandth level. But compared to May, when the number of employed has grown by only 74 thousand, this result will look quite good - but only if the real figures coincide with the predicted ones. Let me remind you that, according to the latest ADP report, the number of people employed in June increased by only 102 thousand. This report is the main guideline on the eve of the publication of official data. Given the relatively weak result from ADP, the June Nonfarm may also disappoint traders. In this case, the dollar is unlikely to be able to hold its position and weaken throughout the market. You should also pay attention to the indicator of the average hourly wage, which is an inflationary indicator. On a monthly basis, over the past three months, it has been at the same level - 0.2%. And on an annualized basis, the index in May is minimal, but unexpectedly dropped from 3.2% to 3.1%. In June, wages should demonstrate a positive trend - both in monthly and annual terms. If this forecast is not justified, the US currency will fall under additional pressure. In general, tomorrow's release either eliminates concerns about the aggressive easing of the monetary policy of the Fed, or, conversely, returns concern about this. In the second case, the EUR/USD pair will get another chance to gain a foothold in the 13th figure, breaking the resistance levels of 1.1305 (the Bollinger Bands average line on the daily chart) and 1.1340 (the Tenkan-sen line on the same timeframe). Otherwise, the bears will finally seize the initiative on the pair, up to the achievement in the medium term, up to the lower limit of the Kumo cloud on D1, that is, to the level of 1.1185. The material has been provided by InstaForex Company - www.instaforex.com |
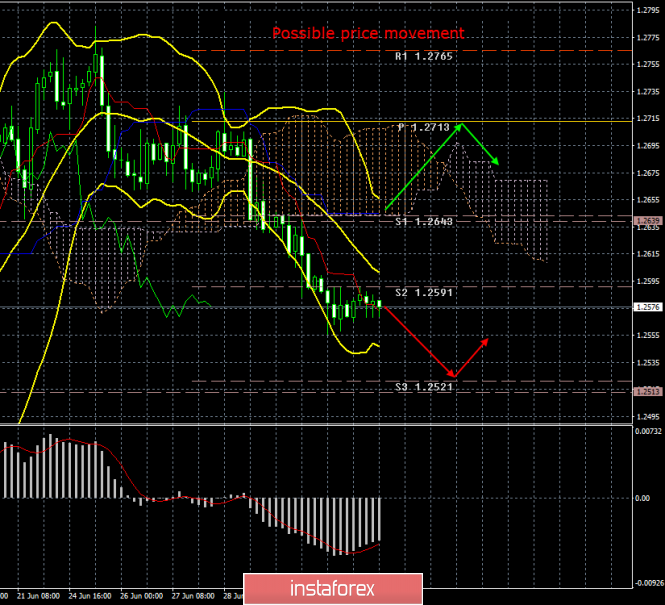
| Posted: 04 Jul 2019 04:17 PM PDT 4-hour timeframe The amplitude of the last 5 days (high-low): 63p - 72p - 74p - 64p - 43p. Average amplitude for the last 5 days: 63p (64p). If the euro "froze in place" against the US dollar on Thursday, then the pound/dollar pair simply "died." From a low to a high of today, the pair passed 25 points. Not a single macroeconomic report was published in the UK or the United States. No new messages on the topics of the China-US trade war or Brexit were also available to traders. Even the two main newsmakers of the last time - Donald Trump and Boris Johnson - did not give high-profile interviews. The American president only once again wrote a Twitter post on the fact that China and the European Union deliberately omit the courses of their national monetary units in order to be more competitive with America. According to Trump, the United States should do the same, that is, cheapen the US dollar in the foreign exchange market. Theoretically, this is possible if America turns on the printing press again and starts to infuse "fresh" dollars into the economy. Recall that from the very first day as the president of the United States, Trump does not part with the idea that the US dollar is of "high cost". In his opinion, it is the expensive dollar that prevents the servicing of the US public debt, the country's trade policy, and also has a negative effect on the trade balance. Now, at the end of his presidency, Trump may even go for open currency interventions in order to lower the US currency. Also, the odious leader in his post threatened to open a currency war in Beijing and Brussels. As we see, relations between the United States and the European Union and China are only heating up. Trump makes it clear that either everyone will play by his rules, or there will be trade and currency wars. But do the Americans themselves support Trump's policies? Recall that in November 2020 there will be elections for a new US president ... Trading recommendations: The pound/dollar currency pair has begun a side correction. Thus, traders are advised to wait until it is completed and re-sell the pound sterling with the goal of a third support level of 1.2521. It will be possible to buy the British currency no earlier than when the pair consolidates above the Kijun-sen line. In this case, the bulls will get a small chance to form an upward trend. In addition to the technical picture should also take into account the fundamental data and the time of their release. Explanation of the illustration: Ichimoku indicator: Tenkan-sen - the red line. Kijun-sen - the blue line. Senkou Span A - light brown dotted line. Senkou Span B - light purple dotted line. Chikou Span - green line. Bollinger Bands indicator: 3 yellow lines. MACD Indicator: Red line and histogram with white bars in the indicator window. The material has been provided by InstaForex Company - www.instaforex.com |
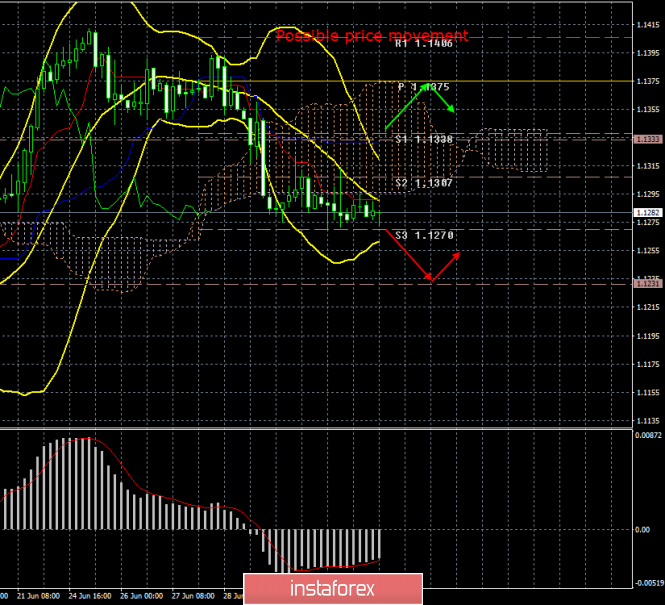
| Posted: 04 Jul 2019 03:48 PM PDT 4-hour timeframe The amplitude of the last 5 days (high-low): 34p - 42p - 90p - 47p - 44p. Average amplitude for the last 5 days: 51p (51p). As we expected in the morning, nothing special stood out today, during the fourth of July, having the status of a semi-weekend since Independence Day is being celebrated in the US. Traders decided not to risk it in vain, since tomorrow important macroeconomic reports will be published in the US anyway, after which certain conclusions will be made. In addition, a certain part of traders are generally out of the market today. All this translates into very weak volatility in the euro/dollar pair and frankly a sideways movement. But nothing can be done with this, and we expected it in the morning. The only more or less significant report today - retail sales in the eurozone - as you might guess, turned out to be worse than expected. But since its degree of significance is rather low, there was no particular reaction to it. But tomorrow's NonFarm Payrolls report has a high value amid talk of a possible reduction in the Fed's key rate. If the number of new jobs created outside the agricultural sector turns out to be lower than the forecast (164,000), this will be another reason for the Fed to lower the key rate, if not in July, then in September. By itself, the weakness of this report can also cause short-term sales of US currency. It seems that the EU and the US are competing in the last month, as to whose macroeconomic statistics will be worse. The ECB is also thinking about a rate cut, so the question is which of the two regulators will take this dovish step first. If the ECB comes first then it could end very badly for the euro currency. The euro has just managed to move away from annual lows, and the bulls are hoping for support of the currency pair by the Fed (which can mitigate the monetary policy of the first) and the United States, who cannot agree on a trade agreement with China. Trading recommendations: The EUR/USD pair, one might say, continues the correction, since there is no downward movement for the second consecutive day. Thus, it is recommended that you wait for its completion and resume selling the euro with targets of 1,1270 and 1,1231. It is recommended to buy the euro/dollar pair not earlier than when the price consolidates above the Kijun-sen line. However, this will require a strong fundamental basis for the bulls. In addition to the technical picture should also take into account the fundamental data and the time of their release. Explanation of the illustration: Ichimoku indicator: Tenkan-sen - the red line. Kijun-sen - the blue line. Senkou Span A - light brown dotted line. Senkou Span B - light purple dotted line. Chikou Span - green line. Bollinger Bands indicator: 3 yellow lines. MACD Indicator: Red line and histogram with white bars in the indicator window. The material has been provided by InstaForex Company - www.instaforex.com |
| July 4, 2019 : GBP/USD Intraday technical analysis and trade recommendations. Posted: 04 Jul 2019 08:35 AM PDT
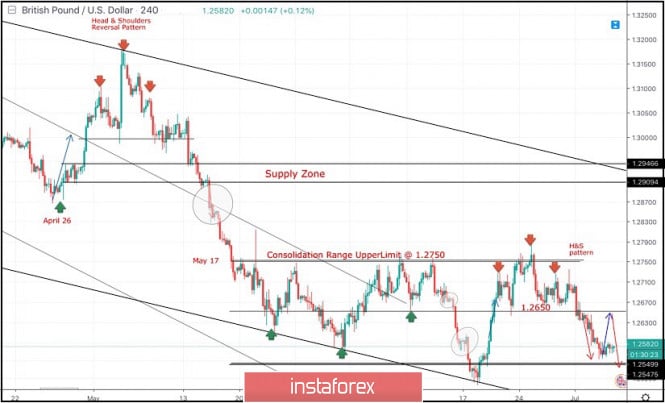
Since May 17, the previous downside movement within the depicted bearish channel came to a pause allowing the recent sideway consolidation range to be established between 1.2750 - 1.2550 with a prominent key-level around 1.2650. On June 4, temporary bullish consolidations above 1.2650 were demonstrated for a few trading sessions. However, the price level of 1.2750 (consolidation range upper limit) has prevented further bullish advancement. That's why, the GBP/USD failed to establish a successful bullish breakout above 1.2750. Instead, early signs of bearish rejection have been manifested (Head & Shoulders reversal pattern with neckline located around 1.2650). A quick bearish pullback towards 1.2650 was expected shortly. Bearish breakdown below 1.2650 (reversal pattern neckline) confirmed the reversal pattern with bearish projection target located at 1.2550 and 1.2510. Short-term outlook remains under bearish pressure as long as the market keeps moving below 1.2650 (mid-range key-level and neckline of the reversal pattern). In general, Obvious Bearish breakdown below 1.2570 confirms a trend reversal into bearish on the intermediate term. Immediate bearish decline would be expected towards 1.2505 initially. Any bullish pullback towards 1.2650 may be considered as a valid SELL signal for Intraday traders. On the other hand, a bullish position can ONLY be considered if EARLY Bullish persistence above 1.2650 is re-achieved on the current H4 chart. Trade Recommendations: Intraday traders can have a valid SELL Entry anywhere around the neckline of the depicted reversal pattern near 1.2650. T/P levels to be located around 1.2600, 1.2550 and 1.2505. S/L should be placed above 1.2700. The material has been provided by InstaForex Company - www.instaforex.com |
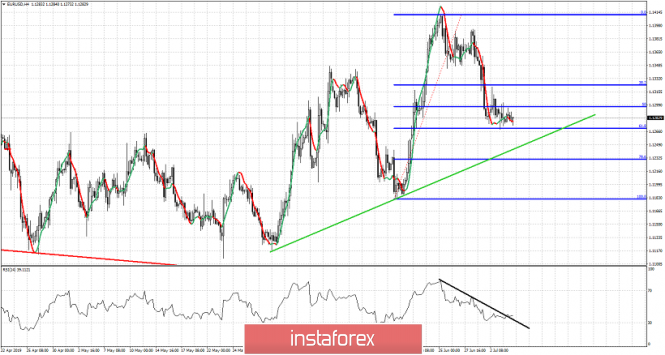
| EURUSD near important Fibonacci support Posted: 04 Jul 2019 08:23 AM PDT EURUSD is trading just below 1.13 near important short-term Fibonacci support levels, with high chances of a reversal to the upside if bulls manage to break above 1.1320. Short-term bullish divergence signals are seen but no reversal confirmation yet.
Black line - RSI resistance trend line EURUSD is trading around 61.8% Fibonacci level and remains above the green trend line support. As long as price is above this trend line we remain bullish medium-term. The RSI has broken above the black trend line resistance but price has not broken above short-term resistance of 1.13-1.1320. Breaking above 1.1320 will signal a move back towards 1.14. Most probable scenario is to see a new upward move, but first we might see a new lower low around 1.1260 and a new bullish divergence before reversing to the upside. The material has been provided by InstaForex Company - www.instaforex.com |
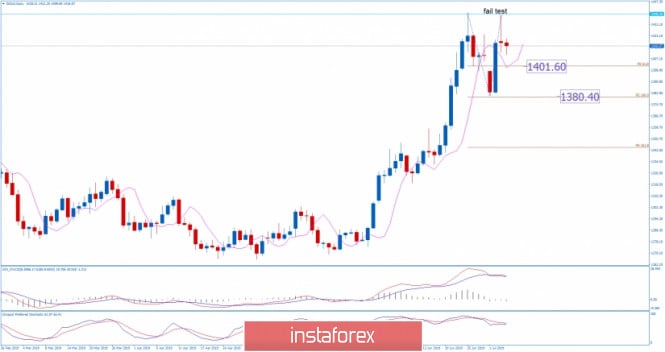
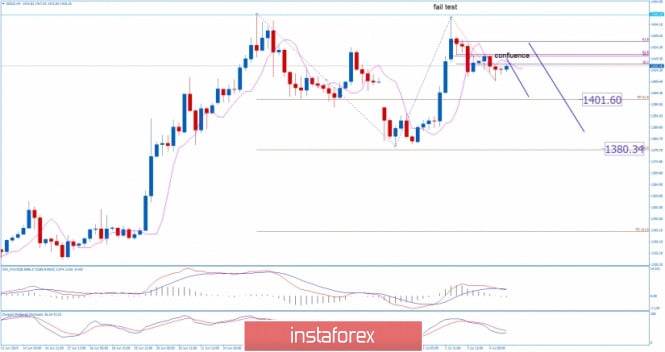
| Gold 07.04.2019 - Downside is expected Posted: 04 Jul 2019 07:35 AM PDT The Gold didn't have enough power to break the swing high at $1.438 and high was missed by few ticks, which is sign for me that buyers got very exhausted there. Since there is the fail test of high in the background, my focus is on downside. Short-term resistance-fib confluence level is set at $1.420 and this level is my main focus for potential selling positions.
The focus now shifts to U.S. non-farm payrolls data due on Friday, which economists expect to have risen by 160,000 in June, compared with 75,000 in May. On the daily time-frame I found that there is bear cross on the Stochastic and MACD, which represents short-term downtrend. Fibonacci expansion target is set at $1.400 (FIB 61.8%) also a round number and then $1.380 (FIB 100%). The 4H time-frame is showing the consolidation but also fresh new cross on the MACD oscillator, which is good confirmation for further downside. Today is holiday in US and light volume is expected till end of the day. The material has been provided by InstaForex Company - www.instaforex.com |
| July 4, 2019 : EUR/USD Intraday technical analysis and trade recommendations. Posted: 04 Jul 2019 07:28 AM PDT
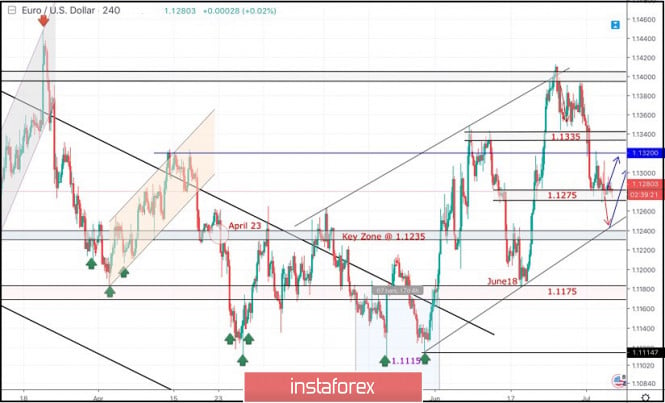
Since February 28, the EURUSD pair has been moving within the depicted downside channel with slight bearish tendency. Short-term outlook turned to become bearish towards 1.1175 (a previous weekly bottom which has been holding prices above for some time. On the highlighted period between (May 17th and June 5th), temporary bearish breakdown below 1.1175 was demonstrated on the chart. This allowed further bearish decline to occur towards 1.1115 where significant bullish recovery brought the EUR/USD pair back above 1.1175 which stands as a prominent DEMAND level until now. Initially, Temporary Bullish breakout above 1.1335 was demonstrated (suggesting a high probability bullish continuation pattern). However, the EURUSD pair has failed to maintain that bullish persistence above 1.1320 and 1.1275 (the depicted price levels/zones). This was followed by a deeper bearish pullback towards 1.1175 where significant bullish price action was demonstrated on June 18. The EURUSD looked overbought around 1.1400 facing a confluence of supply levels. Thus, a bearish pullback was initiated towards 1.1275 as expected in a previous article. Further Bearish decline below 1.1275 calls for a deeper bearish pullback towards 1.1235 where the lower limit of the newly-established bullish channel as well as a prominent demand zone come to meet the EUR/USD pair. Overall, Short-term outlook remains bullish as long as bullish persistence above 1.1235 (Demand-Zone) is maintained on the H4 chart. Otherwise, any bearish breakdown below 1.1235 invites further bearish momentum to push towards 1.1175 as an initial destination. Trade recommendations : For Intraday traders, a valid BUY entry can be considered anywhere around 1.1235. Initial Target levels to be located around 1.1275 and 1.1320. Bearish breakout below 1.1200 invalidates this mentioned scenario. The material has been provided by InstaForex Company - www.instaforex.com |
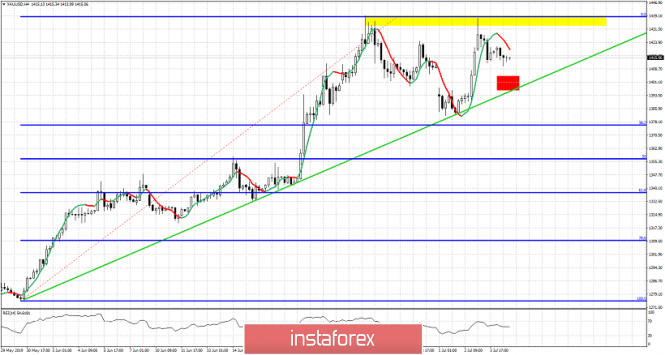
| Gold price stays above short-term support Posted: 04 Jul 2019 07:23 AM PDT Gold price got rejected at $1,439 and has pulled back towards previous resistance now support at $1,400. Gold is in a trading range and it is better to be neutral until we see a clear break of resistance or support.
Red rectangle - support Green line - trend line support Yellow rectangle - resistance Gold price has resistance at $1,439-40 and support at $1,400. As long as price is above the green trend line and the red rectangle bulls will have hopes for a move towards $1,500-$1,520. Breaking above $1,440 will confirm this bullish scenario. However yesterday's double top and rejection at $1,440 is a bearish sign. Breaking below $1,400 will open the way for a move towards $1,300-$1,330. So now we wait. The material has been provided by InstaForex Company - www.instaforex.com |
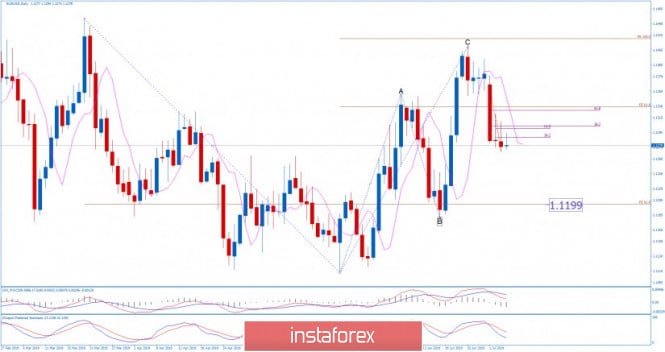
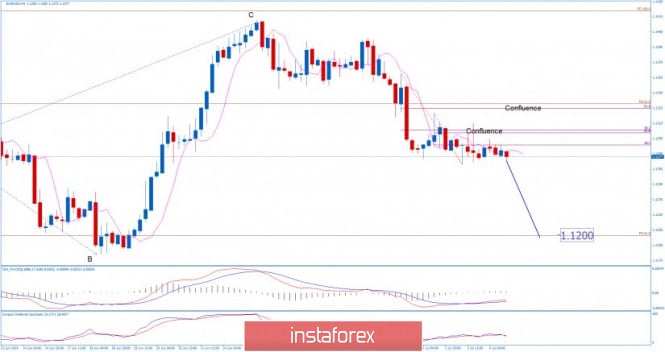
| EUR/USD for July 04,2019 - Sellers in control Posted: 04 Jul 2019 07:20 AM PDT The euro didn't have enough power yesterday to break our important confluence-resistance level at the price of 1.1300 and also round number. The price did very quick rejection of our confluence resistance Fibonacci Retracement 38.2%/61.8% and on that way confirmed present of sellers. If the EUR clean the level of 1.1270, the downward movement may continue. . The focus now shifts to U.S. non-farm payrolls data due on Friday, which economists expect to have risen by 160,000 in June, compared with 75,000 in May. On the daily time-frame I found that there is completion of the ABC correction and the price is trading below the 5SMA, which is sign of the short term downtrend. Fibonacci expansion target is set at 1.1200 also a round number. Both Stochastic and MACD on the daily time frame are trending lower, which only confirms sellers activity. Pay attention on key resistance levels 1.1300 and 1.1325. Both resistance levels are based on multi Fibonacci levels and as long the price is trading below these numbers, the selling opportunities will be preferable. The 4H time-frame is showing the consolidation. Today is holiday in US and light volume is expected till end of the day. The material has been provided by InstaForex Company - www.instaforex.com |
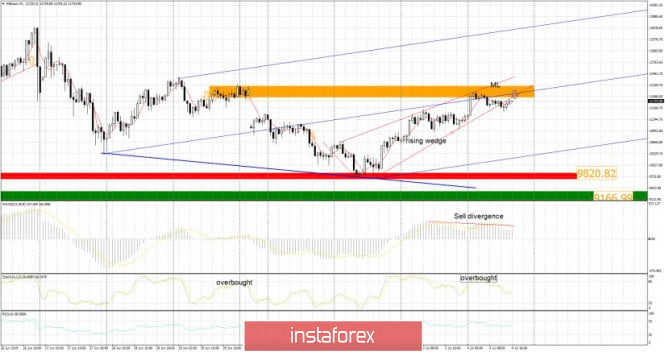
| BTC 07.04.2019 - Major resistance at $12.000 on the test Posted: 04 Jul 2019 06:33 AM PDT Industry news: The United States and the United Kingdom lead the world in Bitcoin tweets. Venezuela leads in the most negative Bitcoin tweets at a whopping 62%. The United Stated is leading the world in regards to Bitcoin tweets according to new research by The TIE. The United Kingdom, on the other hand, takes up 10.5% of the tweets. The report said that the top six countries leading in Bitcoin tweets are the United States, the United Kingdom, Canada, Turkey as well as India. This is another indication that demand for BTC in US is expanding. Anyway, BTC is in consolidation phase for now and we focus on day to day price activity. Technical Overview:
BTC has been trading sideways in past 10 hours at the price of $11.800. In my opinion there is potential for the downside today due to the broken rising wedge in the background and strong resistance on the test. The important resistance and round number are set at $12.000. The level of $12.00 must be cleared for any significant upward movement; otherwise sellers will take again control. Orange rectangle – Resistance ($12.000) Red lines – Broken wedge Red rectangle – Support ($9.820) MACD oscillator – Sell divergence Pitchfork Median line (blue channel) – Strong resistance Trading Recommendations: BTC is trading in the consolidation phase and the best strategy at the moment is to sell at the important resistance. The level of $12.000 looks very attractive for sellers. Down target is set at the price of $9.820. The material has been provided by InstaForex Company - www.instaforex.com |
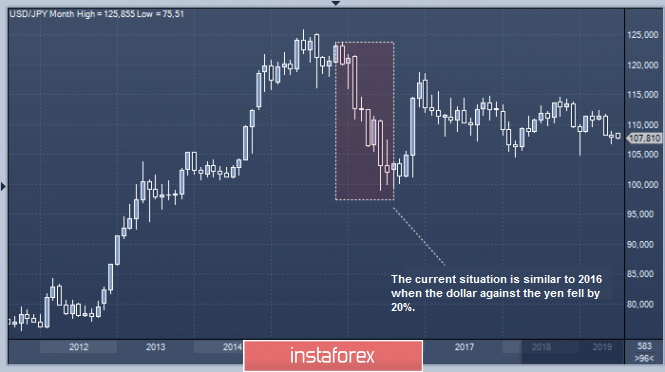
| The yen will rise, and the US dollar will fall - Morgan Stanley Posted: 04 Jul 2019 03:39 AM PDT Experts of the largest bank Morgan Stanley sharply worsened the forecast for the US dollar against the yen. The study concerns not only the current situation but as well as with what awaits on the situation next year. Strategists of the bank has stated what should be expected of the American and Japanese currencies in the short and long-term basis. Currency experts at Morgan Stanley lowered their forecast for the dollar to yen rate from 108 to 102 at the end of 2019 and from 98 to 94 at the end of next year. At the same time, the bank's analysts added Japanese currency to the so-called "recommended portfolio". In this situation, experts at Morgan Stanley recommend buying the yen against the US dollar and the British pound. In the recent months, the US dollar against the yen has been steadily falling amid a decline in real returns on US assets. According to analysts, it decreases faster than the profitability of European and Japanese assets. During Asian trading on Thursday, July 4, the US dollar depreciates against the yen and hardly changes in tandem with other currencies. Paired with the Japanese currency, the euro fell to 121.51 yen compared with 121.76 yen on Tuesday. The US dollar exchange rate was 107.63 yen against 107.88 yen a day earlier. According to experts of another large financial company, Julius Baer, the deterioration of fundamental factors limits the possibility of growth of the American currency. These include the potential reduction in key rates by the Fed, which negates the benefits of the US dollar associated with monetary policy. In the current situation, the experts of Julius Baer revised the forecast for the EUR / USD pair upwards, and for the USD / JPY pair - downward. The reason for this goes forth to the belief of the experts on the lack of potential for further growth by the US currency. Morgan Stanley believes that the current situation is reminiscent of 2016, when inflation expectations shrank faster than nominal bond yields. At that time, the USD / JPY rate collapsed by 20%, which led to a serious imbalance in the economy, analysts remind. |
| What can the foreign exchange market expect from the negotiations between the US and China? Nothing! Posted: 04 Jul 2019 02:21 AM PDT
After US President Donald Trump openly stated that any signed trade agreement with China should be in favor of the United States, China in response said that to sign the agreement, all existing additional trade tariffs on the part of the US should be canceled. Recall, the leaders of the two countries last weekend agreed to resume trade negotiations, which were stopped in May after US officials accused China of violating previous commitments in accordance with the preliminary text of the agreement, which, according to negotiators, was almost completed. Now, trade groups from both countries are in contact, spokesman for the Ministry of Commerce of China, Gao Feng, said at a press briefing. To resume negotiations, US President Donald Trump agreed to postpone the introduction of additional tariffs on imports from China in the amount of about $300 billion and ease restrictions on Chinese technology giant Huawei. Currently, in the United States, there are increased tariffs of 25% for Chinese goods worth $250 billion. China welcomed the decision of the United States not to introduce new tariffs, Gao said when asked how long the truce could last. However, talking about signing an agreement in the short term does not make sense. The parties put each other unrealistic conditions. Full cancellation of existing tariffs in the United States requires China, Trump will sign an agreement only if it is in favor of the United States. The material has been provided by InstaForex Company - www.instaforex.com |
| The dollar retreats against expectations of lower rates, there is no prospect for growth Posted: 04 Jul 2019 02:19 AM PDT The dollar is falling. The decline in the yield of US Treasury bonds suggests that the Fed will reduce interest rates this month. Government bonds are at the center of a global rally, which pushed the yield of US Treasury bonds to the lowest level in the last 2.5 years and sent the European yield to record low levels. One conclusion – large Central banks will lower interest rates to support economic growth. Additional pressure on the dollar is exerted by the trade war between the US and China. Among the positive factors are data on employment in the non-agricultural sector of the United States, which, according to economists, increased by 160,000 in June compared to 75,000 in May. But the positive data on wages are unlikely to support the dollar, they will not block the effect of lower rates in the United States. More and more market participants put on a decline, given the low inflation and the consequences of tariffs, which imposed each other the US and China. With low yields on government bonds, it makes no sense to expect people to buy the dollar. Market sentiment suggests a decline in the dollar in the short term. The only thing against the background of expectations of lower rates in Europe and the UK dollar may be easier to move against the yen. Recall, the dollar fell by 3.5% against the yen over the past three months amid growing signs that the Fed will reduce rates at a meeting on July 30-31. In addition, on Thursday, it makes no sense to wait for active trading in the foreign exchange market, as the US markets are closed on the weekend. The administration of US President Donald Trump said that a meeting with Chinese colleagues is scheduled next week, which will mark the resumption of negotiations between the two countries. However, expectations for a peaceful resolution of the dispute declined after Trump said that any agreement should be in favor of the United States. The material has been provided by InstaForex Company - www.instaforex.com |
| Wave analysis of EUR / USD and GBP / USD for July 4. Markets rest before NonFarm Payrolls Posted: 04 Jul 2019 02:18 AM PDT EUR / USD
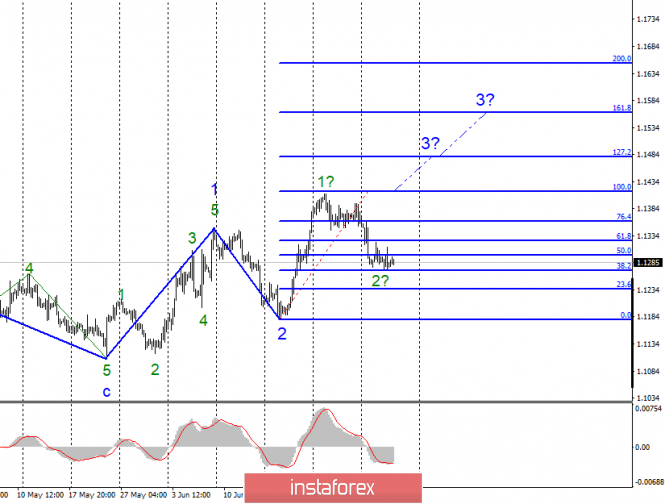
On Wednesday, July 3, trading ended for the EUR / USD pair with a decrease of several base points. The bulls of the last forces oppose the bears, who continue to put pressure on the tool. Wave counting, which provides for the construction of the upward trend section, thus remains in force, but the currency market may continue to sell the euro, which will lead to adjustments to it. Until the break of the low of wave 2, the probability of continuing to raise the euro-dollar pair remains at a good level. Unfortunately, the news background for the Eurocurrency is out of sight once again. Yesterday, the eurozone business activity index exceeded market expectations, but this did not help Eurocurrency. It also did not generate demand for it within the day. Thus, the currency of the European Union hardly kept from a new fall. A news background is needed to resume the growth of the euro. Today, the American markets are close to the celebration of Independence Day and it's not worthy to expect anything extraordinary from the couple. From the European Union today, I also do not expect any important news and reports. For a day or two, bulls might in relative equilibrium with bears. Purchase goals: 1.1417 - 100.0% Fibonacci 1.1480 - 127.2% Fibonacci Sales targets: 1.1180 - 0.0% Fibonacci General conclusions and trading recommendations: The euro / dollar pair is presumably located within the 3 waves of the upward trend. I recommend buying the euro with targets located near the estimated marks of 1.1417 and 1.1480, which equates to 100.0% and 127.2% Fibonacci, when the MACD signal is up. Now, the alleged correctional wave 2 continues its construction. GBP / USD
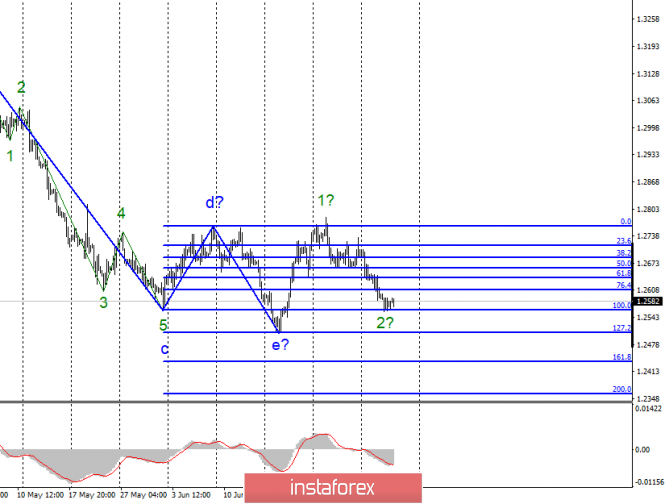
The GBP / USD pair lost 20 basis points yesterday, and the UK could lose more than $100 billion from the hard Brexit. Despite the difficulty, you can find a positive moment for the pound sterling in the swamp. Another thing is that the markets have ceased to respond to rumors related to Brexit and its possible consequences for the UK economy. Given that these rumors are mostly painted black, the pound could have already traded at 1.1–1.15. Nevertheless, the bulls still keep the currency from new falls, but every day they manage it all with great difficulty. The current wave counting still implies the construction of an upward trend section, since the previous trend already looks complete. However, without news support, bulls may not find any reason to buy a pound. And now they are really hard to find. We are hoping for the USA economic indicators which in the recent times have not always pleased the Forex market. Today is a half-day, but there will be non-farms and the unemployment rate in America tomorrow. Sales targets: 1.2434 - 161.8% Fibonacci 1.2359 - 200.0% Fibonacci Purchase goals: 1.2767 - 0.0% Fibonacci General conclusions and trading recommendations: The wave pattern of the instrument for the pound / dollar currency pair involves the construction of a new upward trend. At the same time, I recommend waiting for a successful attempt to break through the maximum of wave d, which confirms the willingness of markets to further increase, and only after that, purchases will be made. By the MACD signal "up", you can open small purchases with targets that are near the 1.2750 mark and a Stop Loss order under the minimum of wave e. The material has been provided by InstaForex Company - www.instaforex.com |
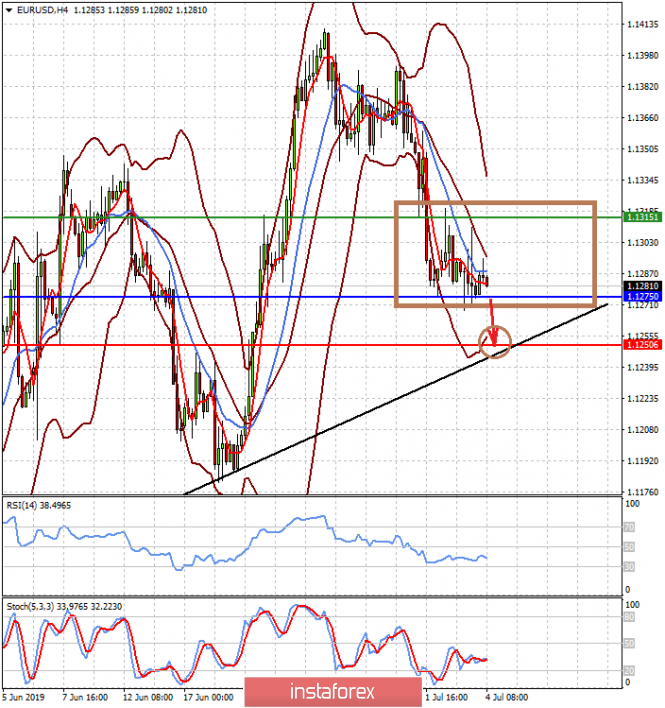
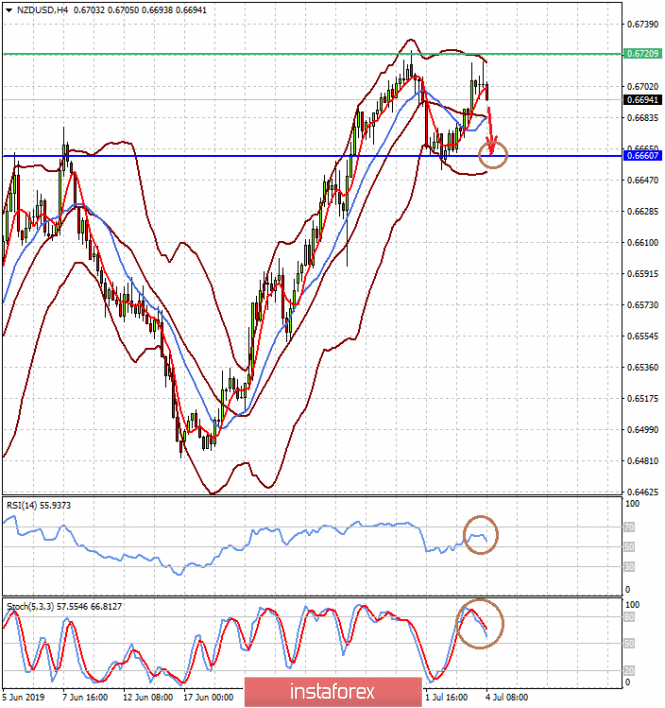
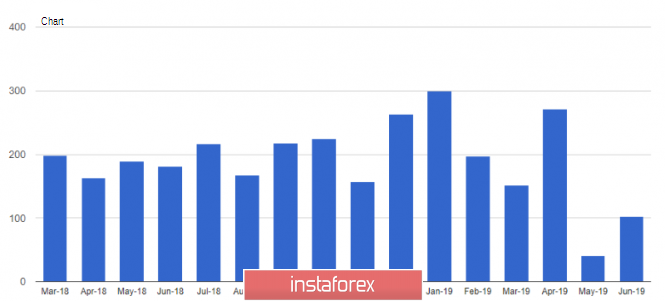
| Euro to weaken in case Lagarde is elected ECB President Posted: 04 Jul 2019 01:31 AM PDT The American and European financial markets positively reacted to the candidacy of Christine for the post of the European Central Bank President. Currently, she is the head of the International Monetary Fund. This positive attitude can be explained by the fact that Lagarde is expected to take active measures aimed at boosting economic growth in the region. The measures may include the resumption of the quantitative easing program or introduction of a similar program. Naturally, if her candidacy is approved, it will provide support to the European stock market and consequently affect the exchange rate of the single European currency. On Wednesday, the ADP released the report on the number of newly created jobs in the United States in June. This report is traditionally a prelude to the official data that will be presented this Friday. The ADP numbers were not impressive. Though the nonfarm payrolls turned out to be higher than May's values, which had been slightly revised upwards to 41,000, they were still noticeably lower than expected. The forecast suggested that the American economy created 140,000 jobs in June but the acual reading was only 102,000. Though this data is not official, it very often reflects the figures issued by the US Department of Labor. Additionally, the Institute for Supply Management (ISM) released the non-manufacturing PMI reading. It demonstrated the overall negative dynamics. The index fell to 55.1 points in June versus the previous reading of 56.9 points with a forecast of a decrease to 56.1 points. If the macroeconomic statistics from the United States continues to be weak, the Federal Reserve may change its wait-and-see approach and take decisive actions aimed at maintaining the growth trend of the national economy. In addition, another factor that could prompt the US financial watchdog to ease its monetary policy is Donald Trump's increasing pressure. His desire to tame the Federal Reserve became deeper ahead of the new presidential race. Reportedly, the President plans to introduce two new members to the Fed, pursuing his goals. Such a move may actually outweigh the overall neutral position of the bank in the direction of lowering the interest rates. Today's market dynamics is sluggish as the American investors are off their desks, celebrating Independence Day. Daily Outlook: The EUR/USD pair was consolidating above 1.1275 on the weekend wave in the US and general low investor activity due to this. Probably, the pair will be trading in the range of 1.1275-1.1315, but if the lower boundary of the range is broken, the pair may fall to 1.1250. The NZD/USD pair reached a local maximum of 0.6720 and it is likely to retrace to 0.6660. It would be reasonable to sell the pair after it breaks the level of 0.6690. |
| Burning forecast 07.04.2019 EURUSD and trading recommendation Posted: 04 Jul 2019 01:25 AM PDT
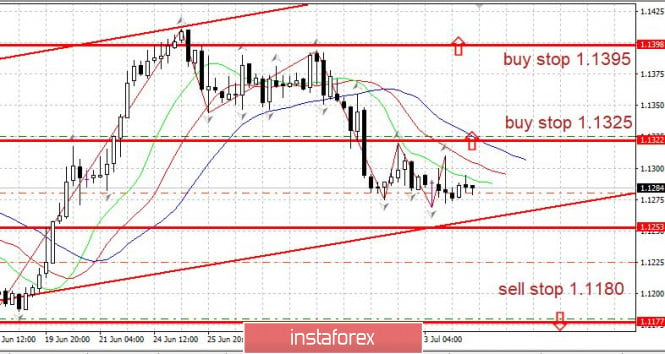
Today is a holiday in the US - Independence Day (July 4). Low volatility can be expected. Recent reports on the US economy showed signs of a slowdown again: The ADP employment report showed only +100 K of new jobs, almost 2 times lower than the forecast, and this is after the failure of +45 K over the previous month. Industrial orders - a decrease of -0.7%. The ISM indices, however, still show continued growth. The slowdown in the US economy is playing against the US dollar. EURUSD: We can expect a reversal upwards and the beginning of the growth trend. From the point of view of technical analysis, it is possible to purchase from the zone 1.1260-1.1290, stop below 1.1250 - or purchases on a breakthrough to the top 1.1325 and further 1.1395 Sales are possible at the breakdown of 1.1180. The material has been provided by InstaForex Company - www.instaforex.com |
| EURUSD: The US dollar retains its potential for growth, despite the diverse fundamental statistics Posted: 04 Jul 2019 01:09 AM PDT Despite the versatile fundamental statistics for the United States, the EURUSD pair remains to trade in the side channel. Most likely, the situation will not change today, as many markets are closed due to Independence Day in the United States. The labor market data, especially the ADP report, put slight pressure on the US dollar in the afternoon. According to a report by the US Department of Labor, the number of initial claims for unemployment benefits declined by 8,000 in the week from June 23 to June 29, to 221,000. Economists expected the number of initial claims to be 225,000. There is nothing unusual in the new data. But the number of jobs in the US private sector increased in June, but the growth turned out to be worse than economists' forecasts, which affected the dollar exchange rate. According to the ADP report, the number of jobs in the US private sector increased by only 102,000 in June, as the problems with hiring new employees are still observed by small businesses. The large business remains successful, while small business is more difficult to compete in a full labor market. In large businesses, 65,000 jobs were created, as well as on average. Economists had expected the number of jobs to grow by 135,000. Trade conflicts and differences between the United States and the rest of the world once again led to a growing trade deficit. High spending contributed to a significant monthly increase in imports, while exports showed more moderate growth. According to the data, the lack of foreign trade in goods and services in the United States in May 2019 increased by 8.4% compared with the previous month and amounted to $55.52 billion in May. Economists had forecast a deficit of $54.4 billion in May. Reducing orders for manufactured goods in the United States will have a negative impact on the economy in the 2nd quarter of this year. According to the report of the Ministry of Commerce, orders for industrial products decreased by 0.7% compared with the previous month and amounted to 493.57 billion US dollars. The data fully coincided with the forecast of economists. Without transport, orders in May rose by 0.1% compared with the previous month. Given the general slowdown in global economic growth and trade conflicts, it is not surprising that even in the USA there are problems in the manufacturing sector. The decline in activity in the US services sector in June led to a temporary weakening of the US dollar position against a number of world currencies. Despite this, the service sector continues to maintain high growth rates. According to the report of the Institute for Supply Management, the purchasing managers' index for the non-production sphere fell in June to 55.1 points from 56.9 points in May. Economists had expected the index to be 55.8 points in June. Let me remind you that values above 50 indicate an increase in activity. As for the technical picture of the EURUSD pair, the bears did not manage to break through the support level of 1.1275 yesterday, and therefore the entire emphasis remains precisely at this level. Only a breakdown of the range of 1.1275 will lead to a larger downward bearish impulse paired with an output of 1.1240 and 1.1200 lows. Under the scenario of an upward correction, large resistance is seen in the region of the maximum of 1.1340. The material has been provided by InstaForex Company - www.instaforex.com |
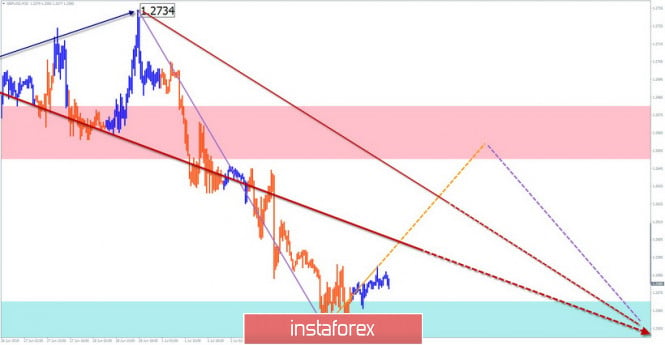
| Simplified wave analysis and forecast for GBP/USD, AUD/USD, and USD/CHF on July 4 Posted: 04 Jul 2019 01:06 AM PDT GBP/USD The chart of the British currency since March is dominated by a bearish trend. Since June 18, a bullish wave has formed. The wave level of the downward wave, which began on June 25, does not exceed the size of the correction of the previous rise, but is close to it. The price is in the area of a potential reversal of a large TF. Forecast: Today is expected to flat, with an upward vector. The current wave with equal probability can remain a correction (B) of the previous upward section or become the first part of the new downward wave. The scope of the upcoming price rise will clarify the further scenario of the movement. Recommendations: Sales of the pound today can be relevant only by the end of the day. Supporters of intra-session trading can use short-term purchases with a reduced lot, the rest is wiser to refrain from trading. In the area of the calculated resistance, it is recommended to start tracking the reversal signals of your TS to find the entry point into a short trade. Resistance zone: - 1.2650/1.2680 Support zone: - 1.2570/1.2540
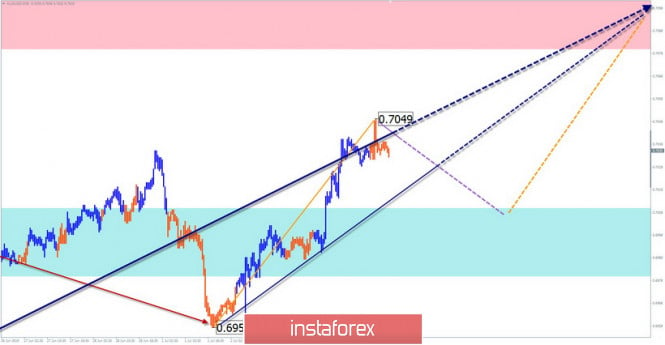
AUD/USD Beginning on May 21, the rising wave of "Aussie" entered the final phase of the movement. Within the last segment, after the end of the counter correction, the final section started on July 1. The calculated resistance is at the lower edge of the target zone. Forecast: In the first half of the day, there is a high probability of a downward pullback of the pair. The scope of the reduction will limit the support zone. By the end of the day, returning to the main motion vector is expected. It is possible to increase volatility. Recommendations: Sales of the pair today can only be used in short-term transactions. In the area of the support zone, after the appearance of reversal signals, it is recommended to look for the entrance to long positions. Resistance zone: - 0.7080/0.7110 Support zone: - 0.7010/0.6980
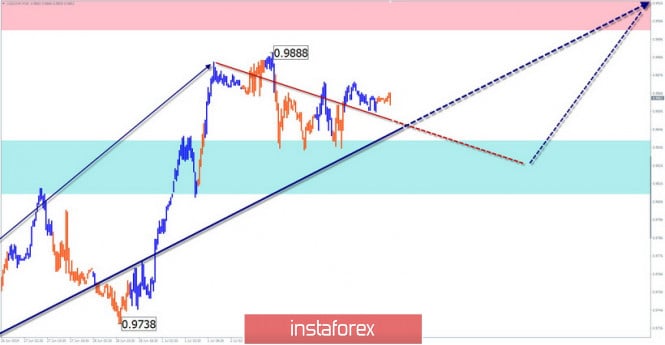
USD/CHF The vector of the main movement of the Swiss franc in the short term from June 25 is directed upwards. The wave level of the current wave indicates its reversal potential. In the structure of the wave from July 1, a downward correction is developing, which has not yet been completed. Forecast: Today, the general flat mood is expected. At the next session, there is a high probability of a repeated decline in the price in the support area. By the end of the day, the chance of a change in rate and its rise to the potential reversal zone increases. Recommendations: Trading in the flat today can put interest only for supporters of "scalping". When selling, the lot size should be reduced. Purchases from the support area may be relevant for several days. Resistance zone: - 0.9900/0.9930 Support zone: - 0.9840/0.9810
Explanations to the figures: Waves in the simplified wave analysis consist of 3 parts (A-B-C). The last unfinished wave is analyzed. Zones show areas with the highest probability of reversal. The arrows indicate the wave marking according to the method used by the author, the solid background is the formed structure, the dotted ones are the expected movements. Note: The wave algorithm does not take into account the duration of tool movements over time. The material has been provided by InstaForex Company - www.instaforex.com |
| Forecast for Forex Market on July 4: Independence Day in the USA and low volatility Posted: 04 Jul 2019 01:06 AM PDT Signals for the EUR/USD pair: A breakout to the level of 1.1307 level will lead to the growth of the euro in the area of 1.1338 and 1.1364. A breakout to the level of 1.1273 will lead to sales of the euro in the area of 1.1239 and 1.1207. Signals for GBP/USD pair: A breakout to the level of 1.2596 will lead to the growth of the pound in the area of 1.2639 and 1.2673. A breakout to the level of 1.2555 will lead to sales of the pound in the area 1.2513 and 1.2483. Important fundamental data are the following: Retail volume Independence Day in the USA The material has been provided by InstaForex Company - www.instaforex.com |
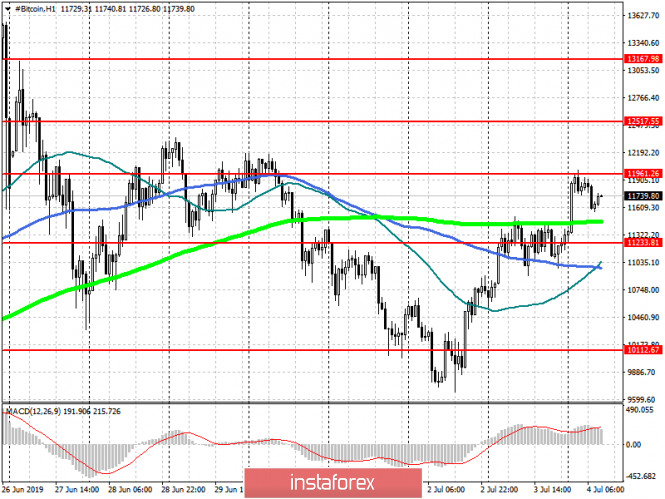
| Bitcoin. 12000 at the sight of buyers Posted: 04 Jul 2019 01:06 AM PDT Yesterday, there was disturbing news that the UK Financial Supervision Authority plans to impose a direct ban on "the sale, marketing, and distribution of CFDs, options and futures, as well as exchange-traded index bonds related to cryptocurrency assets. On the other hand, such a decision does not greatly harm the real market, but only removes smaller intermediaries from it. Signal to buy Bitcoin (BTC): Buyers of bitcoin have come close and tested the level of 11900, and their main task is to consolidate above this range, which will retain the upward potential and return the cryptocurrency to the area of 12500 and 13200, where I recommend taking the profits. In the scenario of depreciation, you can open long positions on a false breakout in the support area of 11200 or on a rebound from the minimum of 10100. Signal to sell Bitcoin (BTC): Sellers need another false break in the resistance area 11900, which will be a signal to open short positions, which will lead to a decrease in the support area of 11200, formed during yesterday. Its breakthrough will provide a return to the psychological level in the area of 10100 USD.
|
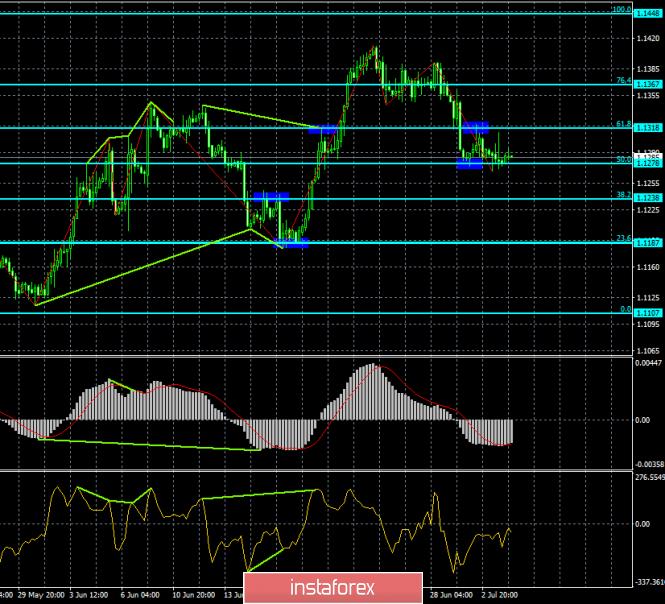
| Posted: 04 Jul 2019 01:05 AM PDT EUR/USD – 4H.
As seen on the 4-hour chart, the EUR/USD pair fell to the correction level of 50.0% (1.1278). New release of quotations from this Fibo level works in favor of the European currency and some growth towards the correction level of 61.8% (1.1318). On the eve, the European Union unexpectedly pleased with the increased business activity in the service sector, while in the US, on the contrary, business activity in the service sector decreased, according to ISM. But according to Markit – also increased. Such data confused traders more than answered the question, the deterioration or improvement of business activity recorded in June in America and Europe. Probably, the answer to this question has not been found, which led to low activity in yesterday's trading. Today, the situation with activity will probably not be better, as in America today is Independence Day, respectively, all stock, trading and other platforms will be closed. Accordingly, the hope is only for European traders, but they probably also will not force events, especially since the news calendar today is almost empty. Only on retail sales in the European Union can pay attention. At the moment, the Fibo level of 50.0% acts as an obstacle to the continuation of the fall of the euro. Closing the pair's rate below it will work in favor of a further fall in the direction of the correction level of 38.2% (1.1238). The Fibo grid is built on extremums from March 20, 2019, and May 23, 2019. Forecast for EUR/USD and trading recommendations: The EUR/USD pair performed a fall towards the correction level of 50.0% (1.1278). I recommend selling the pair with the target of 1.1238, with the stop-loss order above 1.1278, if the closing is performed under the level of 50.0%. I recommend buying the pair with the goal of 1.1318 if a new rebound from the Fibo level of 50.0% and with the stop-loss order under the level of 1.1278. GBP/USD – 4H.
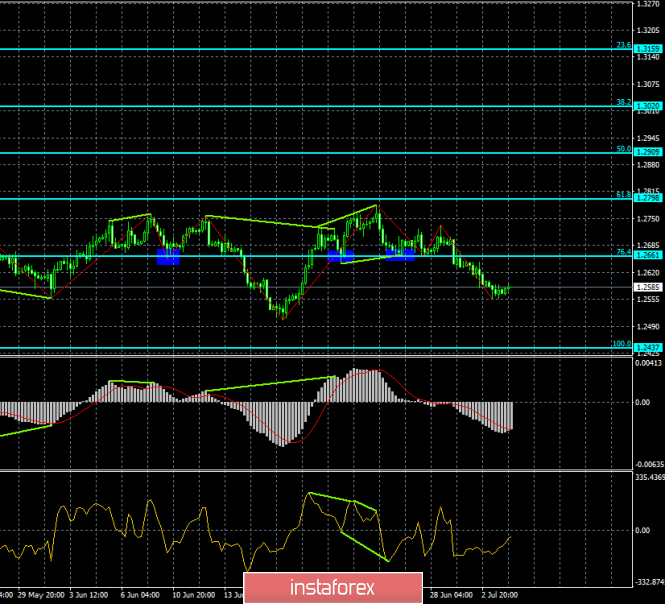
The GBP/USD pair performed a consolidation under the correction level of 76.4% (1.2661) and continues a systematic decline in the direction of the Fibo level of 100.0% (1.2437). The current week for the English currency did not start in the best way. Business activity in the manufacturing sector fell to 48.0, in the construction sector – to 43.1, in the service sector – to 50.1, composite index – to 49.7. All four indices fell on June, 3 out of 4 fell below 50.0, the level below which it is believed that the situation in the sphere is deteriorating. There is no new information on Brexit and the election of a new Prime Minister. Thus, it turns out that traders have no choice but to continue to sell the pound sterling. Today, there will be nothing to please traders. The UK news calendar does not contain any interesting data. But British officials continue to "please" the public with statements about the assessment of the cost of leaving the European Union on the "hard" option. Finance Minister Hammond said that such a "pleasure" can cost the country 114 billion dollars. According to Hammond, these figures will have to be taken into account in future taxes and expenses. Thus, after the Brexit, the economic situation in Britain will improve for a long time. The Fibo grid is built on the extremes of January 3, 2019, and March 13, 2019. GBP/USD – 1H.
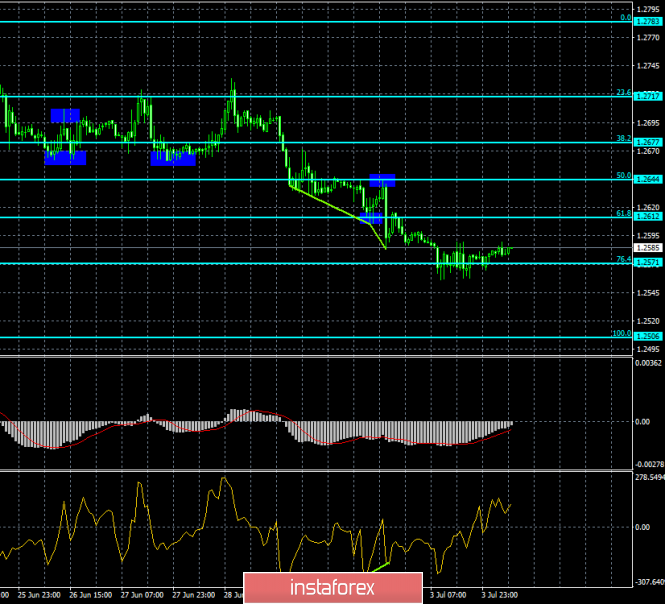
As seen on the hourly chart, the pound/dollar pair fell to the Fibo level of 76.4% (1.2571) and rebounded from it. Fixing quotes below the correction level of 76.4% will work in favor of a further fall in the direction of the next Fibo level of 100.0% (1.2506). Today, the divergence is not observed in any indicator. The Fibo grid is based on the extremes of June 18, 2019, and June 25, 2019. Forecast for GBP/USD and trading recommendations: The GBP/USD pair performed a fall towards the Fibo level of 61.8%. I recommend selling the pair with the target of 1.2506, with the stop-loss order above the level of 1.2571, if the closing is performed under the level of 76.4%. I recommend buying the pair with the goals of 1.2612 and 1.2644, if the rebound from the Fibo level of 76.4% is executed, and with the stop-loss order under the level of 1.2571(hour chart). The material has been provided by InstaForex Company - www.instaforex.com |
| You are subscribed to email updates from Forex analysis review. To stop receiving these emails, you may unsubscribe now. | Email delivery powered by Google |
| Google, 1600 Amphitheatre Parkway, Mountain View, CA 94043, United States | |








No comments:
Post a Comment