
Forex analysis review |
- August 16, 2019 : EUR/USD Intraday technical analysis and trade recommendations.
- August 16, 2019 : GBP/USD Intraday technical analysis and trade recommendations.
- Pound desperately fighting for every position, Boris Johnson puts together a coalition against himself
- USDCAD double top at 61.8% Fibonacci retracement
- Gold price tests short-term support
- BTC 08.16.2019 - Sell zone in the play around $10,400
- Gold 08.16.2019 - Another successful test of the key support at $1,505
- EUR/USD for August 16,2019 - Strong downward prerssure on the EUR
- GBP/USD. House of Commons prepares for war with Johnson: pound spreads its wings
- Fractal analysis of the main currency pairs as of August 16
- Patience needed in establishing USD/JPY longs
- Dollar puts enemies on their knees
- Technical analysis of NZD/USD for August 16, 2019
- Reaching a trade agreement between the US and China in the future will collapse EUR/USD (We expect resumption of a decrease
- Stagnation and possible decline – the future of the oil market
- Inevitable recession in doubt: GBP is trying to form a basis and EUR is worse than the market
- Sterling bounces for a while, but remains vulnerable
- Analysis of EUR / USD and GBP / USD for August 16. Mario Draghi's recent months at the helm of the ECB may pass under the
- Technical analysis of ETH/USD for 16/08/2019:
- Technical analysis of BTC/USD for 16/08/2019:
- Simplified wave analysis and forecast for EUR/USD and GBP/JPY on August 16
- Technical analysis of GBP/USD for 16/08/2019:
- Technical analysis of EUR/USD for 16/08/2019:
- EUR / USD: growth of American statistics, "dovish" comments by Ren and fear of dollar bulls
- Trading plan for EURUSD on 08/16/2019
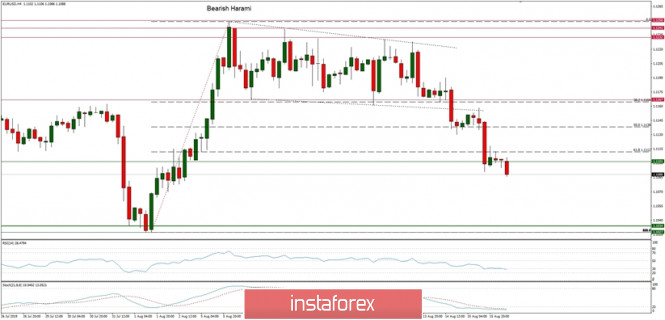
| August 16, 2019 : EUR/USD Intraday technical analysis and trade recommendations. Posted: 16 Aug 2019 08:19 AM PDT
Back in June 24, the EURUSD looked overbought around 1.1400 facing a confluence of supply levels. In the period between 8 - 22 July, sideway consolidation-range was established between 1.1200 - 1.1275 until a triple-top reversal pattern was demonstrated around the upper limit. Shortly after, evident bearish momentum (bearish engulfing H4 candlestick) could bring the EURUSD back below 1.1175. This facilitated further bearish decline towards 1.1115 (Previous Weekly Low) where temporary bullish rejection was demonstrated before bearish breakdown could take place on July 31. On July 31, Temporary Bearish breakdown below 1.1115 allowed further bearish decline towards 1.1025 (lower limit of the depicted recent bearish channel) where significant signs of bullish recovery were demonstrated. Risky traders were advised to look for bullish persistence above 1.1050 as a bullish signal for Intraday BUY entry with bullish target projected towards 1.1115, 1.1175 and 1.1235. During the past week, the depicted Key-Zone around 1.1235 has been standing as a prominent Supply Area where TWO Bearish Engulfing H4 candlesticks were demonstrated. Earlier this week, another bullish visit was demonstrated towards 1.1235 where another episode of bearish rejection was anticipated. Thus, the EUR/USD was trapped between 1.1235-1.1175 for a few trading sessions until bearish breakout below 1.1175 occurred on August 14. Bearish persistence below 1.1175 promoted further bearish decline towards 1.1075 where the backside of the broken bearish channel is located. Currently, Significant bullish recovery sign is being manifested on the chart (A Bullish Engulfing H4 candlestick). A quick bullish breakout above 1.1115 is needed to confirm the short-term trend reversal into bullish. This would enhance further bullish advancement towards 1.1175. Trade recommendations : Conservative traders can have a valid BUY entry anywhere around 1.1070 (where the backside of the broken bearish channel is located). S/L should be placed just below 1.1020 while initial T/P levels should be located around 1.1130, 1.1175 and 1.1200. The material has been provided by InstaForex Company - www.instaforex.com |
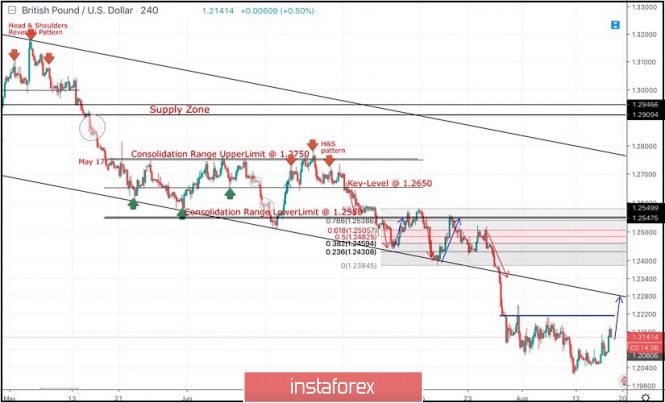
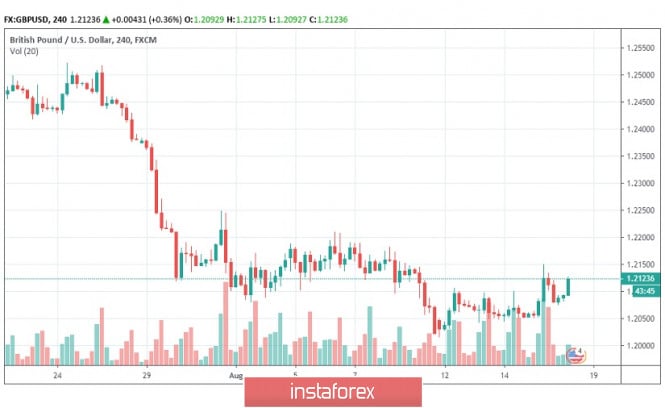
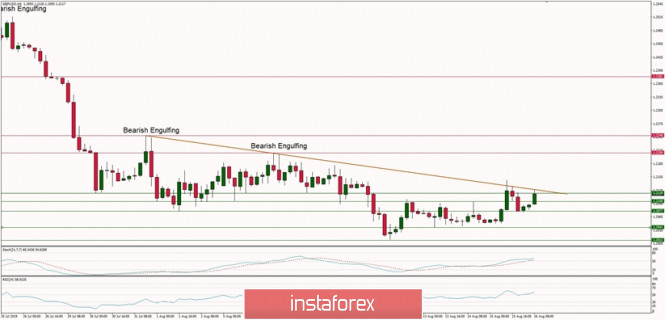
| August 16, 2019 : GBP/USD Intraday technical analysis and trade recommendations. Posted: 16 Aug 2019 07:51 AM PDT
Since May 17, the previous downside movement within the depicted bearish channel came to a pause allowing the recent sideway consolidation range to be established between 1.2750 - 1.2550. On July 5, a bearish range breakout was demonstrated below 1.2550 (the lower limit of the depicted consolidation range). Hence, quick bearish decline was demonstrated towards the price zone of 1.2430-1.2385 (the lower limit of the movement channel) which failed to provide consistent bullish demand for the GBP/USD. Moreover, Bearish breakdown below 1.2350 facilitated further bearish decline towards 1.2320, 1.2270 and 1.2100 which correspond to significant key-levels on the Weekly chart. The current price levels are quite risky/low for having new SELL entries. That's why, Previous SELLERS were advised to have their profits gathered. Last week, temporary signs of bullish recovery were being demonstrated around 1.2100 before Friday when another bearish movement could be demonstrated towards 1.2025. Recent bullish recovery was demonstrated off the recent bottom (1.2025) bringing the GBP/USD pair back towards 1.2100 (recently-established SUPPLY Level). This is supposed to enhance further bullish advancement towards 1.2230 then 1.2320 if sufficient bullish momentum is maintained above 1.2100. Trade Recommendations: Intraday traders were advised to look for early bullish breakout above 1.2100 then above 1.2230 for counter-trend BUY entries. Conservative traders should wait for bullish pullback to pursue towards 1.2320 - 1.2350 for new valid SELL entries. S/L should be placed above 1.2430. Initial T/P level to be placed around 1.2279 and 1.2130. The material has been provided by InstaForex Company - www.instaforex.com |
| Posted: 16 Aug 2019 07:31 AM PDT
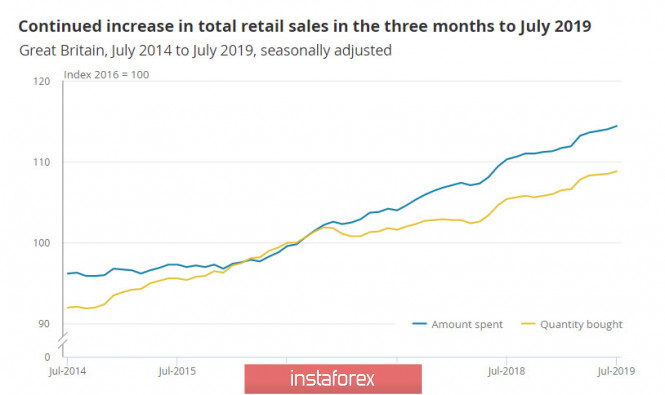
After heavy losses, the pound is trying to resume growth. Can one hope for his restoration or the sale of the "Briton" is still a priority? One of the reasons for the improvement of the pound's position this week was the news from the United Kingdom, indicating the activation of opponents of Brexit as such and supporters of the "divorce" with the European Union, speaking, however, against the release of Albion from the Alliance without a deal. Last Wednesday, Jeremy Corbyn, leader of the British Labor Party, proposed a vote of no confidence in Prime Minister Boris Johnson and the creation of an emergency interim government that ensures that the state does not leave the EU without an agreement and will conduct early general elections. The Leader of the Liberal Democrats Jo Swinson expressed interest in discussing joint actions with the Labor Party, but said that she would prefer not to see J. Corbyn as the head of the interim government, who said he was ready to take on this "burden", and Ken Clarke or Harriet Harman – one of the two members of the House of Commons who have the longest positions in parliament. Representatives of the Scottish National Party, the Party of Wales and the Green Party of England and Wales, in turn, gave signals of readiness to support the plan of J. Corbyn. We cannot say that the news is so positive, but even this alternative looks better than the UK's exit from the EU until October 31 at any cost. Good reports on the UK labor market, inflation, and retail sales also came out this week. Positive macroeconomic data remove from the agenda the need to reduce interest rates by the Bank of England at the September meeting. This is a positive signal for the pound, as investors expect the Fed to reduce the interest rate in September and October. It is assumed that if London and Brussels will be able to make a deal, the pair GBP/USD is waiting for a rally to 1.2500 or higher, but the political risks still outweigh macrostatistics. MUFJ experts recommend considering attempts to restore the British currency as an opportunity for its sale. According to them, the probability of Brexit without a deal increased to 60%, which is a significantly more pessimistic assessment than the market average. A recent survey of economists conducted by Reuters showed that in August (compared to July), the chances of implementing a "hard" scenario increased by 5%, but are only 35%. The bank sees the potential for further weakening of hopes for an orderly Brexit, and hence for the fall of the pound sterling. According to the forecast of MUFJ, GBP/USD will reach 1.10 by the end of the year. At the same time, experts note that even with the implementation of the negative scenario, the pound has chances to recover in 2020. "We believe that the negative consequences of the "hard" Brexit will force London and Brussels to return to the negotiating table to work out solutions to reduce the damage that both sides will suffer. In addition, the British government is likely to adopt a package of fiscal stimulus measures to support the economy of the country", the representatives of the MUFJ said. The material has been provided by InstaForex Company - www.instaforex.com |
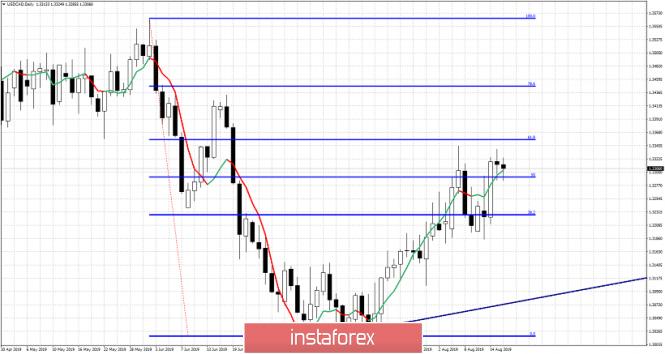
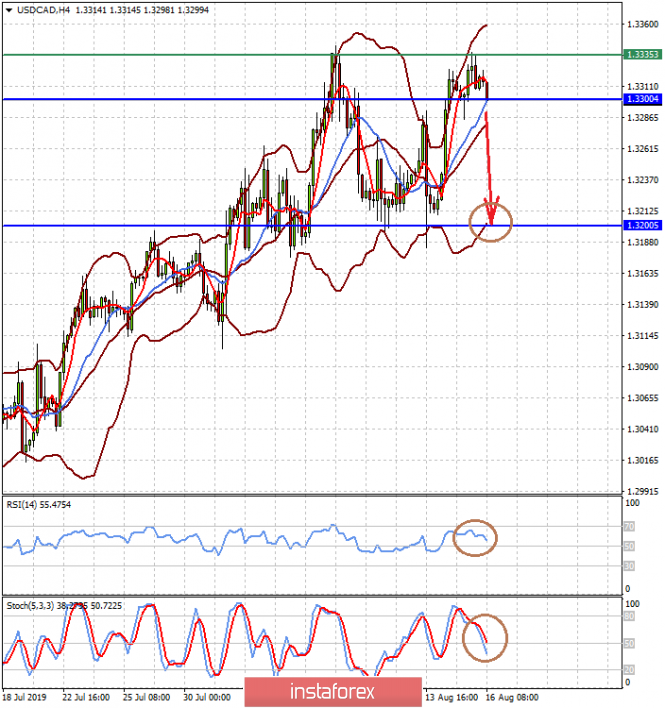
| USDCAD double top at 61.8% Fibonacci retracement Posted: 16 Aug 2019 07:19 AM PDT USDCAD has so far made a double touch of the 61.8% Fibonacci retracement area of the decline from 1.3565 to 1.3015. Another rejection at this area would be a reversal signal and we could see price fall back towards 1.31-1.3150 again. Until then we remain cautiously bullish.
|
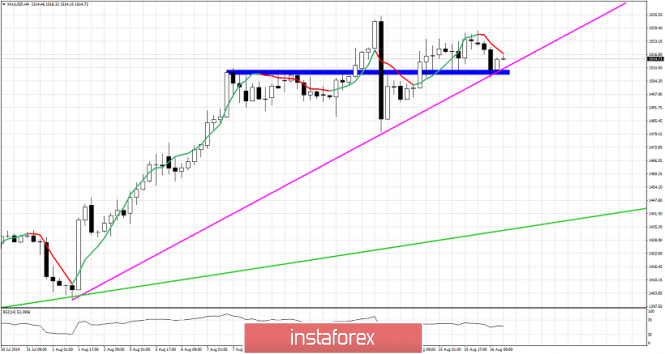
| Gold price tests short-term support Posted: 16 Aug 2019 07:13 AM PDT Gold price has pulled back towards the key short-term support at $1,510. Price is challenging short-term support levels. It is important to see where the weekly close of Gold will be today and we might get some clues for next week.
Magenta line - support trend line Green line - major support trend line Gold price shows weakness signs. We talked in previous posts about the bearish divergence signs and the possibility of a major reversal, but for now we have not seen it yet. So far we only have warning signs. Price is now testing short-term support at $1,510 where we find the upward sloping magenta trend line and the horizontal blue rectangle. Breaking below this support area will be a bearish sign. This could lead to a deeper decline towards $1,450. So traders need to be very cautious. If $1,500-$1,510 fails to hold, bears will have the upper hand as long as price is below it. The material has been provided by InstaForex Company - www.instaforex.com |
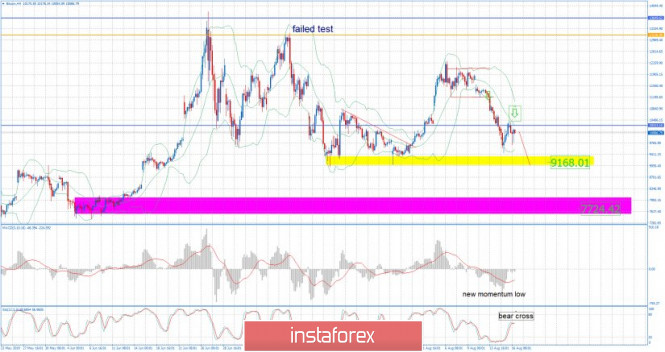
| BTC 08.16.2019 - Sell zone in the play around $10,400 Posted: 16 Aug 2019 06:48 AM PDT Industry news: A British man has been handed 20 months in jail and ordered to forfeit over £400,000 ($487,000) for offering hacking services and stolen private data in return for cryptocurrency. Nineteen-year-old Elliot Gunton was sentenced at Norwich Crown Court on Friday, having pleaded guilty at a previous hearing, according to a local police news report. Technical view:
I mentioned yesterday in my analysis that we would like to see potential to load for short positions and we exactly got that. The level around $10,400 seems like a good sell zone for more downside. Important levels to watch: Yellow rectangle – Support ($9,170) Magneta rectangle –Support 2 and downward target ($9,724) Green lines – Bollinger band MACD is showing the new momentum down on the oscillator, which is good indication for further downside continuation move. Additionally, there is a fresh bear cross on the Stochastic, which is another indication for downside. Selling opportunities are preferable with the targets at $9,168 and $9,724.The material has been provided by InstaForex Company - www.instaforex.com |
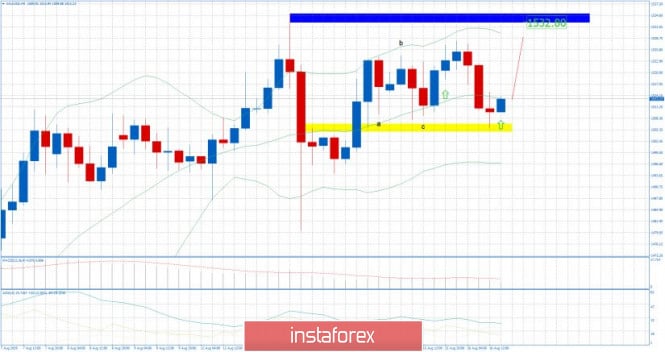
| Gold 08.16.2019 - Another successful test of the key support at $1,505 Posted: 16 Aug 2019 06:30 AM PDT Nothing specially changed since my lat analysis. Gold price continues to trade sideways inside the flag pattern. I expect more upside to come on the Gold due to strong underlying bullish trend.
Red line – expected path Blue rectangle – Resistance 1 ($1,533) Blue rectangle – Resistance 2 ($1,550) Yellow rectangle – Support ($1,505) Gold price continues to trade inside the range of the flag pattern. Support is at $1,505 and resistance at $1,533. The break above $1,514 could give us a target of around $1,533-$1,550. Bulls are in control on the larger time-frame prospective and so far I don't see any reversal signal. As long as the Gold is trading above the $1,505 level, you should watch for long positions. MACD is holding into positive territory, which is good confirmation for my long bias... The material has been provided by InstaForex Company - www.instaforex.com |
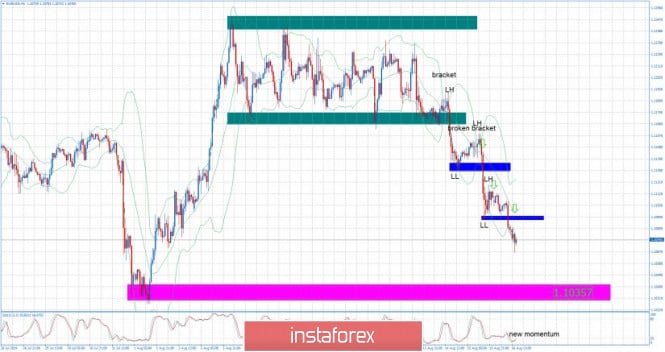
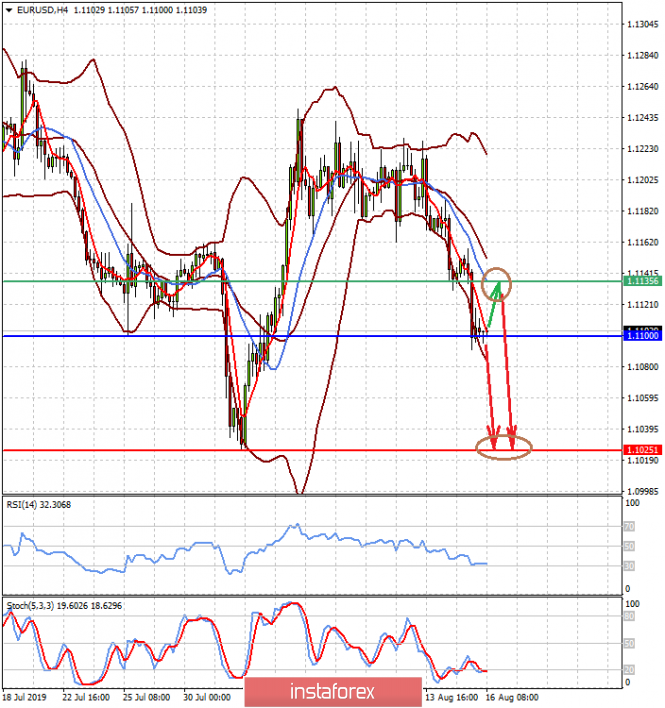
| EUR/USD for August 16,2019 - Strong downward prerssure on the EUR Posted: 16 Aug 2019 06:19 AM PDT EUR/USD has been trading downwards, exactly what I expected yesterday. EUR is in strong downward trend and there is potential for more downside and potential test of key swing low at 1.1030.
Green rectangles – Balance boundaries Blue rectangle – Resistance (1.1130) Blue rectangle – Resistance 2 (1.1090) Magenta rectangle – Swing low support (1.1035) EUR is still making new lower highs and lower lows, which is clear sign for me that trend is downward and that supply is in the control. Usually, when we are in the breakout mode, I would wait for 3-5 days before any short-term long entry. I would watch mostly for selling positions on the rallies on the 5/15 minute time-frame. Key swing low is set at 1.1035. Stochastic oscillator is holding into extreme low reading but that is normal due to the breakout of bracket in the backgrorund.The material has been provided by InstaForex Company - www.instaforex.com |
| GBP/USD. House of Commons prepares for war with Johnson: pound spreads its wings Posted: 16 Aug 2019 06:18 AM PDT While the euro and the dollar are updating two-week lows, the pound shows courage, ignoring the overall strengthening of the US currency. The British have been trading in their own "coordinate system" in recent years, determining priorities among many fundamental factors. For example, this week, the pound ignored strong macroeconomic reports indicating an increase in inflation, wages and retail sales. However, the US statistics, which also came out positively, was ignored by GBP/USD traders. By and large, the pound responds only to news impulses regarding the prospects of Brexit. This topic overlaps all other fundamental factors, and this fact makes the pair difficult to predict.
Let me remind you that on Monday, the GBP/USD pair updated its annual low, reaching 1.2014. Despite the obvious dominance, the bears were not able to enter the 19th figure, after which the pair attracted buyers, due to which the price remained within the 20th figure. The southern impulse has faded not only for technical reasons but rather, on the contrary, fundamental factors have played a key role here. The British began to dive down against the background of the active actions of Boris Johnson on the preparation of "chaotic" Brexit. He created the so-called "military cabinet" from among the ministers, launched a large-scale information campaign and delivered a tough ultimatum to Brussels regarding the revision of the terms of the deal. In other words, all his behavior made it clear that Britain will not initiate another delay and is ready to withdraw from the EU without an agreement. Perhaps, traders felt the reality of the implementation of the voiced intentions – earlier, such rhetoric of the office members on Downing Street was perceived by the market as a bluff from London. That is why the pound fell to multi-year lows but froze on the border between 20 and 19 figures. To overcome the key support level of 1.2000, stronger reasons are needed – and Johnson's "belligerent" intentions in this context will no longer help. Moreover, the current prime minister has a serious opponent – the British Parliament, which deputies aren't ready to satisfy his ambitions, silently agreeing to the implementation of the "rigid" scenario. The closer to autumn, the more political statements of the members of the House of Commons are heard. The next political season in Britain promises to be "hot": the opposition leader did not have time to declare his readiness to initiate a vote of no confidence to Johnson, as there were the first signs that Labor and Conservatives can unite to block the "hard" Brexit. At the moment, about 50 Laborites have expressed their readiness to come up with a "United Front" with the centrists from the Conservative Party against the apocalyptic plan of the government. Also, many members of the House of Commons supported the idea of Corbyn on the establishment of the provisional government after the announcement of the vote of no confidence in Johnson and prolongation of the negotiation period with the EU. However, most of the leaders of the political forces did not agree to see Corbyn as the head of the government of "national unity". In particular, the leader of the Liberal Democrats proposed other deputies to this post. It is noteworthy that the representatives of the Green party and the Party of Wales also agreed to support this idea. At the moment, there are political auctions, but even the fact of discussion of this issue provides background support for the British currency.
Thus, recent events suggest that the British Parliament is ready to "show its teeth" in early September, removing Johnson from his post and blocking the "hard" Brexit. And here it is worth recalling the events of 5 months ago when members of the House of Commons held a signal vote on all options for Brexit. Even then, it became clear that the parliamentarians largely softened their position on further relations with the European Union. For example, the option that Britain after Brexit was to create a Customs Union with the EU gained 264 votes. 272 deputies spoke against it, so the advantage was minimal. An option was also considered, which included the Common Market 2.0 option, in which the United Kingdom would remain in the European economic area and negotiate with the EU on a temporary customs union, which would be valid until an alternative was found. This option was supported by 188 deputies. Another option was to hold a second referendum on the country's withdrawal from the EU. This initiative was supported by 268 parliamentarians, while 295 opposed. Previously, such ideas were categorically rejected by the House of Commons, with a much larger margin of votes. If we compare the results of the March vote on the above proposals with tougher initiatives, the difference in the level of support is obvious. For example, for the option under the letter "B", that is, for the country's exit from the EU without signing any agreement, then only 160 deputies voted, while 400 parliamentarians opposed this idea at once. I think that additional comments are unnecessary here. Thus, the GBP/USD pair currently has the potential for further corrective growth, at least to the level of 1.2200. The nearest resistance level is the Kijun-Sen line on the daily chart, which corresponds to the price of 1.2295. The material has been provided by InstaForex Company - www.instaforex.com |
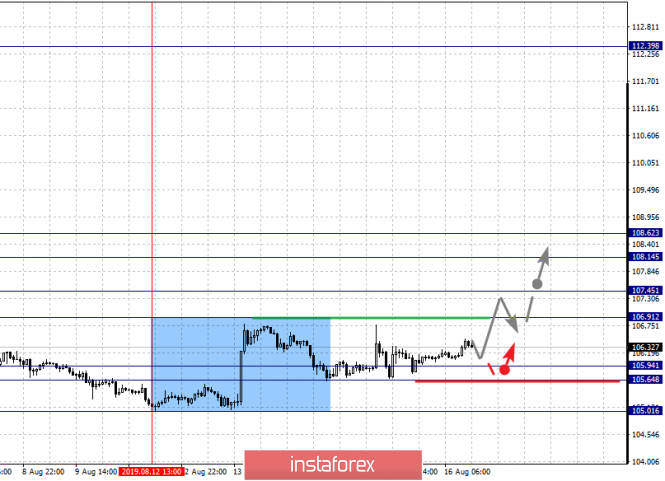
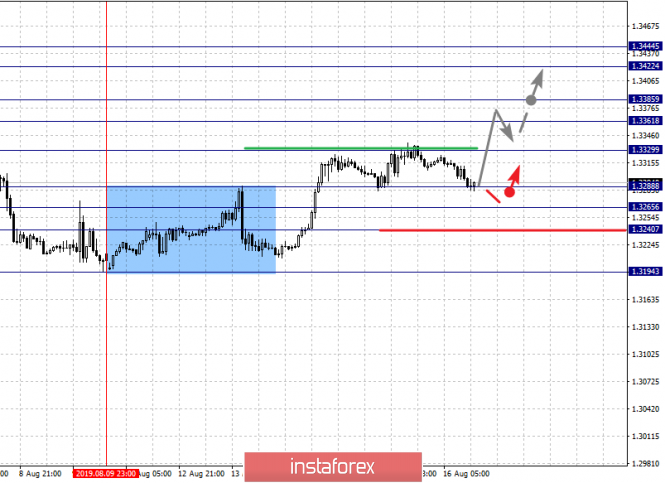
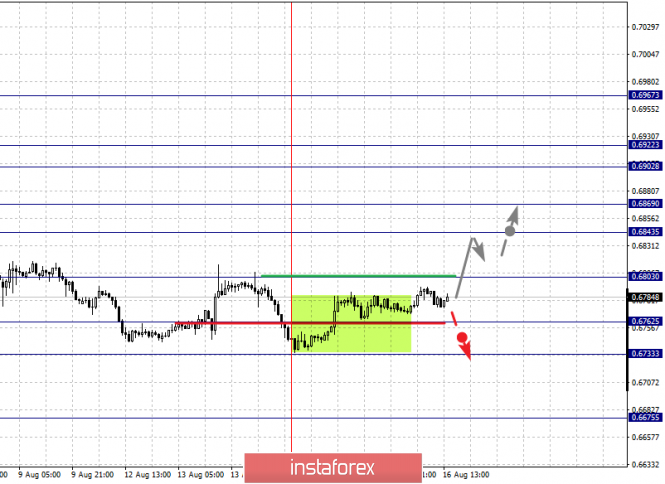
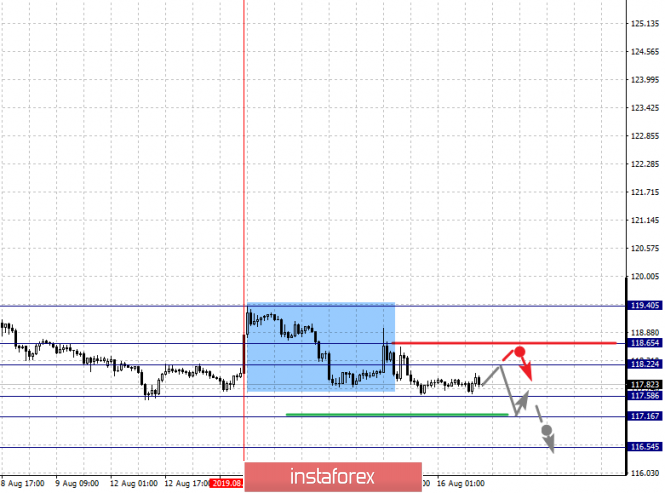
| Fractal analysis of the main currency pairs as of August 16 Posted: 16 Aug 2019 04:51 AM PDT Hello, dear colleagues. For the Euro/Dollar pair, the continuation of the downward cycle of August 13 is expected after the passage of the range of 1.1073 – 1.1062. For the Pound/Dollar pair, we follow the development of the upward cycle of August 12. For the Dollar/Franc pair, the subsequent development of the upward trend from August 13 is expected after the breakdown of 0.9816. For the Dollar/Yen pair, the continuation of the upward movement is expected after the breakdown of 106.91 and the level of 105.64 is the key support. For the Euro/Yen pair, the level of 117.58 is the key resistance for the subsequent development of the downward structure from August 13. For the Pound/Yen pair, the subsequent development of the upward structure from August 12 is expected after the breakdown of 129.66 and the level of 127.94 is the key support. Forecast for August 16: Analytical review of the currency pairs in H1 scale:
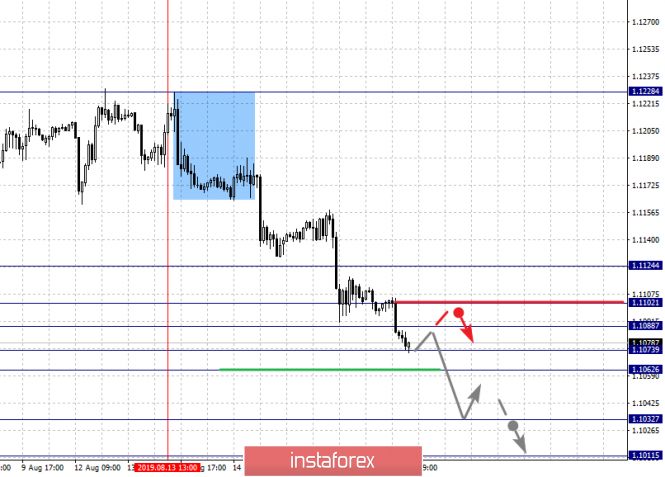
For the Euro/Dollar pair, the key levels on the H1 scale are: 1.1124, 1.1102, 1.1073, 1.1062, 1.1032 and 1.1011. We follow the development of the downward structure from August 13. The short-term downward movement is expected in the range of 1.1073 – 1.1062 and the breakdown of the last value will lead to a pronounced movement. The target is 1.1032 and near this level is the price consolidation. Hence, the probability of going into correction is high. The potential value for the downward trend is the level of 1.1032. The short-term upward movement is possible in the area of 1.1088 – 1.1102 and the breakdown of the last value will lead to a protracted correction. The target is 1.124 and this level is the key support for the downward structure. The main trend is the downward cycle of August 13. Trading recommendations: Buy 1.1088 take profit: 1.100 Buy 1.1105 Take profit: 1.1122 Sell: 1.1060 Take profit: 1.1035 Sell: 1.1030 Take profit: 1.1011
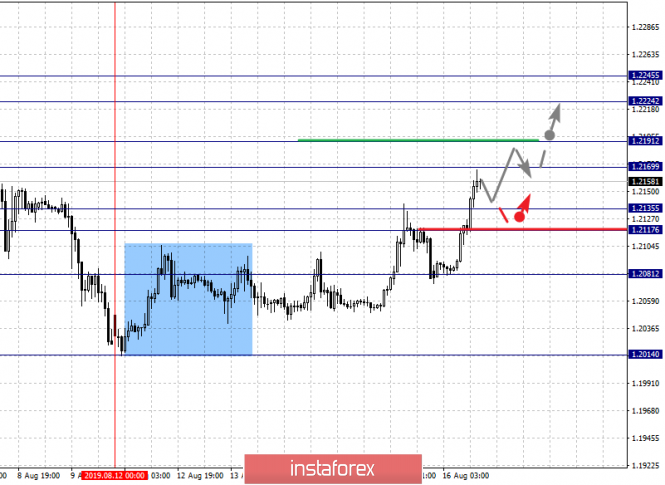
For the Pound/Dollar pair, the key levels on the H1 scale are: 1.2245, 1.2224, 1.2191, 1.2169, 1.2135, 1.2117 and 1.2081. We follow the development of the upward cycle of August 12. The short-term upward movement is expected in the area of 1.2169 – 1.2191 and the breakdown of the last value should be accompanied by a pronounced upward movement. In this case, the target is 1.2224. We consider the level of 1.2245 as a potential value for the top, upon reaching which, we expect consolidation, as well as a rollback to the bottom. The short-term downward movement is possible in the area of 1.2135 – 1.2117 and the breakdown of the last value will lead to a protracted correction. The target is 1.2081 and this level is the key support for the downward structure. The main trend is the downward cycle of July 31. Trading recommendations: Buy: 1.2170 Take profit: 1.2190 Buy: 1.2195 Take profit: 1.2224 Sell: 1.2135 Take profit: 1.2118 Sell: 1.2115 Take profit: 1.2081
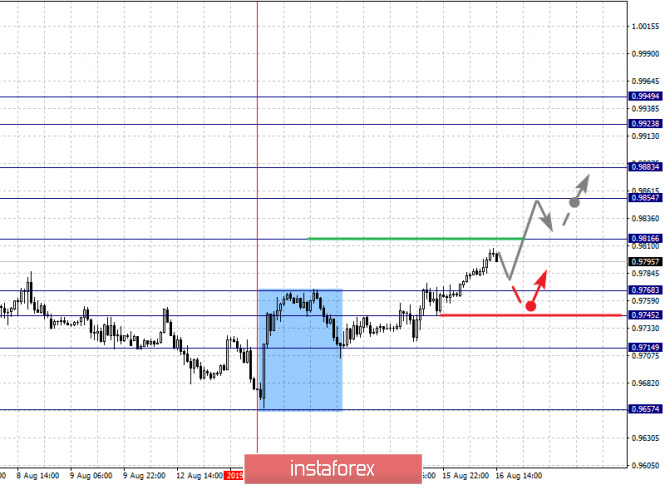
For the Dollar/Franc pair, the key levels in the H1 scale are: 0.9949, 0.9923, 0.9883, 0.9854, 0.9816, 0.9768, 0.9745 and 0.9714. We follow the upward structure from August 13. The continuation of the upward movement is expected after the breakdown of 0.9816. In this case, the target is 0.9854 and in the area of 0.9854 – 0.9883 is the short-term upward movement, as well as consolidation. The breakdown of the level of 0.9883 should be accompanied by a pronounced upward movement. The target is 0.9923. The potential value for the top is the level 0.9949, after which we expect consolidation, as well as a rollback to the bottom. The short-term downward movement is possible in the area of 0.9768 – 0.9745 and the breakdown of the last value will lead to an in-depth correction. The target is 0.9714 and this level is the key support for the top. The main trend is the upward cycle of August 13. Trading recommendations: Buy: 0.9816 Take profit: 0.9854 Buy: 0.9856 Take profit: 0.9881 Sell: 0.9768 Take profit: 0.9747 Sell: 0.9743 Take profit: 0.9715
For the Dollar/Yen pair, the key levels in the H1 scale are: 108.62, 108.14, 107.45, 106.91, 106.35, 105.94, 105.64 and 105.01. We continue to follow the upward structure from August 12. We expect the continuation of the upward movement after the breakdown of 106.91. In this case, the target is 107.45 and near this level is the consolidation. The breakdown of 107.45 should be accompanied by a pronounced upward movement. The target is 108.14. We consider the level of 108.62 as a potential value for the top, upon reaching which, we expect a rollback to the bottom. The range of 105.94 – 105.64 is the key support for the top. Its passage of the price will have to develop a downward movement. In this case, the target – 105.01. The main trend is the building potential for the top of August 12. Trading recommendations: Buy: 106.91 Take profit: 107.43 Buy: 107.47 Take profit: 108.14 Sell: Take profit: Sell: 105.62 Take profit: 105.04
For the Canadian dollar/Dollar pair, the key levels on the H1 scale are: 1.3445, 1.3422, 1.3385, 1.3361, 1.3329, 1.3288, 1.3265, 1.3240 and 1.3194. We follow the development of the local upward structure from August 9. We expect the continuation of the upward movement after the breakdown of 1.3330. In this case, the target is 1.3361 and in the area of 1.3361 – 1.3385 is the consolidation. The breakdown of the level of 1.3385 will allow us to count on the movement to the potential target – 1.3422, upon reaching this level, we expect consolidation in the area of 1.3422 – 1.3444, as well as a rollback to the bottom. The short-term downward movement is possible in the area of 1.3288 – 1.3265 and the breakdown of the last value will lead to an in-depth correction. The target is 1.3240 and this level is the key support for the top. The main trend – local upward structure from August 9. Trading recommendations: Buy: 1.3330 Take profit: 1.3360 Buy: 1.3387 Take profit: 1.3422 Sell: 1.3288 Take profit: 1.3266 Sell: 1.3264 Take profit: 1.3240
For the Australian dollar/Dollar pair, the key levels on the H1 scale are: 0.6967, 0.6922, 0.6902, 0.6869, 0.6843, 0.6803, 0.6762, 0.6733 and 0.6675. We follow the development of the upward structure from August 7. Also, the price has issued a small potential for the top from August 14. The resumption of the upward movement is expected after the breakdown of 0.6803. In this case, the first target is 0.6843 and in the area of 0.6843 – 0.6869 is the short-term upward movement, as well as consolidation. The breakdown of the level of 0.6870 should be accompanied by a pronounced upward movement. The target is 0.6902 and in the area of 0.6902 – 0.6922 is the consolidation. We consider the level of 0.6967 as a potential value for the top, upon reaching which, we expect a rollback to the bottom. We expect a consolidated movement in the area of 0.6762 – 0.6733 and the breakdown of the level of 0.6733 will lead to the development of a downward structure. In this case, the potential target is 0.6675. The main trend is the upward structure of August 7, the stage of correction. Trading recommendations: Buy: 0.6805 Take profit: 0.6840 Buy: 0.6844 Take profit: 0.6867 Sell: Take profit: Sell: 0.6730 Take profit: 0.6680
For the Euro/Yen pair, the key levels on the H1 scale are: 119.40, 118.65, 118.22, 117.58, 117.16 and 116.54. We are following the development of the local capacity for the bottom from August 13. The short-term downward movement is expected in the range of 117.58 – 117.16 and the breakdown of the last value will allow counting on the movement to the potential target – 116.54, near this level is the consolidation. The short-term upward movement is expected in the area of 118.22 – 118.65 and the breakdown of the last value will have to form an upward structure for the top. The first target is 119.40. The main trend is the formation of a local downward structure from August 13. Trading recommendations: Buy: 118.22 Take profit: 118.62 Buy: 118.70 Take profit: 119.40 Sell: 117.56 Take profit: 117.18 Sell: 117.14 Take profit: 116.55
For the Pound/Yen pair, the key levels on the H1 scale are: 132.17, 131.23, 130.57, 129.66, 127.94, 127.33, 126.48 and 125.57. We follow the development of the upward structure from August 12. The short-term upward movement is expected in the range of 129.00 – 129.66 and the breakdown of the last value will lead to a pronounced upward movement. The target is 130.57 and in the area of 130.57 – 131.23 is the short-term upward movement, as well as consolidation. We consider the level of 132.17 as a potential value for the top, upon reaching which, we expect consolidation, as well as a rollback to the bottom. The short-term downward movement is possible in the area of 127.94 – 127.33 and the breakdown of the last value will have to develop a downward structure. The first target is 126.48. We consider the level of 125.57 as a potential value. The main trend is the formation of the potential for the top of August 12. Trading recommendations: Buy: 129.67 Take profit: 130.55 Buy: 130.60 Take profit: 131.20 Sell: 127.30 Take profit: 126.50 Sell: 126.44 Take profit: 125.60 The material has been provided by InstaForex Company - www.instaforex.com |
| Patience needed in establishing USD/JPY longs Posted: 16 Aug 2019 04:12 AM PDT Demand for safe haven assets decreased ahead of Friday's New York open with gold, the Swiss franc and yen are all losing ground. USD/JPY has advanced to highs at 106.50 before fading to 106.35 while USD/CHF has moved above 0.9800 and gold has retreated to below $1,513 per ounce. US equity futures have surged by nearly 1.0% while Treasuries have retreated with the 10-year yield just above 1.55%. Bonds were heavily overbought after recent huge gains and underlying risk conditions have stabilised to some extent. In comments on Wednesday, ECB council member Rehn stated that the central bank needed to announce a substantial package at the September meeting with an interest rate cut and resumption of larger-scale bond purchases. The comments are unlikely to have been made without backing from the key ECB members including President Draghi. The comments have undermined the euro, but there has also been a shift in sentiment with greater optimism that global central banks will ease monetary policy in an aggressive manner to prop up the global economy. In this context, the sense of panic which enveloped markets in mid-week has faded to some extent. Risk aversion sentiment has also eased slightly, thus dending demand for safe haven assets. There are still grave risks, especially given the threat of verbal interventions from President Trump. In the short term, however, Trump is likely to be more concerned with attempts to stabilise Wall Street. So, he is likely to make comments with market-friendly rhetoric. The White House calls on the Fed to cut interest rates deeper, although this rhetoric may also be seen as supporting risk appetite. There are still important event risks surrounding the weekend, especially with political pressures which could spark off again in Hong Kong. USD/JPY can extend gains, although tough resistance is expected on approach to 106.70 ahead of Friday's close. USD/JPY rally is waning on approach to 106.70. So, get ready to buy on dips since early next week. The material has been provided by InstaForex Company - www.instaforex.com |
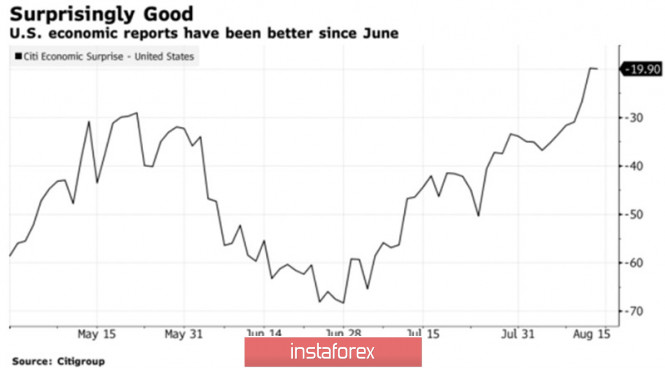
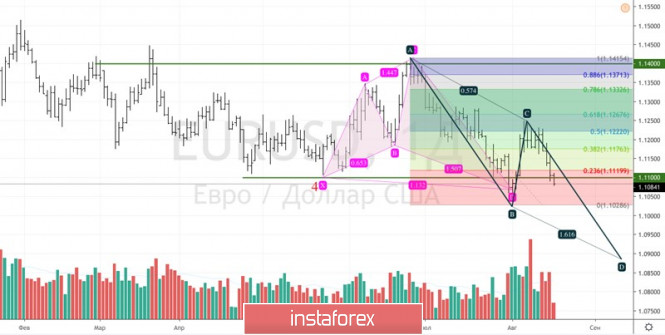
| Dollar puts enemies on their knees Posted: 16 Aug 2019 04:10 AM PDT A strong economy is a strong currency! This principle of fundamental analysis works like a clock. No matter how many Donald Trump and the Fed acting on his orders try to drown the US dollar, they fail. The US looks better than the rest of the world and in such circumstances, the USD index is doomed to rally. Divergence in economic growth has always faithfully served any currency and the "American" is no exception to the rule. After strong July retail sales statistics, Macroeconomic Advisers raised its forecast for US GDP for the third quarter from 1.7% to 2%. The leading indicator from the Atlanta Federal Reserve Bank signals that the American economy will expand by 2.2% in July-September. However, the US can also boast of unemployment near the lowest level over the past half-century and accelerated to 2.2% core inflation. Under normal conditions, the Fed simply would have to consider raising the rate on federal funds, which, on the contrary, has to be reduced. International risks are to blame which caused the inversion of the yield curve. She regularly correctly predicted all subsequent recessions from the mid-50s of the last century. The United States clearly looks better than its main competitors, as evident not only by the growth of the economic index was surprising to its maximum level over the past few months. Germany economy contracted 0.1% in the second quarter, while Eurozone GDP recorded more than a modest 0.2% QoQ growth. So far, Chinese industrial production showed the worst performance since 2002. Trade wars are not only painful in China but also oriented towards China export to the economy of the currency block led by Germany. The dynamics of the US economic surprises index As a result, the ECB is forced to weaken monetary policy not modestly, but very seriously. Markets expect a reduction in the deposit rate from -0.4% to -0.5% and the reanimation of a program of quantitative easing at the September meeting of the Governing Council, which has sunk into oblivion, including the purchase of bonds by €40-50 billion per month. But in fact, they can receive much more. For example, Mario Draghi and his colleagues can lower the rate by 0.2 pp and start buying other assets along with bonds. The main events of the week by August 23 will be the publication of the minutes of the July meetings of the Fed and the ECB. According to their results, the federal funds rate was reduced by 0.25 percentage points and Super Mario gave a signal to resume QE. Theoretically, the further dynamics of the EUR/USD pair will depend on whose rhetoric seems more "dovish" to the market. Nevertheless, the principle of "strong economy - strong currency" has not been canceled. Hence, the dollar is quite capable of continuing the attack on the camps of major world currencies. The technical inability of the euro bulls to keep quotes within the consolidation range of 1.11-1.14 is a sign of their weakness. If the bears manage to rewrite the August minimum and activate the AB = CD pattern, the risks of fulfilling its target will increase by 161.8%. EUR / USD Daily chart |
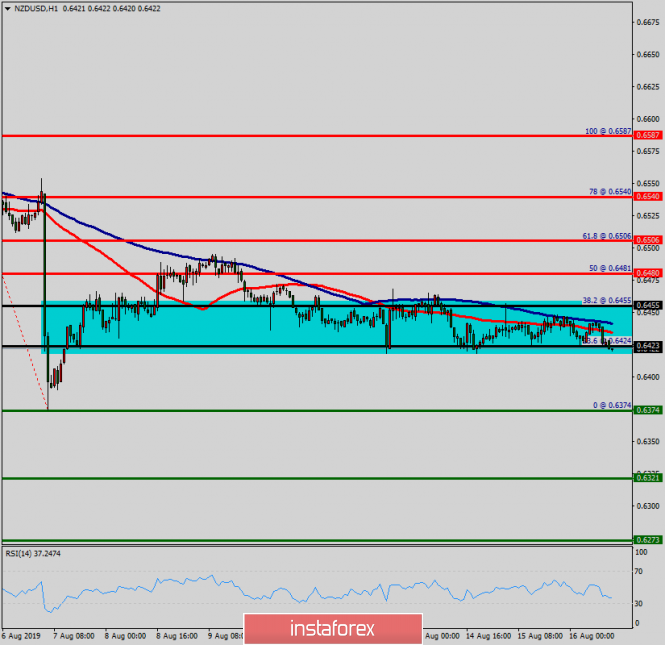
| Technical analysis of NZD/USD for August 16, 2019 Posted: 16 Aug 2019 03:22 AM PDT The NZD/USD pair continued moving upwards from the level of 0.6374. The pair rose from the level of 0.6374 (weekly support) to the top around 0.6423. Immediate resistance is seen around 0.6455. A clear break above that area could lead price to the neutral zone in the nearest term. Price will test 0.6455, because in general, we remain bullish on August 16th, 2019. This week, the market moved from its bottom at 0.6374 and continued to rise towards the top of 0.6423. Today, on the one-hour chart, the current rise will remain within a framework of correction. In consequence, the NZD/USD pair broke resistance, which turned into strong support at the level of 0.6374. The level of 0.6374 is expected to act as the major support today. We expect the NZD/USD pair to continue moving in the bullish trend towards the target levels of 0.6455, 0.6480, 0.6506 and 0.6540. Since there is nothing new in this market, it is not bullish yet. However, if the pair fails to pass through the level of 0.6455 (minor resistance), the market will indicate a bearish opportunity below the strong resistance level of 0.6455 (the level of 0.6455 coincides with tha ratio of 38.2% Fibonacci retracement). If a breakout happens at the support level of 0.6374, then this scenario may be invalidated. The material has been provided by InstaForex Company - www.instaforex.com |
| Posted: 16 Aug 2019 03:14 AM PDT On Thursday, the single European currency experienced a real shock. The reason for which was the statement by the ECB representative of the Central Bank of Finland, Ren. In his speech, he actually announced a new incentive program from the European regulator, which will provide for a reduction in the deposit interest rate to minus 0.5% from the current value of minus 0.4%, as well as the purchase of government bonds worth about 50 billion euros per month. Perhaps these values will vary, the important thing is that Rene said that the incentives presented should disappoint the market. "Better to exceed expectations than not justify them," said Ren. In this situation, the question arises as to what will happen in the future with the Euro/dollar main currency pair. Will it return to parity? Indeed, the expected new unprecedented measures to support the European economy amid the risk of stalling it in a recession are a catalyst for the continuation of the fall of the euro in foreign exchange markets, including against the US dollar. But it is hard to say whether this fall will be valid in relation to the "American". The problem is that the Fed in the conditions of impending chaos in the financial markets, signals about the risks of a recession in the States themselves. It is unlikely to be inactive against the backdrop of an escalation of the trade war between Washington and Beijing. Although there is still no consensus among the members of the American regulator on the question of whether to continue to lower interest rates or again take a break and observe the development of the situation, the likelihood that a decision to lower rates can be made already at the September meeting is very high. Hence, in our opinion, it was during this period of uncertainty about the Fed's real measures regarding the prospects for the level of interest rates that the Eurodollar pair will have every chance to continue to fall. Now, how deep it will be fully depends on the future actions of the Fed, and not the ECB, whose plans have already been announced in general. As for the prospects for parity in the main currency pair, we do not yet see any reason for this. However, such a possibility can completely exclude the achievement of a trade agreement between the United States and China. In this case, the Fed may not consider the likelihood of lower rates, which will entail an even stronger fall in the pair and then, if this state of affairs continues, there is a chance that the pair will approach the level of 1.0000. Forecast of the day: The EURUSD pair is trading above 1.1100. She can recover to 1.1135. We consider it possible to sell it on growth, approximately, from this mark or after it has fallen below the level of 1.1100 with a total target of 1.1025. The USD/CAD pair is testing the level of 1.3300. If crude oil prices begin to recover in the wake of waiting for a new telephone conversation between Donald Trump and Xi Zhenping, then fixing the price below this mark may lead to a local decrease in the pair to 1.3200. |
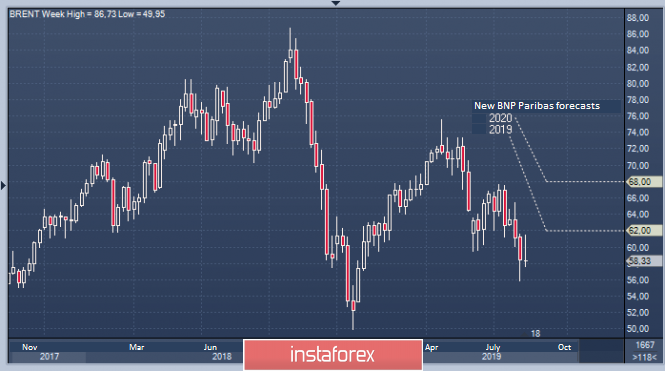
| Stagnation and possible decline – the future of the oil market Posted: 16 Aug 2019 02:22 AM PDT The current situation in the black gold market does not inspire optimism to experts and investors. Analysts of one of the largest banks BNP Paribas revised their oil forecast. The black gold market is losing its previously won position against the background of continuing risks of an escalation of the trade conflict between the US and China. In addition, pressure on the cost of oil is exerted by data from the US Department of Energy. The report of the agency reported an increase in weekly reserves of raw materials in the country by 1.6 million barrels, to 440.5 million barrels, or 0.4%. Note that over the past week, the volume of oil production in the US has not changed, remaining at 12.3 million barrels per day, which is considered a very high indicator. According to some analysts, the pressure on oil prices will remain due to the growth of supply with stagnating demand. The situation is unlikely to change in the near future, experts believe. Experts of BNP Paribas Bank believe that market players should abandon long positions in oil. At the moment, the market is dominated by negative sentiment. Market participants are in tension, not knowing how serious the recession in the global economy will be and how much demand for black gold will fall. BNP Paribas believes that in this situation, oil becomes sensitive to any changes. According to analysts of the Bank, an important factor for the oil market will be the extension of the OPEC+ agreement after the first quarter of 2020. However, a serious limitation of production should not be expected. The experts of BNP Paribas predict a rise in production among independent oil producers. According to experts, by the end of this year, the growth rate of reserves will be 128 thousand barrels per day, and next year, they will increase to 499 thousand barrels per day. Due to the unstable situation in the black gold market, the bank lowered the forecast for Brent crude oil. By the end of this year, its price will fall to $62 instead of the previous $71 per barrel. As for the cost of the reference grade by the end of 2020, it will decrease to $68 from the previous $82 per barrel calculated earlier. By the end of this year, WTI light oil will fall to $55. Recall that the previous forecast assumed the price of $63 per barrel. Next year, they will give $51 for a Texas variety instead of $64 per barrel, according to BNP Paribas. |
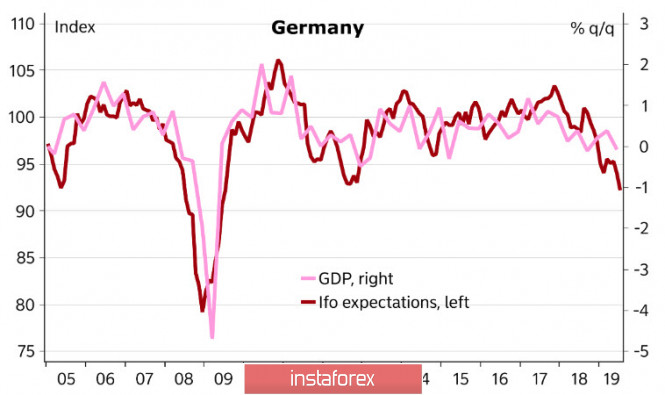
| Inevitable recession in doubt: GBP is trying to form a basis and EUR is worse than the market Posted: 16 Aug 2019 01:52 AM PDT Positive macroeconomic data released on Thursday eased tensions and allowed markets to recoup some of the losses. Retail sales rose in July by 0.7%, which was higher than the forecast of 0.3%. The preliminary data on labor productivity and labor costs in the 2nd quarter were also released that turned out better than forecasts, which indicates underestimated market expectations for employee income and as a consequence, for inflation. After government bonds of a number of leading countries led by the United States showed inversion of yields, the prevailing mood in the markets was the increase in panic and rush demand for defensive assets, which led to the collapse of stock markets. However, a study by Mizuho Bank refutes the widespread belief that a recession is inevitable. In his opinion, negative consequences occur. First of all, it is a result of the tightening policy that preceded the recession. Since the Fed means a reversal in monetary policy, the chances of avoiding a recession are increasing, which could lead to upward markets. EUR/USD pair Germany's economy contracted in the second quarter and weak sentiment data suggest that negative growth continued in the third quarter, leading to a recession. A 0.1% decline in GDP in the second quarter followed an unexpected increase of 0.4% in the first quarter. Thus, the overall economy in the first half of the year is still growing noticeably. However, the prospects are getting worse. Some mood indicators, such as Ifo, already suggest that the economy is in recession. A similar result was published by ZEW as the mood index in the business environment fell in August from -24.5p to -44.1p. In the eurozone as a whole, it decreased from -20.3p to -43.6p. Brexit will cause a significant blow to economic growth. The German government and the Bundesbank support the ECB's willingness to present a stimulus package at the September meeting. Yesterday, the head of the Central Bank of Finland, Olli Rehn, said in an interview with the Wall Street Journal that the upcoming package will have a more serious impact than a number of separate measures. It is expected to reduce the interest rate and significant bond purchases. The euro today looks worse than the market. The momentum remains strong and it is not possible to form an upward correction. A break of support at 1.1091 and a pronounced movement to the minimum of August 1.1029 are likely. GBP/USD pair The pound is trying to form a basis above 1.20, using strong macroeconomic data. Consumer inflation unexpectedly rose in July from 2.0% to 2.1%, while the forecast is a decline to 1.9%,. The core inflation rose from 1.8% to 1.8%. Producer prices showed a noticeable increase and retail sales continued to grow steadily in July by + 3.3% better than forecasts. An increase of 2.6% was expected. Growth in inflation and retail sales indicates strong consumer demand, but inflation is largely supported by the weak pound, which has led to higher import prices. More indicative is the inversion of the spread of returns on 10- and 2-year UK government bonds, which was recorded on August 14. The inversion happened for the first time since the summer of 2008, and as an indicator of an approaching recession, it is a more informative tool for investors, since it has a long-term forecasting power. The Bank of England traditionally follows the Fed in developing monetary policy. Strong data on inflation and retail sales remove concerns about the introduction of incentive measures at the next meeting. Meanwhile, the Bank of England will wait for the Brexit situation to resolve in order to focus on the consequences for the economy. Boris Johnson promised to leave the EU regardless of the scenario, which is regarded as a long-term threat and will not allow the pound to resume growth. On Friday, trading in the range is more likely. No publication of significant macroeconomic releases is planned and support for 1.2015 looks more reliable than it seemed on Wednesday. An attempt is possible to update the recent maximum 1.2148 and a hike to the equilibrium zone of 1.2161/69. The material has been provided by InstaForex Company - www.instaforex.com |
| Sterling bounces for a while, but remains vulnerable Posted: 16 Aug 2019 01:21 AM PDT The UK economic data has provided the sterling with support this week as most major reports beat consensus forecasts. Underlying average earnings strengthened to an 11-year high of 3.9% from 3.6% previously. The headline CPI inflation rate increased to 2.1% from 2.0% while retail sales also posted a monthly gain for July, stronger than expectations of a small decline. The domestic data suggests that the Bank of England will need to be very cautious in easing monetary policy. The inflation and wages data would back the case for a small increase in interest rates. Industrial sentiment remains depressed, but the Bank of England will hardly be able to sort it out through interest rates, especially with the sterling already very weak. There is a strong likelihood that the Federal Reserve will cut interest rates again at the September meeting and that the ECB will announce an aggressive easing package next month. Given global monetary easing, net UK yields have, therefore improved. Political factors will inevitably set the tone for the sterling given the underlying Brexit uncertainty. The government under Prime Minister Johnson remains committed to leaving the EU on October 31st even if no deal with the EU can be reached. A majority of the House of Commons members remain committed to avoiding any no-deal outcome with the scene set for an intense political battle from early September when parliament returns from recess. The G7 Summit on August 24-26th will provide clues to Brexit prospects as Boris Johnson is likely to meet key EU officials including German Chancellor Merkel. Overall political risk premiums will remain very high, although derivative markets indicate that underlying selling pressure on the sterling has eased slightly.
|
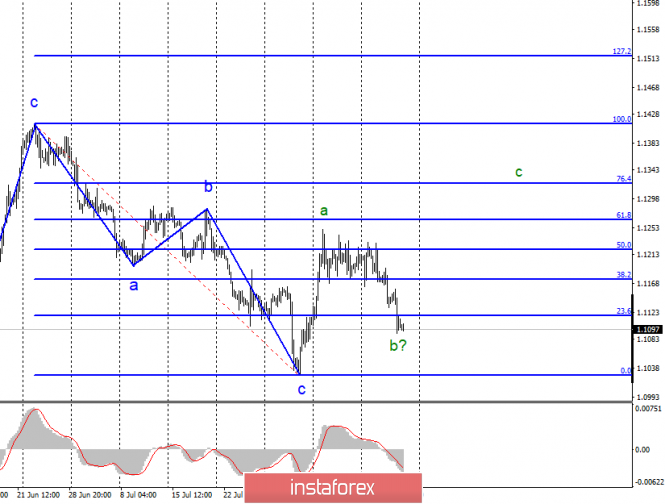
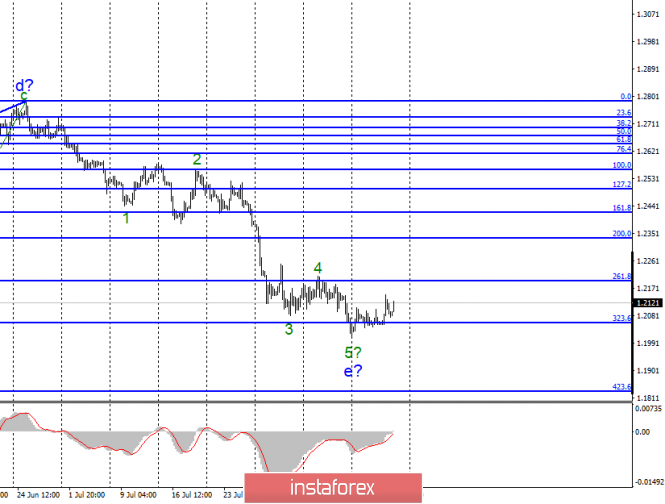
| Posted: 16 Aug 2019 01:19 AM PDT EUR / USD Thursday, August 15, ended for the EUR / USD pair by a decrease of another 30 bp. Thus, the estimated wave b takes a very long form relative to the size of wave a. At the same time, the current wave marking remains valid for now. The main opponent of the current wave pattern is the news background. Yesterday, the US retail sales showed higher growth in July than the markets expected to see. This supported the dollar. Also, yesterday, the head of the Bank of Finland and member of the ECB board of directors, Olli Rehn, made a speech. He said that during the next meeting of the ECB, not only a reduction in the key rate by 0.1% will be announced, but also significant purchases of bonds under the program of quantitative easing. The ECB's monetary committee will come to such measures because of the impending global recession, as well as the growing threats and risks to the world economy in recent times. In addition, the long-term lending program for commercial banks TLTRO may become more convenient and beneficial for banks, as it may increase the terms of loans or lower interest rates. However, one way or another, any easing of monetary policy is a testament to the weakness of the economy and its need for stimulation. This is a negative moment for the euro, and because of this, the currency of the European Union may continue to fall. Purchase goals: 1.1264 - 61.8% Fibonacci 1.1322 - 76.4% Fibonacci Sales goals: 1.1027 - 0.0% Fibonacci General conclusions and trading recommendations: The euro-dollar pair continues to build the upward trend section. Thus, I recommend buying a pair with targets near the calculated levels of 1.1264 and 1.1322, which is equal to 61.8% and 76.4% according to Fibonacci signal, as well as according to the MACD signal upwards, counting on the construction of the ascending wave s. This scenario is valid until a successful attempt to break the minimum of August 1. GBP / USD On August 15, the GBP / USD pair gained about 30 base points and continues a sluggish departure from previously reached minimums. At the moment, the fifth wave e is considered to be completed, however, the news background may lead more than once to the complication of the downward trend section until October 31. Yesterday, the pound received unexpected support from a report on retail sales in the UK, which grew by 3.3% y / y in July. However, the British currency will not always be so. Let me remind you that the country is in a political crisis, as well as in the "Brexit crisis". Yes, it is now quite possible to say that the entire Brexit process is also experiencing a deep crisis, since 3 years after the referendum, it is not even clear whether Brexit will remain, whether Boris Johnson will remain at the helm of the country, or whether there will be a new transfer of Brexit. Thus, I do not rule out a new fall of the pound sterling, but I recommend selling it after a successful attempt to break the minimum of the e wave. Sales goals: 1.2056 - 323.6% Fibonacci 1.1830 - 423.6% Fibonacci Purchase goals: 1.2783 - 0.0% Fibonacci General conclusions and trading recommendations: The downward trend section may become even more complicated. Despite the fact that wave e looks complete, it can take an even more complex form. Thus, with the new MACD signal down, I recommend considering selling the pair with targets near the level of 1.1830, which corresponds to 423.6% Fibonacci. It is even better to wait for the breakthrough of the minimum of August 12 - 1.2014. The material has been provided by InstaForex Company - www.instaforex.com |
| Technical analysis of ETH/USD for 16/08/2019: Posted: 16 Aug 2019 01:18 AM PDT Crypto Industry News: Researchers at the University of Waterloo in Canada have used Blockchain technology to increase trust in electric vehicle charging systems, according to the scientific portal EurekAlert. This discovery can increase the use and extension of the overall charging infrastructure for electric vehicles. Typically, an electric vehicle charging service provider will look for property owners to collaborate and install charging points. Electric vehicle owners can then use them for a fee, which is shared between the equipment supplier and the property owner. The supplier operates the equipment, so the property owner must trust him that he will fairly compensate for the consumption of electricity. Similarly, the owner of an electronic vehicle must trust that he will not be charged an excessive service fee. The situation is aggravated by the fact that this is a very young industry with no established trust structure. The open Blockchain platform will allow all parties to access data and check if they have been changed. Researchers established three steps to integrate Blockchain into the system to reduce dependence on trust. The first is to identify the parties involved and possible trust issues. The second is to design a minimal Blockchain solution to alleviate these problems. Blockchain should closely mimic all parts of the older system that need to be replaced. Therefore, dependencies can still work with minimal modification. Stage three is a gradual migration from the existing Blockchain hybrid/trust to a truly decentralized business model. Technical Market Overview: The bulls at the ETH/USD pair had been capped at the level of $189.91 after the rally was not that strong as they expected. The market has made a Shooting Star candlestick pattern at the end of the move up, so it was another clue regarding the strength of the bounce. The market is now going back down towards the level of $174.54 despite the clear bullish divergence between the price and the momentum indicator. The key technical support is located at the level of $148.27. Weekly Pivot Points: WR3 - $274.14 WR2 - $256.36 WR1 - $233.10 Weekly Pivot - $214.72 WS1 - $193.28 WS2 - $173.99 WS3 - $150.66 Trading Recommendations: The best strategy in the current market conditions is to trade with the larger timeframe trend, which is still up. All the shorter timeframe moves are being treated as a correction inside of the uptrend. The current cycle is wave 2 of the higher degree and it might have been completed, so the uptrend should resume sooner or later. We are waiting for a breakout above the level of $238.68 to confirm the bullish momentum.
|
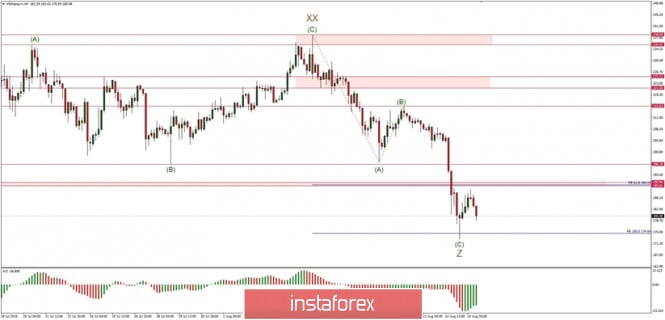
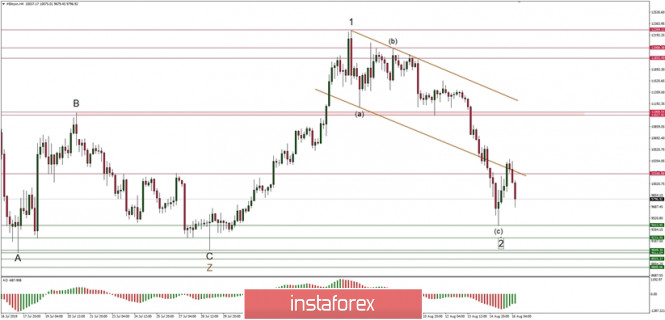
| Technical analysis of BTC/USD for 16/08/2019: Posted: 16 Aug 2019 01:12 AM PDT Crypto Industry News: The CEO of Bitwise Asset Management says he still believes that US regulators will approve cryptographic ETFs. Hunter Horsley spoke during a television interview with Bitwise research director Matt Hougan. Bitwise submitted its last ETF application to the US Securities and Exchange Commission (SEC) in January this year. This week, the regulator postponed the decision on the application - along with two other cryptographic ETF proposals - with the deadline for issuing the decision set for October 13. Despite these changes, Horsley remained positive, noting that the SEC was relatively open to the reasons for this delay and presented the nature of its concerns. Although Bitwise has made many attempts at various ETF applications, it has noticed that great progress has been made over the past twelve months. Horsley's perspective was repeated by Hougan, who summarized significant recent developments in the cryptographic sector, such as the entry of the trading company Susquehanna, improved arbitration and new spreads. He also noted that cryptocurrency trust companies now have access to extensive insurance policies from Llyod's of London and that the market is maturing more widely. He claimed that a large part of SEC's concerns was resolved: A key aspect of Bitcoin ETFs in the US is that they unlock the financial advisor market. Until now, crypto has focused mainly on retail or institutional investors. Half of the money in the United States is managed by financial advisers, and it is currently very difficult for them to gain access to this market. Technical Market Overview: The bounce at the BTC/USD market did not last long as the bulls have only managed to hit the level of $10 383. This level is just slightly above the 38% Fibonacci retracement of the last wave down, so the bounce was weak. The price has reversed again and now is heading back towards the technical support at the level of $9.415. Weekly Pivot Points: WR3 - $13,583 WR2 - $12,879 WR1 - $12,118 Weekly Pivot - $11,389 WS1 - $10,550 WS2 - $9,816 WS3 - $9,007 Trading Recommendations: The best strategy in the current market conditions is to trade with the larger timeframe trend, which is still up. All the shorter timeframe moves are being treated as a correction inside of the uptrend. The larger degree WXY correction might have been completed and the market might be ready for another impulsive wave up of a higher degree.
|
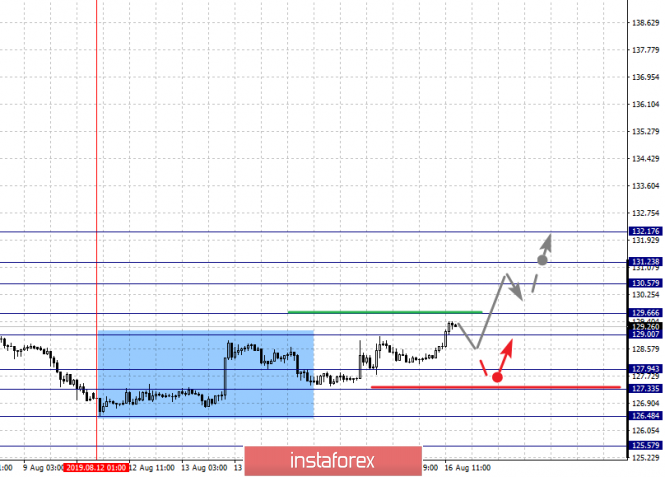
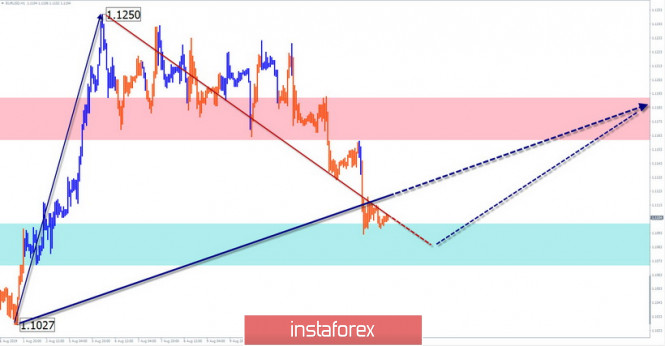
| Simplified wave analysis and forecast for EUR/USD and GBP/JPY on August 16 Posted: 16 Aug 2019 01:03 AM PDT EUR/USD In the short term, the trend direction on the euro chart is set by the bullish wave of August 1. In its framework, a downward correction has been developing since the 6th, which has received lengthening in recent days. At the time of analysis, the price is next to the support. The structure of the correction looks completed, but the reversal signal is not observed. Forecast: Today, the completion of the current decline is expected, the exchange rate, and the beginning of the price rise. When turning, a short-term puncture of the lower border of the support zone is not excluded. Recommendations: Today, trading in the euro market is not recommended. The potential for sales has been exhausted. Until there are unambiguous signals of a change in the direction, buying the euro can be very risky. After the appearance of signals, the main attention should be paid to the pair's purchases. Resistance zone: - 1.1160/1.1190 Support zone: - 1.1100/1.1070
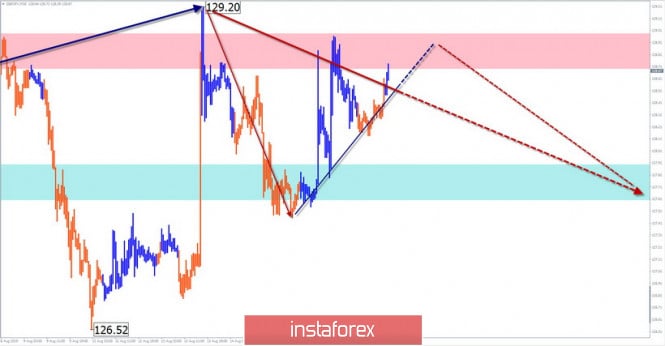
GBP/JPY After the completed 2-week bullish correction, the downward section of August 13 gave rise to a new trend wave. It has a reversal potential. In the last day, a correction is formed. Forecast: In the first half of the day, the pair is expected to complete the upward movement. In the area of the resistance zone, then you should wait for the reversal and the price move of the pair down. Recommendations: The purchase of the pair is possible only if the style of day's trade on small TF. In the area of the resistance zone, it is recommended to track the reversal signals on your vehicle, in order to sell the instrument. Resistance zone: - 128.70/129.00 Support zone: - 127.90/127.60
Explanations to the figures: Waves in the simplified wave analysis consist of 3 parts (A-B-C). The last unfinished wave is analyzed. Zones show areas with the highest probability of reversal. The arrows indicate the wave marking according to the method used by the author, the solid background is the formed structure, the dotted ones are the expected movements. Attention: The wave algorithm does not take into account the length of time the instrument moves. The material has been provided by InstaForex Company - www.instaforex.com |
| Technical analysis of GBP/USD for 16/08/2019: Posted: 16 Aug 2019 12:51 AM PDT Technical Market Overview: The GBP/USD pair has been trading inside of a narrow range for the whole week, but just recently the bulls have managed to move the price a little bit higher towards the level of 1.2118. This level has been violated and the local high was made at the level of 1.2148. Nevertheless, the price is still trading below the short-term descending trendline, so only if this line is violated the bulls will get the chance to lift the prices toward the next target levels located at 1.2209 and 1.2248. Weekly Pivot Points: WR3 - 1.2303 WR2 - 1.2249 WR1 - 1.2110 Weekly Pivot - 1.2066 WS1 - 1.1921 WS2 - 1.1875 WS3 - 1.1728 Trading Recommendations: The best strategy for current market conditions is to trade with the larger timeframe trend, which is down. All upward moves will be treated as local corrections in the downtrend. Please keep an eye on the key technical support located at the level of 1.1988, some kind of bounce might be expected after this level is hit.
|
| Technical analysis of EUR/USD for 16/08/2019: Posted: 16 Aug 2019 12:44 AM PDT Technical Market Overview: The EUR/USD pair has moved below the 61% Fibonacci retracement that is located at the level of 1.1111 and the new low was made at the level of 1.1086 (at the time of writing). This is the ultimate clue that the bullish flag pattern has been ignored and the bears want to penetrate the lower range levels. The next target for bears is seen at the level of 1.1034. Please notice that this time of the year the volatility might get limited due to the summer season, so it might take a while to make a breakout in this market conditions. The larget timeframe trend remains bearish. Weekly Pivot Points: WR3 - 1.1413 WR2 - 1.1325 WR1 - 1.1264 Weekly Pivot - 1.1187 WS1 - 1.1117 WS2 - 1.1041 WS3 - 1.0978 Trading Recommendations: The best strategy for current market conditions is to trade with the larger timeframe trend, which is down. All upward moves will be treated as local corrections in the downtrend. The downtrend is valid as long as it is completed or the level of 1.1445 clearly violated. There is an Ending Diagonal price pattern visible on the larget timeframes that indicate a possible downtrend termination soon.
|
| EUR / USD: growth of American statistics, "dovish" comments by Ren and fear of dollar bulls Posted: 16 Aug 2019 12:17 AM PDT The euro-dollar pair expectedly sank to the base of the 11th figure and is now testing the boundaries of the 10th level. Macroeconomic data released yesterday provided significant support for the US currency, while the euro again came under pressure from the rhetoric of the European Central Bank. This combination of fundamental factors pulls the pair downward at least to the bottom line of the Bollinger Bands indicator on the daily chart, which now corresponds to the mark of 1.1070. By and large, only the uncertainty about the prospects for US-Chinese trade relations (and Fed's further reaction accordingly) is holding back the EUR/USD bears from an impulse decline to the base of the 10th figure. All other arguments speak in favor of greenback growth. Despite the inversion of the yield curve and the decrease in the yield of 10-year Treasuries to three-year lows (1.540%), the dollar index may soon update this year's maximum if it maintains its growth rate. Now, the indicator is at 98,053, although it was in the region of 95 points at the end of June. The dynamics of US macroeconomic indicators suggest that the Fed is unlikely to resort to aggressive measures to mitigate monetary policy in the fall. While the market already takes into account the 25-point decline in current prices, the probability of this step is estimated at almost 70%. The dollar has regained its attractiveness, especially when paired with the euro, which is waiting for large-scale action by the ECB. However, the revaluation of the US currency is restrained. On the one hand, the greenback received strong support from macroeconomic reports. Thus, the total retail sales in the United States rose to 0.7%. which is the best result since March this year. The indicator jumped to 1.3% (excluding auto sales), and it rose to 0.9% (excluding auto and fuel sales), demonstrating consistent growth for the third month in a row. Even Donald Trump drew attention to the published figures. On his Twitter, he said that the US economy is becoming stronger against the backdrop of a slowdown in other economies, and American consumers are in great shape, as they have "got a lot of cash." Although, it is not only retail sales that supported the dollar yesterday. Minor indicators have also made their respective contributions. In particular, the Empire Manufacturing manufacturing index, which is based on a survey of manufacturers in the New York Federal Reserve Region, showed positive dynamics after a significant decline in previous months. In addition, investors were unexpectedly surprised by the labor cost index. According to experts, the Fed members track this inflation indicator with a "special predilection". Therefore, its dynamics have a significant impact on the dollar. In the first quarter of this year, it collapsed to -1.6%, but in the second quarter it turned out to be much better than expected with 2.4% instead of the forecasted increase to 1.7%. This indicator allows you to assess the growth rate of the level of wages in the United States and it is a good indicator of inflationary pressure in the country. Yesterday's release looks symptomatic, against the background of the latest release of data on the increase in the consumer price index. Yet, the single currency is impressed by an interview with Olli Rehn, an influential American publication of the Wall Street Journal. Ren is the head of the Central Bank of Finland and a member of the Governing Council of the European Central Bank. This is a fairly influential figure in the ECB camp. In particular, he was one of the favorites in the election race for the post of head of the ECB, which was subsequently won by Ms. Lagarde. Hence, Olli Rehn said that the European regulator will resort to comprehensive measures to mitigate monetary policy this fall. The ECB can not only reduce the interest rate by 10 basis points (that is, to -0.5%) but also announce new purchases of bonds worth about 50 billion euros per month as part of a quantitative easing program. In addition, Olli Rehn suggested that the European Central Bank at one of its next meetings could change the rules of its bond purchase program, which prohibits the regulator from acquiring more than 33% of the debt of any individual eurozone government. In other words, the ECB is ready to apply very aggressive measures to mitigate monetary policy. Draghi's actions may even exceed the expectations of most experts. This fact put strong pressure on the euro throughout the market, including paired with the dollar. Nevertheless, despite the very unambiguous fundamental picture, the pair does not go down to the bottom, that is, to the base of the 10th figure and below. EUR/USD bears are being held back by the global trade conflict, the consequences of which could also affect Fed members. In an interview with Donald Trump yesterday, he said that a trade agreement with China should be concluded "only on the terms of Washington." Obviously, representatives of the American side in the negotiating group also take a similar position. In turn, the Chinese express their willingness to further escalate the trade war, but at the same time hope for the effectiveness of the September meeting. In fact, this question is "hanging in the air" and this fact does not allow the pair bears to develop a large-scale downward movement. In general, the pair remains within the downward trend with the first target of 1.1070, where the support level is located. The material has been provided by InstaForex Company - www.instaforex.com |
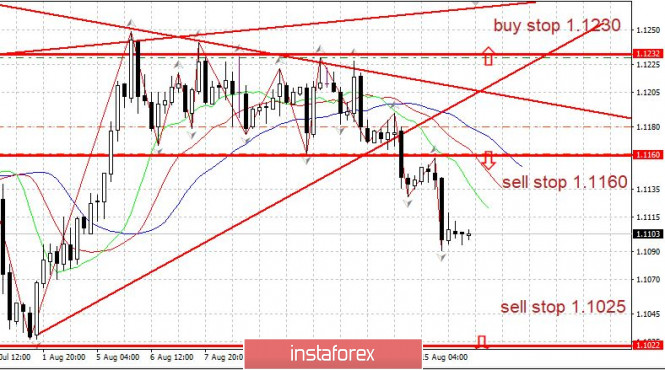
| Trading plan for EURUSD on 08/16/2019 Posted: 15 Aug 2019 11:39 PM PDT
There was no important news. In the eurozone, there is a decline in GDP in Germany for two consecutive quarters. EURUSD: the euro continued to fall, showing lows below 1.1100. We keep sales from 1.1160, stop in a breakeven. Possible sales with kickbacks to the top. The principal is the level of 1.1025 down. The material has been provided by InstaForex Company - www.instaforex.com |


| You are subscribed to email updates from Forex analysis review. To stop receiving these emails, you may unsubscribe now. | Email delivery powered by Google |
| Google, 1600 Amphitheatre Parkway, Mountain View, CA 94043, United States | |
No comments:
Post a Comment