
Forex analysis review |
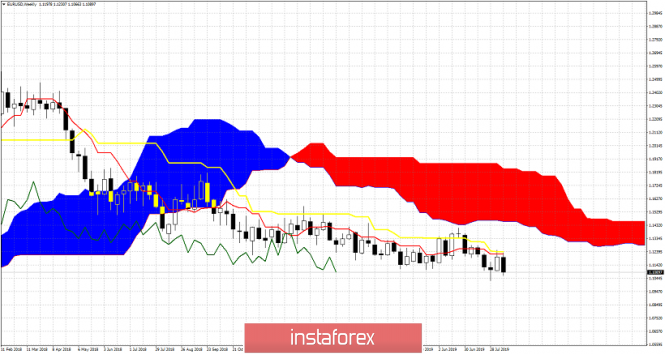
| Weekly Ichimoku cloud indicator analysis of EURUSD Posted: 17 Aug 2019 12:07 AM PDT EURUSD bounced towards 1.12-1.1230 but got rejected. Price has pulled back below 1.11 and bears back in control of the short-term trend. Price got rejected again right at the tenkan- and kijun-sen indicators confirming bearish trend.
|
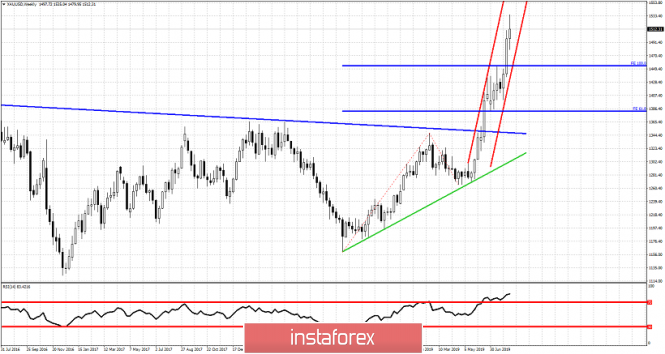
| Posted: 17 Aug 2019 12:01 AM PDT Gold's weekly close has not given any bearish reversal sign. Price closed at a new weekly higher high confirming the bullish trend we are in. There is no bearish divergence on a weekly basis but RSI is at overbought levels.
Green line -major support trend line Gold price has broken past the 100% extension of the first upward move from $1,160 to $1,346. Next target is the 161.8% Fibonacci extension at $1,570. Price is inside a steep upward bullish channel. We only observe bearish divergence signs on 4 hour and daily charts. This is just a warning that bulls need to be cautious. At the end of this week price pulled back from recent highs and closed right above the key short-term support of $1,510. Holding above it is crucial if bulls want to see $1,570. Breaking below this support area of $1,500-$1,510 will lead to a bigger pull back at least towards $1,450-$1,430. The longer-term bullish trend can only be put in danger only if price breaks below $1,350-$1,300. The material has been provided by InstaForex Company - www.instaforex.com |
| You are subscribed to email updates from Forex analysis review. To stop receiving these emails, you may unsubscribe now. | Email delivery powered by Google |
| Google, 1600 Amphitheatre Parkway, Mountain View, CA 94043, United States | |
No comments:
Post a Comment