
Forex analysis review |
- August 9, 2019 : GBP/USD Intraday technical analysis and trade recommendations.
- The euro will face new challenges
- "The Great Combinators": What are Washington and Beijing ready to do to win the trade war?
- BTC 08.09.2019 - Symmetrical trirangle in creation based on 4H time-frame
- Gold 08.09.2019 -Trading range envorminet, potential new wave down
- GBP/USD 08.09.2019 -Down brerakout od the 10-day bracket, more downside yet to come
- EUR/USD to move even higher
- NZD/USD about to rise significantly
- Bitcoin is steadily moving towards the goal of $12000
- August 9, 2019 : EUR/USD is trapped between 1.1235 - 1.1175. A Bearish Breakout is anticipated.
- The dollar broke up with trump cards
- Under attack: oil market suffers from currency wars
- Oil bottoms and ready to move higher
- Analysis for EUR / USD and GBP / USD pairs on August 9. The UK GDP and industrial production show decline
- Technical analysis of USD/CAD for August 09, 2019
- Gold demand remains strong, further gains in prospect
- Simplified wave analysis and forecast for GBP/JPY, AUD/USD and USD/CHF on August 9
- Oil as an indicator of the prospects for the global economy (We expect the consolidation of WTI crude oil and a decrease
- GBP/USD slides after UK GDP contraction, sell on rallies
- Trading recommendations for the GBPUSD currency pair - prospects for further movement
- The dollar has every chance to continue to grow. EUR and GBP are trading in the range, but it is not for long
- USD / CAD: it's hard for a "Canadian" to remain a "black sheep"
- AUD / USD: Predictable abstracts on RBA quarterly report reassured traders
- Trading plan for EURUSD on 08/09/2019
- Forecast for Bitcoin and US dollar on August 9th. The battle for bitcoin in the US Congress
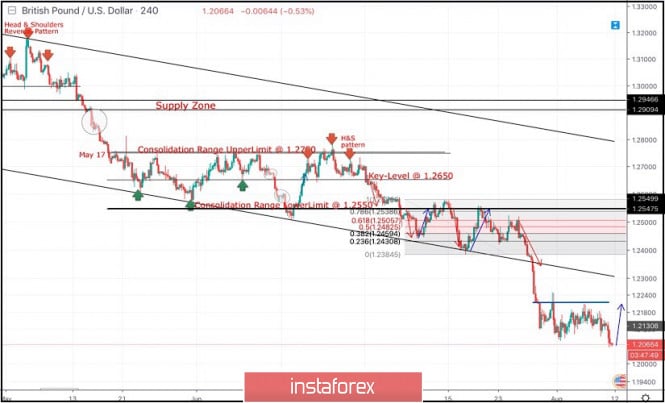
| August 9, 2019 : GBP/USD Intraday technical analysis and trade recommendations. Posted: 09 Aug 2019 10:28 AM PDT
Since May 17, the previous downside movement within the depicted bearish channel came to a pause allowing the recent sideway consolidation range to be established between 1.2750 - 1.2550. On July 5, a bearish range breakout was demonstrated below 1.2550 (the lower limit of the depicted consolidation range). Hence, quick bearish decline was demonstrated towards the price zone of 1.2430-1.2385 (where the lower limit of the movement channel came to meet the GBPUSD pair). On July 18, a recent bullish movement was initiated towards the backside of the broken consolidation range (1.2550) where another valid SELL entry was offered few weeks ago. Moreover, Bearish breakdown below 1.2350 facilitated further bearish decline towards 1.2320, 1.2270 and 1.2125 which correspond to significant key-levels on the Weekly chart. The current price levels are quite risky/low for having new SELL entries. That's why, Previous SELLERS were advised to have their profits gathered. Recently, temporary weak signs of bullish recovery were demonstrated around 1.2100. This was supposed to push the GBP/USD to retrace towards 1.2260 then 1.2320 if sufficient bullish momentum was demonstrated above 1.2230. However, Today, recent bearish decline is being demonstrated below 1.2090. Further bearish decline may be demonstrated towards 1.2000 (Prominent Weekly Bottom) where further price action should be assessed. Trade Recommendations: Intraday traders were advised to look for early bullish breakout above 1.2230 for a counter-trend BUY entry. Conservative traders should wait for bullish pullback to pursue towards 1.2320 - 1.2350 for new valid SELL entries. S/L should be placed above 1.2430. Initial T/P level to be placed around 1.2279 and 1.2130. The material has been provided by InstaForex Company - www.instaforex.com |
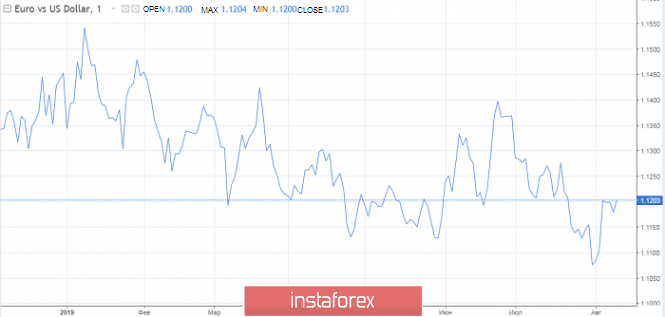
| The euro will face new challenges Posted: 09 Aug 2019 09:02 AM PDT Financial markets are gradually recovering after a busy week. New militant statements from the Bank of China and Donald Trump is not received. Well, the attacks of the owner of the White House on the excessively "hawkish" policy of the Fed are perceived by traders as an increase in the likelihood of a rate cut in September. Investors for the most part digest the information received and study the opinions of experts on the recession in the United States Wall Street Journal respondents increased the chances of monetary policy easing at the next FOMC meeting to 63.9% from 49.8%. The risks of a recession in the US economy over the next 12 months are estimated at 33.6% against 30.1% in the last survey and 18.3% a year ago. It is worth noting that the recent figure is the highest since 2011. In Bloomberg, the probability of a recession on the 12-month horizon is raised to 35% from 31%, and Reuters estimates the chances of a recession over two years at 45%. The US economy at the end of this year will grow by 2.3%, according to Bloomberg respondents. Previously, it was about an increase of 2.5%. In the third quarter, GDP growth will slow to 1.8% from 2.1%. The world economy, according to the news agency, will expand this year by 3.2%, rather than 3.3%, as previously expected. So, everything is clear with America. As for the eurozone, if the region's economy were not as weak as it is now, the euro would have attacked long ago. But there is no question of this, because the health of German exports and industrial production, undermined by trade wars, spoils everything. The German economy clings to the service sector with all its might, but the leading indicators are inexorable – they begin to warn of a recession. We need a fiscal stimulus, as the expansion of the monetary system will further complicate the difficult fate of the banking system.Reducing the ECB rate to -0.5% will increase the costs of banks associated with the service of negative rates by 60%, Bloomberg estimated. Information leaked to the network that Germany is seriously discussing the possibility of a stimulating budget policy has pushed the yields of German government securities up. If official Berlin really decides to do this, then the euro will have some anchor of salvation, able to help the "bulls" on EUR/USD to finally go beyond the range of consolidation of $1.1175–1.1245. Moment of truth for Italy On Friday, the euro won back most of the losses recorded on Thursday, caused by the new political crisis in Italy. The leader of the "League" Matteo Salvini announced the collapse of the ruling coalition in the country and called for new elections to strengthen his power. The most striking reaction to the news was in the stock and bond markets, where there was a large-scale sale of Italian assets. Salvini complained about the absence of a majority in Parliament and pointed to the need to "get rid of uncertainty." Italian Prime Minister Giuseppe Conte is going to announce a vote of no confidence. Time is short According to sociologists, 62% of Italians would like to see Salvini as Prime Minister. Early elections are expected to take place in October, and negotiations may then be needed to form a new coalition, possibly with the brothers of Italy, another far-right party. Despite Salvini's popularity among voters, he may need a partner. The right-wing government is likely to be more organic than the "hodgepodge" of the 5-Star Movement, which has ruled Italy for just over a year. The new authorities will take a tough stance on immigration, and the conflict with the EU, apparently, cannot be avoided. At the same time, the costs of infrastructure projects blocked by the representatives of the "Five stars" can be expanded. Meanwhile, numerous contradictions that have undermined the coalition will reappear on the surface. The "League" is split into eurosceptics who advocate Italy's exit from the eurozone, and a more pragmatic faction that supports tax cuts and compromises with allies. Undoubtedly, Salvini managed to keep these two camps together, but only because he did not have to take full responsibility for what the current government is doing. Now, this time is running out. If a new general election is held and Salvini wins, the League will have to demonstrate its true position after several years of generous promises. For Italy, the moment of truth is coming. The material has been provided by InstaForex Company - www.instaforex.com |
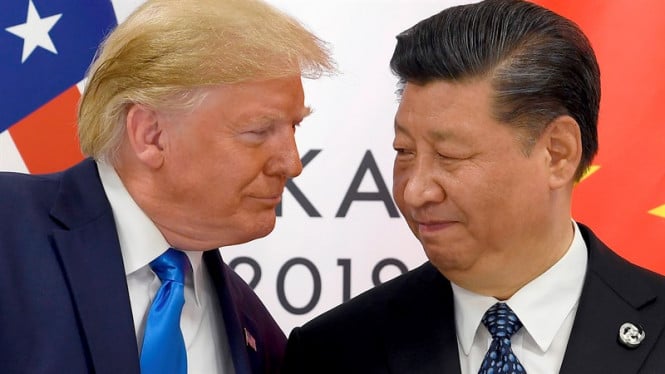
| "The Great Combinators": What are Washington and Beijing ready to do to win the trade war? Posted: 09 Aug 2019 07:48 AM PDT
Two cars are moving towards each other on a country road, they are led by Donald Trump and Xi Jinping. Both drivers are aware of the risks, but neither wants to lose face, and each relies on the strength of the national economy. Experts continue to wonder how far the parties can go in order to turn the trade confrontation in their favor. The Chinese gambit "Many investors assume that the Celestial Empire is ready to accept the slowdown of its economy and the world to prevent the election of D. Trump for a second term," said Naka Matsuzawa, chief strategist of Nomura. "China can further reduce the import of agricultural goods from America in an attempt to undermine the position of D. Trump before the presidential elections to be held in November 2020," said UBS investment Director Mark Haefele. The US budget is already losing a lot of money because of compensation payments to farmers, who are almost the most affected by the trade war in the country. "Perhaps the Celestial Empire will decide to wait for the change of power in Washington. If necessary, China can respond with targeted measures to put D. Trump's election positions at risk, even if the global economy and financial markets are under attack," David Bianco of the DWS Group said. "However, Beijing's strategy may come out sideways to him. Aggressive measures against China will be supported by both parties in the US Congress, and the next US president may take a similar position," N. Matsuzawa warns. In addition, further deterioration of the Chinese economy can destabilize the country, which has already faced protests in Hong Kong. In the second quarter, China's GDP showed minimal growth over the past 27 years. According to the National Bureau of Statistics of China, in July, producer prices fell by 0.3% in annual terms against the expected -0.1%. This was the first decline in the last three years. "The dynamics of this index has a high correlation with corporate profits and signals a drop in demand for commodity assets due to the ongoing trade war between the US and China. All this is an extremely "bearish" factor for the Chinese stock market, while the possibilities of the People's Bank of China to stimulate the economy are extremely limited," said Kungwa Kim, an analyst at Bloomberg. Recall that the decline in producer prices in 2016 caused a drop in the yield of Chinese government bonds, and after that there was a collapse of stock indices. Then experts started talking about the "hard landing" of the Chinese economy. The situation may repeat itself. And this can happen much earlier than the next presidential election in the United States, which is waiting for the Celestial Empire, with high hopes for the defeat of D. Trump. "Economic problems and the likely decline in the Chinese stock market may force the country's authorities to make serious concessions and conclude a trade deal with the US," Julian Evans-Pritchard from Capital Economics said. Trump bets on surprise The American leader really wants to conclude a trade agreement with Xi Jinping, but his strategy is to force the enemy to guess. Therefore, he chose the right moment to announce something unexpected: plans to introduce 10% duties on imports of Chinese goods to the United States in the amount of $300 billion. It should be recognized that the American side has enough ambitions in the current confrontation: a world without duties, and a fair "playing field" with China, and sustainable economic growth due to the opening of new markets, and the cessation of intellectual property theft. "The President has repeatedly said that his ultimate goal within the framework of the world trade system is zero tariffs, absence of trade barriers and subsidies. He's rebuilding the American economy. This process is not easy and complicated due to trade imbalances. Therefore, we strive for fair, free and mutual trade with China," said Larry Kudlow, chief economic adviser to the White House. Meanwhile, D. Trump continues to make attacks towards China, but does not give a clear idea of what will be the result after the potential conclusion of a trade deal with Beijing. He often talks about the growth rate of the US economy exceeding 3%, but so far Washington's trade tariffs are acting on US GDP in the opposite direction. Yes, duties are beating on China, and theoretically, the United States is able to change the supply chain and push China to the periphery of world commerce. However, this does not guarantee free trade, which could bring the American economy to a new level. "It is likely that the parties will be able to reach a reasonable compromise in the longer term, but investors will have a hard time on the way to it. Moreover, the risk that the situation could spiral out of control, has increased significantly", the DWS noted. A trade war could escalate into a currency According to some analysts, having involved the yuan in the trade war, Beijing is at great risk, as the devaluation of the national currency will lead to capital flight from the country. However, allowing the yuan to weaken, China hits D. Trump in a "sore spot", who has repeatedly expressed dissatisfaction with too strong greenback. Further weakness of the yuan may increase the risks of foreign exchange intervention on the part of Washington, aimed at reducing the USD rate. However, according to UBS experts, these measures can have the opposite effect and support the dollar. "In order for the intervention against greenback to work, the growth of the US economy and the advantage of high interest rates should not be so obvious. At the same time, the growth prospects of the Chinese and European economies should improve, which raises certain doubts," the Bank's strategists said. "A more likely outcome of the currency war is a further increase in uncertainty, which, ironically, could be positive for the dollar if investors are afraid of a slowdown in the world economy, and volatility will increase," they added. In addition, interventions are rarely successful if they are made by the US Treasury without the approval of the Fed. The US Central Bank may limit the impact of this step on the markets. "Even if D. Trump orders the Treasury to take part in the currency intervention in an attempt to weaken the dollar, the unilateral nature of such actions is unlikely to be anything more than a temporary influence," representatives of the National Australia Bank noted. The yen is the main beneficiary of the escalation of the trade war "The economic situation in the Land of the Rising Sun is far from ideal, but in the case of a market shock caused, for example, by geopolitics, the yen will be the best refuge," Rabobank economists believe. "In recent years, the growth of the global economy has reduced the demand for safe haven currencies. For most of this year, expectations about easing monetary policy by global central banks balanced the flow of bad news related to trade conflicts and global economic problems. Thus, regulators stimulated demand for "risk" and suppressed the volatility of the foreign exchange market. However, Washington's determination to continue to put pressure on Beijing leaves little chance of an early conclusion of a trade agreement between them. Disagreements over intellectual property rights, the forced transfer of technology and subsidies to Chinese companies may be insurmountable," they said. "According to our estimates, in the next couple of years, the escalation of the trade war will annually deduct 0.6% of the world GDP. This will increase the demand for protective assets. In this regard, we decided to lower the 12-month forecast for the USD/JPY pair from 108 to 104," Rabobank said. The material has been provided by InstaForex Company - www.instaforex.com |
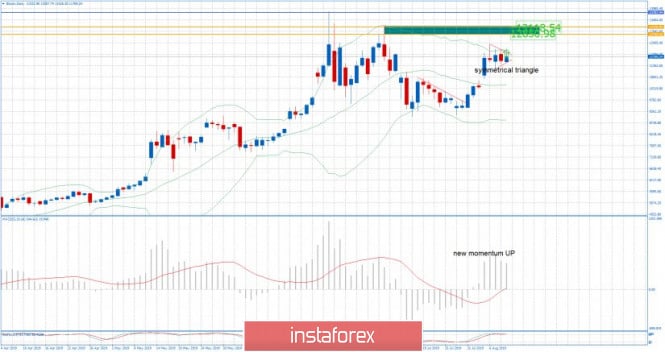
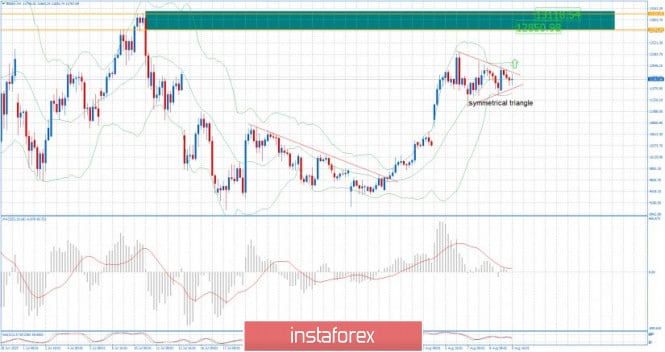
| BTC 08.09.2019 - Symmetrical trirangle in creation based on 4H time-frame Posted: 09 Aug 2019 07:48 AM PDT Industry news: The potential for a "no-deal" scenario as the UK leaves the European Union in October of this year could drive bitcoin to new highs, some industry players estimate. As many have already experienced first-hand, the British pound has lost a fair amount of value against both the euro and the U.S. dollar as fears build up that a no-deal Brexit may in fact happen. And as the bitcoin-as-a-safe-haven theory goes, the digital asset should become more attractive for investors as the value of their national fiat currencies go down. Daily view:
Based on the daily time-frame, I found that BTC is trading in the 4-day balance between the $11.180 and $12.370. MACD oscillator is still showing the upside momentum and you should watch for eventual breakout upside to confirm further upward continuation. Important levels to watch based on daily view: Resistance levels: $12.800 $13.000 Support levels: $11.000 $10.800 4H time-frame view:
Based on the 4H time-frame, I found well defined symmetrical triangle, which is mostly continuation pattern. The potential up breakout may lead the BTC into the $12.850 zone. Trading recommendation: Watch for buying opportunities in case of the upward break with the target at $12.840 The material has been provided by InstaForex Company - www.instaforex.com |
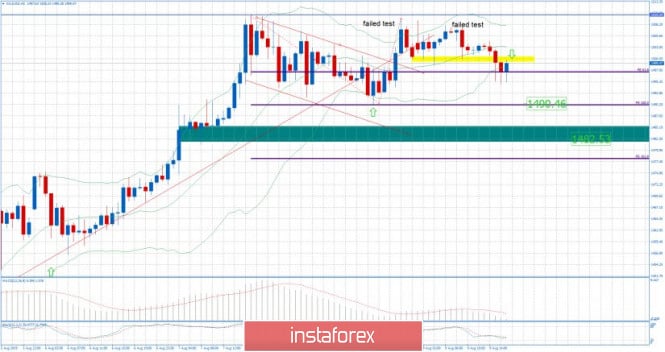
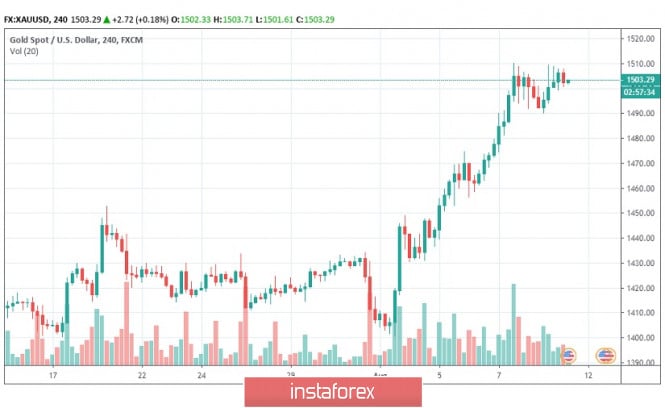
| Gold 08.09.2019 -Trading range envorminet, potential new wave down Posted: 09 Aug 2019 07:25 AM PDT Gold has been downwards and the price tested the level of $1.495. Gold got a failed test of the resistance at $1.510 in the background, which is sign that buyers lost power and potentially became overbought. There is a chance that Gold my try to trade towards support $1.490.
Yellow rectangle – Intraday resistance ($1.500) Purple horizontal line – Important swing low ($1.490) Gold has failed to break the important swing high at $1.510 in the background, which is sign for potential downward movement. I see potential intraday selling opportunity at $1.500 with targets at $1.490-$1.482. MACD oscillator is showing low momentum, which represents the balanced regime. As long as the Gold is trading below that $1.505, watch for selling on the rallies. The material has been provided by InstaForex Company - www.instaforex.com |
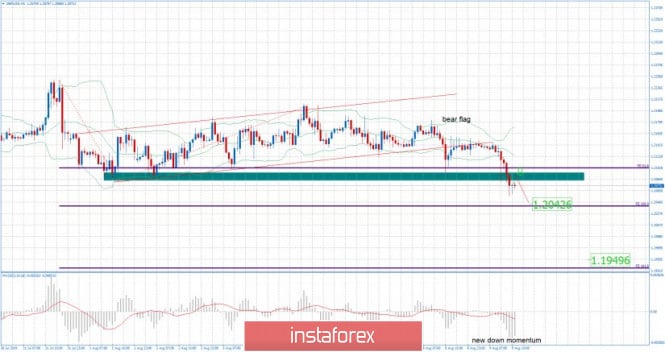
| GBP/USD 08.09.2019 -Down brerakout od the 10-day bracket, more downside yet to come Posted: 09 Aug 2019 06:57 AM PDT GBPUSD has been trading at the price of 1.2073. GBPUSD has broken below 1.2082 and on that way confirmed the down breakout of the 10-day balance. Selling opportunities are preferable on the rallies.
Green rectangle – Major resistance (1.2080) Purple horizontal lines: Fibonacci supports and targets (1.2042 and 1.1950) GBPUSD has broken the balance from August first after today's GDP announcement and there is good potential for more downside. GBPUSD gave us a sell signal after breaking below 1.2080 and for targets we can set at 1.2042 and 1.1950. MACD oscillator is showing the new momentum on the down break, which is confirming our downward bias. There are no signs of any reversal after the breakout and you should watch for selling opportunities on the rallies. The material has been provided by InstaForex Company - www.instaforex.com |
| Posted: 09 Aug 2019 06:57 AM PDT
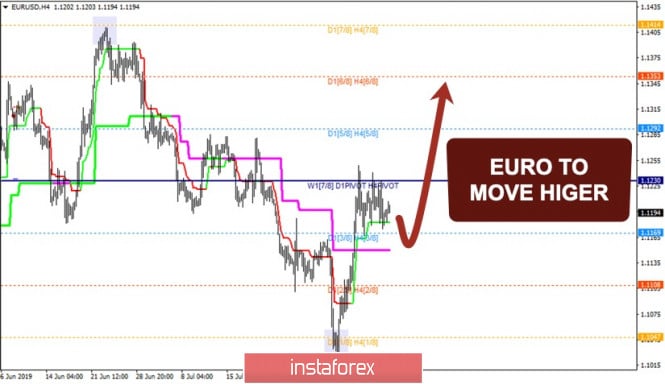
A pullback from 1/8 Murrey Math Level led to a significant bullish rally in EUR/USD. However, 4/8 MM Level has acted as resistance, that's why the market is consolidating above 3/8 MM Level. Also, the Super Trend Lines has formed a 'Bullish Cross', which brings more evidence for this scenario. It's possible that the pair is going to test the Daily ST-Line, which could act as support. If this happens, there'll be an open door for another upward price movement in the direction of 6/8 MM Level. It's essential that the market should fixate above 4/8 MM Level to confirm the bullish outlook. However, if the price breaks the Daily ST-Line, we should watch 2/8 MM Level as a potential target for the ongoing correction. Additionally, we should monitor 5/8 MM Level, which could be a departure point for a local downward correction. In this case, all eyes will be at 4/8 MM Level again which this time could act as support and stop bears. The bottom line is that EUR/USD might have bottomed, so the current consolidating is likely to be just a local break before we see the market higher. The main intraday target is 6/8 MM Level (1.1353). If the price goes through this line, 7/8 MM Level will become the next goal for bulls. The material has been provided by InstaForex Company - www.instaforex.com |
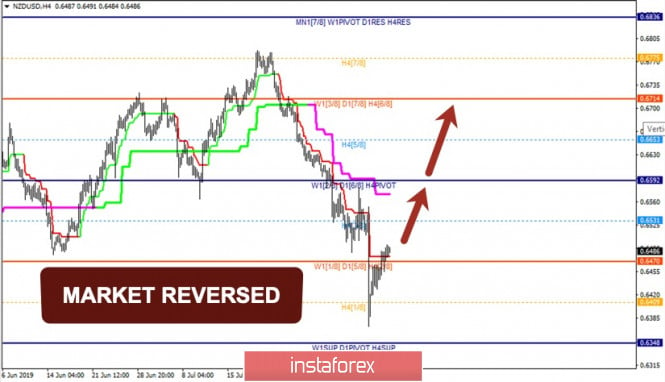
| NZD/USD about to rise significantly Posted: 09 Aug 2019 06:54 AM PDT
There's a pullback from the 1/8 Murrey Math Level which brings more evidence that a trend reversal has taken place. Moreover, the price has fixed above the 2/8 MM Level and four-hour Super Trend Line which confirms the bullish outlook. Thus, the market is likely to test the 4/8 MM Level and Daily Super Trend Line. These levels could stop bulls. So, if a pullback from them happens, the price will make a downward correction, possibly towards 3/8 MM Level, which could be a starting point for another advance. However, if 4/8 MM Level turns out to be broken, there'll be an open door for a rally in the direction of 6/8 MM Level, which has acted as resistance a few times before. The subsequent pullback from this level could lead to a substantial downward correction towards 4/8 MM Level. Additionally, if the Super Trens Lines forms a 'Bullish Cross' little later on, it will prove that the pair hsifted a trend to the upside. The bottom line is that NZD/USD is getting bullish because of a pullback from 1/8 Murrey Math Level. In this case, the price is likely to achieve 4/8 or even 6/8 MM Levels. The markets fixation above 3/8 MM Level will confirm this scenario. The material has been provided by InstaForex Company - www.instaforex.com |
| Bitcoin is steadily moving towards the goal of $12000 Posted: 09 Aug 2019 06:48 AM PDT
According to some experts, Bitcoin can demonstrate explosive growth soon. However, many of them do not agree with this forecast, believing that the No. 1 cryptocurrency is expected to be corrected and further reduced. On Friday, August 9, the leading virtual currencies are getting cheaper, except for bitcoin, which shows a symbolic growth. The BTC price is consolidating in anticipation of the momentum for further movement. According to experts, the bitcoin exchange rate increased by 0.24% to $11898 per day. Analysts believe that the breakdown of the resistance level of $12800 will allow the No. 1 cryptocurrency to reach $13750. In the case of consolidation below the level of $11870, experts allow a drop to the level of $11100. According to Dan McArdle, co-founder of the analytical company Messari, bitcoin can repeat the previous explosive growth. The expert draws an analogy with gold in 2008, when the quotes of precious metals soared to peak values in a short time. In the short term, bitcoin may fall, but then there will be a breakthrough to a new historical maximum, D. McArdle is sure. According to Mike McGlone, a strategy analyst at Bloomberg, the BTC has now entered a phase of long-term consolidation and may not grow even in 2020. However, in the long term, the digital asset will benefit from lower government bond yields and increased volatility in the global stock market, says McGlone. The analyst believes bitcoin is the best option for hedging risks. Many experts believe that the No. 1 cryptocurrency has already gained the status of the most secure asset. Bitcoin has added to the list of "safe-haven" assets, which are gold, US bonds, and the Swiss franc. According to Chris Reinertsen, marketing director of Rhythm Technologies, many investors will invest in the BTC to protect their savings soon. According to experts, bitcoin continues to struggle to reach an intermediate peak level of $12,000. Experts believe that the conquest of this peak will open the way for the asset to the mark of $13,000 and more. According to Bloomberg, over the past three months, there has been an increase in the correlation between bitcoin and gold. Bitcoin was again under the scrutiny of market participants and experts who consider it a digital analog of gold, an asset of the "safe-haven", despite the complete contrast to the yellow metal in the context of price stability. However, not all experts adhere to positive forecasts regarding the No.1 cryptocurrency. According to the calculations of financial strategists, the market of digital currencies will continue to decline soon, as there is a correction after rapid growth. Experts' forecasts provide for a drop in the price of bitcoin to $11500, Ethereum will drop to $210, a reduction in the price of Ripple (XRP) to $0.29, and Litecoin to $85. The material has been provided by InstaForex Company - www.instaforex.com |
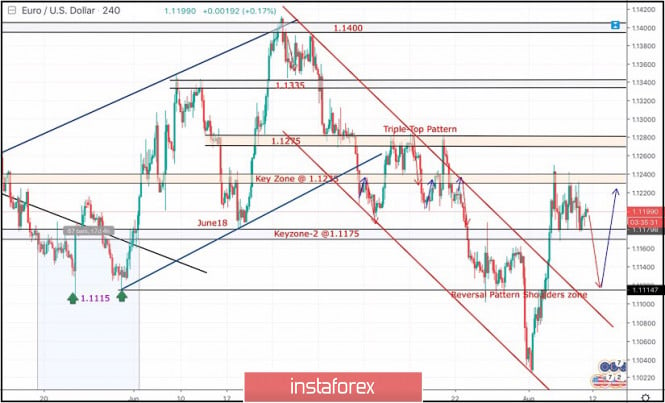
| August 9, 2019 : EUR/USD is trapped between 1.1235 - 1.1175. A Bearish Breakout is anticipated. Posted: 09 Aug 2019 06:35 AM PDT
Back in June 24, the EURUSD looked overbought around 1.1400 facing a confluence of supply levels. Thus, a bearish movement was initiated towards 1.1275 followed by a deeper bearish decline towards 1.1235 (the lower limit of the previous bullish channel) which failed to provide enough bullish support for the EUR/USD pair. In the period between 8 - 22 July, sideway consolidation-range was established between 1.1200 - 1.1275 until a triple-top reversal pattern was demonstrated around the upper limit. Shortly after, evident bearish momentum (bearish engulfing H4 candlestick) could bring the EURUSD back below 1.1235. Early bearish breakdown below 1.1175 facilitated further bearish decline towards 1.1115 (Previous Weekly Low) where temporary bullish rejection was demonstrated before bearish breakdown could take place on July 31. On July 31, Temporary Bearish breakdown below 1.1115 allowed further bearish decline towards 1.1025 (lower limit of the depicted recent bearish channel) where significant signs of bullish recovery were demonstrated. Risky traders were advised to look for bullish persistence above 1.1050 as a bullish signal for Intraday BUY entry with bullish target projected towards 1.1115, 1.1175 and 1.1235. It's already running in profits. S/L should be advanced to 1.1160 to secure more profits. This Week, the depicted Key-Zone around 1.1235 has been standing as a prominent Supply Area where TWO Bearish Engulfing H4 candlesticks were demonstrated. Yesterday , another bullish visit was demonstrated towards 1.1235 where bearish rejection was anticipated. Thus, the EUR/USD remains trapped between 1.1235-1.1175 until breakout occurs in either directions (probably to the downside). Bearish breakdown below 1.1175 is mandatory to allow further bearish decline towards 1.1125-1.1115 where another intermediate-term bullish position can be offered (The right shoulder of the expected reversal pattern). Trade recommendations : Conservative traders should wait for a deeper bearish movement towards 1.1125-1.1115 for a valid BUY entry. S/L should be placed just below 1.1080 while initial T/P levels should be located around 1.1160 and 1.1200. The material has been provided by InstaForex Company - www.instaforex.com |
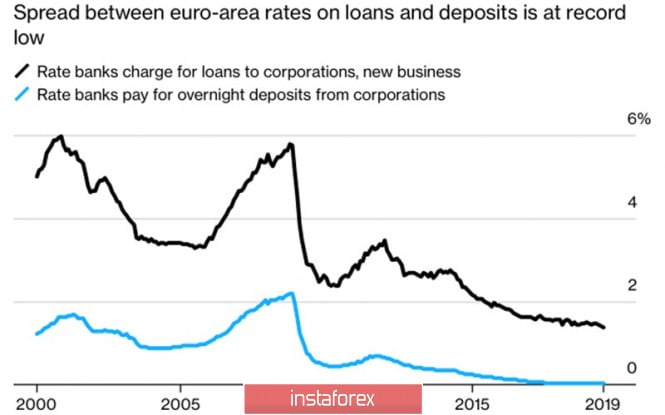
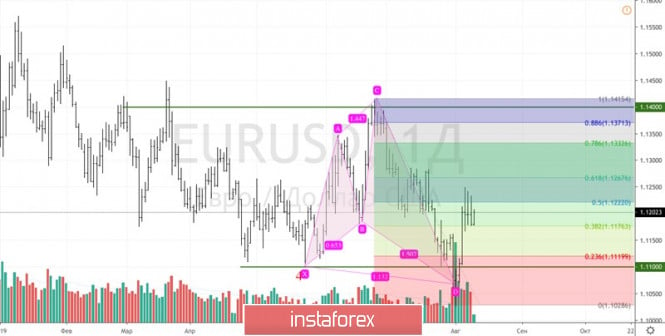
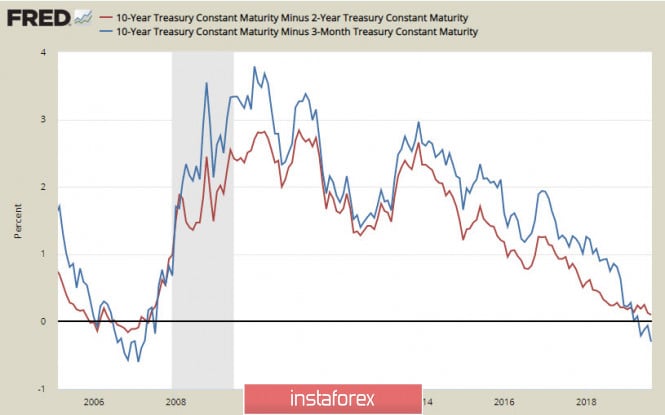
| The dollar broke up with trump cards Posted: 09 Aug 2019 05:33 AM PDT The next round of the trade war between the United States and China led to an increase in the EUR/USD quotes. It would seem that the escalation of the conflict on the model of last year negatively affects the single European currency. It would seem that the escalation of the conflict on the model of last year should negatively affect the single European currency. Indeed, the weakness of external demand, primarily Asian, puts the wheel in the wheel of German exports and threatens to plunge the leading eurozone economy into recession. In fact, the American economy practically did not respond to trade wars due to a large-scale fiscal stimulus, then in 2019, the situation changed. The Fed considers international risks as the main factor in making adjustments to monetary policy. Under their influence, the US economy is likely to slow down from almost 3% last year to 2-2.3% this year. Moreover, the most serious inversion of the yield curve since 2007 signals an approaching recession. Experts at the Wall Street Journal and Bloomberg estimate her chances over the next 12 months at 33-35%. If after the words of Jerome Powell at a press conference saying that the US dollar has grown. This is after the results of the July FOMC meeting, where a reduction of the rate by 25 bp is not the beginning of the monetary expansion cycle. Then, the Fed Chairman's clarification that the rate can be reduced more than once and was knocked down. Indeed, if the easing of monetary policy is of a preventive nature, as in the 90s of the last century, then we can expect a decrease in borrowing costs by another 50-75 bp. Thus, the US economy and the dollar are sensitive to trade wars. At the same time, the growth of USD/CNY is higher than the psychologically important mark of 7 and the related charge of currency manipulation in the States of China threw EUR/USD quotes upward. Many considered the devaluation of the renminbi to be Beijing's response to Washington's new duties but in reality, it was just a demonstration of weapons. An important driver for the growth of the main currency pair is the potential for monetary expansion. If the Fed has room to maneuver, the ECB rates are already negative, and restrictions on the purchase of assets do not allow talking about the high efficiency of QE. The differential of rates on the issued and attracted resources of commercial banks has fallen to historically low levels, and if the European regulator loosens its monetary policy, even more, you will not envy the banks of the Old World. The dynamics of interest rate differentials by European banks resources In my opinion, the US dollar is still afloat thanks to strong statistics in the United States. But if the indicators are weak, the correction of the USD index will gain momentum. In this regard, the release of US retail data for July deservedly attracts the attention of investors. However, there is the publication of statistics on German GDP. Bloomberg experts predict that the leading eurozone economy in April-June will go minus quarterly. Technically, there is a correction to the CD wave to levels of 38.2%, 50% and 61.8% as part of the transformation of the Shark pattern to 5-0. The rebound from the above resistances makes sense to use for sales. On the contrary, a breakthrough of the EUR/USD pair above 78.6% and 88.6% will be a signal for the formation of long positions. EUR / USD daily chart |
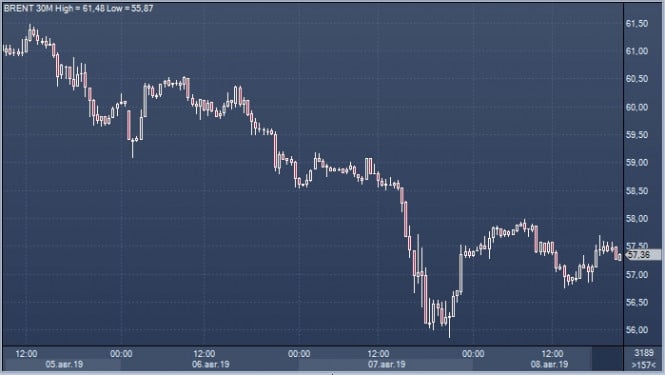
| Under attack: oil market suffers from currency wars Posted: 09 Aug 2019 04:14 AM PDT According to analysts, current currency conflicts hit the black gold market hard. Tensions escalated after raising fears of an economic downturn amid an explosive collapse in interest rates for global central banks. Recall that on Wednesday, August 7, the central banks of India, New Zealand and Thailand lowered interest rates, trying to protect their economies and exports from the effects of the US and Chinese trade war. According to experts, the reduction in rates is a sign of a serious threat to the global economy, which began with friction between Washington and Beijing. The catalyst for the rate reduction process was the statement by US President Donald Trump about the upcoming increase in tariffs for a number of Chinese goods. In response, the PRC authorities weakened the national currency, trying to compensate for the impact of duties. On Monday, August 5, the yuan fell below 7 for one US dollar. This is the lowest level for the Chinese currency recorded after the global financial crisis of 2008, experts emphasized. The beginning of the current month was not very positive for the black gold market either. In the first week of August, oil fell by more than 13% and from the peak values of April this year, it fell by 20% that shows a "bearish" trend. A weak effect on the raw materials market is also exerted by weak oil demand amid supply growth. Note that report by the Energy Information Administration (EIA) on Wednesday says that the unexpected increase in oil reserves that led to a sharper fall in oil prices, which have already begun to rise. Experts emphasize the relationship between the dynamics of the foreign exchange market and oil demand. As a result of the strengthening of the US dollar, black gold rises in price. This directly affects the pricing for consumers, experts say. A widespread decline in interest rates by a number of central banks brought oil quotes down by 5%. Analysts also recorded a drop in demand amid worsening global economic conditions. However, on Thursday evening, August 8, the situation unfolded in a positive direction. There is a ray of hope for oil quotes as they began to rise after the announcement of Saudi Arabia to reduce the export of black gold. Analysts believe that this was an attempt to stop the bearish market, which turned out to be successful. During the trading session Thursday, futures for Brent benchmark oil rose 2% to $57.35 per barrel. The cost of the light WTI grade increased by 2.27% to $ 52.26 per barrel. The measures taken by Saudi Arabia helped stabilized the market. However, experts find it difficult to answer how long this effect will last. Experts recall that the threat of a currency war created concerns about a further decline in the global economy, which negatively affected the demand for oil. Nevertheless, a number of economists and market participants do not lose hope for a positive solution to current issues. According to Vitol's leading oil trader, Russell Hardy, oil demand will increase in 2020 with growth rates of around 800 thousand barrels per day. |
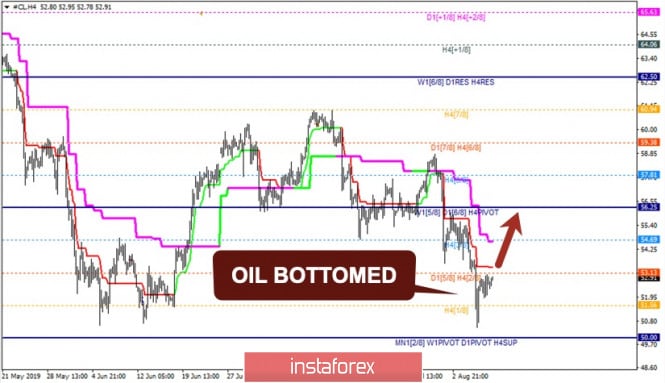
| Oil bottoms and ready to move higher Posted: 09 Aug 2019 03:39 AM PDT
The 1/8 Murrey Math Level has acted as support, that's why oil prices are likely to have reached the bottom. Previously, 1/8 MM Level stopped bears a few times, which pushed the market significantly higher. Another pullback from 1/8 MM Level could be a departure point for a bullish rally. However, the market remains under the Super Trend Lines, so we should wait for a breakout of the four-hour ST-Line as confirmation of this scenario. Additionally, it's also possible that the price could test 1/8 MM Level one more time. The subsequent pullback from this level will bring more evidence for the bullish outlook. If the market breaks and holds firmly above the four-hour ST-Line and 2/8 MM Level, we should watch 4/8 MM Level as a potential intraday target. If the price goes through this level, all eyes will be at 6/8 MM Level as the next target. At the same time, we should monitor the Daily ST-Line, which could act as resistance. If this happens, there'll be a moment to have a local downward correction, possible in the direction of 2/8 MM Level. Besides, 4/8 MM Level could be a strong barrier for bulls, and a pullback from this level could lead to another massive sell-off. The bottom line is that there's a bullish opportunity on oil. The main target is 4/8 MM Level, but if the market breaks this line, we could see the price even higher. Nevertheless, we should wait for the oil's fixation above the four-hour Super Trend Lines just to be sure that bulls are coming into the market. The material has been provided by InstaForex Company - www.instaforex.com |
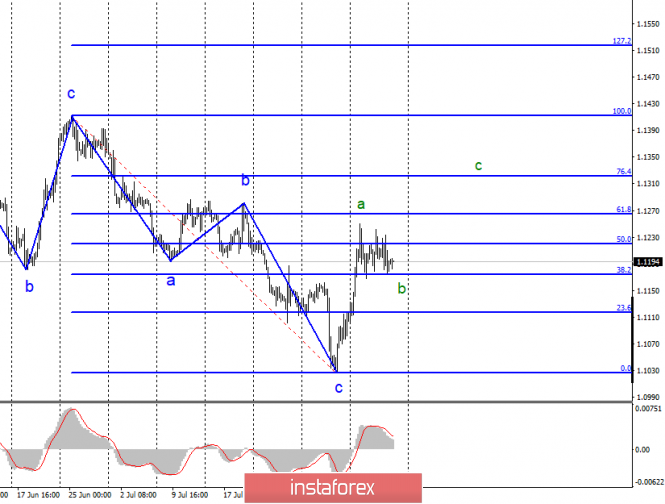
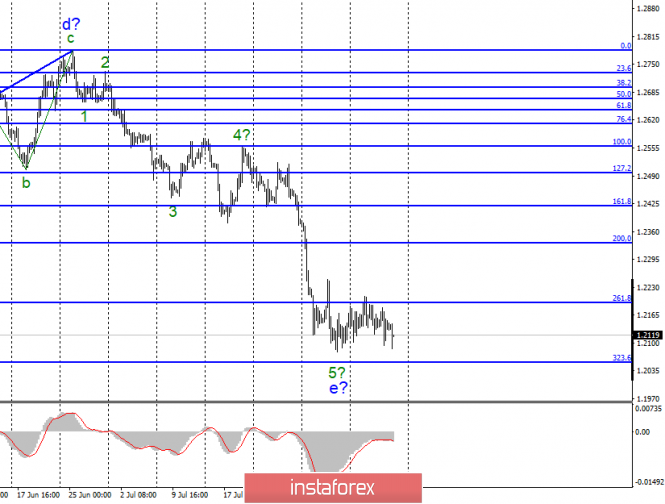
| Posted: 09 Aug 2019 03:29 AM PDT EUR / USD pair On Thursday, August 8, the EUR/USD pair ended with a decrease of 20 basis points. Thus, the current wave marking, as well as the amplitude of the euro-dollar pair in recent days suggests that the instrument is in the process of constructing the estimated wave b of the upward trend section, which originates on August 1. If this is true, then the growth of the Euro currency will resume within the framework of the wave with goals located between 13 and 14 figures. At the same time, the pair will definitely need a news background to further increase. To do this, markets must receive positive news or economic reports from the eurozone or negative from America. But on Friday, August 9, no reports are planned, respectively. The week can end calmly without sharp and strong movements in the foreign exchange market. I believe that the chances of the euro rising to 13 and 14 figures are quite large since if you look at the chart for the last 8 months. It becomes clear that the pair are building mainly "triples" and diagonal "fives". In the literal sense of the word, there were no trends for this period. Now, therefore, it is time to build the "triple" up. Purchase targets: 1.1264 - 61.8% Fibonacci 1.1322 - 76.4% Fibonacci Sales targets: 1.1027 - 0.0% Fibonacci General conclusions and trading recommendations: The euro/dollar pair has moved to the construction of an upward trend section. Thus, I recommend buying a pair with targets near the 1.1264 and 1.1322 marks, which is equal to 61.8% and 76.4% Fibonacci. For each upward signal of MACD, calculated on the construction of an upward wave after completion b. GBP / USD pair Yesterday, the GBP/USD pair fell by another 15 basis points and more and more is approaching the resumption of building a bearish trend section, which takes on a very complicated look. However, I have repeatedly said that the news background for the pound remains such that it is very difficult for the Forex currency market to consider purchases. Today came out economic reports on GDP in the UK. On a monthly basis, GDP growth in June amounted to 0.0%. According to preliminary estimates, the quarterly decline was 0.2%, while the annual growth was 1.2% against market expectations of + 1.4% and the previous value of + 1.8%. Industrial production in June fell by 0.1% mom, and this is better than market forecasts (!!!), year-on-year losses amounted to 0.6%. Thus, there are no questions why traders again sell the pound at Friday's auction and can continue to do so for a very long time despite the widespread belief that the pound is oversold. A successful attempt to break through the 323.6% Fibonacci level will indicate the market's readiness to continue building the downward trend section. Sales targets: 1.2056 - 323.6% Fibonacci 1.1830 - 423.6% Fibonacci Purchase targets: 1.2783 - 0.0% Fibonacci General conclusions and trading recommendations: The wave pattern of the pound/dollar instrument suggests the completion of the construction of the downward section. However, until the successful attempt to break through the 261.8% Fibonacci level, the bears hope that the e-wave will become more complicated. Thus, I recommend selling the pair with downward MACD signals located near the calculated mark of 1.2056 and below. Only a successful attempt to break through the level of 1.2192 will suggest a willingness to build a correctional set of waves. The material has been provided by InstaForex Company - www.instaforex.com |
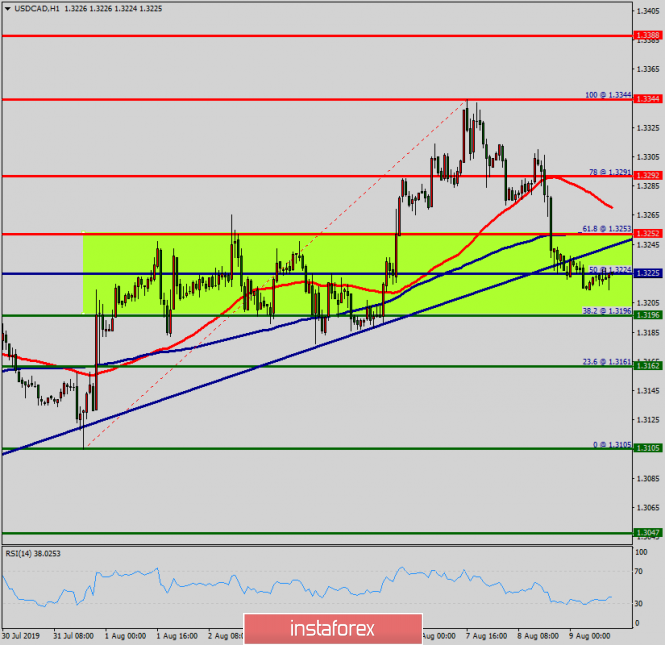
| Technical analysis of USD/CAD for August 09, 2019 Posted: 09 Aug 2019 03:25 AM PDT Overview: The USDCAD pair is trading at the spot of 1.3196 and 1.3252. Right now, the pair has already been corrected by 50.0% and may yet continue trading towards 61.8% or 38.2% Fibonacci retracement levels at 1.3252 or 1.3196. The USD/CAD pair was argumentative as it was trading in a narrow sideways channel, the market showed signs of instability. Resistance and support are seen at the levels of 1.3252 and 1.3196 respectively. The support is the low at 1.3196. Equally important, the USDCAD pair is still moving around the key level at 1.3225, which represents a daily pivot in the H1 time frame at the moment. All these signals taken together indicate further sideways trend movement. Immediate resistance is seen around 1.3252 levels, which coincides with the first resistance. In case of a successful breakout at 1.3252 , the next target will be at the level of 1.3291. This would suggest a bulish market because the RSI indicator is still in a positive area and does not show any trend-reversal signs. The pair is expected to rise higher towards at least 1.3344 so as to test the daily support 3. On the other hand, if a breakout happens at the support level of 1.3196, then this scenario may be invalidated. The daily levels:
|
| Gold demand remains strong, further gains in prospect Posted: 09 Aug 2019 03:07 AM PDT Gold made a correctional decline on Thursday with spot retreating to lows just below $1,490 per ounce from 6-year highs just above $1,510. Overall selling pressure was limited notably amid the improvement in risk appetite. In particular, gold was resilient despite a 1.9% gain for the US S&P 500 index and traded around $1,503 in Europe on Friday. Overall demand for defensive assets has remained strong with the yen also sustaining a very firm tone despite gains in US equities. Fears over the global trade and a slowdown in global economic growth will continue to underpin precious metals. The sharp decline in US bond yields and expectations of further interest rate cuts by global central banks provide gold prices with support, especially with a declining cost of carry. German bond yields are still trading close to record lows below 0.55% with gold in the extraordinary position of being one of the highest-yielding safe haven assets provided that it does not have negative rates. It would be a good idea for traders to revise investment portfolios on Friday amid the prospects of important political developments during the weekend period. With markets closed, there will be the risk of opening gaps when Asia re-opens on Monday. Investors will be on edge due to negative risk events with prospects of further attacks on China by President Trump and the US Administration. The US president is likely to resume attacks on dollar's strength and the tail risk of a direct dollar intervention when liquidity is low in early Asian trade on Monday. Chinese rhetoric has also been generally uncompromising with no evidence of significant concessions made by either side. Italian political tensions also tend to underpin gold demand in the short term. Overall, there is scope for further gold gains in Friday's New York close amid buoyant demand as an insurance policy in case risk aversion flares up again.
|
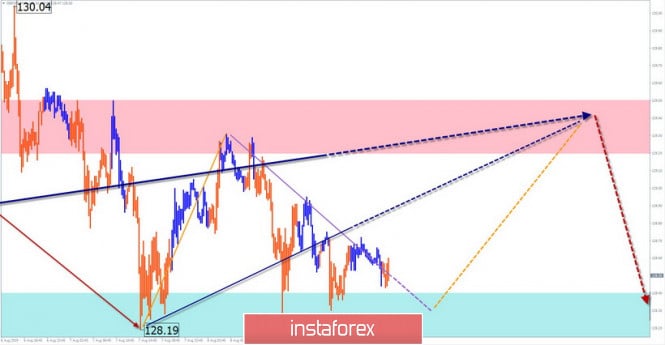
| Simplified wave analysis and forecast for GBP/JPY, AUD/USD and USD/CHF on August 9 Posted: 09 Aug 2019 02:00 AM PDT GBP/JPY The downward wave of July 25 is at the end of the medium-term bearish trend. Since the beginning of August, a correction has been formed along the upper boundary of the support zone in the flat corridor. Its structure lacks the final section. Forecast: Today, the current bullish wave structure is likely to be completed. Mostly an upward trend in price fluctuations is expected. Preliminary short-term pressure on the support zone is not ruled out. The preliminary level of the end of the entire rise is within the resistance zone. Recommendations: Supporters of intraday trading style today can make purchases of the pair. It is safer to refrain from trading during the rise. At the end of the correction, it is recommended to monitor the instrument's sell signals. Resistance zone: - 129.20/129.50 Support zone: - 128.40/128.10
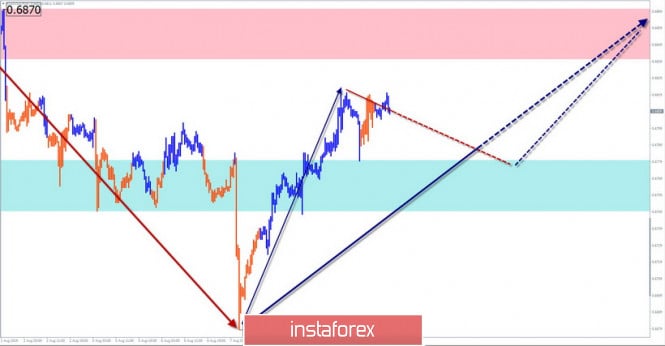
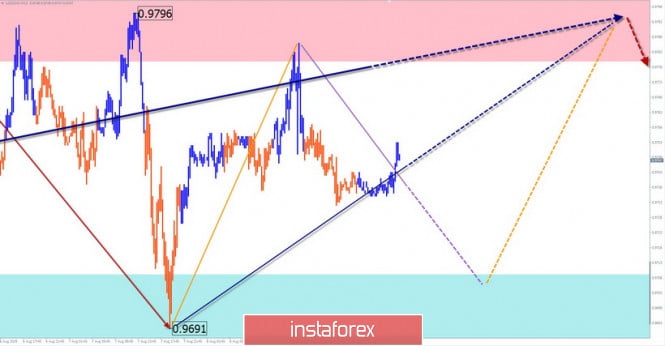
AUD/USD The downward section of July 19 is at the tip of the medium-term wave, which sets the main direction in the last year and a half. Since August 7, an upward movement began to develop towards, until it does not go beyond the correction of the last section of the trend. The high wave level indicates the continuation of the beginning of the upward structure and its transition to a larger scale. Forecast: In the coming sessions, the price of "Aussie" expects a rollback, most likely in the form of a flat. The lower boundary is a zone of support. By the end of the day, amid the emerging news block from the US, it is expected to increase volatility and further growth of the rate. Recommendations: Sales of the pair are quite risky today, they are possible only with an intra-session style with a minimum lot. In the area of the support zone, it is recommended to monitor the signals of buying the pair. Resistance zone: - 0.6840/0.6870 Support zone: - 0.6780/0.6750
USD/CHF The last unfinished wave structure on the franc chart is upward, from June 25. It formed the first 2 parts (A+B). The bullish wave that began on August 6 has no reversal potential, but may be the beginning of a larger bullish wave. The last part of the wave zigzag is formed in its structure. Forecast: Today, the most likely scenario will be a flat pair between the nearest opposite zones. The first half of the day is expected to decline. Towards the end of the runoff, the chance of a return to the upward movement vector increases, with the price rising to the resistance zone. Recommendations: Today, trade is justified only in the framework of intraday. It is recommended to make transactions according to the expected sequence. It is safer to refrain from trading and wait for the completion of the whole bullish wave. Resistance zone: - 0.9780/0.9810 Support zone: - 0.9710/0.9680
Explanations to the figures: Waves in the simplified wave analysis consist of 3 parts (A-B-C). The last unfinished wave is analyzed. Zones show areas with the highest probability of reversal. The arrows indicate the wave marking according to the method used by the author, the solid background is the formed structure, the dotted ones are the expected movements. Attention: The wave algorithm does not take into account the length of time the instrument moves. The material has been provided by InstaForex Company - www.instaforex.com |
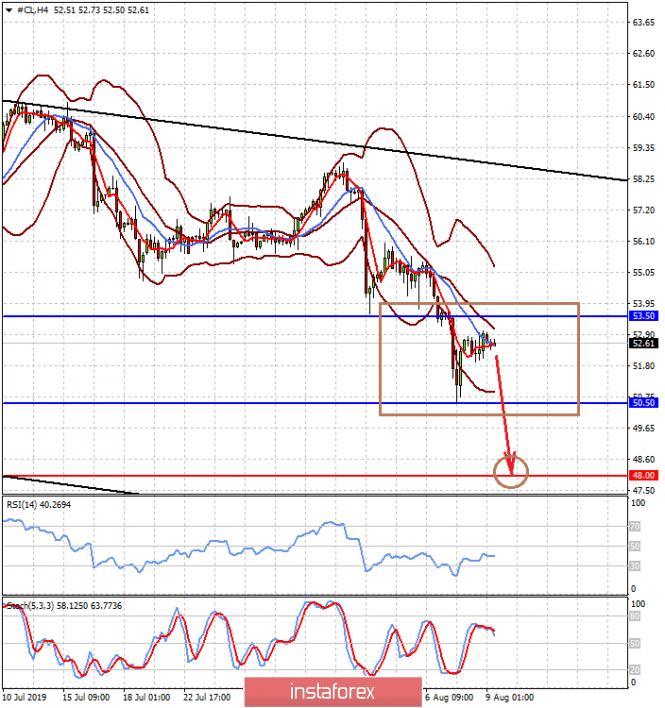
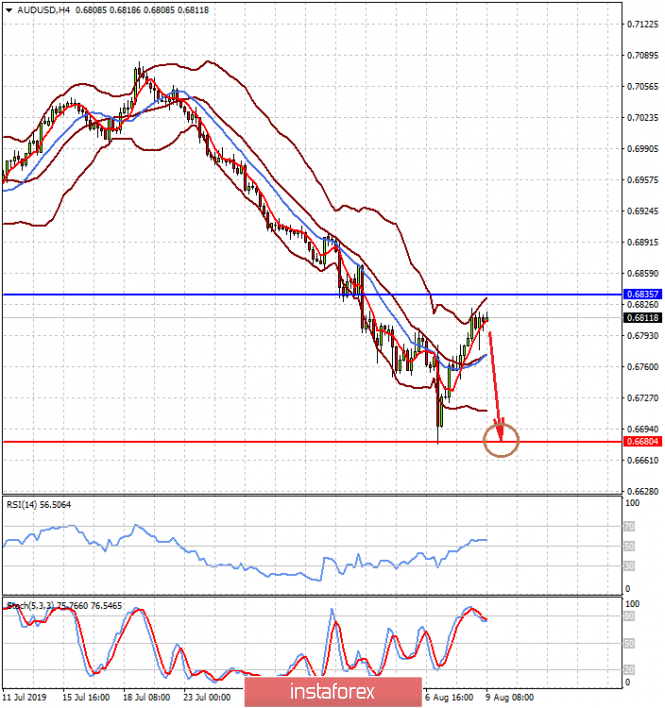
| Posted: 09 Aug 2019 01:51 AM PDT The foreign exchange market actually froze in anticipation of new signals about the prospects for monetary policies of the world's largest central banks, as well as the publication of important economic data. All investor attention has shifted to the commodity market and here, the focus is on the situation around the dynamics of crude oil prices. Quotes of crude oil have fallen by almost 20 percent over the past 7 days, thereby demonstrating the growth of the uncertainty factor that has returned to world markets, as well as the high concern of market participants for the prospects for global economic growth. At the moment, it is precisely the movement of oil prices that clearly shows investors' expectations regarding the prospects for the global economy, although of course, this fully reflects the dynamics of quotations of government bonds, primarily American and German. Yet, it is precisely the movement of oil prices that is the nerve that painfully responds to changes in investor sentiment. Earlier, the increase in crude oil prices was based not only on the desire of OPEC+ to maintain relatively high prices by artificially lowering market supply, but also on really high demand for petroleum products against the backdrop of a growing global economy. But now, the opposite is true at the end of the ten-year cycle. OPEC + does everything to stimulate price increases, but a large-scale trade war between the US and China hinders their increase as the disruption of trade relations due to numerous trade wars forces market players to exercise a high degree of caution, which is noticeable in increased volatility when quotes fell or grew by more than 5 percent during the trading session. Quotes fell or grew by more than 5 percent. In our opinion, this state of affairs will continue until it becomes completely clear whether the trade confrontation between Washington and Beijing will continue or not, that is, if the Fed decides to continue lowering interest rates in order to support economic growth in the United States or further take a wait and see attitude. In fact, we can say that at the present rather difficult time, it is the dynamics of crude oil prices that fully reflects all the fears and aspirations of investors as a vivid example of a indicator of market sentiment. Forecast of the day: The price of WTI crude oil is likely to remain in the range of 50.50-53.50 today amid expectations of new signals about the prospects for trade relations between the United States and China. However, if the positive does not appear on the weekend, then next week prices may start with a decline. In this case, a breakthrough of the lower limit of the range may lead to a fall in prices to $ 48.00 per barrel. The AUD/USD pair slowed down the growth, which was caused by the increase in demand for risky assets. The expectation of lower RBA interest rates, as well as a deterioration in market sentiment, could lead to a price reversal and its decline to 0.6680. |
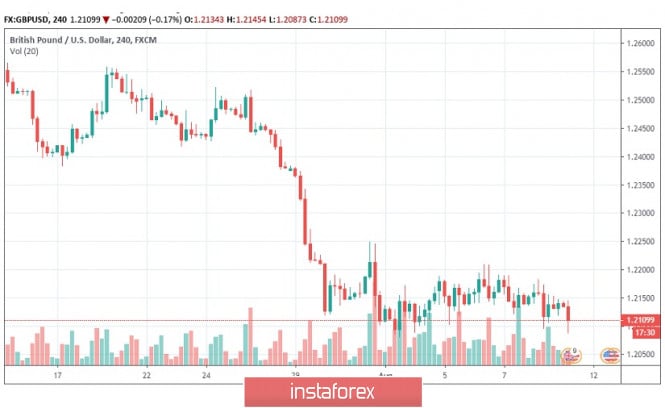
| GBP/USD slides after UK GDP contraction, sell on rallies Posted: 09 Aug 2019 01:47 AM PDT According to the first reading, second-quarter GDP contracted 0.2% following 0.5% growth in the first quarter. The reading was also below consensus forecasts of 0.0%. Year-on-year growth also slowed to 1.2% from 1.8% and below expectations of 1.4%. This was the first quarterly contraction since 2012. Monthly industrial production declined marginally by 0.1% for June with an annual decline of 0.6% while manufacturing output dropped 1.4% over the year. Business investment worsened for the quarter while a construction output fell in June. The only bright spot was a sharp narrowing of the trade deficit for June. Markets expected a weak figure for the second quarter, but contraction of 0.2% will further erode market sentiment towards the economy. In an immediate response, GBP/USD dipped just below 1.2100 not far from 34-month lows with EUR/GBP approaching 0.9250. Political uncertainty is denting sterling's confidence with a strong market focus on the October 31st Brexit deadline. Foreign Minister Raab reiterated that the UK would leave the EU on WTO terms if the EU refused to show flexibility on re-negotiation. Market participants are speculating that if the government lost a no-confidence vote it would call for a General Election just after October 31st in order to secure a 'no-deal' Brexit while the parliament was not sitting. Opposition parties continue their attempts to block such a policy and political tensions will intensify. Unless there is evidence of the UK or EU governments back-tracking and offering compromises, the sterling will remain vulnerable on political grounds. A soft dollar tone will provide an element of GBP/USD protection and selling offers little immediate value, especially with a weak reading priced in, but there will be further selling interest on rallies.
|
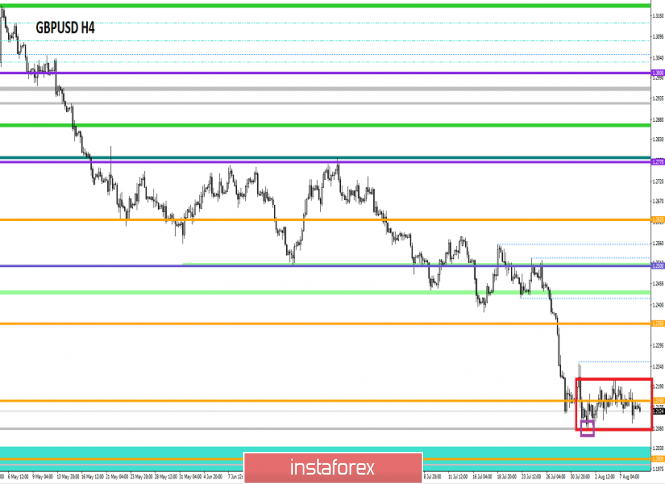
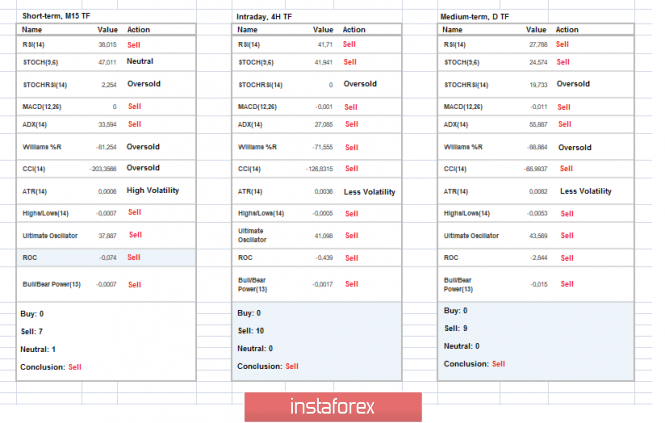
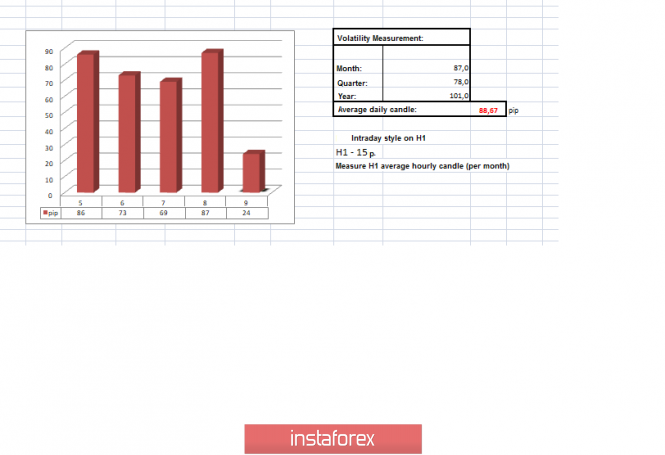
| Trading recommendations for the GBPUSD currency pair - prospects for further movement Posted: 09 Aug 2019 01:21 AM PDT Over the past trading day, the pound / dollar currency pair showed a volatility equal to the average daily point of 87 points. However, nothing changed in terms of the movement itself - a flat horizontal move. From the point of view of technical analysis, we see the ideal accumulation, which can be cut and pasted into trading books. The price fluctuation within 1.2100-1.2200 with an error of +/- 20 points stretches already for the ninth day in a row, where indecision and ambiguity of actions draws attention to the situation more and more, which clearly will result in an uncontrolled, inertial jump. As discussed in the previous review, traders holding short positions were already so late that, against the background of folding uncertainty, they entered the stage of partial and complete fixation of positions, waiting for the opening of consolidation and reverse entry to the market. Considering the trading chart in general terms (daily timeframe), we see that the global downward trend is in a variable stopping phase, drawing something similar to the graphical pattern of the continuation of the trend "Flag"on the market. The news background of the past day was boring and passive, which practically nothing came of it. The only thing that can be highlighted is the applications for unemployment benefits in the United States, which, surprisingly, came out better than expected. The initial orders were revised and eventually reduced by 8 thousand, and the repeated ones were reduced by 15 thousand. If we synchronize the date of publication of applications and the trading chart, we see that, it turns out, not everything was so bad on the news flow, and the applications were locally supported American currency. Yet, the joy was short-lived, and the price rebound again, returning to the horizontal course. The information background continues to stir the topic about the UK & EU divorce agreement. This time the head of the British Foreign Ministry, Dominic Raab, said during a visit to Mexico City that the EU should change the Brexit agreement, or the country would leave the EU without an agreement. In simple words, it all looks like jumping in place. In turn, British Prime Minister Boris Johnson is firmly convinced that the British Parliament will not resist the country's exit from the European Union on time. Johnson probably forgot that the parliament didn't mind quitting, but the majority was against a hard exit. "Members of parliament must implement what they promised to the people of this country ... they will fulfill the 2016 mandate, and we will leave the EU on October 31, "Johnson said. Boris Johnson also did not miss the moment, saying that Britain is ready to change migration laws, but without any specifics. Probably, a certain fear of the construction crisis that arose after Brexit due to a shortage of labor began to play in it. Today, in terms of the economic calendar, we have a large package of statistics for the UK, which publishes a preliminary estimate of GDP for 2Q, and we are waiting for a slowdown in economic growth from 1.8% to 1.4%. At the same time, there will be data on industrial production in Britain, where there is also a decline, from 1.4% to -0.2%. In the afternoon, we are waiting for statistics on producer prices in the United States, where, according to preliminary forecasts, their level should remain unchanged at 1.7%. The upcoming trading week in terms of the economic calendar is saturated with statistical data compared with the previous week, where, frankly, there was an empty sheet. Of course, in no case, we should not forget about the spontaneous information background. In this case, we are interested in the specifics of Brexit. The most interesting events displayed below ---> Tuesday, August 13 Great Britain 8:30 Universal time. - Average wage level with bonuses (June): Prev 3.4% ---> Forecast 3.1% Great Britain 8:30 Universal time. - Average salary excluding bonuses (June): Prev 3.6% ---> Forecast 3.5% Great Britain 8:30 Universal time. - Unemployment Benefit Applications (July): Prev 38.0K ---> Forecast 22.8K Great Britain 8:30 Universal time. - Unemployment Rate (June): Prev 3.8% ---> 3.8% forecast USA 12:30 Universal time. - Core Consumer Price Index (CPI) (YoY) (July): Prev 2.1% ---> Forecast 2.1% Wednesday, August 14 Great Britain 8:30 Universal time. - Consumer Price Index (CPI) (YoY) (July): Prev 2.0% Great Britain 8:30 Universal time. - Core Retail Price Index (YoY) (July): Prev 2.8% Thursday, August 15 Great Britain 8:30 Universal time. - Retail Sales (YoY) (July): Prev 3.8% USA 12:30 Universal time. - Retail Sales (YoY): Prev 3.4% ---> Forecast 3.2% USA 13:15 Universal time. - Industrial Production (YoY): Prev 1.3% ---> Forecast 1.2% Friday, August 16 USA 12:30 Universal time. - Number of building permits issued (July): Prev 1.232M ---> Forecast 1.270M USA 12:30 Universal time. - Volume of construction of new houses (July): Prev. 1.253M ---> Forecast 1.259M Further development Analyzing the current trading chart, we see that the horizontal movement of 1.2100-1.2200 (+/- 20p) is maintained in the market, more and more accumulating interest and fear of market participants. Traders are closely monitoring everything that happens, since this kind of accumulation is not so often, and its breakdown will definitely lead to an uncontrolled inertial move. It is likely to assume that the amplitude fluctuation of 1.2100-1.2200 (+/- 20p) will continue to have a certain time, but now, you can actively analyze the possible move. The trading methodology in this case is "Work on the breakdown of borders", where clear price fixations are analyzed, preferably with the inertial course and pressure of the information and news background. Based on the available information, it is possible to expand a number of variations, let's specify them: - Positions to buy are considered in case of clear price fixing higher than 1.2220 (not a puncture). The prospect of 1.2250 --- 1.2350. - Positions to sell are considered in case of a clear price fixing lower than 1.2080, with a breakdown of the local minimum and a move to the psychological level of 1.2000. The further course is already being considered with respect to the level of 1.2000 and fixation points. Indicator analysis Analyzing a different sector of timeframes (TF), we see that the indicators at all time intervals signal a downward interest. It is worth considering such a moment that while we are within the boundaries of the cluster. The indicators in the short-term and intraday are variable. Volatility per week / Measurement of volatility: Month; Quarter; Year Measurement of volatility reflects the average daily fluctuation, calculated for the Month / Quarter / Year. (August 9 was built taking into account the time of publication of the article) The current time volatility is 24 points, which is suspiciously low value for this time section. The volatility of the day will depend on the current cluster, since in case of breakdown it can increase many times. Key levels Resistance zones: 1.2150 **; 1.2350 **; 1.2430; 1.2500; 1.2620; 1.2770 **; 1.2880 (1.2865-1.2880) *; 1.2920 * 1.3000 **; 1.3180 *; 1.3300 Support areas: 1.2150 **; 1,2000; 1.1700; 1.1475 ** * Periodic level ** Range Level *** The article is built on the principle of conducting a transaction, with daily adjustment The material has been provided by InstaForex Company - www.instaforex.com |
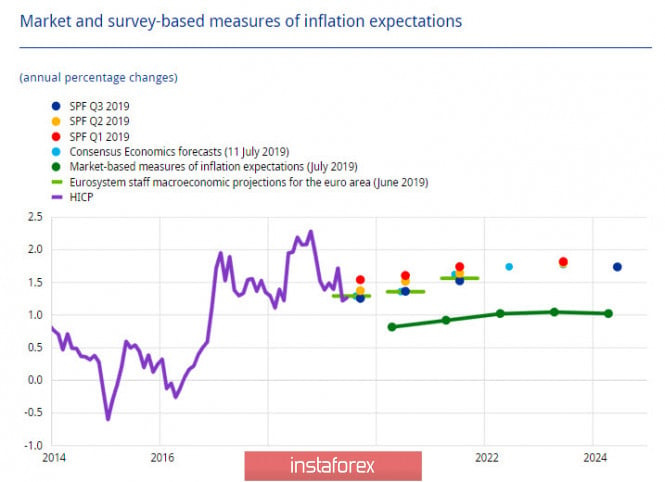
| Posted: 09 Aug 2019 01:02 AM PDT World markets continues to decline. A sharp recovery in US stock indices could indicate a decrease in the panic wave, however, a number of other indicators, such as the price of gold and oil, or demand for bonds, still indicate a high level of risk that will not allow markets to return to the growth path. Recently, the US financial authorities have been solving several problems at once, which have a direct impact on the forecast for the dollar. The panic that gripped the markets is largely a result of the weakening of the yuan below 7, which means an increased pressure on all commodity currencies. The yuan will drift to the level of 7.30, since there is a serious risk of further escalation - the United States may well raise tariffs from 10% to 25% if not at the end of the year, then at the beginning of 2020, and such a prospect will limit the risk appetite in the second half of the year. The yield curve for 2-year treasures has already been inverted; 3-month bonds are next in turn, so the market expects the Fed to continue to lower rates. These expectations are fueled by Trump's position, which requires more aggressive actions to combat the approaching recession. Lower rates will have an undoubted economic impact, especially in the housing market, so the Fed will have no choice but to continue the cycle of reducing rates. The second problem directly affects the liquidity of the dollar and, as a consequence, its exchange rate. On August 2, Trump signed a bill to extend the public debt ceiling by two years, which will allow the government to borrow money indefinitely until July 2021. The consequences of the new bill completely change the balance sheet with liquidity. This year, the situation was such that by September the Treasury would have exhausted all the limits and could no longer hold, which in fact would mean default, if it had not been for the possibility of using hidden reserves, namely a single treasury account (General Cash Account, GCA) in the Fed. The use of this account would lead to an influx of liquidity into the banking system, which, along with a reduction in Fed rates, could weaken the dollar in the foreign exchange market. Now, everything looks completely different. Instead of adding liquidity to the system, the Treasury, taking the opportunity of unlimited loans, will withdraw liquidity, primarily in order to restore the GCA to a normal level. At the moment, about 125 billion are in the account. The Treasury considers the range of 350-400 billion to be normal, which means the withdrawal of about $ 250 billion by the end of the year. Thus, the dollar has every chance to continue to strengthen at the moment. Even the threat of a further reduction in the rate will not allow it to start lowering, because in the face of the fight against the upcoming recession, the demand for protective assets will remain stably high. EURUSD On Thursday, the ECB published an updated economic bulletin, which highlighted the risks of lowering inflationary pressures. In order for the financial conditions to remain favorable, monetary stimulation should be continued; thus, the first practical steps should be expected in the fall. In addition, the ECB expects a decrease in general inflation in the coming months. This factor will contribute to the weakening of the euro, since it increases the risks of a stronger stimulus package than the market currently expects. On Friday morning, the euro looks neutral. It is trading in the range 1.1165 - 1.1249 during the day, with a slight downward trend towards the end of the day. In the long run, the euro is likely to continue to decline and is able to go below 1.10 in the coming weeks. GBPUSD Despite the fact that Brexit has every chance to take place without any deal, macroeconomic indicators also do not contribute to the growth of positivity for the pound. In the history of observations since 1995, the retail trade in July set a record for this month, food shortages are forecasted due to trade chaos by the end of the year, and the chances that the Bank of England will begin its actual incentive program in the coming months are growing. The pound looks neutral on Friday before the publication of macroeconomic data. The nature of the consolidation indicates a growing danger of a break down. The support level of 1.2978 may fall if the data turn out to be worse than expected. Therefore, there are no reasons to return to the growth path. The material has been provided by InstaForex Company - www.instaforex.com |
| USD / CAD: it's hard for a "Canadian" to remain a "black sheep" Posted: 09 Aug 2019 12:15 AM PDT Hopes for the ratification of Canada's trade agreements with the United States and the European Union, as well BoC's reluctance to follow its colleagues lowering rates, and favorable oil market conditions for most of the year, have helped keep the USD/CAD quotes at their lowest levels since October 2018. It would seem that the latest data on Canadian GDP were to give strength to the "bulls" for the "loonie". The economy of the Maple Leaf Country in May accelerated by 0.2% in monthly terms. The growth rate was recorded for the third month in a row. This increased the chances that the indicator will rise by 3% in the second quarter. However, the decline in oil prices and fears that the Bank of Canada will follow the path of the Federal Reserve will put sticks in the wheels of the USD / CAD "bears", despite the improvement in macroeconomic indicators. The strengthening of the Canadian currency holds back inflation in the country and the fact that the Fed pays more attention to international risks and not to internal statistics makes BoC doubt its passive position. In addition, the yield curve of Canadian government bonds sank to its lowest level since 2000. The latter indicates an approaching recession, as well as the fact that sooner or later the Central Bank will have to lower its interest rate. It is expected that this will happen in December, although much can still change before the end of the year. The derivatives market expects three acts of monetary expansion from the Fed this year. If BoC begins to mitigate monetary policy only at the end of the year, then the USD/CAD pair may well return around 1.3. |
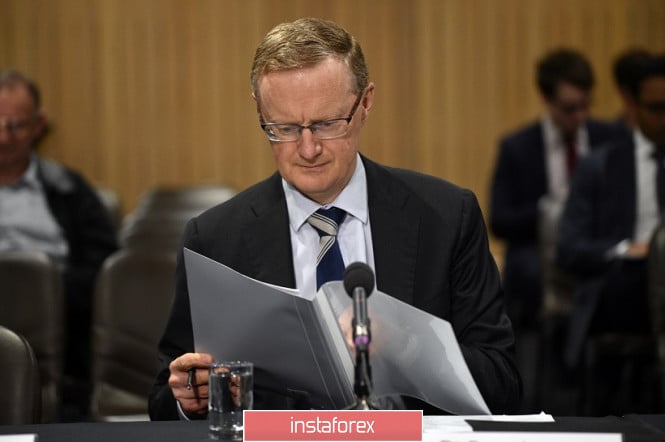
| AUD / USD: Predictable abstracts on RBA quarterly report reassured traders Posted: 09 Aug 2019 12:15 AM PDT The head of the Reserve Bank of Australia reassured AUD/USD traders, although he did not rule out a further reduction in the interest rate to 0.75%. Of course, this is a bearish factor that will put background pressure on the "Aussie". But, on the other hand, Lowe made it clear that the RBA is unlikely to follow the path of New Zealand colleagues. Let me remind you that the RBNZ cut the rate immediately by 50 points this week, which shocked not only the traders of the NZD/USD pair, but also the rest of the market participants. Investors suggested that the RBA would repeat such a maneuver in the fall and cut the rate to 0.5%. Against the backdrop of such assumptions, the Australian dollar paired with the US currency collapsed to 2009 price lows despite a general greenback weakening. The results of a rather neutral meeting of the RBA could not convince traders, which took place this week. Thus, the Australian continued to fall. However, the downward movement was impulsive and short-term. Within one day, the AUD/USD pair reached a 10-year low and immediately rebounded from it, updating the high of the day. Aussie attracted buyers who began to buy the Australian dollar at record low prices. In this case, technical factors played a key role. After such an impulse fall, a corrective pullback was inevitable and the AUD/USD bulls took advantage of this axiom. At the moment, we can't talk about a turning point in the trend. The Australian is only returning to the usual price niche, since the sharp decline in the framework of the 66th figure was, by and large, unreasonable. The market was driven by emotions after an unexpected decision by the New Zealand Central Bank, but now pragmatism, based on the RBA theses voiced today, has replaced emotions. The Reserve Bank of Australia published its quarterly report today, which repeated the main points voiced at the last meeting of the Central Bank. According to the regulator, Australia needed a "long period of low interest rates" to accelerate inflation, reduce unemployment and increase wages. Also, the RBA again reminded that "if necessary," the Central Bank will continue to soften monetary policy. Such rhetoric is fully consistent with market expectations. After the escalation of the trade war between the United States and China, investors are laying at current prices a rate cut to 0.75% at one of the autumn meetings and to 0.5% at the beginning of 2020. The head of the RBA, Philip Lowe, commented on some of his points after the publication of the quarterly report. He said there are signs at the moment that the Australian economy may have reached a "soft turning point." The protective measures, particularly we are talking about lowering taxes and interest rates, that were taken by the Australian government and the Central Bank had a positive effect against the backdrop of the devaluation of the national currency. According to RBA economists, the results of quarterly GDP growth will gradually improve "after a series of disappointing releases." However, Lowe warned that the "era of low rates" will continue for a long time. According to him, unemployment is likely to remain at about 5%, at least until 2021. Meanwhile, the RBA said that the unemployment rate should drop to 4.5% in order to exert upward pressure on wages. In other words, Australian labor market indicators will play a special role for the Australian currency, especially wage dynamics. Thus, the Reserve Bank of Australia today made it clear that the situation in the country's economy is changing for the better (at least) and RBA economists see the corresponding potential. However, if these signs turn out to be false, the regulator will immediately resume the course on easing monetary policy. The announced position allowed the AUD/USD pair to return to the area of the 68th figure. Further price dynamics will depend on the behavior of the American currency and the "well-being" of the commodity market, primarily we are talking about the iron ore. The devaluation of the renminbi, as well as a sharp slowdown in demand for metal from the Chinese construction sector, negatively impacted iron ore quotes. The cost of a ton of raw materials fell sharply from $124 to the current 93. The downward movement will put additional pressure on the Australian dollar. Such a fundamental background is not conducive to large-scale growth of "Aussie". However, the potential for corrective growth has not yet been exhausted. Everything will depend on how sharply the US dollar will react to the continuation of the US-Chinese conflict. In particular, the Chinese regulator again lowered the national currency as the USD/CNY is now at 7.050. It is in response to Washington's actions as the States delayed the issuance of Huawei licenses. The dollar index is slowly decreasing, which means that the AUD/USD bulls of the pair can expect the pair to rise to the first resistance level - that is, to the Kijun-sen line on the daily chart, which corresponds to the level of 0.6880. The material has been provided by InstaForex Company - www.instaforex.com |
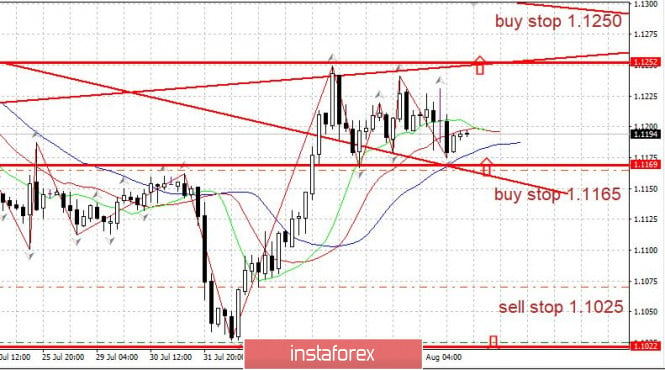
| Trading plan for EURUSD on 08/09/2019 Posted: 08 Aug 2019 11:29 PM PDT
The growth of the EURUSD is under pressure. No big news. The Trump-China trade war has somewhat faded into the background. British Prime Minister Johnson is trying to put pressure on the EU to get a new agreement but is preparing a way out of Britain without an agreement. The euro on its way up met the strongest resistance at 1.1250 We keep purchases from 1.1165. We buy for a breakthrough of 1.1250 up. The material has been provided by InstaForex Company - www.instaforex.com |
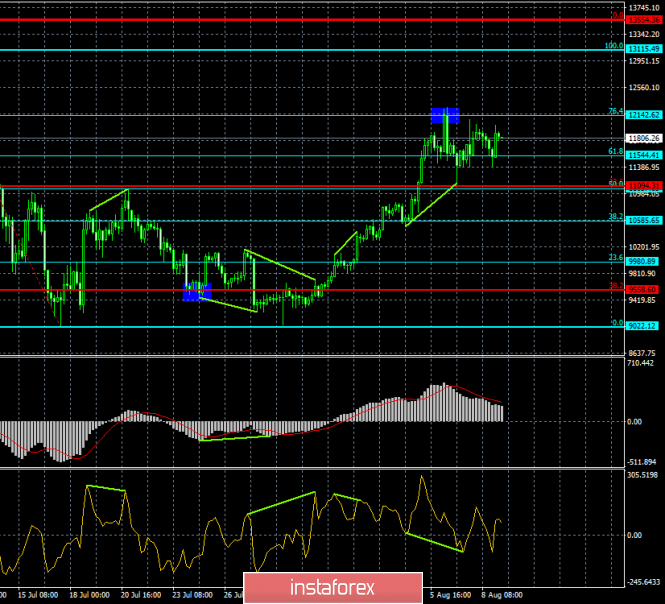
| Forecast for Bitcoin and US dollar on August 9th. The battle for bitcoin in the US Congress Posted: 08 Aug 2019 11:20 PM PDT Bitcoin – 4H.
As seen on the 4-hour chart, Bitcoin performed several drops after the rebound from the correction level of 76.4% ($12142), but could not close under the Fibo level of 61.8% ($11544). Thus, the bullish mood in the crypto market remains. In America, North Carolina Congressman Ted Budd re-introduced the "Virtual Value Tax Fix Act", a bill that requires the abolition of double taxation for cryptocurrency transactions. Budd proposes to amend the Internal Revenue Code to cryptocurrencies were considered assets. At the moment, the Tax Service regards Bitcoin as an asset, respectively, its sale or exchange for other assets, currencies, values are taxed at 40%. That is, under current US law, bitcoin is closer to real estate than to the currency. According to Budd, this hinders the development of blockchain technology and the cryptocurrency segment. At the same time, the Marketing Director of Rhythm Technologies Chris Reinertsen said that more investors include bitcoin in their portfolios, using the number 1 cryptocurrency in the world as a protective asset. This is a highly controversial view, as the high volatility of the asset and its zero provision with other values does not allow it to be considered as a means of preserving value in the long term. BTC is suitable for these purposes only for short periods since if the price starts to fall, it will fall quickly and strongly, which will lead to the withdrawal of the cryptocurrency from the portfolios of many investors. Further growth of the "cue ball" will be possible after closing the quotes above the correction level of 76.4% ($12142). The Fibo grid is based on the extremes of July 10, 2019, and July 17, 2019. Forecast for Bitcoin and trading recommendations: Bitcoin has made a return to the Fibo level of 76.4%. Thus, I recommend buying the cryptocurrency with the target of $13115, with the stop-loss order below the level of 76.4%, if the closure is performed above the level of $12137. I recommend selling bitcoin with the target of $11544, and with the stop-loss order above the level of $12137, if another retreat from the correction level of 76.4% is performed. The material has been provided by InstaForex Company - www.instaforex.com |


| You are subscribed to email updates from Forex analysis review. To stop receiving these emails, you may unsubscribe now. | Email delivery powered by Google |
| Google, 1600 Amphitheatre Parkway, Mountain View, CA 94043, United States | |
No comments:
Post a Comment