Forex analysis review |
- Forecast for GBP/USD on September 23, 2019
- Forecast for EUR/USD on September 23, 2019
- Fractal analysis of the main currency pairs for September 23
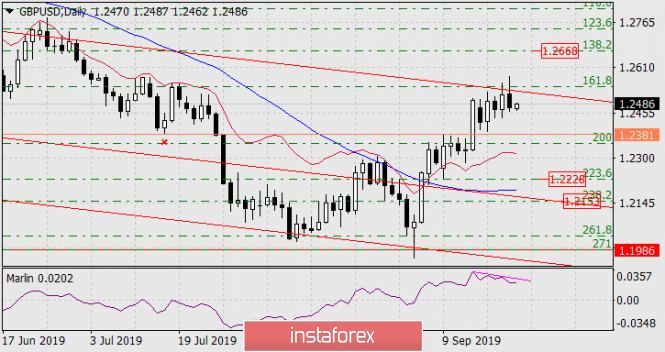
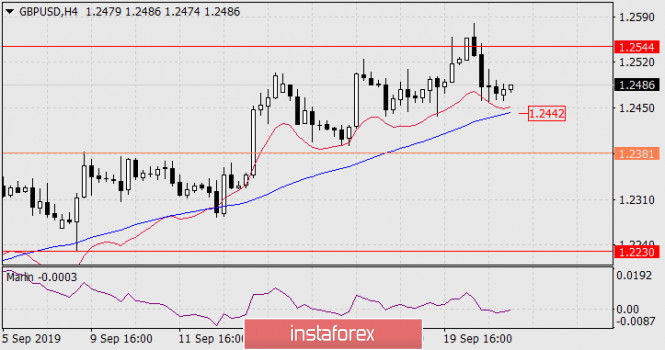
| Forecast for GBP/USD on September 23, 2019 Posted: 22 Sep 2019 08:39 PM PDT GBP/USD On Friday, the pound made a second attempt to go above the resistance at the Fibonacci level of 161.8% (1.2544, the first attempt was on Thursday), but pulled back and it closed the day with a black candle at 44 points. A divergence has formed on the Marlin oscillator. After receiving a signal from smaller TFs, a further decrease in the price is likely below the signal level of 1.2381 and a decrease to the Fibonacci level of 223.6% at the price of 1.2228. On a smaller four-hour chart, the price is held by the red balance indicator line. Departure of the price under the MACD line (1.2442) will create a reserve for an attack on 1.2381, after which we wait for the development of events according to a declining scenario. The signal line of the Marlin oscillator moved into the zone of negative values. |
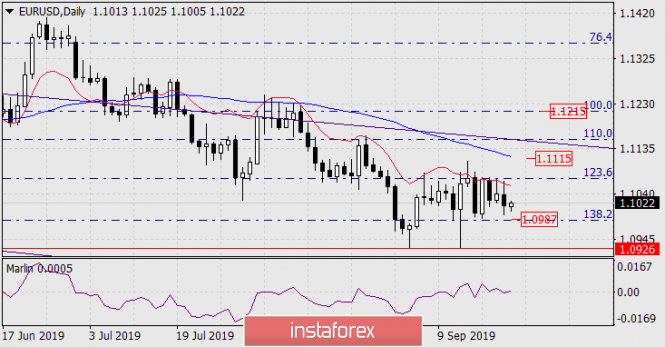
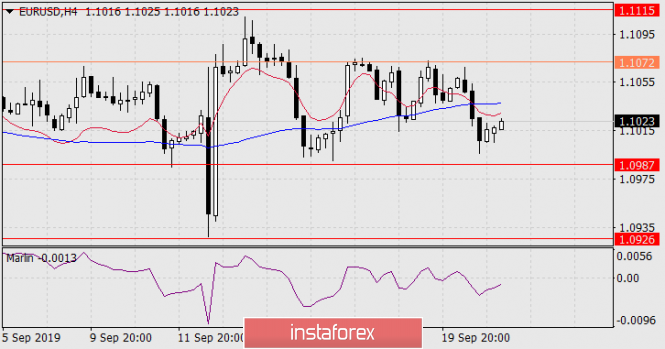
| Forecast for EUR/USD on September 23, 2019 Posted: 22 Sep 2019 08:39 PM PDT EUR/USD On Friday, the euro closed the day with a decline of 24 points, overcoming a number of technical support, which strengthened the bearish sentiment of the market. On the daily chart, the price at the top of the Friday candlestick reversed from the balance indicator line (red), at the bottom it did not reach the target Fibonacci level of 138.2% (1.0987). The signal line of the Marlin oscillator is balancing on the border with the territory of the "bears". On the four-hour chart, the price was consolidated with the indicator lines of the balance and MACD, Marlin in the declining trend zone. Now we expect the euro to consolidate below the target level of 1.0987 and further decline to the support level of 1.0926 on September 3 and 12. The upper target of 1.1115 - the resistance of the MACD line on the daily scale chart can be reached after a preliminary price exit above the Fibonacci level of 123.6% (1.1072). The material has been provided by InstaForex Company - www.instaforex.com |
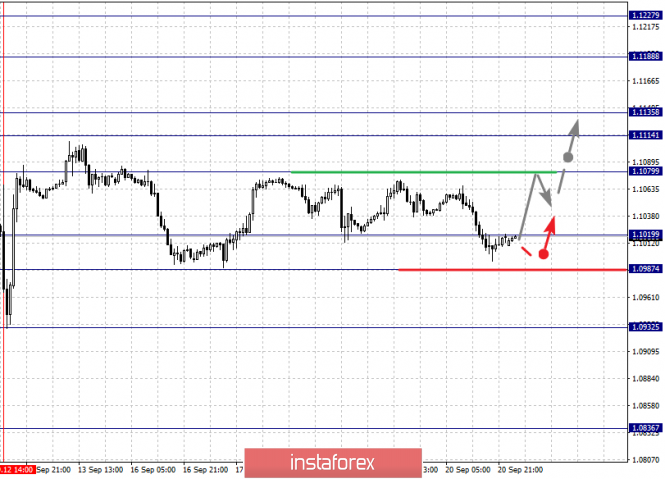
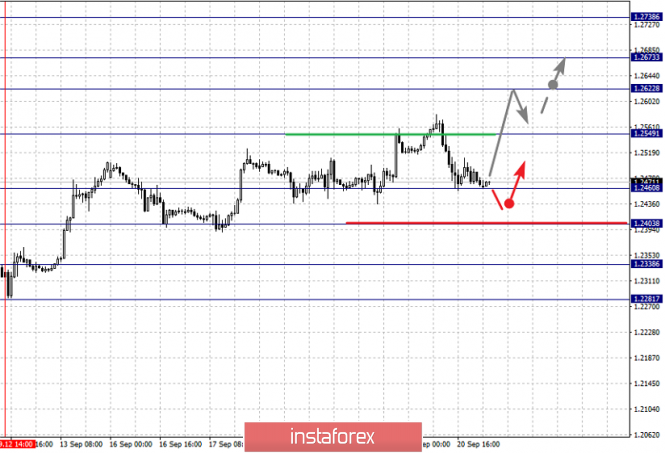
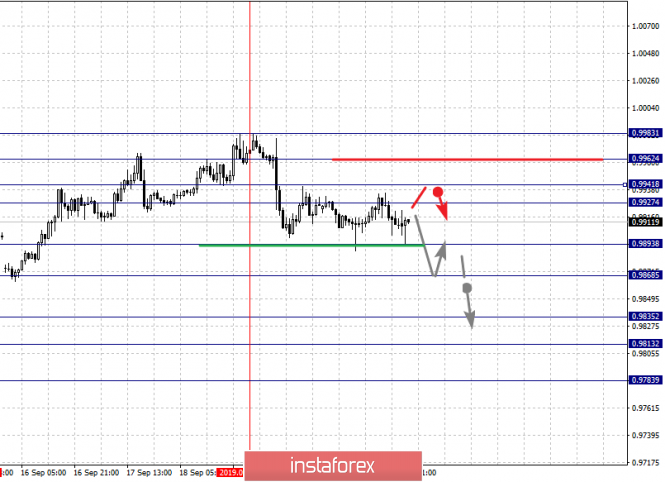
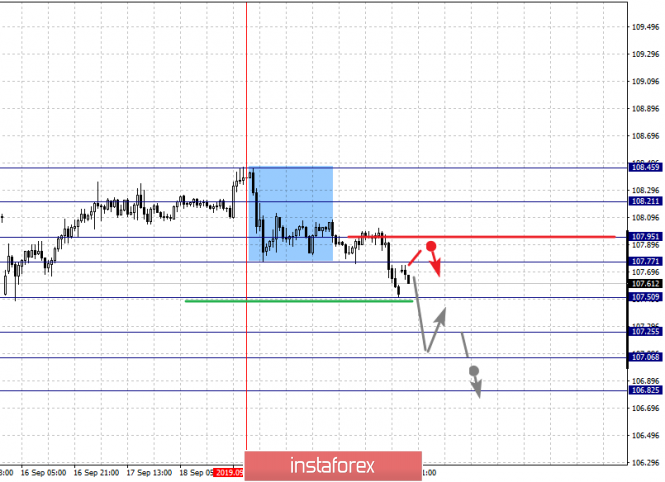
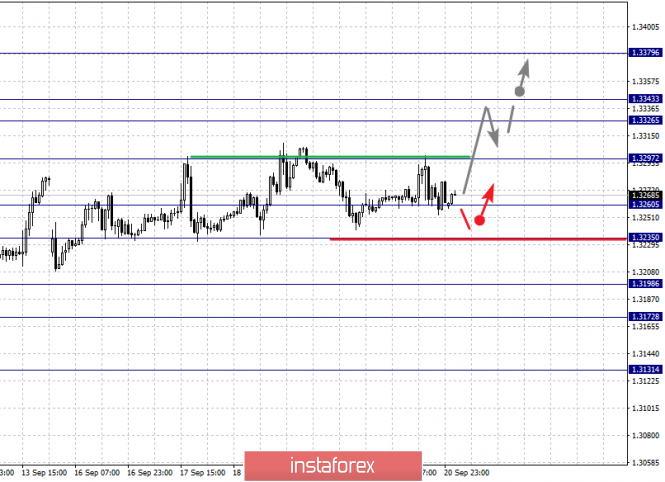
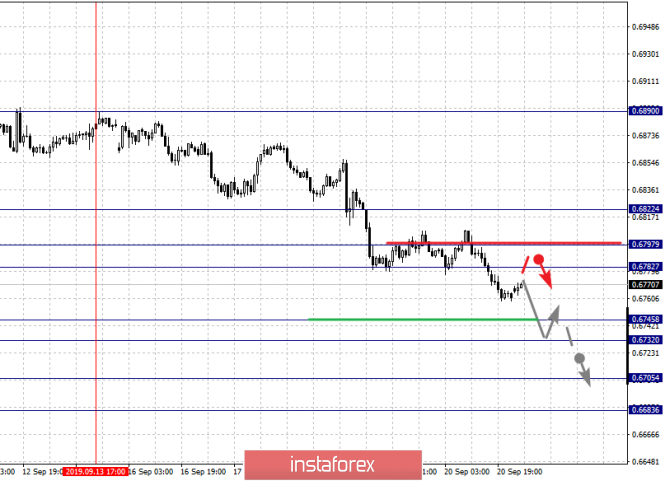
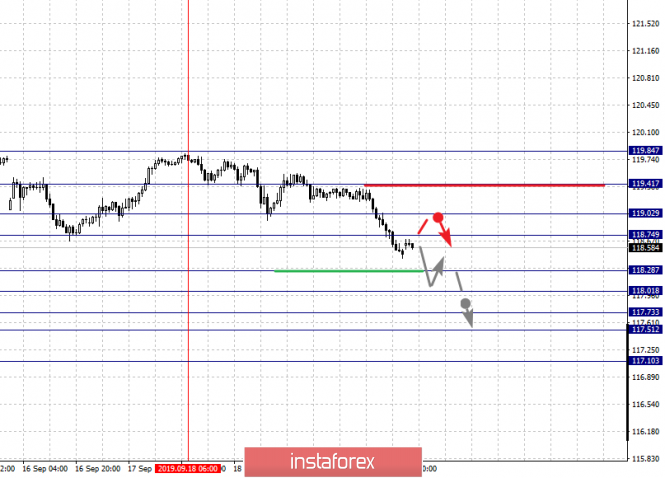
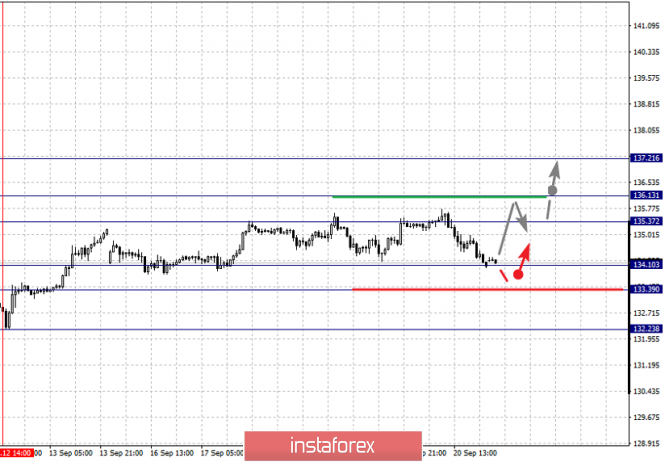
| Fractal analysis of the main currency pairs for September 23 Posted: 22 Sep 2019 05:01 PM PDT Forecast for September 23: Analytical review of currency pairs on the scale of H1: For the euro / dollar pair, the key levels on the H1 scale are: 1.1227, 1.1188, 1.1135, 1.1114, 1.1079, 1.1019, 1.0987 and 1.0932. Here, the price is close to the cancellation of the ascending structure of September 12, which requires a breakdown of the level of 1.0987. In this case, the first potential target is 1.0932. The continuation of the movement to the top is expected after the breakdown of the level of 1.1080. In this case, the first goal is 1.1114. The passage at the price of the noise range 1.1114 - 1.1135 should be accompanied by a pronounced upward movement. Here, the goal is 1.1188. For the potential value for the top, we consider the level of 1.1227. Upon reaching this value, we expect a pullback to the bottom. The main trend is the local structure for the top of September 12. Trading recommendations: Buy: 1.1080 Take profit: 1.1114 Buy 1.1135 Take profit: 1.1188 Sell: 1.1019 Take profit: 1.0990 Sell: 1.0985 Take profit: 1.0935 For the pound / dollar pair, the key levels on the H1 scale are: 1.2738, 1.2673, 1.2622, 1.2549, 1.2460, 1.2403, 1.2338 and 1.2281. Here, we continue to monitor the local ascendant structure from September 12. The continuation of the movement to the top is expected after the breakdown of the level of 1.2549. In this case, the target is 1.2622. Price consolidation is in the range of 1.2622 - 1.2673. For the potential value for the top, we consider the level of 1.2738. Upon reaching which, we expect a pullback to the bottom. We expect consolidated movement in the range of 1.2460 - 1.2403. The breakdown of the latter value will lead to an in-depth correction. Here, the target is 1.2338. This level is a key support for the top. Its passage at the price will lead to the development of a downward structure. In this case, the first goal is 1.2281. The main trend is the local ascending structure of September 12. Trading recommendations: Buy: 1.2550 Take profit: 1.2620 Buy: 1.2674 Take profit: 1.2736 Sell: 1.2401 Take profit: 1.2340 Sell: 1.2336 Take profit: 1.2282 For the dollar / franc pair, the key levels on the H1 scale are: 0.9983, 0.9962, 0.9941, 0.9927, 0.9893, 0.9868, 0.9835, 0.9813 and 0.9783. Here, we expect the development of the downward structure of September 19. The continuation of the movement to the bottom is expected after the breakdown of the level of 0.9893. In this case, the target is 0.9868. Price consolidation is near this level. The breakdown of the level of 0.9868 should be accompanied by a pronounced downward movement. Here, the target is 0.9835, Short-term downward movement, as well as consolidation is in the range of 0.9835 - 0.9813. For the potential value for the bottom, we consider the level of 0.9783. Upon reaching this level, we expect a pullback in correction. Short-term upward movement is possibly in the range of 0.9927 - 0.9941. The breakdown of the latter value will lead to an in-depth correction. Here, the goal is 0.9962. This level is a key support for the descending structure of September 19. The main trend is the formation of the downward potential of September 19. Trading recommendations: Buy : 0.9927 Take profit: 0.9940 Buy : 0.9942 Take profit: 0.9960 Sell: 0.9893 Take profit: 0.9870 Sell: 0.9866 Take profit: 0.9835 For the dollar / yen pair, the key levels on the scale are : 108.21, 107.95, 107.77, 107.50, 107.25, 107.06 and 106.82. Here, we are following the development of the descending structure of September 19. The continuation of the movement to the bottom is expected after the breakdown of the level of 107.50. In this case, the target is 107.25. Short-term downward movement, as well as consolidation is in the range of 107.25 - 107.06. For the potential value for the bottom, we consider the level of 106.82. Upon reaching this level, we expect a pullback to the top. Short-term upward movement is possibly in the range 107.77 - 107.95. The breakdown of the last value will lead to an in-depth correction. Here, the goal is 108.21. This level is the key support for the downward structure from September 19. Main trend: descending structure of September 19. Trading recommendations: Buy: 107.77 Take profit: 107.93 Buy : 107.97 Take profit: 108.20 Sell: 107.50 Take profit: 107.27 Sell: 107.23 Take profit: 107.08 For the Canadian dollar / US dollar pair, the key levels on the H1 scale are: 1.3379, 1.3343, 1.3326, 1.3297, 1.3260, 1.3235, 1.3198 and 1.3172. Here, we continue to monitor the development of the ascending structure of September 10. The continuation of the movement to the top is expected after the breakdown of the level of 1.3297. Here, the target is 1.3326. Price consolidation is in the range of 1.3326 - 1.3343. For the potential value for the top, we consider the level of 1.3379. Upon reaching this level, we expect a pullback to the bottom. Short-term downward movement and consolidation are possible in the range of 1.3260 - 1.3235. The breakdown of the last value will lead to an in-depth correction. Here, the target is 1.3198. This level is a key support for the top. Its breakdown will have the downward structure. In this case, the potential goal is 1.3172. The main trend is the rising structure of September 10, the correction stage. Trading recommendations: Buy: 1.3299 Take profit: 1.3226 Buy : 1.3344 Take profit: 1.3378 Sell: 1.3260 Take profit: 1.3237 Sell: 1.3233 Take profit: 1.3200 For the Australian dollar / US dollar pair, the key levels on the H1 scale are : 0.6822, 0.6797, 0.6782, 0.6745, 0.6732, 0.6705 and 0.6683. Here, we are following the development of the downward cycle of September 13. Short-term downward movement is expected in the range 0.6745 - 0.6732. The breakdown of the last value should be accompanied by a pronounced downward movement. Here, the target is 0.6705. Price consolidation is near this value. For the potential value for the bottom, we consider the level of 0.6683. Upon reaching which, we expect a departure in the correction. Short-term upward movement is possibly in the range of 0.6782 - 0.6797. The breakdown of the last value will lead to a long correction. Here, the potential target is 0.6822. This level is a key support for the downward structure. The main trend is the downward cycle of September 13. Trading recommendations: Buy: 0.6782 Take profit: 0.6795 Buy: 0.6800 Take profit: 0.6822 Sell : 0.6745 Take profit : 0.6734 Sell: 0.6730 Take profit: 0.6707 For the euro / yen pair, the key levels on the H1 scale are: 119.41, 119.02, 118.74, 118.28, 118.01, 117.73, 117.51 and 117.10. Here, we are following the development of the descending structure of September 18. Short-term downward movement is expected in the range 118.28 - 118.01. The breakdown of the latter value will lead to a movement to the level of 117.73. Price consolidation is in the range of 117.73 - 117.51 . For the potential value for the bottom, we consider the level of 117.10. From this level, we expect a rollback to the top. Short-term upward movement is possibly in the range 118.74 - 119.02. The breakdown of the latter value will lead to in-depth movement. Here, the goal is 119.41. This level is a key support for the downward structure. The main trend is the descending structure of September 18. Trading recommendations: Buy: 118.75 Take profit: 119.00 Buy: 119.04 Take profit: 119.40 Sell: 118.28 Take profit: 118.03 Sell: 118.00 Take profit: 117.74 For the pound / yen pair, the key levels on the H1 scale are : 137.21, 136.13, 135.37, 134.10, 133.39 and 132.23. Here, we are following the local ascendant structure of September 12. Short-term upward movement is expected in the range of 135.37 - 136.13. The breakdown of the last value will lead to movement to a potential target - 137.21, when this level is reached, we expect a pullback to the bottom. Short-term downward movement is possibly in the range 134.10 - 133.39. The breakdown of the last value will lead to an in-depth correction. Here, the goal is 132.23. This level is a key support for the upward structure. The main trend is the ascending structure of September 3, the local ascending structure of September 12. Trading recommendations: Buy: 135.38 Take profit: 136.10 Buy: 136.15 Take profit: 137.20 Sell: 134.10 Take profit: 133.42 Sell: 133.35 Take profit: 132.30 The material has been provided by InstaForex Company - www.instaforex.com |
| You are subscribed to email updates from Forex analysis review. To stop receiving these emails, you may unsubscribe now. | Email delivery powered by Google |
| Google, 1600 Amphitheatre Parkway, Mountain View, CA 94043, United States | |

No comments:
Post a Comment