
Forex analysis review |
- December 30, 2019 : EUR/USD Intraday technical analysis and trade recommendations.
- BTC 12.30.2019 - Is this end of the upward correction ? Watch for selling opportunities
- December 30, 2019 : GBP/USD Intraday technical analysis and trade recommendations.
- Gold 12.30.2019 - Multi pivot reistance at the price of $1.515 on the test
- GBP/USD 12.30.2019 - Rising wedge pattern in creation, watch for selling opportunities
- Bitcoin to end the year the opposite way it started it.
- USDCAD challenges major support
- Ichimoku cloud indicator short-term analysis of Gold for December 30, 2019
- EURUSD in short-term bullish trend to end the 4th quarter with a positive note
- Technical analysis of GBP/USD for December 30, 2019
- Technical analysis of ETH/USD for 30/12/2019:
- Technical analysis of BTC/USD for 30/12/2019:
- Technical analysis of GBP/USD for 30/12/2019:
- Technical analysis of EUR/USD for 30/12/2019:
- Elliott wave analysis of GBP/JPY for December 30 - 2019
- Elliott wave analysis of EUR/JPY for December 30 - 2019
- EUR/USD approaching resistance, potential drop!
- GBP/JPY approaching resistance, potential drop!
- USD/CAD testing support. Bounce expected!
- Technical analysis: Important Intraday Levels For EUR/USD, December 30, 2019
- Technical analysis: Important Intraday Levels for USD/JPY, December 30, 2019
| December 30, 2019 : EUR/USD Intraday technical analysis and trade recommendations. Posted: 30 Dec 2019 08:32 AM PST
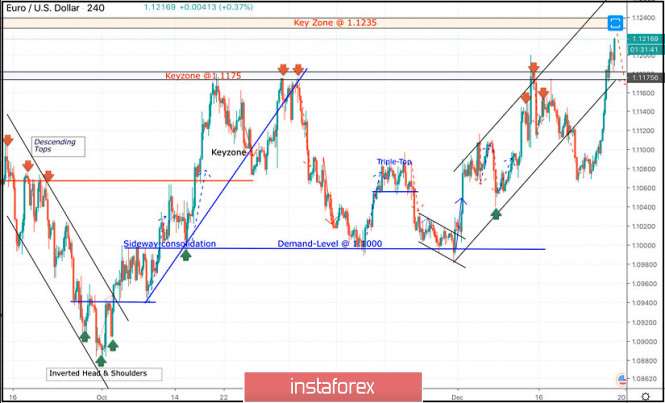
Since November 14, the price levels around 1.1000 has been standing as a significant DEMAND-Level which has been offering adequate bullish SUPPORT for the pair on two successive occasions. Shortly-after, the EUR/USD pair has been trapped within a narrower consolidation range between the price levels of 1.1000 and 1.1085-1.1100 (where a cluster of supply levels and a Triple-Top pattern were located) until December 11. On December 11, another bullish swing was initiated around 1.1040 allowing recent bullish breakout above 1.1110 to pursue towards 1.1175 within the depicted newly-established bullish channel. Initial Intraday bearish rejection was expected around the price levels of (1.1175). Quick bearish decline was demonstrated towards 1.1115 (Intraday Key-level) which got broken to the downside as well. On December 20, bearish breakout of the depicted short-term channel was executed. Thus, further bearish decline was demonstrated towards 1.1065 where significant bullish recovery has originated. The current bullish pullback towards 1.1235 (Previous Key-zone) should be watched for bearish rejection and another valid SELL entry. On the other hand, bearish breakout below 1.1175 is mandatory to allow next bearish target to be reached around 1.1120. Trade recommendations : Conservative traders should wait for bearish rejection signs around the price levels of (1.1235) as a valid SELL signal. Bearish projection target to be located around 1.1175 and 1.1120. The material has been provided by InstaForex Company - www.instaforex.com |
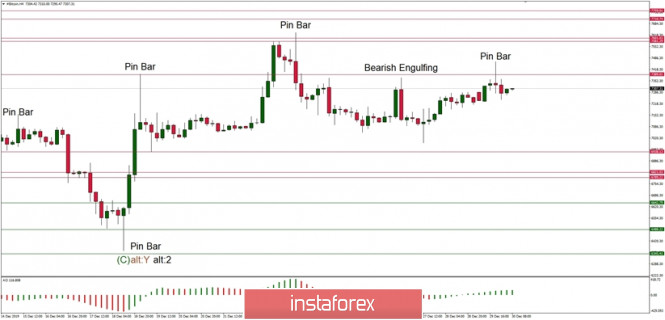
| BTC 12.30.2019 - Is this end of the upward correction ? Watch for selling opportunities Posted: 30 Dec 2019 08:24 AM PST Industry news: After the DApp browser MetaMask got removed from the Google Play Store, Apple followed suit and is forcing crypto exchange Coinbase to remove the DApp browser feature from its iOS app. While many saw this as blatant censorship and a danger to the crypto industry, it goes to show that the DApp market has gotten so big, it's putting both Google and Apple at risk. Technical analysis:
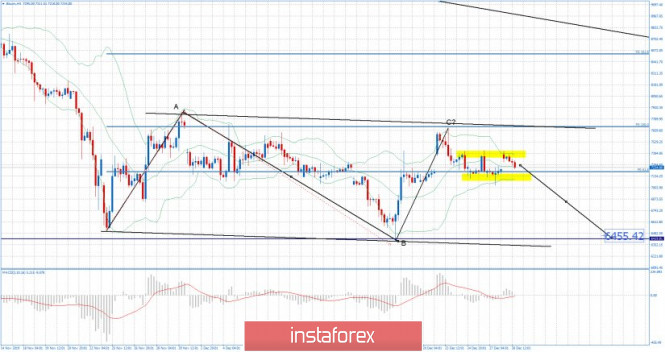
Bitcoin has been trading inside of the consolidation at the price of $7.217 and potential for the further downside movement. I do see potential completion of the upward correction ABC (running flat), which is a sign that selling is in play... Watch for selling opportunities and target at the price of $6.455. MACD oscillator is showing neutral stance and contraction, which is sign that there is the big move that is coming and potential expansion period. Yellow rectangles – Current trading range Resistance levels are seen at the price of $7.400 and $7.700 Support levels are set at the price of $7.030 and at the price of $6.455 The material has been provided by InstaForex Company - www.instaforex.com |
| December 30, 2019 : GBP/USD Intraday technical analysis and trade recommendations. Posted: 30 Dec 2019 08:18 AM PST
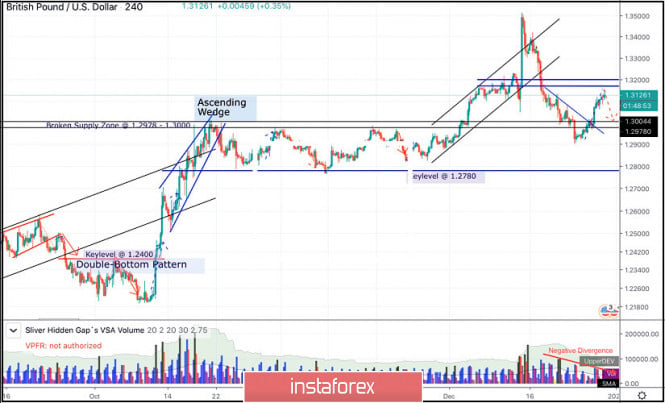
In the period between October 17 to December 4, the GBP/USD pair has been trapped between the price levels of 1.2780 and 1.3000 until December 4 when bullish breakout above 1.3000 was achieved. Moreover, a newly-established short-term bullish channel was initiated on the chart. The GBPUSD has recently exceeded the upper limit of the depicted bullish channel on its way towards 1.3500 where the pair looked quite overpriced. This was followed by successive bearish-engulfing H4 candlesticks which brought the pair back towards 1.3170 quickly. Further bearish decline was pursued towards 1.3000 which got broken to the downside as well. Technical short-term outlook turned into bearish since bearish persistence below 1.3000 was established on the H4 chart. Hence, further bearish decline was expected towards 1.2840 - 1.2800. However, earlier signs of bullish recovery manifested around 1.2900 denoted high probability of bullish breakout to be expected. Intraday technical outlook turned into bullish after the GBP/USD has failed to maintain bearish persistence below the newly-established downtrend line. That's why, bullish breakout above 1.3000 was anticipated. Thus allowing the current Intraday bullish pullback to pursue towards 1.3190-1.3200 where bearish rejection and another bearish swing can be watched by conservative traders. Bearish reversal scenario around 1.3200 is supported by the recent negative divergence as depicted on the chart. The material has been provided by InstaForex Company - www.instaforex.com |
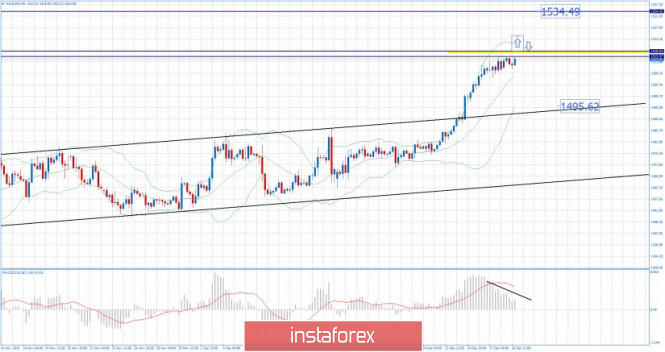
| Gold 12.30.2019 - Multi pivot reistance at the price of $1.515 on the test Posted: 30 Dec 2019 08:10 AM PST Gold has been trading upwards in the recent few days. I found that that Gold is at the main multi-pivot resistance at the price of $1.515 and that you should watch for the reaction around this main resistance.
In case of the further upside breakout, the next upward target would be at $1.534. In case of the stronger rejection of the main resistance at $1.515, downside target might be set at $1.495. MACD oscillator is showing decreasing on the last upside movement and potential for the downside correction. Yellow rectangle – Multi pivot resistance Resistance level is seen at the price of $1.515 Support levels are set at the price of $1.508 and at the price of $1.495 The material has been provided by InstaForex Company - www.instaforex.com |
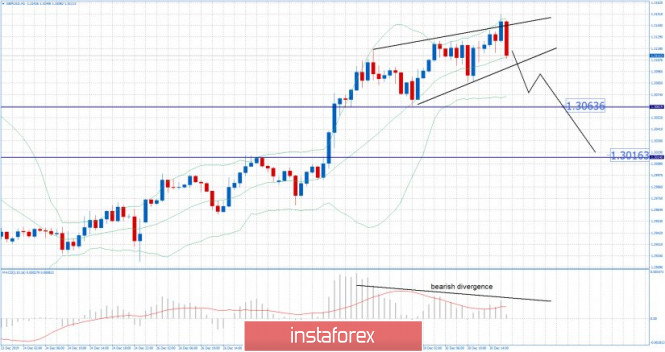
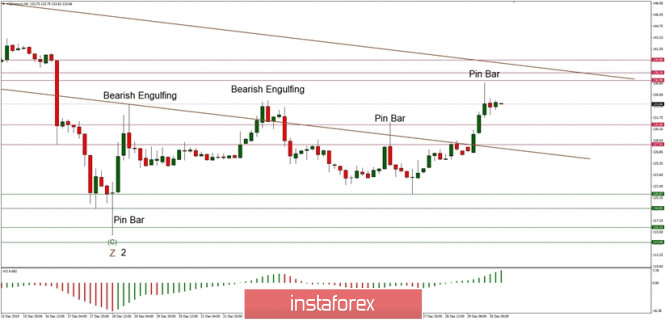
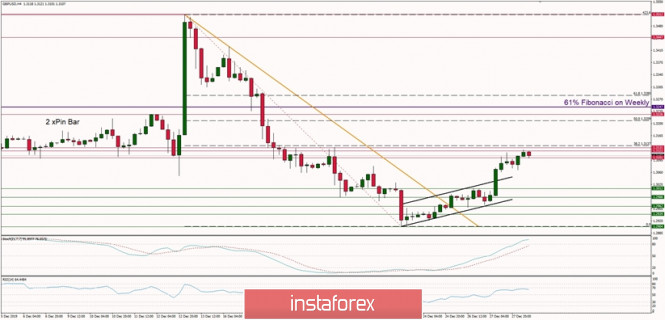
| GBP/USD 12.30.2019 - Rising wedge pattern in creation, watch for selling opportunities Posted: 30 Dec 2019 08:04 AM PST GBP/USD has been trading upwards most recently but I found the rising wedge pattern in creation and potential for further downside. I do expect downside movement and test of 1.3063 and 1.3016. Watch for selling opportunities.
MACD oscillator is showing 3 pushes up and bearish divergence, which is another sign of the exhaustion from buyers. Downward slopping line – Expected path Rising upward lines – Rising wedge pattern Resistance level is seen at the price of 1.3150 Support levels and downward targets are set at the price of 1.3063 and 1.3016. The material has been provided by InstaForex Company - www.instaforex.com |
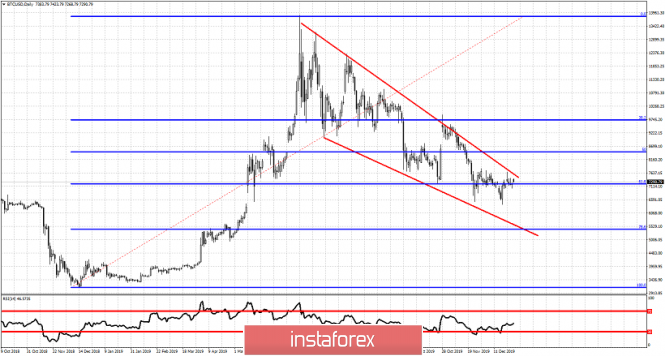
| Bitcoin to end the year the opposite way it started it. Posted: 30 Dec 2019 03:58 AM PST Despite a strong first half of 2019, BTCUSD had a disappointing second half of the year. Price peaked in June just below $14,000 and is now trading nearly 50% lower. However not all are lost for bulls as price is holding above major Fibonacci support and reversal area.
BTCUSD is still in bearish trend inside the downward sloping wedge pattern. Price is still trading around the 61.8% Fibonacci retracement of the entire leg higher that started back in September of 2018. BTCUSD so far has shown no reversal sign. Price could easily fall towards $5,000 if price gets rejected at the upper wedge boundary. The 61.8% Fibonacci retracement is a Fibonacci level that we usually witness trend reversals. Will the same happen in BTCUSD?Will we see another strong 1st semester? Bulls must recapture $7,900 first and then $10,000 in order to regain control of the trend. The material has been provided by InstaForex Company - www.instaforex.com |
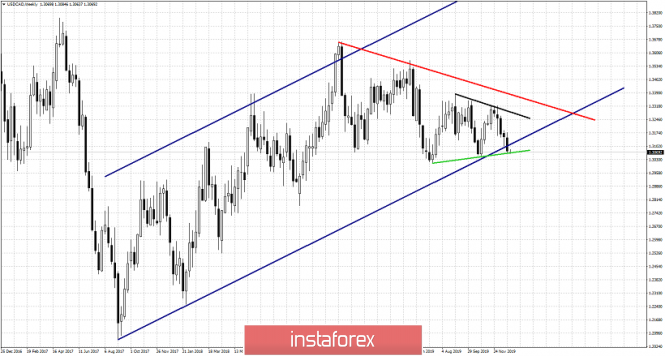
| USDCAD challenges major support Posted: 30 Dec 2019 03:51 AM PST USDCAD remains in a bearish trend. Price has reached the lower triangle boundary of 1.3070 and it is imperative for bulls to step in and react now. Price is at major technical support level and moving lower will worsen the longer-term view for USDCAD.
Red line - major resistance trend line Black line -upper triangle boundary Green line - lower triangle boundary USDCAD is at the verge of exiting the long-term bullish channel. Price has been rejected several times at the upper triangle boundary and has so far been unable to challenge the red resistance trend line. This puts the long-term bullish channel in danger. This could imply a bearish 2020 for USDCAD as price remains below 1.33. Breaking below 1.30 will be a bearish sign that could push price towards 1.27 or lower. Short-term traders should be looking at the bullish opportunities now as price is very close to critical support and a bounce is highly probable. The material has been provided by InstaForex Company - www.instaforex.com |
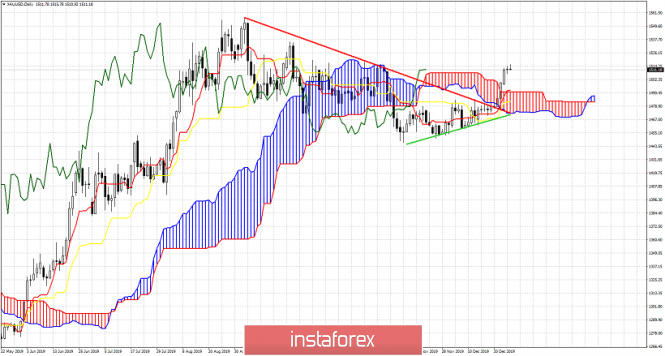
| Ichimoku cloud indicator short-term analysis of Gold for December 30, 2019 Posted: 30 Dec 2019 03:43 AM PST Gold price has given several bullish signals but bulls need to be cautious. Usually after such cloud break outs we have a back test. If this back test unfolds as usually, we should not be surprised to see Gold price retest $1,500-$1,490.
Green line - support Gold price is short-term overbought. Price justifies a pull back towards the cloud support or at least the tenkan-sen (red line indicator). The expected pull back should reach the $1,500-$1,490 area. Bouncing off that area would be another bullish sign. At current level I prefer not to add to long positions and chase the price. Patience is needed for traders to wait for a pull back. Trend is bullish as long as price is above the cloud. The material has been provided by InstaForex Company - www.instaforex.com |
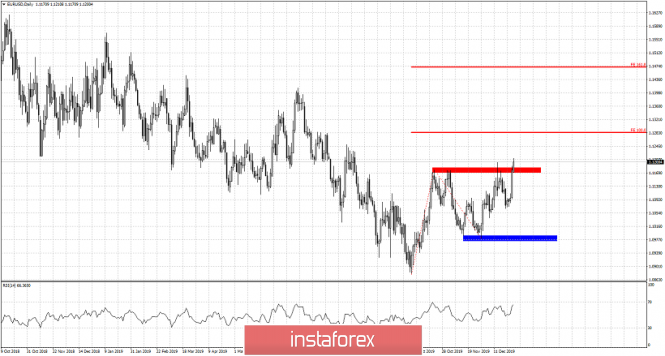
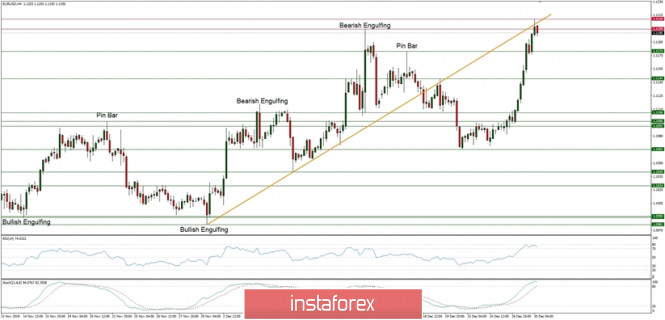
| EURUSD in short-term bullish trend to end the 4th quarter with a positive note Posted: 30 Dec 2019 03:39 AM PST EURUSD is bouncing higher recapturing key short-term and medium-term resistance levels. Price is making higher highs and higher lows bringing hope to bulls for a strong start for 2020. EURUSD has managed to break above October highs.
Blue rectangle -support EURUSD has managed to hold above the blue support area and to produce a higher low that has lead to a higher high. The RSI is confirming this high. This means that our initial target of 1.1280 has high chances of being met. Trend is bullish. Support is at 1.11-1.1070. Short-term trend remains bullish as long as we are above that area. Resistance is now found at 1.1280. Holding above 1.12 is crucial for bulls. The end of the year will most probably find EURUSD at the highest level of the last quarter, giving hopes for more upside for the 1st quarter of 2020. The material has been provided by InstaForex Company - www.instaforex.com |
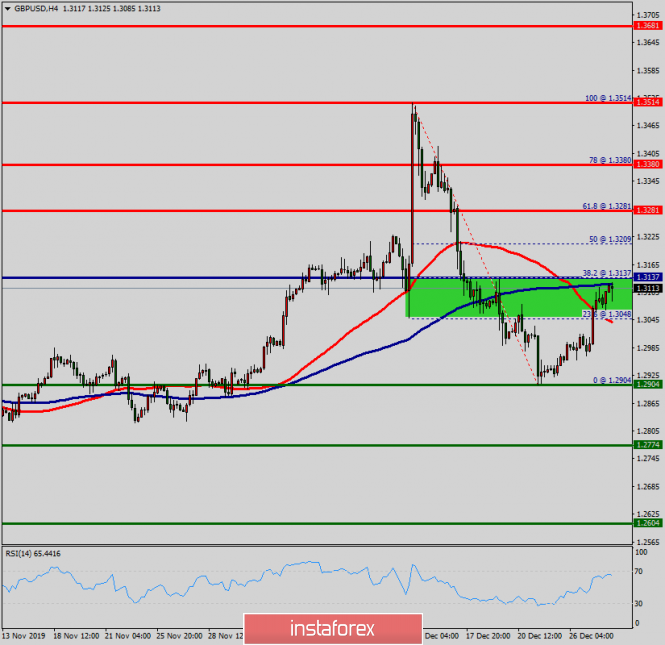
| Technical analysis of GBP/USD for December 30, 2019 Posted: 30 Dec 2019 02:01 AM PST Overview: The GBP/USD pair set above strong support at the level of 1.2904, which coincides with the double bottom in the H4 time frame. This support has been rejected for four times confirming uptrend veracity. Due to the upcoming New Year's holidays of 2020, the trading working hours of many major financial centers was changed, which affected the trading of the GBP/USD pair notably, because the market was not stable and the trend was not clear. Hence, major support is seen at the level of 1.2904 because the trend is still showing strength above it. Accordingly, the pair is still in the uptrend from the area of 1.2904 and 1.3070. The GBP/USD pair is moving in a bullish trend from the last support line of 1.2904 towards the first resistance level at 1.3137 in order to test it. The point of 1.3137 is coincided with the weekly pivot point at the same chart. This is confirmed by the RSI indicator signaling that we are still in the bullish trending market. Now, the pair is likely to begin an ascending movement to the point of 1.3137 and further to the level of 1.3281 in cmoing hours. The level of 1.3281 acted as second resistance and the double top had already set at the point of 1.3514. At the same time, if a breakout happens at the support level of 1.2904, then this scenario may be invalidated. But in overall, we still prefer the bullish scenario. The material has been provided by InstaForex Company - www.instaforex.com |
| Technical analysis of ETH/USD for 30/12/2019: Posted: 29 Dec 2019 11:41 PM PST Crypto Industry News: Ethereum co-founder Vitalik Buterin has recently published an alternative proposal for an early transition to Ethereum 2.0. In a post from December 23 at the ETH Research forum, Buterin defined an "accelerated schedule" for the transition from Ethereum 1.0 to Ethereum 2.0 through a new type of ETH validator called "eth1-friendly validators". According to Vitalik, this new alternative proposal will require less "re-analysis" on the web. "In particular, it requires stateless clients, but does NOT require stateless miners and networking, and therefore requires much less re-analysis to achieve this," he writes. At the same time, Vitalik noticed that the proposed alternative transition would still be possible using a procedure similar to the previously described transition to Ethereum 2.0. Ethereum 2.0 is an important network update in the Ethereum Blockchain that was designed to transfer the current Proof-of-Work consensus algorithm to Proof-of-Stake. As soon as the Ethereum chain transforms into a PoS consensus, block validation will be passed from miners to special network validators. The first stage of the Ethereum transition to Ethereum 2.0 is to take place on January 3, 2020. According to Vitalik's new alternative proposal, eth1-friendly validators can be expected to maintain both the old Ethereum 1.0 node and the Ethereum 2.0 navigation chain. Technical Market Overview: The ETH/USD pair has been seen rallying higher towards the technical resistance located at the level of $136.98 but did not quite break through it yet. The high was made at the level of $136.64 and the candle that was used to make this high looks like a Pin Bar candlestick pattern. The bulls have temporary control of the market, but it might not last for long as the price is getting closer to the key technical resistance area. Nevertheless, it is worth to keep an eye on the current developments of the Ethereum market. Weekly Pivot Points: WR3 - $156.40 WR2 - $145.89 WR1 - $141.32 Weekly Pivot Point - $130.81 WS1 - $125.47 WS2 - $114.97 WS3 - $109.88 Trading Recommendations: The best strategy in the current market conditions is to trade with the larger timeframe trend, which is down. All the shorter timeframe moves are still being treated as a counter-trend correction inside of the downtrend. When the wave 2 corrective cycles are completed, the market might will ready for another wave up.
|
| Technical analysis of BTC/USD for 30/12/2019: Posted: 29 Dec 2019 11:34 PM PST Crypto Industry News: The Uzbek government has banned its citizens from buying cryptocurrencies. According to a local information point, the National Project Management Agency has banned citizens from buying cryptocurrencies, even on existing exchanges. This decision is a surprise to many, because the country has previously shown relative gentleness against digital currencies. In September 2018, the government of the country signed a memorandum of understanding to regulate and establish a license for cryptographic exchanges, mining operations and ICOs. In the same month, Uzbekistan's president Shavkat Mirziyoyev ordered the creation of the state blockchain development fund called "Digital Trust". Last July, he also signed a decree on the development and integration of Blockchain technology with the country's public administration. While the new regulation prohibits citizens from buying or selling cryptocurrencies, it gives some limited commercial rights to existing cryptocurrency owners. Owners who are citizens of Uzbekistan can sell their current investments on two licensed exchanges after completing Know Your Customer procedures to avoid the possibility of money laundering. As for cryptographic assets whose origin cannot be proved, transferring or holding them in the country was considered illegal. The Finance Magnates report notes that this right may prove ineffective given that citizens can use a virtual private network - or VPN - to bypass the ban and access foreign cryptocurrency trading platforms. Technical Market Overview: The BTC/USD pair has been trading inside of a tight range during the weekend. The range is located between the levels of $7,461 - $7,195 and at the top of this range another Pin Bar candlestick pattern has been made, which might indicate a possibility of a wave down. The key technical resistance is still located at the level of $7,601, so any rally higher must break through this level. On the other hand, the key technical support is seen at the level of $6,938. Weekly Pivot Points: WR3 - $8,243 WR2 - $7,942 WR1 - $7,641 Weekly Pivot Point - $7,288 WS1 - $6,995 WS2 - $6,660 WS3 - $6,345 Trading Recommendations: The best strategy in the current market conditions is to trade with the larger timeframe trend, which is still down. All the shorter timeframe moves are still being treated as a counter-trend correction inside of the uptrend. When the wave 2 corrective cycles are completed, the market might will ready for another impulsive wave up of a higher degree and uptrend continuation.
|
| Technical analysis of GBP/USD for 30/12/2019: Posted: 29 Dec 2019 11:21 PM PST Technical Market Overview: The GBP/USD pair has broken out form the short-term channel around the level of 1.3025 and is rallying towards the 38% of the Fibonacci retracement located at the level of 1.3137. Currently, the market is trading inside of a narrow resistance zone located between the levels of 1.3101 - 1.3131, so any breakout higher will directly expose the Fibonacci retracement. Please notice, the strong and positive momentum which is behind the move up, but please notice as well the overbought market conditions that may lead to the corrective cycle. The nearest technical support is located at the level of 1.3012. Weekly Pivot Points: WR3 - 1.3395 WR2 - 1.3256 WR1 - 1.3182 Weekly Pivot Point - 1.3041 WS1 - 1.2971 WS2 - 1.2819 WS3 - 1.2756 Trading Recommendations: The best strategy for current market conditions is to trade with the larger timeframe trend, which is up. All downward moves will be treated as local corrections in the uptrend. In order to reverse the trend from up to down, the key level for bulls is seen at 1.2756 and it must be clearly violated. The key long-term technical support is seen at the level of 1.2231 - 1.2224 and the key long-term technical resistance is located at the level of 1.3509.
|
| Technical analysis of EUR/USD for 30/12/2019: Posted: 29 Dec 2019 11:14 PM PST Technical Market Overview: After the deep retracement to the level of 61% Fibonacci located at 1.1065 the EUR/USD pair has been rallying towards the swing high located at the level of 1.1199. This high has been violated and a new local high was made at the level of 1.1210. Please notice, the bulls are now testing the short-term trendline resistance from below as well as the level of 1.1210 is very close to this line. Moreover, the rally might be terminated soon, despite the strong and positive momentum, the market is in the overbought conditions. The nearest technical support is seen at the level of 1.1174 and the next technical resistance is located at the level of 1.1232.Although the higher timeframes trend remains bearish, the global investors must take into account, that the EUR/USD might be finally breaking up from the multi-month Ending Diagonal pattern. Weekly Pivot Points: WR3 - 1.1349 WR2 - 1.1265 WR1 - 1.1228 Weekly Pivot - 1.1151 WS1 - 1.1114 WS2 - 1.1029 WS3 - 1.0994 Trading Recommendations: The best strategy for current market conditions is to trade with the larger timeframe trend, which is down. All upward moves will be treated as local corrections in the downtrend. The downtrend is valid as long as it is terminated or the level of 1.1445 clearly violated. There is an Ending Diagonal price pattern visible on the larget timeframes that indicate a possible downtrend termination soon. The key short-term levels are technical support at the level of 1.1040 and the technical resistance at the level of 1.1267.
|
| Elliott wave analysis of GBP/JPY for December 30 - 2019 Posted: 29 Dec 2019 09:51 PM PST
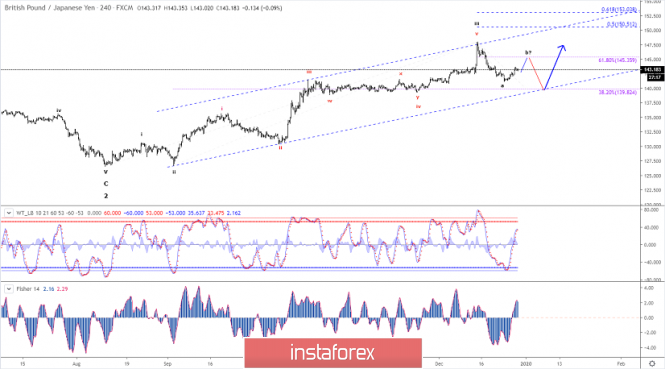
GBP/JPY continues following the expected path higher in wave b. When the wave was completed just below our expected target-zone between 141.36 - 141.42 (the low was seen at 141.14), GBP/JPY moved higher. The corrective rally took over wave b. The ideal target for this b wave is seen at 145.36. From this point a new decline towards 139.82 should be seen in wave c of the zig-zag correction. In a short-term perspective, we expect a minor corrective drop to 142.69 and even closer to 142.39. The next rally to 145.36 can complete wave b and set the stage for a new decline in wave c towards 139.82. R3: 144.44 R2: 143.81 R1: 143.46 Pivot: 143.35 S1: 142.92 S2: 142.69 S3: 142.39 Trading recommendation: We are long 50% GBP from 141.50 and we have placed our stop at the break-even level. And we will take profit and sell GBP at 145.20. The material has been provided by InstaForex Company - www.instaforex.com |
| Elliott wave analysis of EUR/JPY for December 30 - 2019 Posted: 29 Dec 2019 09:41 PM PST
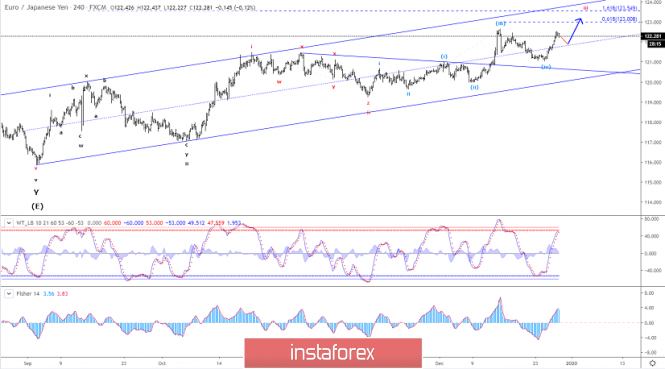
EUR/JPY has rallied nicely from the blue wave (iv) low at 121.06 and is headed for our long-term target at 123.55. In a short-term perspective, we will be looking for a minor set-back to 121.99 before the next rally towards 123.00 and the target of 123.55. That is expected to complete red wave iii and set the stage for a more pro-longed correction in red wave iv. But now, keep you attention to the upside movement after a minor corrective decline to 121.99. R3: 123.00 R2: 122.67 R1: 122.46 Pivot: 122.30 S1: 122.26 S2: 121.99 S3: 121.85 Trading recommendation: We are long EUR from 120.25 and we have moved our stop higher to 121.40. The material has been provided by InstaForex Company - www.instaforex.com |
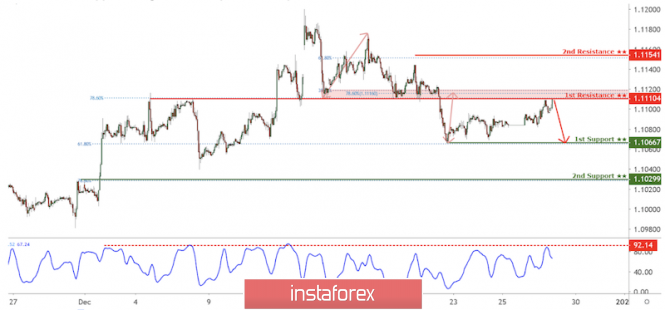
| EUR/USD approaching resistance, potential drop! Posted: 29 Dec 2019 09:39 PM PST
Trading Recommendation Entry: 1.11104 Reason for Entry: Horizontal overlap resistance, 38.2% Fibonacci retracement, 78.6% Fibonacci extension Take Profit : 1.10667 Reason for Take Profit: horizontal swing low support, 61.8% Fibonacci retracement Stop Loss: 1.11541 Reason for Stop loss: Horizontal swing high resistance, 61.8% Fibonacci retracement The material has been provided by InstaForex Company - www.instaforex.com |
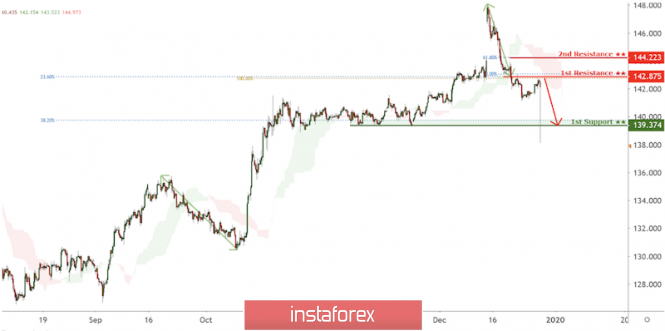
| GBP/JPY approaching resistance, potential drop! Posted: 29 Dec 2019 09:38 PM PST
Trading Recommendation Entry: 142.875 Reason for Entry: breakout level Take Profit : 1.27253 Reason for Take Profit: 38.2% Fibonacci retracement, horizontal swing low support Stop Loss: 144.223 Reason for Stop loss: Horizontal swing high resistance, 61.8% Fibonacci retracement The material has been provided by InstaForex Company - www.instaforex.com |
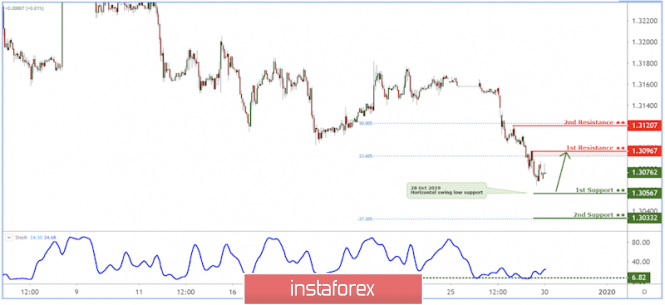
| USD/CAD testing support. Bounce expected! Posted: 29 Dec 2019 09:36 PM PST
Trading Recommendation Entry: 1.30567 Reason for Entry: Long term horizontal swing low Take Profit : 1.30967 Reason for Take Profit: 23.6% Fibonacci retracement Stop Loss: 1.30332 Reason for Stop loss: -27.2% Fibonacci Retracement The material has been provided by InstaForex Company - www.instaforex.com |
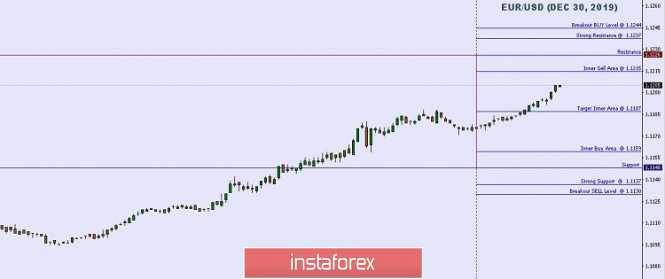
| Technical analysis: Important Intraday Levels For EUR/USD, December 30, 2019 Posted: 29 Dec 2019 07:26 PM PST
|
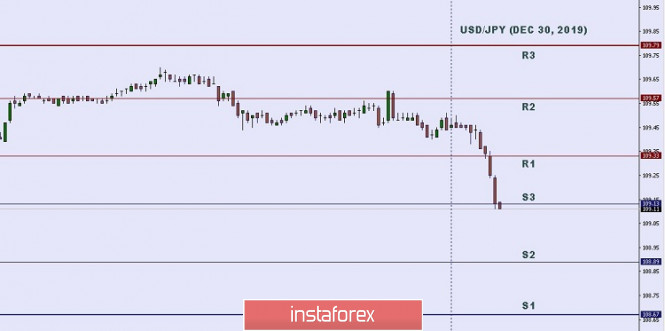
| Technical analysis: Important Intraday Levels for USD/JPY, December 30, 2019 Posted: 29 Dec 2019 07:24 PM PST
In Asia, Japan will not release any economic data today, while the US will publish some economic reports such as Pending Home Sales m/m, Chicago PMI, Prelim Wholesale Inventories m/m, and Goods Trade Balance. So there is a probability the USD/JPY pair will move with low to medium volatility during this day. TODAY'S TECHNICAL LEVELS: Resistance.3 : 110.79. Resistance. 2: 109.57. Resistance. 1: 109.33. Support. 1: 109.13. Support. 2: 108.89. Support. 3: 108.67. (Disclaimer) The material has been provided by InstaForex Company - www.instaforex.com |
| You are subscribed to email updates from Forex analysis review. To stop receiving these emails, you may unsubscribe now. | Email delivery powered by Google |
| Google, 1600 Amphitheatre Parkway, Mountain View, CA 94043, United States | |
No comments:
Post a Comment