
Forex analysis review |
- Forecast for EUR/USD on January 28, 2020
- Forecast for GBP/USD on January 28, 2020
- Forecast for USD/JPY on January 28, 2020
- Medium-term cross-EUR/AUD growth outlook
- USD/CAD further push up expected!
- USD/CHF approaching support, potential bounce!
- EUR/USD approaching support, potential bounce!
- Fractal analysis of the main currency pairs on January 28
- Dangerous epidemic swept the markets
- EUR/USD. Alarmists a main ally of the US currency
- GBP/USD. January 27. Results of the day. Analysts are certain: the Bank of England will leave the rate unchanged at 0.75%
- EUR/USD. January 27. Results of the day. Boring Monday, Trump's new accusations, overblown Coronavirus
- Oil and EURUSD: OPEC tries to stop the fall of oil. Optimism for German economic recovery earlier this year is gradually
- EUR/USD: euro threatened by the epidemic
- GBP/USD: Great Britain remains attractive for investors, bulls and bears on the pound eager to fight
- Gold price consolidates, implyig higher chances of an upward continuation.
- USDCAD reaches our target but has still room to the upside
- EUR/USD. January 27. The pair continues to fall and only 35 points remain until the last target
- GBP/USD. January 27. The trading idea is being worked out. Target - 1.2995. Positive statistics from Britain did not prevent
- Evening review for EURUSD on 01/27/2020. The market is thinking about the epidemic
- GBP/USD: plan for the US session on January 27. The growth of the pound turned out to be a trick for speculators. The bulls
- EUR/USD: plan for the US session on January 27. The euro remained under pressure, however, the chance to return to the market
- January 27, 2020 : EUR/USD Intraday technical analysis and trade recommendations.
- January 27, 2020 : GBP/USD Intraday technical analysis and trade recommendations.
- Analysis of EUR/USD and GBP/USD for January 27. Business activity indices did not save either the euro or the pound from
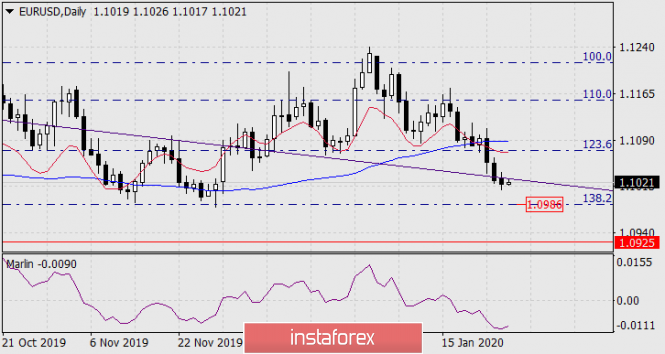
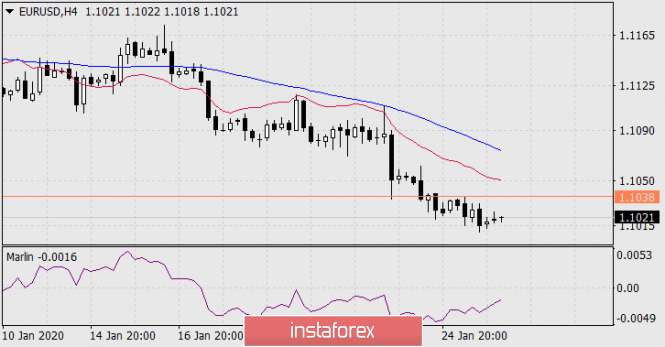
| Forecast for EUR/USD on January 28, 2020 Posted: 27 Jan 2020 08:10 PM PST EUR/USD Unexpectedly weak data on new home sales in the US came out on Monday - the December report showed only 694 thousand against the forecast of 730 thousand, November data was revised down from 719 thousand to 697 thousand. Against the backdrop of general fears of the Chinese coronavirus, the stock index S&P 500 decreased by -1.57%, yield on 10-year US government bonds fell from Friday 1.8686% to 1.612%. The dollar is now strengthening as a safe haven currency. The euro fell by six points. Today, US data has a second chance to appear at its best: the forecast for durable goods orders for December is 1.2%, the Conference Board consumer confidence index for January is expected to grow from 126.5 to 128.2 points. On the daily chart, the price consolidated below the blue line of the price channel, the path to the target 1.0986 at the Fibonacci level of 138.2% is free. Overcoming the level opens the second target of 1.0925 - the lows of September 9 and 12 of last year. On the H4 chart, the growing Marlin indicator does not cause any concern so far, without the risk of a price growth, it can rise to the neutral line, which corresponds to a price increase to about 1.1038 or a little higher. The material has been provided by InstaForex Company - www.instaforex.com |
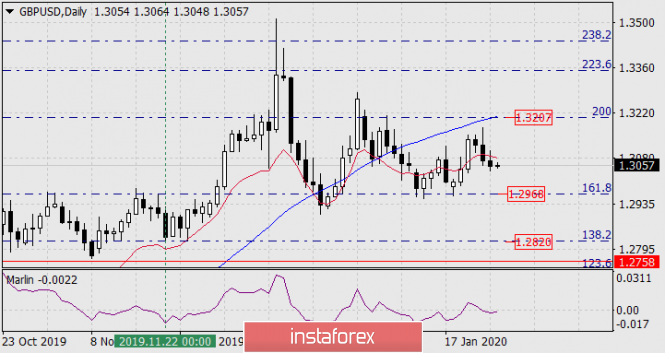
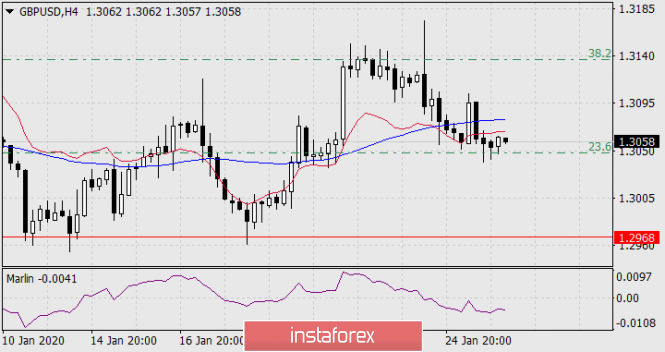
| Forecast for GBP/USD on January 28, 2020 Posted: 27 Jan 2020 08:09 PM PST GBP/USD The pound fell by 16 points on Monday, gaining a foothold on the daily chart below the balance line indicator. The signal line of the Marlin oscillator has been staying in the negative zone since yesterday. The goals remain the same: 1.2968 for the Fibonacci level of 161.8% and 1.2820 - the Fibonacci level of 138.2%. On a four-hour chart, the price consolidated below both indicator lines - the balance and MACD lines, staying at the correction level of 23.6%. The market has only one reason for its reluctance to sell the pound - to wait for the Bank of England's decision on monetary policy on Thursday, or rather, Mark Carney's explanation of the regulator's intentions, since a possible rate cut in the near future has already been mentioned. Here an unexpected positive (rejection of such an intention) can raise the price to the Fibonacci level of 200.0% on a daily scale (1.3207). |
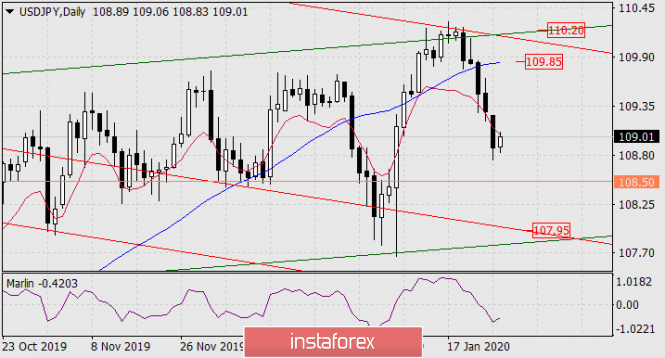
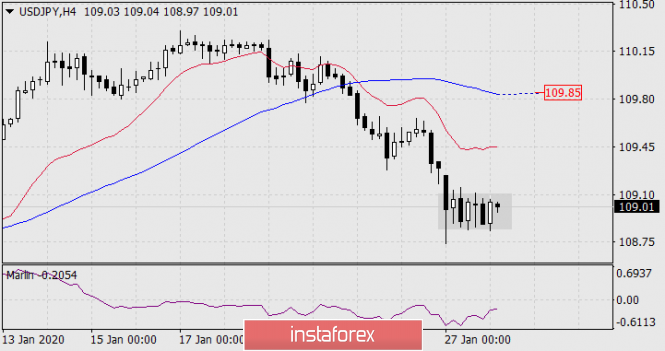
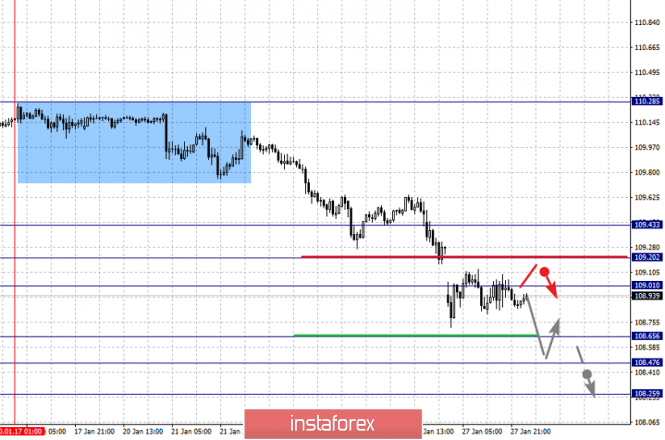
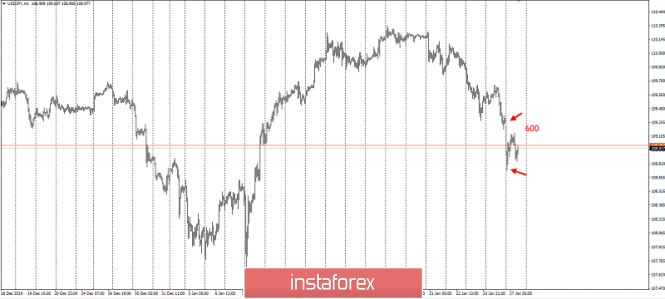
| Forecast for USD/JPY on January 28, 2020 Posted: 27 Jan 2020 08:06 PM PST USD/JPY Due to the Asian nature of the observed market fears, the Japanese yen may not completely fulfill the role of a safe haven currency. Since cases of new coronavirus diseases have appeared in Japan, the yen may weaken against the dollar. Yesterday, the USD/JPY pair fell by 37 points, the price overcame the balance line support on the daily chart, but the price has not fully consolidated below it, for this the current day should also close below it. The Marlin oscillator is in the decline zone. The immediate goal of 108.50 as a strong record level remains relevant, but the technical picture on the lower chart warns of a likely reversal. The price has formed a consolidation on H4, causing an ambiguous interpretation. Visually, this formation indicates the intention of the price to continue to decline, but its internal structure, based on high trading volumes (only January 8 was higher), indicates the probable closure of short positions, and when some positive, or vice versa, strong negative news arrives, investors will start to purchase the dollar. The daily target of 109.85 on the MACD line coincides with the MACD level of the lower H4 chart. Uncertainty for this currency pair is strong. |
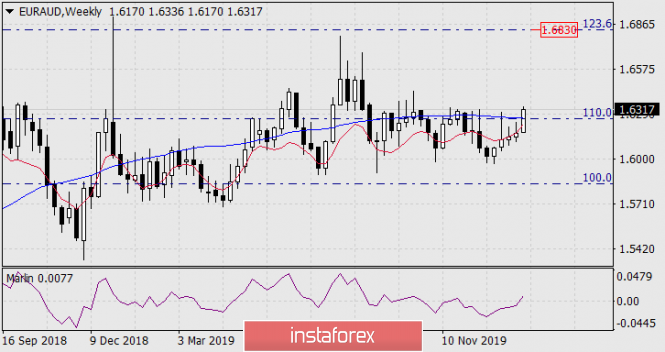
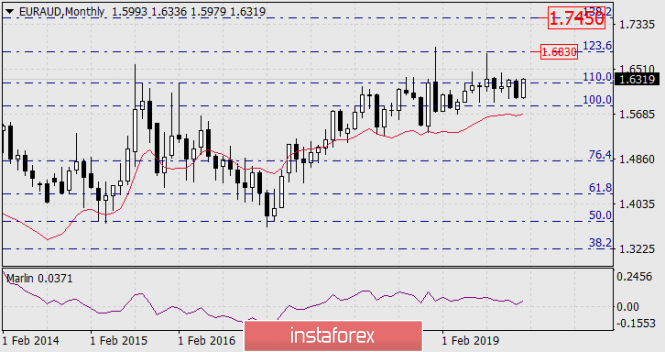
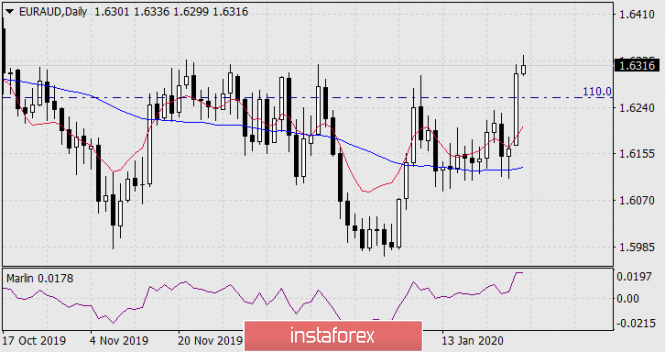
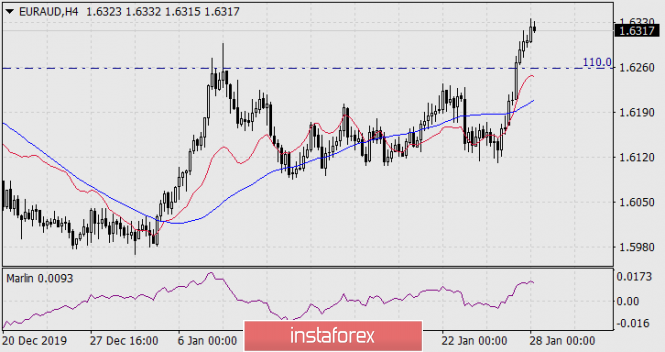
| Medium-term cross-EUR/AUD growth outlook Posted: 27 Jan 2020 08:04 PM PST EUR/AUD On the weekly chart, the price has overcome strong resistance at the point where the MACD line coincides with the Fibonacci level of 110.0%. The base branch for the grid is defined by the movement from August 2012 to January 2014. The signal line of the Marlin oscillator broke through the boundary with the zone of predominance of the bulls. Growth targets: 1.6830 - the Fibonacci reaction level is 123.6%, 1.7450 - the Fibonacci level is 138.2%, which coincides with the peak of August 2007: On the daily chart, the price broke above the line of balance and MACD. Marlin in a strong growing position: There is also a clear increase in all indicators on the H4 chart: |
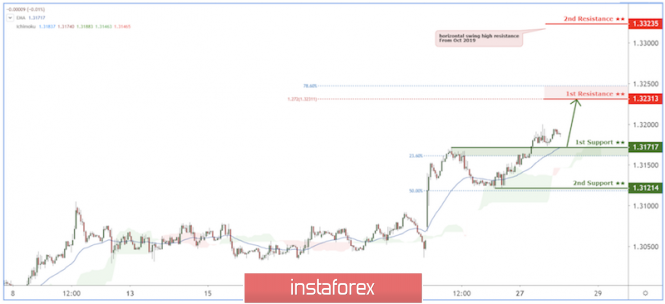
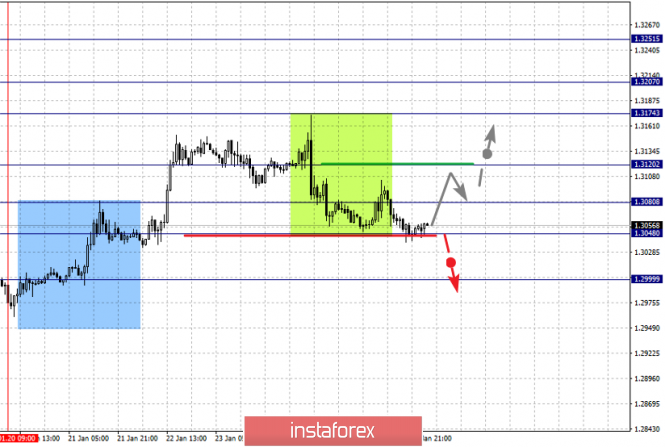
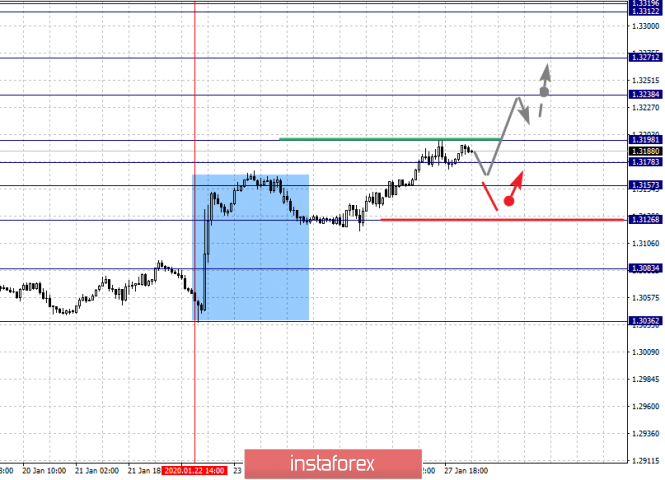
| USD/CAD further push up expected! Posted: 27 Jan 2020 07:09 PM PST
Trading Recommendation Entry: 1.31717 Reason for Entry: 23.6% Fibonacci retracement, Exponential Moving Average resistance. Take Profit : 1.32313 Reason for Take Profit: 78.6% Fibonacci retracement, 127.20% Fibonacci extension. Stop Loss: 1.31214 Reason for Stop loss: 50% Fibonacci retracement The material has been provided by InstaForex Company - www.instaforex.com |
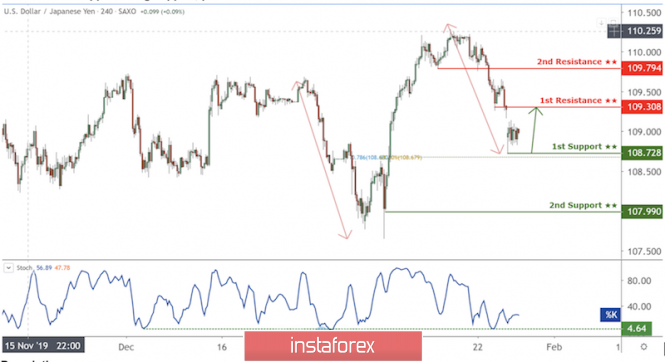
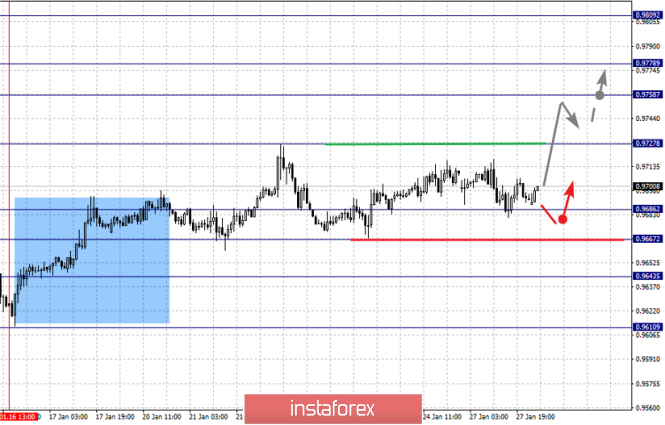
| USD/CHF approaching support, potential bounce! Posted: 27 Jan 2020 06:53 PM PST
Trading Recommendation Entry: 108.73 Reason for Entry: Horizontal swing low support, 78.6% fibonacci extension, 61.8% Fibonacci retracement Take Profit :109.31 Reason for Take Profit: Horizontal pullback resistance Stop Loss: 107.99 Reason for Stop loss: Horizontal swing low support The material has been provided by InstaForex Company - www.instaforex.com |
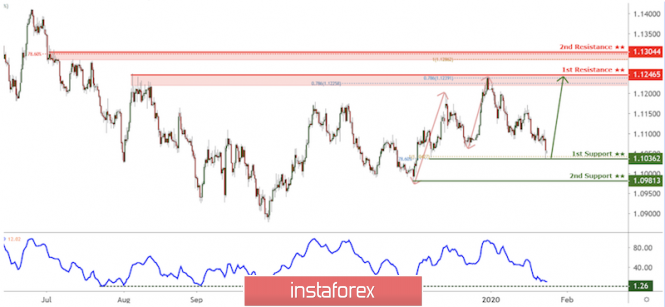
| EUR/USD approaching support, potential bounce! Posted: 27 Jan 2020 06:51 PM PST
Trading Recommendation Entry: 1.10362 Reason for Entry: 78.6% fibonacci retracement, 100% fibonacci extension, horizontal swing low support Take Profit : 1.12465 Reason for Take Profit: Horizontal swing high resistance, 78.6% fibonacci extension Stop Loss: 1.09813 Reason for Stop loss: horizontal swing low support The material has been provided by InstaForex Company - www.instaforex.com |
| Fractal analysis of the main currency pairs on January 28 Posted: 27 Jan 2020 05:30 PM PST Forecast for January 28: Analytical review of currency pairs on the scale of H1:
For the euro / dollar pair, the key levels on the H1 scale are: 1.1084, 1.1052, 1.1035, 1.0995, 1.0964 and 1.0945. Here, we are following the descending structure of January 16. The continuation of the movement to the bottom is expected after the breakdown of the level of 1.0995. In this case, the target is 1.0964. For the potential value for the bottom, we consider the level of 1.0945. Upon reaching this level, we expect a pullback to the top. Short-term upward movement is possibly in the range of 1.1035 - 1.1052. The breakdown of the last value will lead to an in-depth correction. Here, the goal is 1.1084. This level is a key support for the downward structure. We expect the initial conditions for the upward cycle to be formed before it. The main trend is the descending structure of January 16 Trading recommendations: Buy: 1.1035 Take profit: 1.1051 Buy: 1.1054 Take profit: 1.1082 Sell: 1.0995 Take profit: 1.0970 Sell: 1.0964 Take profit: 1.0947
For the pound / dollar pair, the key levels on the H1 scale are: 1.3251, 1.3207, 1.3174, 1.3120, 1.3080, 1.3048 and 1.2999. Here, we continue to follow the upward cycle of January 20. The continuation of the movement to the top is expected after the breakdown of the level of 1.3120. In this case, the first target is 1.3174. Short-term upward movement is expected in the range 1.3174 - 1.3207. The breakdown of the latter value will lead to movement to a potential target - 1.3251. We expect a pullback to the bottom from this level. Short-term downward movement is possibly in the range of 1.3080 - 1.3048. The breakdown of the latter value will lead to the formation of a downward structure. In this case, the potential target is 1.2999. The main trend is the upward structure of January 20, the correction stage Trading recommendations: Buy: 1.3120 Take profit: 1.3172 Buy: 1.3176 Take profit: 1.3207 Sell: 1.3046 Take profit: 1.3000 Sell: Take profit:
For the dollar / franc pair, the key levels on the H1 scale are: 0.9809, 0.9778, 0.9758, 0.9727, 0.9686, 0.9667 and 0.9643. Here, we are following the development of the ascending structure of January 16. The continuation of the movement to the top is expected after the breakdown of the level of 0.9727. In this case, the target is 0.9758. Short-term upward movement, as well as consolidation is in range of 0.9758 - 0.9778. We consider the level of 0.9809 to be a potential value for the upward movement; We expect a pullback to the bottom upon reaching this level. Short-term downward movement is possibly in the range of 0.9686 - 0.9667. The breakdown of the latter value will lead to an in-depth correction. Here, the target is 0.9643. This level is a key support for the top. The main trend is the upward cycle of January 16 Trading recommendations: Buy : 0.9727 Take profit: 0.9756 Buy : 0.9758 Take profit: 0.9776 Sell: 0.9665 Take profit: 0.9645 Sell: 0.9640 Take profit: 0.9616
For the dollar / yen pair, the key levels on the scale are : 109.43, 109.20, 109.01, 108.65, 108.47 and 108.25. Here, we are following the downward cycle of January 17. Short-term downward movement is possible in the range of 108.56 - 108.47. The breakdown of the last value will lead to a movement to a potential target - 108.25, and upon reaching this level, we expect a pullback to the top. Short-term upward movement is possibly in the range of 109.01 - 109.20. The breakdown of the last value will lead to an in-depth correction. Here, the target is 109.43. This level is a key support for the downward structure. Main trend: potential downward structure of January 17 Trading recommendations: Buy: 109.01 Take profit: 109.20 Buy : 109.23 Take profit: 109.40 Sell: 108.65 Take profit: 108.48 Sell: 108.45 Take profit: 108.25
For the Canadian dollar / US dollar pair, the key levels on the H1 scale are: 1.3312, 1.3271, 1.3238, 1.3198, 1.3178, 1.3157 and 1.3126. Here, we are following the development of the upward cycle of January 22. The continuation of the movement to the top is expected after the breakdown of the level of 1.3198. In this case, the target is 1.3238. Price consolidation is near this level. There is a short-term upward movement in the range of 1.3238 - 1.3271. Hence, a reversal to a correction is also possible. The potential value for the top is considered to be the level of 1.3312. Short-term downward movement is possibly in the range of 1.3178 - 1.3157. The breakdown of the last value will lead to an in-depth correction. Here, the target is 1.3126. This level is a key support for the top. The main trend is the local ascending structure of January 22. Trading recommendations: Buy: 1.3198 Take profit: 1.3236 Buy : 1.3240 Take profit: 1.3270 Sell: 1.3178 Take profit: 1.3158 Sell: 1.3155 Take profit: 1.3130
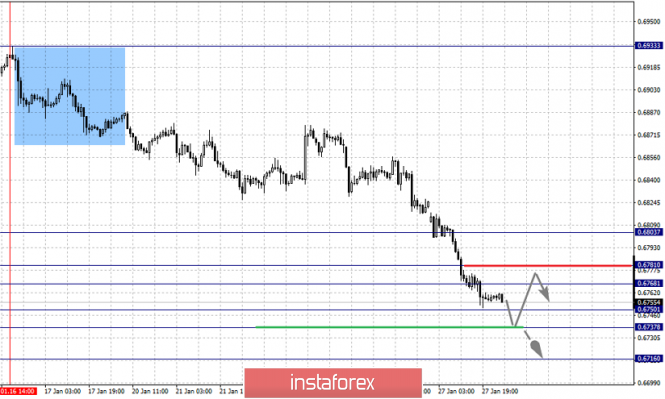
For the Australian dollar / US dollar pair, the key levels on the H1 scale are : 0.6803, 0.6781, 0.6768, 0.6750, 0.6737 and 0.6716. Here, we are following the development of the descending structure of January 16. Short-term downward movement is expected in the range 0.6750 - 0.6737. The breakdown of the latter value will lead to movement to a potential target - 0.6716. We expect a pullback to the top from this level. Short-term upward movement is expected in the range of 0.6768 - 0.6781. The breakdown of the last value will lead to an in-depth correction. Here, the target is 0.6803. This level is a key support for the bottom and before it, we expect the initial conditions for the upward cycle to be formed. The main trend is the descending structure of January 16 Trading recommendations: Buy: 0.6768 Take profit: 0.6780 Buy: 0.6783 Take profit: 0.6800 Sell : 0.6750 Take profit : 0.6737 Sell: 0.6736 Take profit: 0.6716
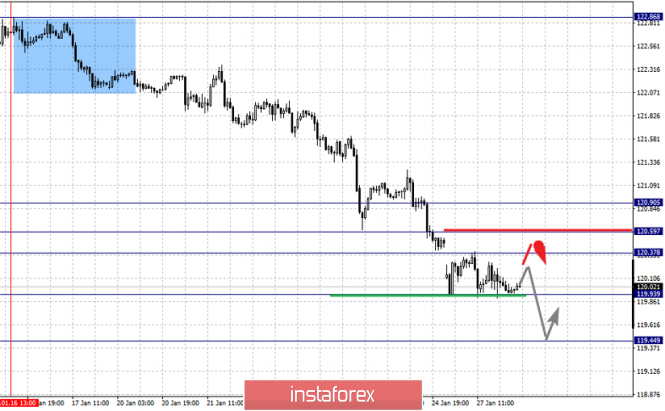
For the euro / yen pair, the key levels on the H1 scale are: 120.90, 120.59, 120.37, 119.93 and 119.44. Here, we are following the descending structure of January 16. The continuation of movement to the bottom is expected after the breakdown of the level of 119.90. In this case, the potential target is 119.44. We expect a pullback in correction upon reaching this level. Short-term upward movement is possibly in the range of 120.37 - 120.59. The breakdown of the last value will lead to an in-depth correction. Here, the goal is 120.90. This level is a key support for the downward structure. The main trend is the descending structure of January 16 Trading recommendations: Buy: 120.37 Take profit: 120.57 Buy: 120.61 Take profit: 120.90 Sell: 119.90 Take profit: 119.48 Sell: Take profit:
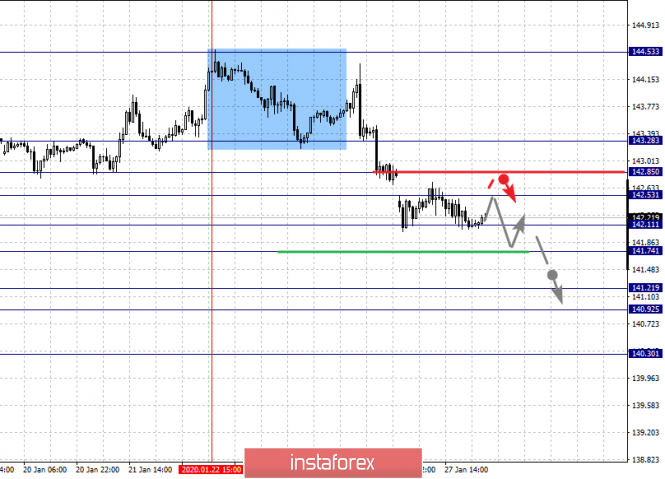
For the pound / yen pair, the key levels on the H1 scale are : 143.28, 142.85, 142.53, 142.11, 141.74, 141.21, 140.92 and 140.30. Here, we are following the development of the downward cycle of January 22. Short-term downward movement is expected in the range of 142.11 - 141.74. The breakdown of the last value should be accompanied by a pronounced downward movement. Here, the goal is 141.21. Price consolidation is in the range of 141.21 - 140.92. For the potential value for the bottom, we consider the level of 140.30. We expect a pullback to the top upon reaching this level. Short-term upward movement is expected in the range of 142.53 - 142.85. The breakdown of the last value will lead to an in-depth correction. Here, the goal is 143.28. This level is a key support for the downward movement. The main trend is the descending structure of January 22 Trading recommendations: Buy: 142.53 Take profit: 142.85 Buy: 142.87 Take profit: 143.28 Sell: 142.10 Take profit: 141.76 Sell: 141.72 Take profit: 141.25 The material has been provided by InstaForex Company - www.instaforex.com |
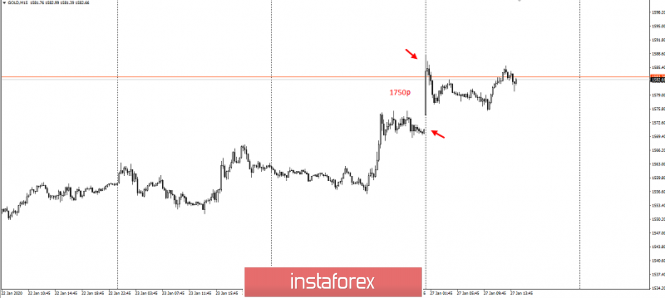
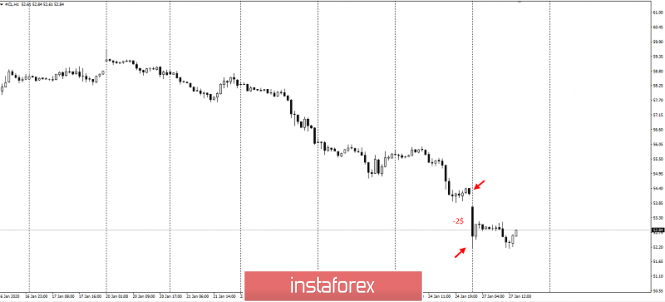
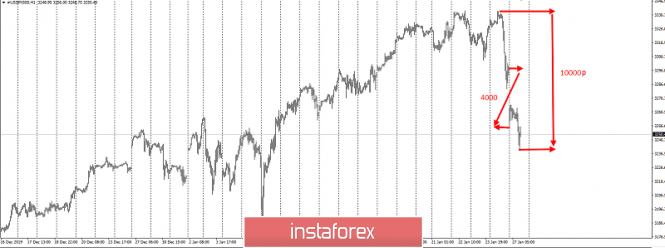
| Dangerous epidemic swept the markets Posted: 27 Jan 2020 04:04 PM PST Good evening, dear traders! Congratulations on the start of a new trading week. The most discussed news last weekend was the new data on the dynamics of the spread of coronavirus in China and other countries. There are already thousands of people who are infected. Therefore, the head of the PRC, Xi Jinping himself, gave comments, and they were joyless: "The spread of the new coronavirus in China is accelerating..." And so, emergency mode was introduced in 25 regions including Shanghai and Beijing. There were 41 deaths, while more than 1300 people were infected. The peak of news declined on the weekend, when they showed falling people right on the streets on the television channels. I remind you that it is New Year's holidays in China. In the currency exchange market, the most affected pair was USD/JPY, which lost half a dollar in the declining market over the weekend, opening upside down and so on in the falling market. This movement is caused by the departure of investors in the yen amid fears of the uncertainty of the Chinese economy in connection with a new bacteriological threat. Gold on fears is always in demand. Over the weekend, a troy ounce added 1750 p: At the same time, impressive losses were suffered by the declining oil. China is the largest energy consumer. Over the weekend, the barrel also lost another $ 2 and is now trading at around $ 52: The SNP500 index lost an incredible 10,000 points in two days: In these conditions, I recommend that you refrain from opening large positions, as no one knows how the situation will develop. Moreover, staying at your own in such a market is far from the worst option. Have a successful trading and control risks! The material has been provided by InstaForex Company - www.instaforex.com |
| EUR/USD. Alarmists a main ally of the US currency Posted: 27 Jan 2020 02:57 PM PST Panic sentiment continues to dominate the foreign exchange market. The deadly coronavirus from China has become the main topic of discussion in the world press - the news flow resembles a report from the front - today there are so many dead, so many in critical condition, so many "wounded", that is, infected. All these indicators are growing almost exponentially, complementing the already dismal fundamental picture. And if some "crosses" still ignore the current situation, then dollar pairs - all without exception - succumbed to panic. Of course, there are also differences here. For example, the pairs: AUD/USD, NZD/USD, and USD/JPY reacted most strongly. The euro-dollar pair "holds the defense" throughout the day, not allowing the bears to pull down the price in the region of the ninth figure. But sellers continue to put pressure, and if the situation with the virus epidemic does not change in the coming hours/days, the pair will probably come to the nearest support level of 1.0940 (this is the bottom line of the BB indicator on the weekly chart). Macroeconomic reports today only strengthened the bearish sentiment for the pair. In particular, the IFO indicator of the business environment in Germany came out in the red zone, not reaching the forecasted values - instead of rising to the level of 97.1, the indicator slowed to 95 points in January. The decline itself is low, but amid conflicting PMI data and the dovish comments of ECB representatives (Christine Lagarde and Olli Rehn), today's figures also had a negative impact on the single currency. It is worth noting that, according to the comments of IFO experts, the fact of a deadly virus epidemic in China was not reflected in this report. Therefore, it can be assumed that the next report will be even more disappointing, putting pressure on the euro. It is noteworthy that EUR/USD traders ignored the fact that the German government revised its forecast for GDP growth for the current year upward (to 1.1% of one percent). This fact could support the pair, but not in the circumstances. It is also worth adding that even the political factor did not help the European currency today. It became known that the right-wing populist party Matteo Salvini, whose representatives speak for Italexit (in one form or another), lost the local elections. In two key regions, the right did not find support from Italians. Against the background of the rally of Italian bonds, the EUR/USD pair slightly corrected, but the single currency was again under pressure during the US session. But the dollar, on the contrary, demonstrates "resistance to stress" to weak macroeconomic reports. For example, sales in the primary US housing market collapsed to five-month lows in December: with a forecast of growth of up to 730 thousand, the indicator fell to 694 thousand real estate properties. However, the US currency is now completely ignoring macroeconomic statistics, taking advantage of significant demand from investors throughout the market. Given recent events, it can be assumed that the dollar will ignore the January meeting of the Fed, which will be held this Wednesday. If the situation with the spread of the virus does not decline (which is unlikely in the near future), the market will not pay attention to the possibly dovish theses of the representatives of the US regulator. But optimistic estimates may provide additional support to the greenback. In other words, until the panic in the currency market subsides, the dollar will "skim the cream": negative factors regarding the US currency will be ignored by traders, and positive factors will increase greenback growth. But in such a situation, there is also the flip side of the coin: as soon as the situation reaches its climax and the downward dynamics begins (as it was during the SARS epidemic), the "tension spring" will bounce in the opposite direction, and all the negative fundamental factors that are currently ignored by the market, immediately turn against the dollar. The main difficulty of the situation is that no one knows when exactly this will happen. To date, anti-risk sentiment is still growing - in proportion to the number of infected and dead from the 2019-nCoV virus. The latest news from world exchanges (primarily in the Asian region) is adding fuel to the fire. Companies associated with tourism and passenger transportation suffer significant losses. Among the victims - and Asian civil aviation companies. In China, the construction market is slowing, as well as the services market and the entertainment industry. Copper and iron ore prices are falling, as China is the world's largest consumer of raw materials, including metals. Thus, the situation in the foreign exchange market is both predictable and unpredictable. On the one hand, it is safe to say that panic will push the dollar up, and the EUR/USD pair, respectively, down. But on the other hand, it is impossible to predict how long panic will prevail in the market. In such conditions, it is advisable for the pair to take a wait-and-see attitude - at least until the bears gain a foothold in the region of the 9th figure. The material has been provided by InstaForex Company - www.instaforex.com |
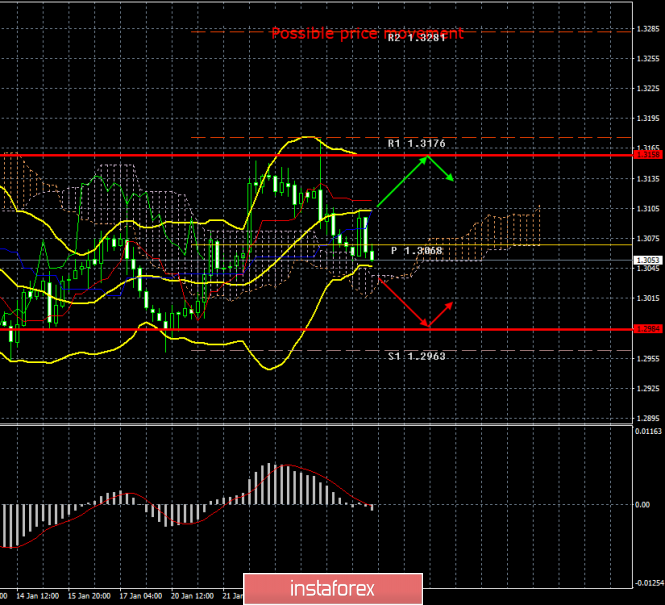
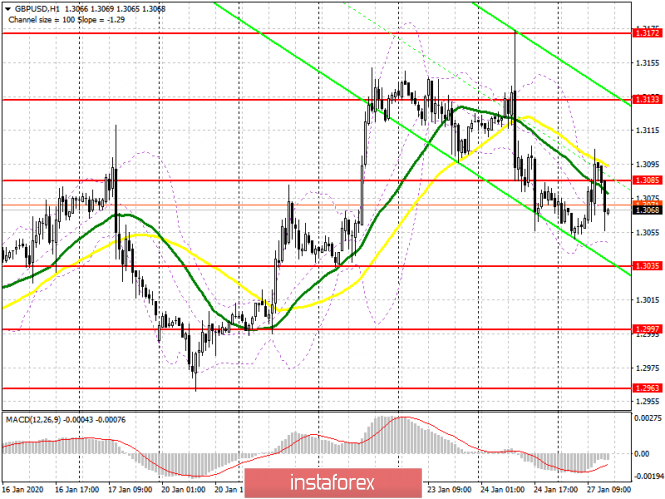
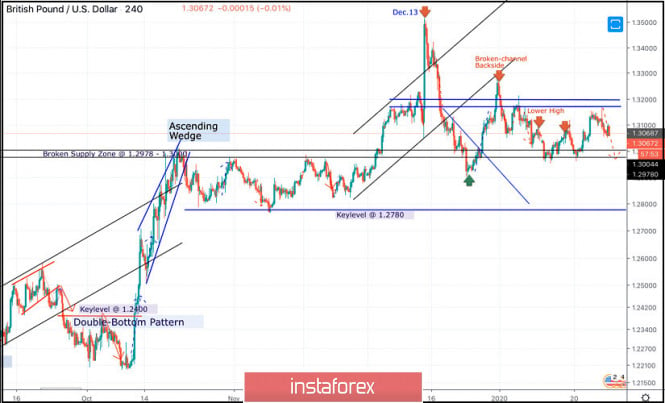
| Posted: 27 Jan 2020 02:57 PM PST 4-hour timeframe Amplitude of the last 5 days (high-low): 52p - 89p - 118p - 54p - 118p. Average volatility over the past 5 days: 87p (average). The British pound tried to start an upward correction on Monday, January 27, but "the music was not playing for long." The pound/dollar pair managed to adjust to the Kijun-sen critical line, however, it was not possible to go above it and the downward movement was resumed, which continues at the moment. In the coming hours, the Ichimoku cloud can be overcome, which will amplify the current dead sell signal from Ichimoku. Volatilityis extremely low today and does not exceed 55 points, which, in principle, is not surprising, since no macroeconomic publications were planned for today, and there will be plenty of important events and publications this week, so as not to force events on the first trading day of the week. A meeting of the Bank of England will take place this Thursday, at which a decision on the rate will be made. Most of the analysts interviewed believe that the monetary committee will approach the decision to lower the rate, but the number of members of the monetary committee supporting this decision will be insufficient. Michael Saunders and Jonathan Haskell, who voted in favor of lower rates at two previous meetings, may be joined by Gertjan Vlieghe and Silvana Tenreyro, who previously said they could support the decision to soften monetary policy in January. It turns out that four members of the committee can speak in favor. Four out of nine, which is not enough to lower the bid by majority opinion. Moreover, the latest macroeconomic statistics from the UK may lead some committee members to consider it a reason to wait another month or two, hoping that the economy will accelerate without the intervention of the British regulator. Experts noted that amid a temporary truce between the United States and China, the global economy has ceased to show signs of slowdown and may begin to recover in 2020. Accordingly, the negative impact will stop on the British economy. Additional negative impact for the impact from Brexit and its consequences will remain. And although we believe that it is time for the BoE to stimulate the British economy by lowering the rate, it may again remain unchanged. Moreover, the UK will officially begin the Brexit procedure on January 31. According to many economists, the management of the BoE can wait to assess how the economy will respond to all events after Brexit. Meanwhile, Mark Carney's replacement at the helm of the BoE was named. The new chairman will be Andrew Bailey, who is now acting as head of the British regulator for financial markets. Bailey himself said: "It is a great honor for me to be the governor of the Bank of England and to be able to serve the people of the United Kingdom, especially at such a critical moment for the country when we leave the EU. The bank has a very important role, and as the manager, I will continue the work that Mark Carney did. It is important for me that the bank continues to work for society, maintaining monetary and financial stability, and guaranteeing the integrity and security of financial institutions. " From a technical point of view, the pound/dollar pair failed to overcome previous highs of January 7 and December 31. Thus, we believe that the pair has much more chances to continue the downward movement than vice versa. The general fundamental background, from our point of view, remains in favor of the US currency, since there are a sufficient number of topics related to the United States, the White House, and Donald Trump, but all of them have an extremely weak effect on the position of the greenback. The dollar continues to feel great as the US economy continues to feel the same. The Federal Reserve will also hold its meeting this week, in which we can learn about the plans of the US regulator in the near future, as well as track changes in the rhetoric of its representatives. Trading recommendations: GBP/USD is trying to resume a downward trend. Thus, traders are advised to resume sales of the pound/dollar pair with targets at 1.2984 and 1.2963 after the pair consolidates below the Ichimoku cloud. The pair's purchases can be considered if the price returns to the area above the Kijun-sen line with targets at 1.3158 and 1.3176. Explanation of the illustration: Ichimoku indicator: Tenkan-sen is the red line. Kijun-sen is the blue line. Senkou Span A - light brown dotted line. Senkou Span B - light purple dashed line. Chikou Span - green line. Bollinger Bands Indicator: 3 yellow lines. MACD indicator: Red line and bar graph with white bars in the indicators window. Support / Resistance Classic Levels: Red and gray dashed lines with price symbols. Pivot Level: Yellow solid line. Volatility Support / Resistance Levels: Gray dotted lines without price designations. Possible price movements: Red and green arrows. The material has been provided by InstaForex Company - www.instaforex.com |
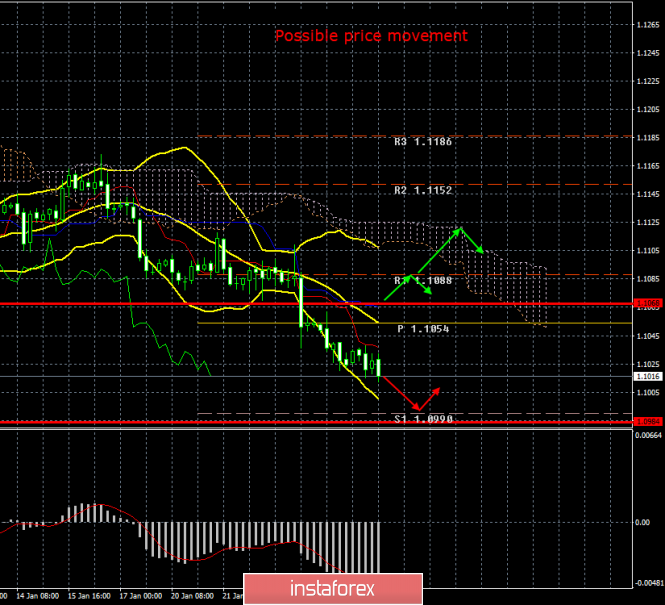
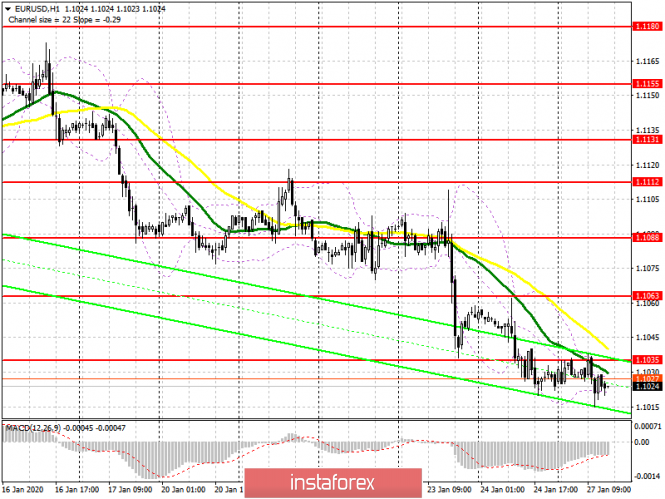
| Posted: 27 Jan 2020 02:57 PM PST 4-hour timeframe Amplitude of the last 5 days (high-low): 25p - 38p - 28p - 73p - 42p. Average volatility over the past 5 days: 42p (average). As we expected this morning, the EUR/USD currency pair spent a quiet and calm Monday and only resumed some semblance of a downward movement at the US trading session. The upward correction has not yet begun, which indicates a lack of desire on the part of the bears to take profit on dollar positions, as well as the absence of bulls on the market. Today's volatility is low and is only 27 points at the moment. However, it can still reach average values of about 40 points by the end of the trading day. Not a single important macroeconomic report was published on the first trading day of the week. Thus, the fundamental background of today is reduced only to information coming from the White House, from the US Senate and personally from Donald Trump. Perhaps the topic of the US president's impeachment is absolutely uninteresting for some of the traders. Someone might consider it a farce, and, as Trump himself puts it, "a witch hunt." Everyone has different opinions, but one cannot but note the importance and significance of this process, even if it was fabricated by Democrats. As we have repeatedly noted, the main omission of Trump in this matter is that he was "framed". He gave a chance and a reason for the Democrats to begin an investigation of their illegal actions. He gave reason to start the impeachment proceedings. And if the evidence of the accusatory side were "weak", then the Democrats would hardly have begun the whole procedure, realizing that through the Senate, in which the majority belongs to just the Republicans, it will not be possible to push the accusation, and Trump's political ratings could rise thanks to such "cheap" evidence. In this case, the chances of winning the presidential election will increase precisely with Trump, and not with any Democratic candidate. The evidence and testimony of witnesses close to Trump's people is very strong. For example, as we said in the morning, John Bolton, a former national security adviser to Donald Trump, claims that Trump personally froze aid to Ukraine and refused to "defrost" it. Naturally, Trump needed something to answer these accusations, and immediately followed a post on Twitter in which the US leader said "no, it wasn't, Bolton is lying to increase sales of his book." By and large, this situation looks like a game of tennis, where opponents throw the ball over the net. First, the Democrats or someone from the accusatory side presents his opinion that Trump is to blame for a crime against the people and democracy, after which Trump immediately says that this was not the case and throws the ball back over the net to the opponent's side. In general, this topic should not be overlooked, especially in those days when, as today, there are no important macroeconomic publications. In those days when no new information is at the disposal of traders. Now the trade war between China and the United States has been put on hold, it is not known when new negotiations on the "second phase" are set to begin, the trade war with the European Union has not yet started, the parties only exchanged mutual threats to introduce duties. The situation with the coronavirus, from which several dozen people have already died in China, is, of course, a serious threat to world security, especially at a time when everyone can buy a plane ticket and go anywhere in the world, but 50 dead are fewer than the death toll in one plane crash of a Ukrainian plane over Iran. Tens of thousands of people die every day in the world from cancer, from AIDS, from various disasters, from natural disasters and even from simpler diseases and misfortunes. Why does no one sound the alarm over AIDS, which cannot be overcome in any way? Thus, coronavirus is, of course, unpleasant, but so far this is not a problem of the scale to sound the alarm and so that it can affect the currency or stock markets. From a technical point of view, a recoilless downward movement continues. The MACD indicator turned up, however, the price does not rise, respectively, the indicator began to discharge, being at its lowest positions. Thus, the downward movement may continue, and we recommend reducing short positions in the event of a price rebound from any support or volatility level or in case of an increase in the quotes of the euro/dollar pair. Trading recommendations: EUR/USD continues to move down. Thus, it is recommended that you either hold open shorts with targets of 1,1008 and 1,0973, until the start of the corrective movement (rebound from any target or turn the MACD indicator up with a parallel increase in price). It will be possible to consider purchases of the euro/dollar pair not earlier than the traders of the Kijun-sen line overcome in small lots with the goals of resistance level 1.1088 and Senkou Span B. line Explanation of the illustration: Ichimoku indicator: Tenkan-sen is the red line. Kijun-sen is the blue line. Senkou Span A - light brown dotted line. Senkou Span B - light purple dashed line. Chikou Span - green line. Bollinger Bands Indicator: 3 yellow lines. MACD indicator: Red line and bar graph with white bars in the indicators window. Support / Resistance Classic Levels: Red and gray dashed lines with price symbols. Pivot Level: Yellow solid line. Volatility Support / Resistance Levels: Gray dotted lines without price designations. Possible price movements: Red and green arrows. The material has been provided by InstaForex Company - www.instaforex.com |
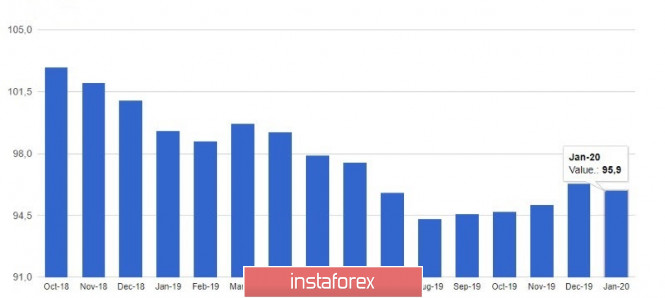
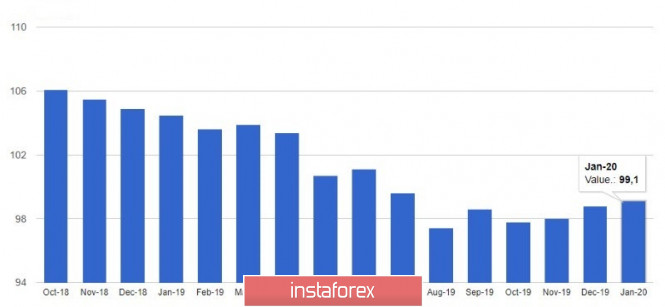
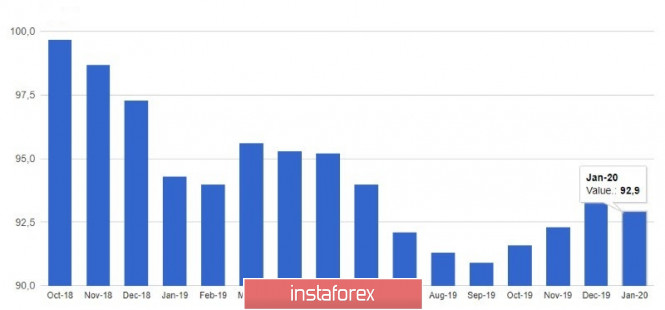
| Posted: 27 Jan 2020 02:57 PM PST The euro reacted negatively to a report from Ifo Institute, which indicated that the German business sentiment index had declined, reflecting problems and is a warning to those investors and economists who spoke about the restoration of the German economy in the near future at the end of 2019. As the first reports show, it will hardly be possible to count on a serious breakthrough in growth rates in the first quarter of 2020. Back in November-December, when a trade agreement was reached between the US and China, or rather its first phase, traders perked up, expecting that the problems in the manufacturing sector of the eurozone countries would disappear on their own. Britain was also optimistic about its orderly exit from the EU. However, the report of some experts says that these global changes only reduce downward risks, but in no way create new incentives for growth, since both the trade agreement and the resolution of the Brexit situation are only partially resolved. According to recent data, the activity of the manufacturing sector in Germany only slightly increased, but the decline continues. Equally important, both the service sector and the construction sector also showed weaker growth rates earlier this year. As I noted above, sentiment in German business circles deteriorated in January. This is evidenced today by published data from the Ifo Institute. Thus, the mood index in German business circles fell to 95.9 points in January from 96.3 points in December 2019. Economists had expected the index to rise to 97.0 points. It is clear that companies' expectations regarding their prospects worsened at the end of the year, which is unlikely to have a favorable effect on the country's economic indicators. The current conditions index in January 2020 rose to 99.1 points from 98.8 points in December 2019, but the expectations index also fell to 92.9 points from 93.9 points. Economists had expected index growth to 99.3 and 94.9, respectively. The service sector, which is so far emphasized, also shows the first signs of weakening. Thus, the indicator of sentiment in the service sector in January of this year significantly dropped after reaching its six-month high in December. However, this did not put strong pressure on risky assets, and the EURUSD pair remained trading at around its morning levels, showing very low activity. The prospects for the recovery of the euro will continue to depend directly on the data on the US real estate market and on the level of 1.1040, since only through the return of this range will buyers of risky assets be allowed to return to 1.1070 and update 1.1110. If the pressure remains and there is no activity among major players in the area of 1.1040, we can expect a bearish trend to continue to the lows of 1.1000 and 1.10960. Oil Oil quotes slightly rebounded from their daily WTI lows near $52 per barrel after news of intense negotiations within OPEC and Russia on cutting production levels by the end of 2020 appeared. Let me remind you that at the end of the year the OPEC+ coalition, consisting of a cartel, Russia and other oil-producing countries, agreed to further reduce production by 500,000 barrels per day to 1.7 million barrels per day. The next meeting was scheduled for March, but, apparently, will take place earlier. A serious drop in oil quotes from $59 to $52 last week is due to the deadly virus that hit China. We are talking about the spread of Coronavirus, which may affect the consumption of oil by the Chinese side in the future. According to representatives of the cartel, they are already discussing response anti-crisis measures that could lead to a larger reduction in production, or to extend the term of restrictions until the end of 2020. The material has been provided by InstaForex Company - www.instaforex.com |
| EUR/USD: euro threatened by the epidemic Posted: 27 Jan 2020 02:57 PM PST According to a consensus estimate by Bloomberg analysts, the euro will rise to $1.14 against the US currency by the end of June. The increasing geopolitical risks in the Middle East, the outbreak of coronavirus in China and the threat of a trade war between Washington and Brussels made investors doubt the realism of this forecast. Although many believe the new virus is less dangerous than SARS in 2003, the worst is probably yet to come. Globalization, more developed than at the beginning of the century, the infrastructure of China and the tendency of the latter to travel to the Lunar New Year are factors that can contribute to the rapid spread of coronavirus throughout the planet. The world economy did not have time to recover from a trade conflict between the United States and China, as it is already threatened by a new scourge. The fact that in November, global trade fell by 0.6% in monthly terms and 1.1% in annual terms does not please the bulls in EUR/USD. The problems of the export-oriented economy of the eurozone do not end there. The United States, under the threat of imposing duties on importing cars from the European Union, may demand that American companies expand their access to the European agricultural market. Moreover, Washington could avenge Brussels on its carbon tax. Turning a blind eye to environmental issues, the White House regards the introduction of tariffs by other states as a manifestation of protectionism. Meanwhile, the US economy is still on its feet. According to IHS Markit, the US composite purchasing managers index reached a ten-month high in January due to increased business activity in the services sector. The data on PMI in the non-manufacturing sector of the eurozone, on the contrary, disappointed, which makes it possible for the EUR/USD bears to win back the divergence factor in US and EU economic growth. The external background is extremely unfavorable for the euro bulls, so the main currency pair's decline to seven-week lows appears quite logical. Neither the January meeting of the ECB's Governing Session, nor the data on European business activity, could provide adequate support to fans of the euro. Whether the Federal Reserve wants to do this, a meeting of which, along with releases on US and European GDP for the fourth quarter, is one of the key events of this week, is unknown. The goal of EUR/USD bears at 1.1000 is just around the corner, and then support at 1.0960 will appear on the horizon. As for the bulls, their immediate task is to overcome the powerful resistance of 1.1065, then the resistance of 1.1100 and 1.1175. The material has been provided by InstaForex Company - www.instaforex.com |
| GBP/USD: Great Britain remains attractive for investors, bulls and bears on the pound eager to fight Posted: 27 Jan 2020 02:56 PM PST The beginning of the year was difficult for the pound. The market had not really managed to wake up from the holidays, and the GBP/USD rate fell from above 1.32 to less than 1.30. After the collapse of 2%, the British currency firmly settled in the bottom of the main currency ratings. Since the beginning of the year, only its Australian and New Zealand namesakes showed lower results against the US dollar. What explains the similar dynamics of the pound? Firstly, the British currency made a staggering leap at the end of last year. As soon as the conditions for the UK's exit from the European Union became known in the fall, the pound took off, and the results of the early parliamentary elections held in December spurred its rally. However, it is difficult to imagine what could help the GBP/USD pair to return above the 1.35 mark for the first time in almost two years. It is unlikely that a country's exit from the world's largest trading bloc guarantees its immediate economic growth. Good news has already been taken into account in quotes, at the same time, alarming calls for the pound began to appear. Recently, officials of the Bank of England, including Mark Carney, Michael Sanders, Gertjan Vlieghe, said they support monetary easing. As data this month showed, the British economy slowed down in November, and inflation turned out to be unstable. Against this background, the chances of easing monetary policy in the United Kingdom at the end of January increased to 70%. However, GBP/USD bulls do not intend to give up. Judging by the latest data, speculators in the futures market made the biggest bets on the pound since April 2018. "The UK remains attractive to the markets: bulls and bears are eager for battle," said Keith Joux, an analyst with Societe Generale. What is this speculators see that the rest of the market does not notice? "I consider the pound to be the best main currency to buy against the US dollar this year. Uncertainty over Brexit has declined, investment in Great Britain has resumed, and data on the state of business in the country, including purchasing managers' indices, is likely to recover, "said Kamakshya Trivedi, Goldman Sachs strategist. According to IHS Markit, in January, the UK services sector returned to growth for the first time since August, while the decline in production slowed. The business activity index in the country's manufacturing sector jumped to a nine-month high of 49.8 points this month, with a forecast of 48.9 points. The PMI in the service sector has reached its highest value over the past 16 months (52.9 points). After the initial strengthening amid the release of positive data on British business activity, the pound fell against the US dollar, as some investors still expect the BoE to cut interest rates at the next meeting, which will be held on Thursday, January 30. "The rebound in business activity indices in the services and production sectors of Britain turned out to be stronger than forecasts. This may make it harder for BoE to choose this week," TD Securities analysts said. "We maintain our forecast that the regulator will lower the rate by 25 basis points, but we believe that the likelihood of such a scenario is approximately 50%. There is practically no doubt that the Monetary Policy Committee of the BoE will disagree, as its members attach different importance to fundamental indicators and research on sentiment," they added. Another significant event will take place on Friday, January 31 - the UK parting with the EU. However, at the moment, this event will put moral pressure on the market: the relatively smooth process of Great Britain's exit from the block significantly reduces investment risks. If Brexit does not have any unexpected surprises, then the pound may feel relatively calm, and its certain growth against the US dollar is not excluded. In this case, we should expect the continuation of the GBP/USD pair's movement upward - first to the resistance of 1.3160, and then to the level of 1.3200. An alternative scenario suggests the pair to fall further, especially if at the next meeting of the BoE, there is at least a hint of a possible reduction in the interest rate sounds. In this scenario, GBP/USD has every chance to continue moving down. Having broken through the support of 1.3040, 1.3000 and 1.2960, the pair can reach the lows of December 2019 at around 1.2900. The material has been provided by InstaForex Company - www.instaforex.com |
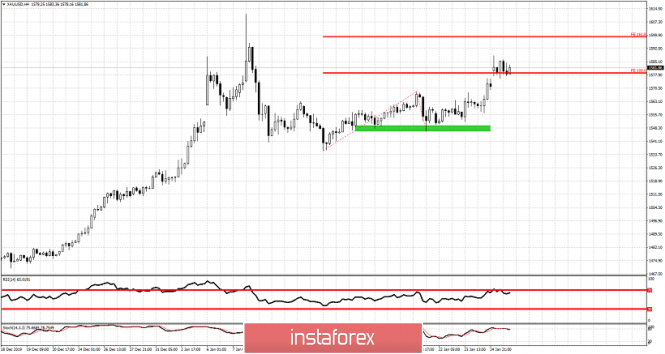
| Gold price consolidates, implyig higher chances of an upward continuation. Posted: 27 Jan 2020 02:16 PM PST Gold price has recaptured $,1580 and is moving sideways in the short-term after the big short-term spike from $1,540 to $1,580. Trend remains bullish and now that our first target of $1,578 has been achieved, we look for the next target around $1,600.
Red horizontal lines - Fibonacci extension levels Gold price continues to make higher highs and higher lows. Trend remains bullish and the RSI is far from providing a bearish divergence and remains below overbought levels. This pause in Gold price is expected to be followed by a strong move to the upside most probably. The material has been provided by InstaForex Company - www.instaforex.com |
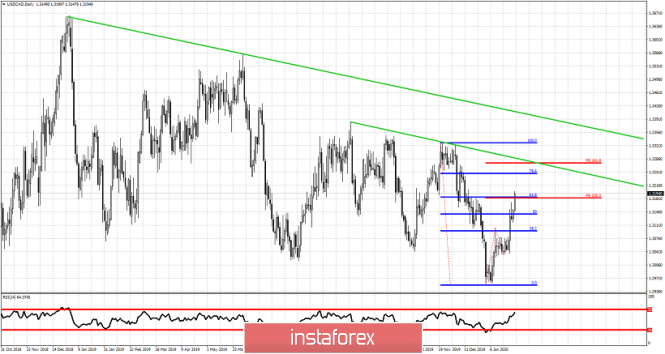
| USDCAD reaches our target but has still room to the upside Posted: 27 Jan 2020 02:11 PM PST As we explained in our previous posts, USDCAD had formed a bullish flag pattern and a break above 1.31 would lead to a move towards 1.3180 and the 61.8% Fibonacci retracement. This target has been reached and as price has broken above the 61.8% we take a look at our next target.
Red horizontal lines - Fibonacci extension targets Blue horizontal lines - Fibonacci retracements USDCAD has reached our first target and is now moving above the resistance of the 61.8% level. This could lead to a move towards the first green trend line resistance around 1.3270 where we also find the second Fibonacci extension target. Support is at 1.31-1.3085 and as long as price is above this level, bulls will remain in control of the trend. The material has been provided by InstaForex Company - www.instaforex.com |
| EUR/USD. January 27. The pair continues to fall and only 35 points remain until the last target Posted: 27 Jan 2020 07:20 AM PST EUR/USD – 4H.
As seen on the 4-hour chart, the EUR/USD pair continues to fall and has completed a consolidation under the low level of 1.1040, which I named as the first target level. Thus, now traders can count on the continuation of the fall of the euro-dollar pair in the direction of the next low level - 1.0989, which is the last goal in the framework of the trading idea that I voiced a few days ago. After (and if) the level of 1.0989 is worked out, all trades on the trading idea can be closed. There are no pending divergences in any indicator today, so I don't expect the fall to end prematurely. The information background on Monday is extremely poor. No important news. On Friday, there was interesting news on business activity in Europe and America, but they did not affect the mood of traders, expressed by the direction of the downward trend corridor. Tomorrow, we are waiting for important news from the United States on the change in volumes for long-term use orders. A strong report can help overcome the last few dozen points of the euro-dollar pair to its target level. Forecast for EUR/USD and trading recommendations: The long-term trading idea remains valid. Traders still have a long-term target for a fall near the level of 1.0850 confirmed by a close below the trend line. The short-term trading idea is to sell the pair with a target of 1.0989 since the trend on the 4-hour chart remains "bearish". Stop Loss levels can now be moved beyond the level of 1.1040. The material has been provided by InstaForex Company - www.instaforex.com |
| Posted: 27 Jan 2020 07:20 AM PST GBP/USD - 4H.
As seen on the 4-hour chart, the GBP/USD pair performed a reversal in favor of the US currency after fixing under the correction line and began to fall in the direction of the goal I announced near the global correction line and the Fibo level of 76.4% (1.2995). At today's trading, the pair's quotes performed a pullback to the corrective level of 50.0% (1.3094), after rebounding from the Fibo level of 61.8% (1.3049). However, the rebound from the Fibo level of 50.0% worked again in favor of the US dollar and the resumption of the fall in the pair's quotes. Also, a bullish divergence was formed at this point, which helped the pair to start growing. The very rapid completion of growth after divergence indicates a very likely resumption of the fall. There is no information background for the pound-dollar pair today, and on Friday, it could cause the growth of the British dollar, as the indexes of business activity in the UK were higher than traders' expectations. After working out the corrective level of 76.4%, the further dynamics of the pair will depend on the closing or rebound from the global correction line. Forecast for GBP/USD and trading recommendations: The trading idea is still in the sales of the pound. Near the level of 1.3139, there was a reversal with a close under the correction line. I recommend traders to sell with the goal of 1.2995, Stop Loss should be taken out for 1.3139. The material has been provided by InstaForex Company - www.instaforex.com |
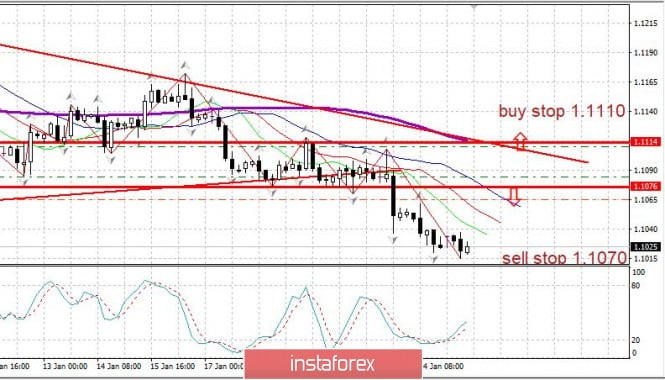
| Evening review for EURUSD on 01/27/2020. The market is thinking about the epidemic Posted: 27 Jan 2020 06:01 AM PST
Until today, the market has not reacted strongly to the growth of diseases with an unknown type of flu in China (coronavirus). However, the fact that the number of infected people is growing, that the Chinese authorities are forced to take increasingly strong measures to close the message - is beginning to affect the market. So far, oil has reacted with a strong drop - the Chinese economy may suffer greatly, and China is a big buyer of oil. The rest of the market is still waiting for new data on the epidemic. The second story is the Fed's decision on rates on Wednesday, January 29. Will the Fed signal the possibility of a new rate cut? EURUSD: the state of the market is a downward trend. We sell from 1.1070. In the case of a reversal, we buy from 1.1110. The material has been provided by InstaForex Company - www.instaforex.com |
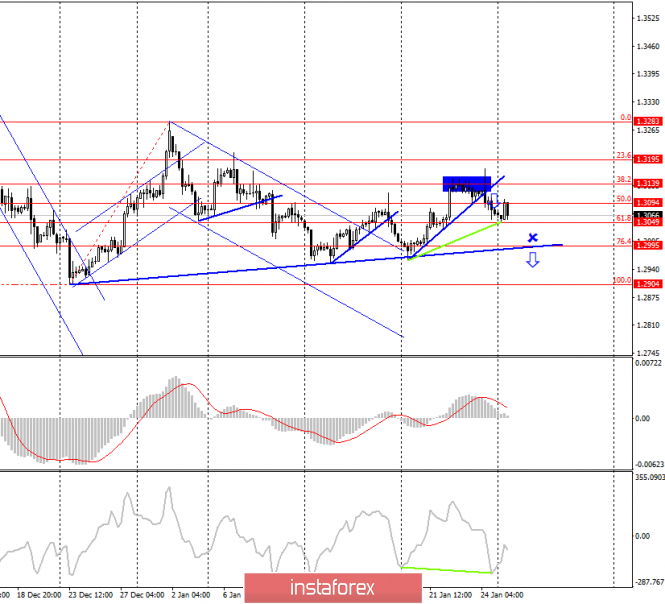
| Posted: 27 Jan 2020 05:30 AM PST To open long positions on GBPUSD, you need: In the first half of the day, the bulls attempted to break through and consolidate above the resistance of 1.3085, but this was not enough to turn the market on its side. Problems with the breakout of the moving averages also led to a return of the price to the level of 1.3085, which remains a problem for buyers in the US session. Only a real consolidation above this range will open a direct path to the maximum of 1.3133, as well as to a more powerful resistance of 1.3172, where I recommend taking the profits. Also, in the second half of the day, the bulls will try to protect the support of 1.3035, the formation of a false breakout on which will be the first signal to open long positions in GBP/USD. I recommend buying the pound immediately for a rebound only after updating the minimum of 1.2997. To open short positions on GBPUSD, you need: Sellers coped with the task and did not let the pair above the resistance of 1.3085, although they allowed collecting the stops of speculative players. While trading is below the range of 1.3085, the pressure on the pound will be present, and the nearest target of the bears will be at least 1.3035, where I recommend fixing the profits. Only a break below this range will lead to the continuation of the downward trend, which, quite likely, could be formed from last Friday's high in the area of 1.3172. If the sellers of the pound miss the resistance of 1.3085 again, then it is best to consider new short positions only after updating the maximum of 1.3133 and also sell GBP/USD immediately on a rebound from the resistance of 1.3172. Indicator signals: Moving averages Trading is conducted around 30 and 50 daily averages, which indicates some market uncertainty in the short term. Bollinger Bands Breaking the lower border of the indicator around 1.3050 will increase the pressure on the pair.
Description of indicators
|
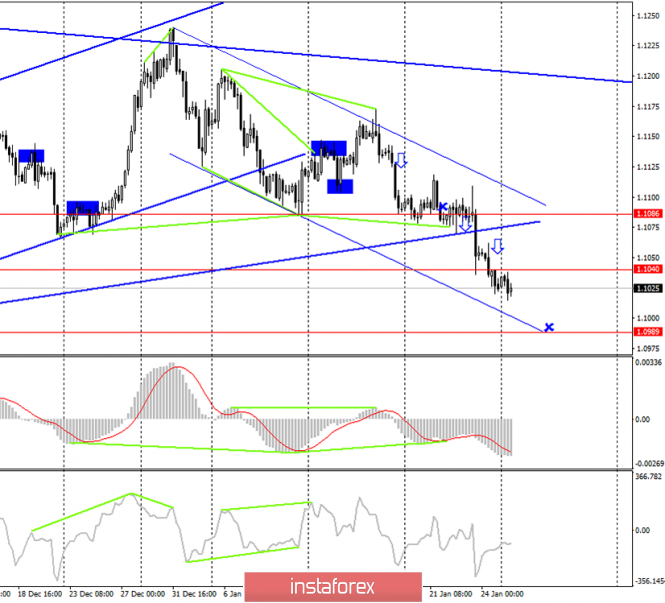
| Posted: 27 Jan 2020 05:18 AM PST To open long positions on EURUSD, you need: Data on the decline in the German business environment indicator, which indicates a slight pessimism among manufacturers, led to continued pressure on the euro in the first half of the day. Also, the bulls did not manage to regain the level of 1.1035, which I paid attention to in my morning review. On the other hand, the technical picture has not changed much, and buyers are still focused on the area of 1.1035. Fixing above this range will lead to an upward correction in the area of 1.1063 and 1.1088, where I recommend fixing the profits. In the scenario of EUR/USD falling in the second half of the day further along the trend, given that the report on sales in the primary housing market can support the dollar, it is best to look at long positions only after the support update 1.1004 or buy immediately on a rebound from the lows of 1.0982 and 1.0964. To open short positions on EURUSD, you need: The bears coped with the morning task, and the formation of a false breakout at 1.1035, which I paid attention to here, led to a further decline in the euro, but it was not possible to achieve a larger sell-off. While trading will be conducted below the resistance of 1.1035, the pressure on the euro will remain, which may lead to an update of the lows of 1.1004 and 1.0982, where I recommend fixing the profits. If the market activity in the direction of the euro's decline does not follow even after strong data on sales in the US housing market, then it is best to postpone short positions in EUR/USD until the resistance is updated at 1.1063 or sell immediately for a rebound from the maximum of 1.1088. Indicator signals: Moving averages Trading is conducted just below the 30 and 50 moving averages, which keeps the chance of a decline in the euro. Bollinger Bands Breaking the upper limit of the indicator, which coincides with the resistance of 1.1035, will be a signal to buy the euro.
Description of indicators
|
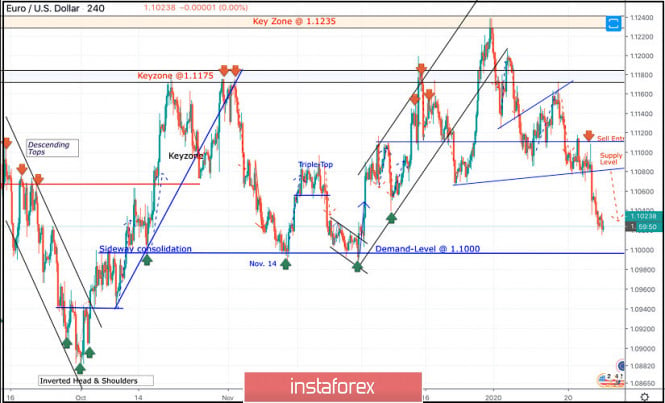
| January 27, 2020 : EUR/USD Intraday technical analysis and trade recommendations. Posted: 27 Jan 2020 05:18 AM PST
On December 6, a bullish swing was initiated around 1.1040 allowing another bullish breakout above 1.1110 to pursue towards 1.1175 within the depicted short-term bullish channel. Initial Intraday bearish rejection was expected around the price levels of (1.1175). On December 20, bearish breakout of the depicted short-term channel was executed. Thus, further bearish decline was demonstrated towards 1.1065 where significant bullish recovery has originated. Shortly-after, another bullish pullback towards 1.1235 (Previous Key-zone) was suggested to be watched for bearish rejection and another valid SELL entry. Suggested bearish position has achieved its targets while approaching the price levels around 1.1110. However, the Key-Level around 1.1110 has provided some bullish demand. This was followed by a bullish pullback towards 1.1140 and 1.1175 where the depicted key-zone as well as the recently-broken uptrend were located. Recently, evident signs of bearish rejection were demonstrated around 1.1175. That's why, quick bearish decline was executed towards 1.1110. As expected in a previous article, bearish persistence below 1.1110 enabled further bearish decline towards 1.1060 then 1.1040 where some bullish rejection may be expressed. Currently, the EURUSD pair has a recently-established Supply Level around 1.1080-1.1090 to be watched for new SELL entries if any bullish pullback is expressed. Trade recommendations : Few days ago, Intraday traders were advised to consider the recent bullish pullback towards 1.1110-1.1120 as a valid SELL signal. Bearish projection targets were achieved around 1.1060 and 1.1040.Any bullish pullback towards the backside of the recently-broken trend around 1.1080-1.1090 should be considered for another valid SELL entry. The material has been provided by InstaForex Company - www.instaforex.com |
| January 27, 2020 : GBP/USD Intraday technical analysis and trade recommendations. Posted: 27 Jan 2020 05:15 AM PST
On December 13, the GBPUSD pair looked overpriced around the price levels of 1.3500 while exceeding the upper limit of the newly-established bullish channel. On the period between December 18 - 23, bearish breakout below the depicted channel followed by initial bearish closure below 1.3000 were demonstrated on the H4 chart. However, earlier signs of bullish recovery were manifested around 1.2900 denoting high probability of bullish pullback to be expected. Thus, Intraday technical outlook turned into bullish after the GBP/USD has failed to maintain bearish persistence below the newly-established downtrend line. That's why, bullish breakout above 1.3000 allowed the recent Intraday bullish pullback to pursue towards 1.3250 (the backside of the broken channel) where bearish rejection and another bearish swing were suggested for conservative traders in previous articles. Intraday technical outlook was supposed to remain bearish as long as the pair maintains its movement below 1.3120 (recently established descending high). However, recent bullish breakout above 1.3100-1.3120 is being demonstrated Today. This hindered the intraday bearish scenario. Thus, further bullish advancement was expected towards 1.3200. In the Meanwhile, Intraday traders can watch any bullish pullback towards the depicted price zone (1.3170 - 1.3200) for bearish rejection and another valid SELL entry with intraday bearish targets projected towards 1.3000 and 1.2980. On the other hand, conservative traders can wait for bearish breakdown below 1.2980. This would be needed first to enhance further bearish decline towards 1.2900, 1.2800 and 1.2780 where the backside of the previously-broken downtrend is located. The material has been provided by InstaForex Company - www.instaforex.com |
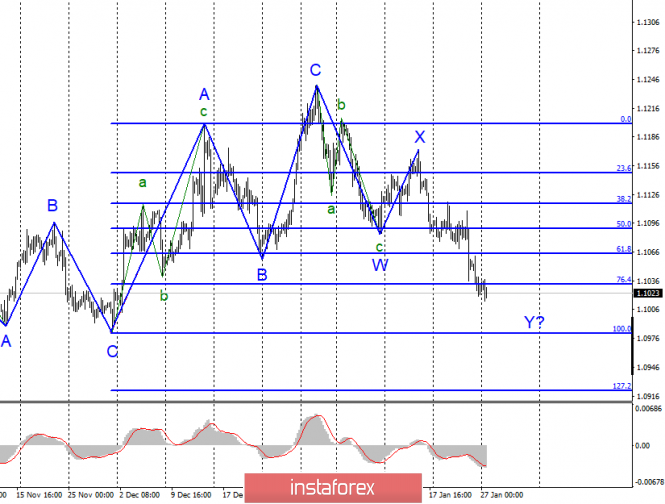
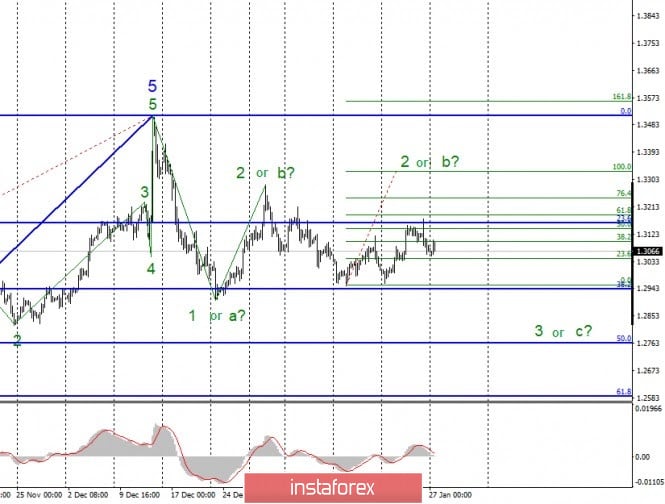
| Posted: 27 Jan 2020 04:58 AM PST EUR/USD On January 24, the EUR/USD pair lost about 30 basis points and thus continues to build the expected wave y. If this is true, then a successful attempt to break the 76.4% Fibonacci mark indicates that the markets are ready for further sales of the euro currency. The wave y becomes more extended than originally calculated. Around the 100.0% Fibonacci level, its construction may be completed. Fundamental component: The news background for the tool on Friday was interesting, and most importantly - expected. By this time, the markets had already moved away from the shock caused by Christine Lagarde's speech a day earlier, and now they were hoping for more or less positive information from the eurozone. Business activity in all sectors of Germany increased compared to the previous month, and also significantly exceeded market expectations. The most important thing is that the index of business activity in the manufacturing sector has started to recover, which causes the greatest concerns for Christine Lagarde. In the eurozone as a whole, business activity did not disappoint. In the services sector, there was a slight decrease to 52.2, which is not critical for the indicator, and in the production sector - an increase to 47.8, which is 1.5 points higher than a month earlier. The composite business activity index was 50.9, the same as a month earlier. After these economic reports, it was quite possible to expect a small increase in the euro currency, however, the demand for it did not grow, and the markets continued to wait for US reports. In America, only one index was upset - business activity in the manufacturing sector, which fell in January to 51.7. It is also not critical yet, however, the trend itself is frightening. Since May 2018, this index has slipped from a value of 56.6 to 49.9 in August 2019. There has been a slight increase in recent months, but now it seems that the index has started to decline again. The other two indexes exceeded the expectations of the Forex market, and they are "all right". In general, we can say that such statistics packages cannot be interpreted unambiguously. We can also note business activity in the EU and German manufacturing sectors, which remains very weak. And you can focus on the declining business activity in the US manufacturing sector. General conclusions and recommendations: The euro-dollar pair is presumably continuing to build a downward set of waves. Thus, I would recommend continuing to sell the instrument with targets located around the mark of 1.0982, which corresponds to 100.0% of Fibonacci. An unsuccessful attempt to break this mark will lead to quotes moving away from the reached lows and, possibly, completing the construction of the wave y. GBP/USD The GBP/USD pair lost about 50 basis points on January 24 and continues to remain within the framework of building either wave 2 or b or wave 3 or C. The section of the trend that began after December 23 is very complex and confusing in its internal structure. If the instrument is currently in the stage of building a wave 2 or b, the instrument may rise to the area of the 100.0% Fibonacci level. If the instrument is currently at the stage of building wave 3 or C, then an unsuccessful attempt to break the 23.6% Fibonacci level (blue grid) already shows readiness for a new decline. In general, the situation is ambiguous. Fundamental component: The news background for the GBP/USD instrument on Friday was also interesting, and as it turned out later - quite optimistic. After 7 months spent under the mark of 50.0, business activity in the manufacturing sector finally came close to getting out of the area that signals a downward turn in the industry. The index value in January is 49.8. The same can be said about the index of business activity in the service sector, which only in December managed to get out of the zone "under the mark of 50.0", and in January - it significantly increased to 52.9. However, all this news did not help either the euro currency or the British currency. Markets continued to sell these currencies, probably taking into account first of all the ECB meeting that has already taken place, and the Bank of England meeting that will only take place this week. During the first meeting, the markets concluded that the bank's mood will remain "dovish" for a very long time, and the expectations from the Bank of England's meeting are to lower the key rate. General conclusions and recommendations: The pound-dollar tool continues to build a new downward trend. I recommend selling the instrument again with targets located around 1.2941 and 1.2764, which corresponds to 38.2% and 50.0% for Fibonacci, using the new MACD "down" signal, which was formed around the level of 23.6% for Fibonacci. The tool can complicate wave 2 or b, so the increase can continue to 1.3329 (in the case of a successful attempt to break the 23.6% Fibonacci level), and sales are then recommended to be considered around the mark of 1.3329. The material has been provided by InstaForex Company - www.instaforex.com |


| You are subscribed to email updates from Forex analysis review. To stop receiving these emails, you may unsubscribe now. | Email delivery powered by Google |
| Google, 1600 Amphitheatre Parkway, Mountain View, CA 94043, United States | |
No comments:
Post a Comment