Forex analysis review |
- Commitment of traders report analysis for USD/JPY 02/14/2020 - Large speculatorrs started to increase long positions on futures
- February 14, 2020 : GBP/USD Intraday technical analysis and trade recommendations.
- February 14, 2020 : EUR/USD Intraday technical analysis and trade recommendations.
- BTC analysis for 02.14.2020 - Watch for potential down breakout of the trading range and eventual test of $9.732
- GBP/USD 02.14.2020 - Upside pressure on the GBP and bullish flag in creation, watch for buying opportutniies with the main
- Gold 02.14.2020 - Resistnace ont he test and potential for the downside rotation towards the $1.562
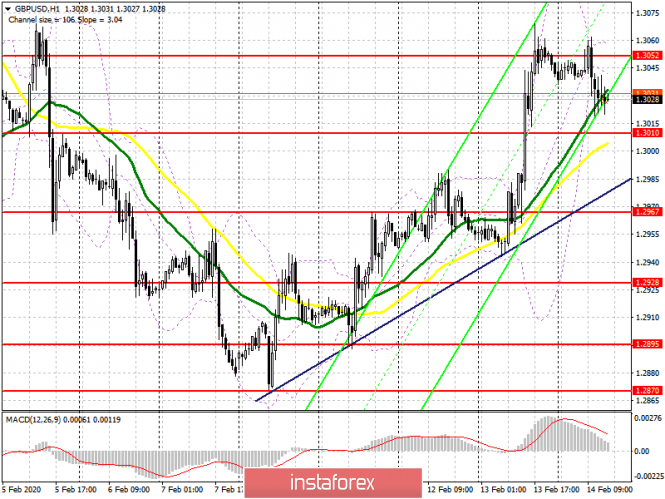
- GBP/USD: plan for the American session on February 14. Bears install the correction of the pound. The level of 1.3052 remains
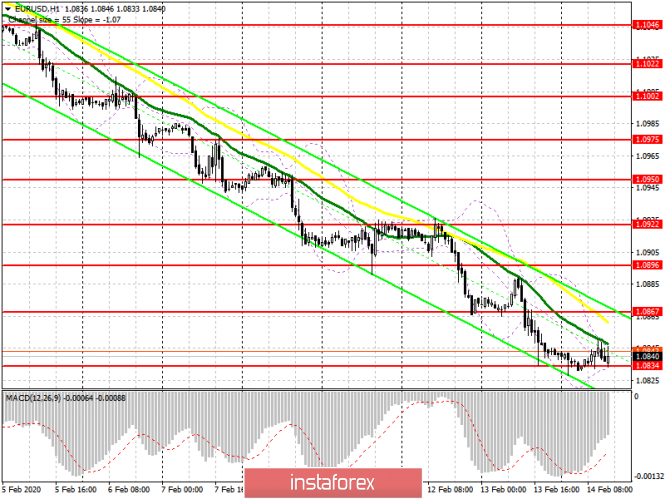
- EUR/USD: plan for the American session on February 14. Zero growth in the German economy is a bad sign for the euro. Bulls
- Trading recommendations for the EURUSD pair on February 14
- The euro is going downhill
- Analysis and forecast for EUR/USD on February 14, 2020
- EUR/USD. February 14. We are waiting for the close above 1.0870 and buy the euro on correction
- GBP/USD. February 14. American statistics will determine whether the pound is ready for a new fall
- Technical analysis recommendations for EUR/USD on February 14
- Trading recommendations for GBP/USD pair - prospects for further movement
- EUR/USD: euro walks along the edge of the bottom
- Euro knocking on a closed door
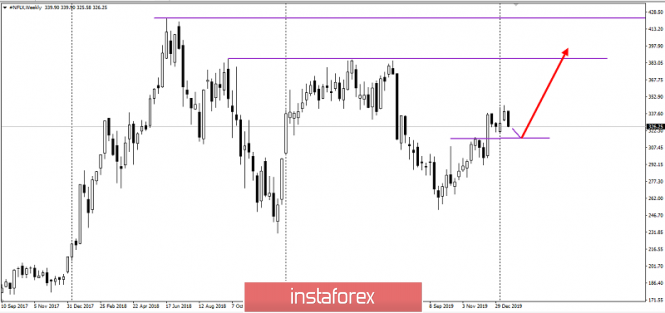
- Netflix - take your money!
- Analysis of EUR/USD and GBP/USD for February 14. US inflation hit the euro currency hard
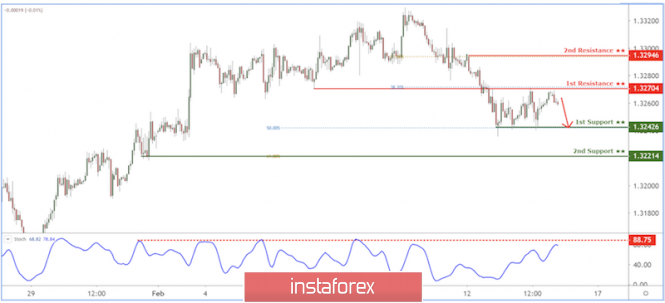
- USD/CAD reversing below key level now!
- EUR/JPY approaching support, potential bounce!
- GBP/USD approaching resistance, potential drop!
- Privatization of one Kingdom or more (review of EUR/USD and GBP/USD on 02/14/2020)
- Indicator analysis. Daily review of GBP / USD on February 14, 2020
- Trader's Diary: EURUSD on 02/14/2020, Euro's fall until March
| Posted: 14 Feb 2020 09:22 AM PST COT Report:
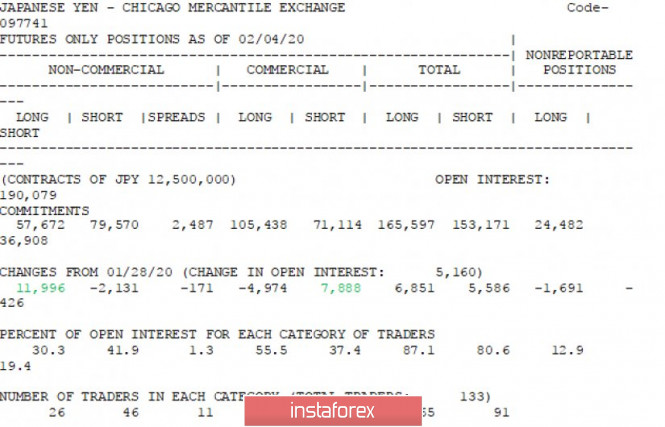
Based on the latest Commitment of Traders report, I found that there is the increase on the Long positions by Non-Commercials (Large Speculators) by 11,996 contracts and at the same time there is Increase in the short positions by Commercials (Hedgers) by 7,888 contracts, which is indication for potential increase of the JPY currency for itself (USD/JPY downside).
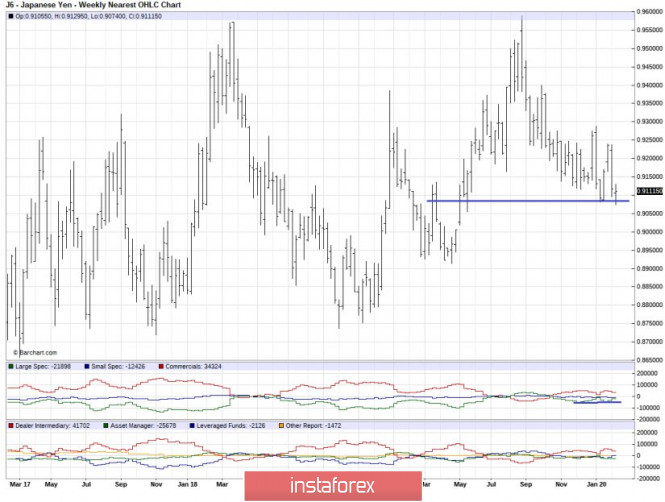
Additionally, I found that there is bullish divergence on the Non-Commercial activity in the past few weeks, which is good indication for the further JPY strength (USD/JPY weakness). There is no extreme reading so far and market is in preparation for the next direction movement. USD/JPY Daily Chart:
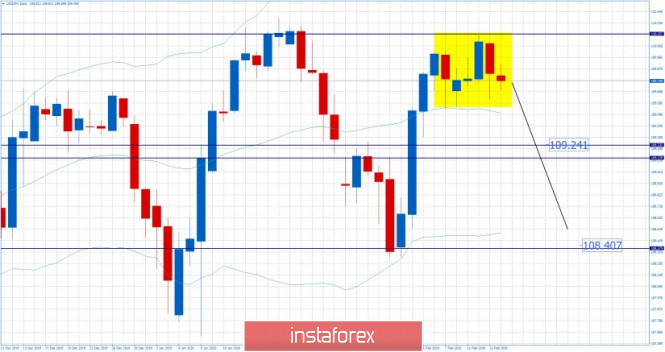
I do expect the breakout of the trading range and downside movement on the USD/JPY towards the levels of 109.24 and 108.40. Key resistance zone is set at the 110.20 The material has been provided by InstaForex Company - www.instaforex.com |
| February 14, 2020 : GBP/USD Intraday technical analysis and trade recommendations. Posted: 14 Feb 2020 08:07 AM PST
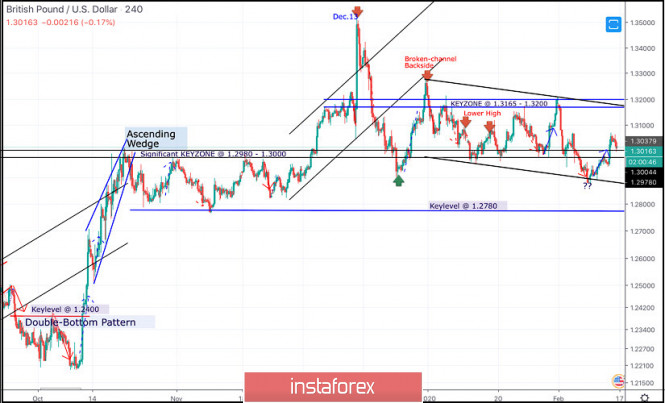
Recently, new descending highs were recently demonstrated around 1.3200 and 1.3080. However, temporary signs of bullish rejection were manifested around 1.2980-1.3000 before obvious bearish breakdown could occur. Intraday technical outlook was supposed to remain bearish as long as the pair maintained its movement below 1.3080 (the most recently-established descending high). Bearish breakdown below 1.2980 enhanced further bearish decline towards 1.2890 where Intraday traders were advised to watch price action carefully (the lower limit of the movement channel while the pair is being oversold). Since Monday, signs of bullish rejection have been expressed allowing the current bullish pullback to pursue towards 1.3000 which failed to offer any bearish resistance. Instead, bullish breakout above 1.3000 is enabling further bullish advancement towards 1.3100 and probably 1.3200 where the upper limit of the channel comes to meet the pair. This extensive bullish movement will probably occur provided that the current price level around 1.3080 gets breached to the upside soon enough. Moreover, bullish persistence above 1.2980-1.3000 is needed to ensure further bullish advancement. On the other hand, please note that any bearish decline towards the demand-level (the lower limit of the channel @ 1.2890) will probably fail to provide bullish support for the pair this time. The material has been provided by InstaForex Company - www.instaforex.com |
| February 14, 2020 : EUR/USD Intraday technical analysis and trade recommendations. Posted: 14 Feb 2020 07:37 AM PST
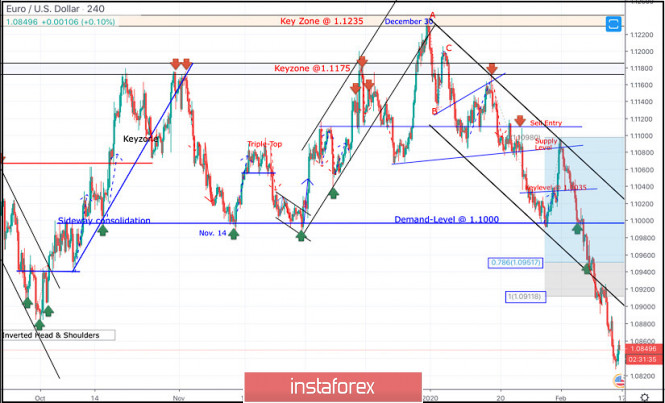
On December 30, a bearish ABC reversal pattern was initiated around 1.1235 (Previous Key-zone) just before another bearish movement could take place towards 1.1100 (In the meanwhile, the EURUSD pair was losing much of its bearish momentum). One more bullish pullback was executed towards 1.1175 where the depicted key-zone as well as the recently-broken uptrend were located. That's why, quick bearish decline was executed towards 1.1100 then 1.1035 which failed to provide enough bullish SUPPORT for the EURUSD pair. Further bearish decline took place towards 1.1000 where the pair looked quite oversold around the lower limit of the depicted bearish channel where significant bullish rejection was able to push the pair back towards the nearest SUPPLY levels around 1.1080-1.1100 (confluence of supply levels (including the upper limit of the channel). Since then, the pair has been down-trending within the depicted bearish channel until this week when bearish decline went further below 1.0950 and 1.0910 (Fibonacci Expansion levels 78.6% and 100%) establishing a new low around 1.0835. Currently, the EUR/USD pair looks quite overpriced after such a long bearish decline and if bullish recovery is expressed above 1.0870, further bullish advancement would be expected towards 1.0910 then 1.0950. Intraday traders are advised to look for signs of bullish recovery around the current price levels of (1.0830) as a valid intraday BUY signal aiming towards 1.0910 (the nearest broken demand-level). On the other hand, bearish persistence below 1.0830 may enable more bearish decline towards 1.0805 even down to 1.0755. The material has been provided by InstaForex Company - www.instaforex.com |
| Posted: 14 Feb 2020 07:07 AM PST Industry news:
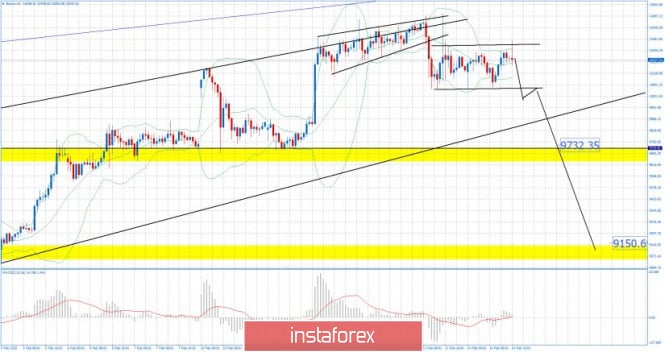
Starting with The Bank of China's announcement that it would be exploring the potential of a state-sponsored digital currency and continuing into the World Economic Forum in Davos, Switzerland that produced guidance for central banks navigate the digital landscape, 2020 is increasingly looking like the year governments take real steps into the world of cryptocurrency Technical analysis BTC has been trading sideways at the price of $10.250. Due to the breakout of the support trendline in the background, I do expect potential for further downside movement and eventual test of $9.723 and $9.150. I would watch for eventual breakout of the support at $10.057 to confirm downside movement towards the levels at $9.732 and $9.150. MACD oscillator is showing neutral stance and it's not that relevant under the trading range condition. Major resistance level is seen at the price of $10.513 Support levels are set at the price of $9.732 and $9.150 The material has been provided by InstaForex Company - www.instaforex.comThis posting includes an audio/video/photo media file: Download Now |
| Posted: 14 Feb 2020 06:50 AM PST Technical analysis:
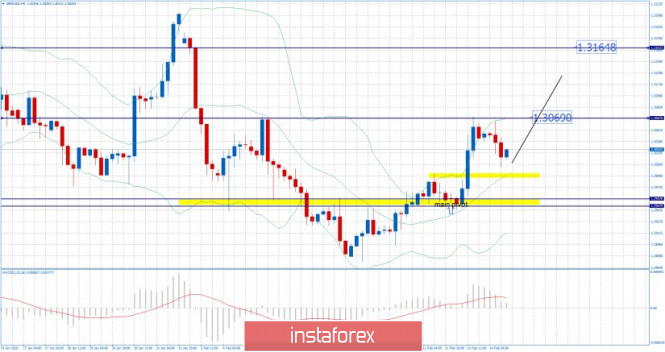
GBP has been trading upward as I expected yesterday. The GBP reached our first target at 1.3069 and rejected some of the previous up move. Anyway, I still see potential for the long side and eventual re-test of the 1.3069 and even test of 1.3165. Based on the 4H time-frame, I found that bull flag is in creation and buying opportunities are preferable. MACD oscillator is showing positive reading and new momentum up in the background, which is good confirmation for our long bias. Resistance levels are seen at the price of 1.3069 and 1.3164 Support levels are set at the price of 1.2992 and 1.2950 The material has been provided by InstaForex Company - www.instaforex.com |
| Gold 02.14.2020 - Resistnace ont he test and potential for the downside rotation towards the $1.562 Posted: 14 Feb 2020 06:27 AM PST Technical analysis:
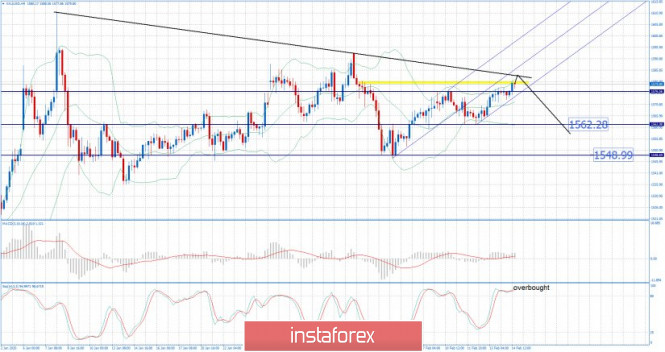
Gold has been trading upwards most recently. The price tested the resistance at the $1.580. Due to overbought condition and resistances on the test, downside opportunities are preferable. Watch for selling opportunities if you see the breakout of the mini Pitchfork channel. The breakout of the swing low at $1.573 would confirm rotation down towards the levels at $1.562 and $1.548. MACD oscillator is showing positive reading but without increase in the momentum. Stochastic oscillator is showing overbought condition. Resistance levels are seen at the price of $1.580 and $1.593 Support levels and downward targets are set at the price of $1.562 and $1.548. The material has been provided by InstaForex Company - www.instaforex.com |
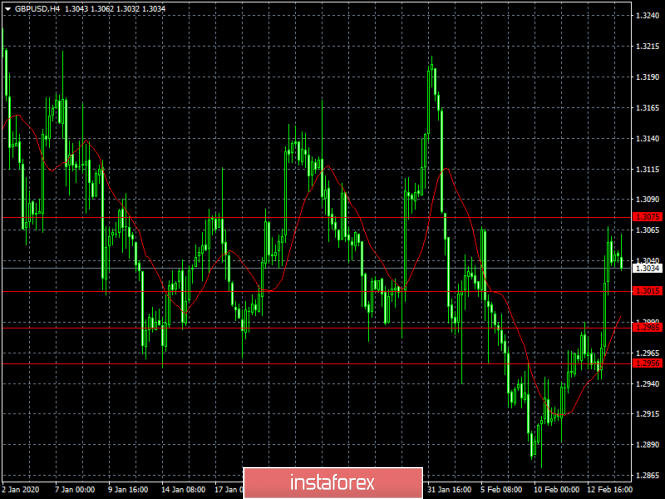
| Posted: 14 Feb 2020 05:23 AM PST To open long positions on GBPUSD, you need: In the morning review, I paid attention to the probability of forming a false breakdown in the resistance area of 1.3052, which the bears achieved in the end, and the bulls did not force events before the release of important statistics on the volume of retail sales in the United States. The task of buyers of the pound remains to break through and consolidate above the resistance of 1.3052, which will open a direct road to the area of the highs of 1.3093 and 1.3133, where I recommend fixing the profits. A more optimal scenario for opening long positions will be a downward correction to the support area of 1.3010, provided that a false breakdown is formed there or purchase for a rebound after the support test of 1.2967, where the lower border of the new ascending channel formed on February 10 also passes. To open short positions on GBPUSD, you need: Sellers achieved the formation of a false breakdown and almost reached the level of 1.3010, but the test did not take place. In the second half of the day, everything will depend on the US data, and only a break with consolidation below this range will open a direct road to the lows of 1.2967 and 1.2928, where I recommend fixing the profits. If buyers regain the resistance of 1.3052, then short positions in GBP/USD are best postponed until the test of the maximum of 1.3093 or sell even higher on a rebound from the resistance of 1.3133. Signals of indicators: Moving averages Trading is conducted around the 30 and 50 daily averages, which keep the pair from falling and keep the market bullish. Bollinger Bands A break of the upper border of the indicator at 1.3060 will lead to a new wave of pound growth.
Description of indicators
|
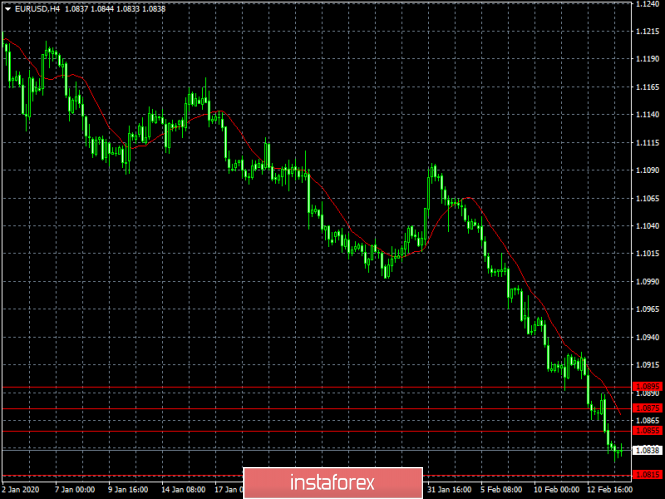
| Posted: 14 Feb 2020 05:06 AM PST To open long positions on EURUSD, you need: In the morning forecast, I paid attention to the report on the growth of the German economy and the eurozone, which disappointed many traders. Germany did not show any growth in the 4th quarter, while the eurozone's GDP declined year-on-year. All this is a bad signal for the euro, which will remain under pressure in the medium term. As for the current moment, the bulls are still holding the pair at the lows of the week, but everything will depend on the report on the volume of retail trade in the United States. There are no people willing to buy the euro, so you need to act carefully, and only a false breakdown of the level of 1.0834 will be a signal to open long positions in the hope of returning to the maximum of 1.0867, a break of which will lead the pair to the levels of 1.0896 and 1.0922, where I recommend fixing the profits. In the scenario of a further fall in the euro, you can look at long positions for a rebound from the minimum of 1.0804 or even lower in the support area of 1.0773. To open short positions on EURUSD, you need: Sellers continue to push the euro and are marking the lows of the week. A breakdown of the support of 1.0834 will be a signal to open short positions, and the main goal of the bears will be the lows of 1.0804 and 1.0773, where I recommend fixing the profits. In the scenario of growth against the background of a weak report on retail sales, it is best to return to short positions on the correction from the maximum of 1.0867 or sell the euro immediately on the rebound in the area of 1.0896. Signals of indicators: Moving averages Trading is conducted below the 30 and 50 moving averages, which indicates a further decline in the euro trend. Bollinger Bands Volatility fell before important data, which does not give signals to enter the market.
Description of indicators
|
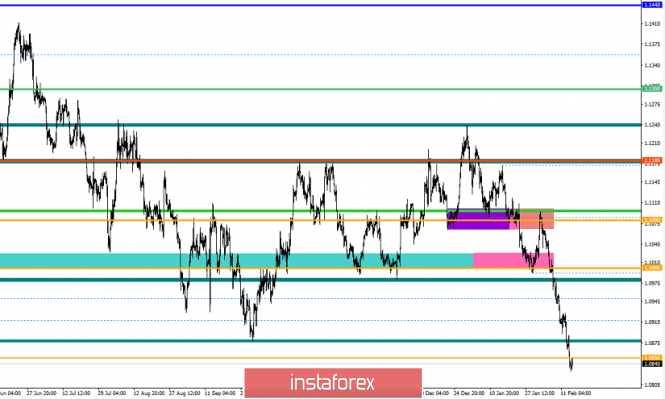
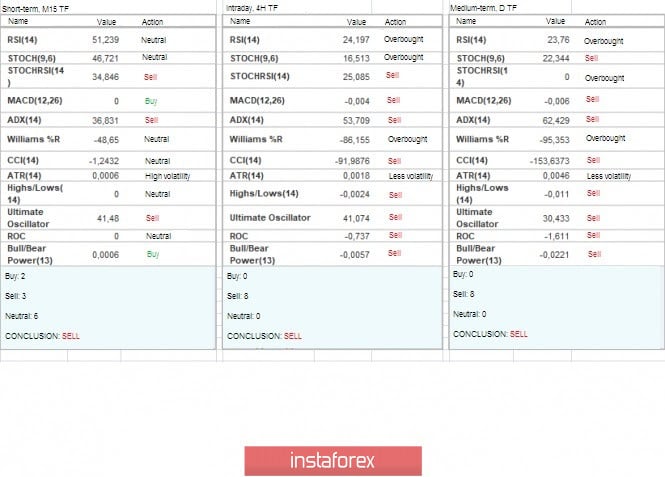
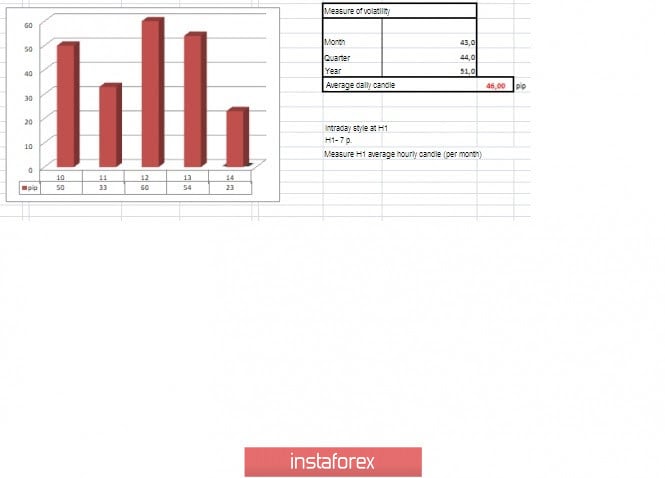
| Trading recommendations for the EURUSD pair on February 14 Posted: 14 Feb 2020 05:06 AM PST From a comprehensive analysis, we see the price-fixing below the level of 1.0850, which is a good sign in terms of the development of our theory, and now about the details. The downward course set by the market on January 2 (2020) does not cease to surprise us with its pressure, where an oblong correction has already been developed, and the lows have been updated with a fix below the value of 1.0850. In fact, everything goes to the fact that the theory of the resumption of the main downward trend has the right to exist, but you should not rush into action. Caution is associated with a lot of pressure on market participants, as well as psychological ranges under the quote. It is worth considering that any movement must have cycles (Impulse-Correction), without these elements there will be no stability. Thus, the existing overheating of short positions associated with such a significant decrease can lead to a local correction/pullback, which will not bring a change in the general movement but will give it new strength. In terms of volatility, we see a continuing acceleration that was set a day earlier. In fact, even without taking into account the last days, we see healthy activity that consistently adheres to the daily average. Analyzing the trading chart every minute, we see that the main round of the downward movement occurred in the period of 12:30-17:00 (time on the trading terminal). The subsequent movement was in terms of the residual course, which more closely resembled slowing down. As discussed in the previous review, traders were waiting for the moment of fixing the price below the mark of 1.0850 since this moment would reflect the continuation of the downward mood and lead to the opening of new trading positions for sale. In turn, the theory of speculative positions from the value of 1.0864 coincided, which reflected the extension of the move towards the control level. Looking at the trading chart in general terms (the daily period), we see that the downward trend has resumed its movement, and this moment is probably only the beginning in the structure of new turns of decline. The news background of the previous day included data on inflation in the United States, where growth was recorded from 2.3% to 2.5% with a forecast of 2.4%. The indicators that we have received are very good in terms of further strengthening of the dollar, as well as curtailing the process of reducing the Fed's rate. At the same time, along with inflation, data on applications for unemployment benefits were released, which showed a significant decrease of 59 thousand, which also has a positive impact on the US dollar. In terms of the general information background, we have the same spectrum of noise: the upcoming Brexit negotiations; the coronavirus and its impact on the world economy; the ECB and its plans to modernize monetary policy. All these factors affect the interest of investors, as well as speculators, setting us a clock component. Today, in terms of the economic calendar, we have already received data on the European Union, where GDP figures for the fourth quarter showed a slowdown in economic growth from 1.2% to 0.9% with a forecast of 1.0%. In fact, this is the very factor that is holding the pair back from a technical correction that is already overdue. In the afternoon, we are waiting for data on retail sales in the United States, where they forecast a slowdown from 5.8% to 4.9%. It is worth considering that the existing forecasts for retail sales do not play in favor of the dollar, but if we consider the recent report of the Ministry of Labor, we see that the forecasts can be changed for the better. The upcoming trading week begins with a weekend in the United States, where the Presidential Day is celebrated, which may affect trading volumes. In terms of the economic calendar, we see that the mainstream of events begins on Wednesday, where the minutes of the Fed meeting will be published, followed by the minutes of the ECB's monetary policy meeting on Thursday, and the finish line will be inflation in the eurozone. The most interesting events displayed below: On Monday, February 17 USA - a holiday On Wednesday, February 19 USA 14:30 London time - Dynamics of building permits (m/m) (Jan): Prev 1.420M -> Forecast 1.450M USA 14:30 London time - Started construction of houses (m/m) (Jan): Prev 1.608M -> Forecast 1.390M USA 14:30 London time - Producer price index (y/y) (Jan): Prev 1.3 -> Forecast 1.4% USA 20:00 London time - Protocol of the meeting of the US Federal Open Market Committee On Thursday, February 20 EU 13:30 London time - Protocol of the ECB meeting on monetary policy USA 14:30 London time - applications for unemployment benefits On Friday, February 21 EU 11:00 London time - Inflation: Prev 1.4% Further development Analyzing the current trading chart, we see that the quote is concentrated within the level of 1.0850, where there is a sense of restraint. Although for a healthy downward tact, we would now see a pullback correction, however, it still does not exist, which leads to further overheating of short operations. In fact, this kind of delay can lead to even more fixations, which will not reflect well on the tact. At the same time, do not be afraid of corrections, since the descending tact has already been set, the lows of this period have been broken, and confidence in the further course is growing every day. Regarding the current component, I would like to say that a technical correction is overdue. If you use strict money management in your work, you should not be afraid of anything, keep short positions in the strategic review. Detailing the available period every minute, we see extremely weak activity directed to the level of 1.0850. In terms of the emotional mood of market participants, we see a significant influx of new participants, just against the background of updating the lows. In turn, the traders continue their work based on a strategic downstream position. At the same time, having speculative operations just in case of technical corrections/rebounds. It is likely to assume that if the data on the States come out worse, together with the overheating of short positions, as well as fixing the price higher than 1.0850, we will have an opportunity to earn on the correction. The main positions continue to work downwards towards 1.0700. Based on the above information, we will output trading recommendations: - Buy positions will be considered if the price is fixed higher than 1.0850. - Positions for sale are already held by traders, but taking into account possible corrections. If we don't have any positions, we can consider the point of 1.0825 to enter the trade. Indicator analysis Analyzing different sectors of timeframes (TF), we see that the indicators of technical instruments are focused on the main course, signaling a sale. Volatility for the week / Volatility Measurement: Month; Quarter; Year. The volatility measurement reflects the average daily fluctuation from the calculation for the Month / Quarter / Year. (February 14 was based on the time of publication of the article) The volatility of the current time is 23 points, which is a low value, but taking into account this stagnation, together with the news background and speculative positions, it is possible to forecast that the day will end within the average daily volatility indicator, possibly above it. Key levels Resistance zones: 1.0850**; 1.0879*; 1.0900/1.0950**;1.1000***; 1.1080**; 1.1180; 1.1300**; 1.1450; 1.1550; 1.1650*; 1.1720**; 1.1850**; 1.2100. Support zones: 1.0700; 1.0500***; 1.0350**; 1.0000***. * Periodic level ** Range level *** Psychological level ***** The article is based on the principle of conducting a transaction, with daily adjustments. The material has been provided by InstaForex Company - www.instaforex.com |
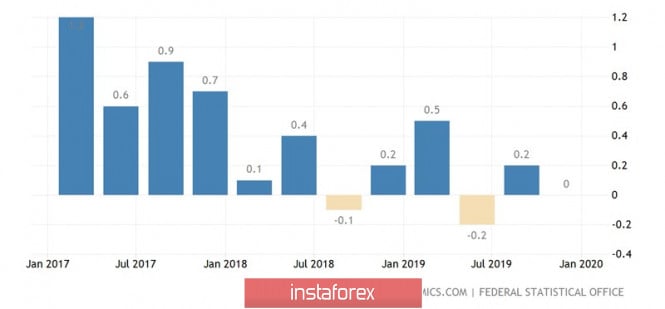
| Posted: 14 Feb 2020 05:06 AM PST A strong economy is a strong currency, a weak economy is a weak currency. This truth is as old as the world and continues to work like a clock. At the end of the fourth quarter, German GDP failed to grow, expanding by a modest 0.6% in 2019, which is the weakest result since 2013. These figures can not be compared with the American indicators, which allows the EUR/USD pair to determine the direction. It goes south and has already reached its lowest level since April 2017. Will there be more? The dynamics of German GDP
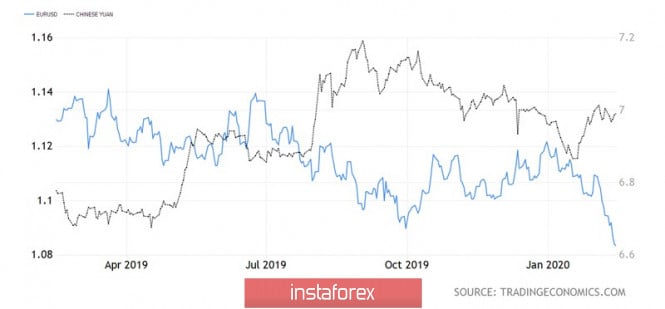
Gross domestic product is an important but lagging indicator. Is it worth focusing on it, because it's February, and the data came out for October-December? The problem is that little has changed since the fourth quarter and the emergence of a new external stimulus, the coronavirus, will only worsen the situation in the German economy. It is open, export-oriented and has a significantly higher share of deliveries to China and Asia in general compared to the United States. Consequently, the slowdown in China's GDP to 4.5% in January-March, according to the forecast of Reuters experts, will bring more pain to the eurozone than to the States. It is not for nothing that the euro is sensitive to the dynamics of the Chinese yuan. In 2018-2019, their connection was due to a trade war, in 2020 - an epidemic. Dynamics of the euro and the Chinese yuan
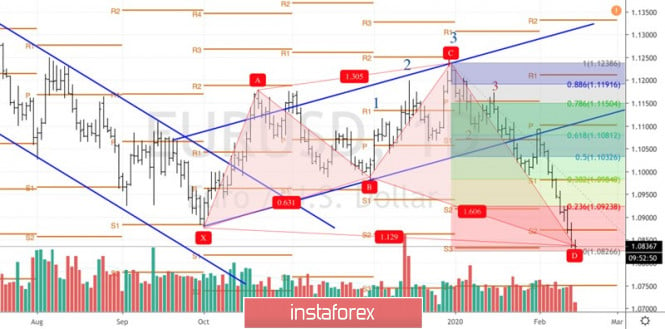
If one of the reasons for the collapse of EUR/USD in the week to February 14 was the expectation of weak statistics on German GDP, then within five days to February 21, such an irritant may be the release of data on business activity in Germany and the eurozone. Along with the publication of the minutes of the Fed and ECB meetings, it will attract increased attention of investors. Unlike the gross domestic product, the purchasing managers' index is a leading indicator. It is simply obliged to show the consternation of the companies of the Old World because of the coronavirus. Perhaps the EUR/USD peak would not have been so rapid if it had not been for talk of divergence in monetary policy and the status of the euro as a funding currency. Encouraged by the resilience of the US economy, US stock indices regularly update historical highs and lead equity markets around the world. As a result, carry traders gradually return to the game, buy risky assets and sell funding currencies. Jerome Powell and his colleagues are optimistic about the current situation and prospects for the US economy and believe that it will be able to grow above trend in 2020. There is no reason to lower the Federal funds rate, but rumors of an easing of the ECB's monetary policy are growing like a snowball. Thus, divergences in economic growth and monetary policy, the status of the dollar as a safe haven asset and the euro as a funding currency are key drivers of the EUR/USD downward trend. Technically, the main currency pair reached the target of 113% on the "Shark" pattern. If the "bulls" manage to catch on to the current levels, the probability of a pullback to 23.6%, 38.2% and 50% of the CD wave will increase as part of the "Shark" transformation to 5-0. On the contrary, if the "bears" attacks are not contained, we should expect the continuation of the peak to the pivot levels of 1.075 and 1.063. EUR/USD, the daily chart
|
| Analysis and forecast for EUR/USD on February 14, 2020 Posted: 14 Feb 2020 05:06 AM PST Hello, dear colleagues! In today's article, we will summarize the interim results of trading on February 10-14 and consider the options for closing the current week. Intermediate because the week is not closed yet and various changes may occur during the day. Such a strong bearish sentiment remains on the main currency pair that it is hardly necessary to count on a radical change in the situation. However, as I have repeatedly noted, the most incredible things happen in the market, and you should always be prepared for this. As they say, keep an eye out. First, let's take a look at the economic calendar, which may be interesting and significant for the main currency pair. Despite the last day of the trading week, there are plenty of events. Eurozone: German GDP, eurozone GDP, trade balance, no seasonal adjustments. USA: import price index, retail sales, industrial production, consumer sentiment index from the University of Michigan. You can see the time and forecasts for these and other events in the economic calendar. Weekly
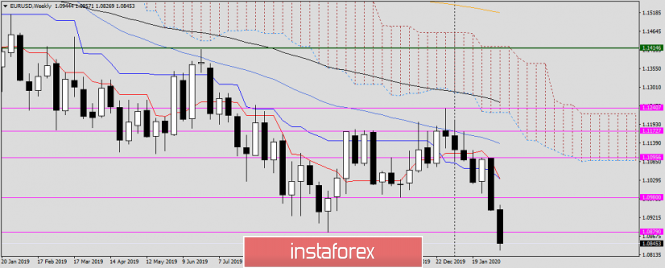
As I have written many times, I usually show and review the weekly chart on Mondays, after the close of the previous trading week. Today, I decided to pay attention to the weekly timeframe to show the full strength of the bear market for EUR/USD. The pair is under pressure and is trading below the most important support level of 1.0879. However, there is a slight rebound from the current minimum values, which were shown at 1.0827. If the weekly trading closes below the pink support level of 1.0879, it is likely to be considered broken and expect a continuation of the downward trend. If market sentiment suddenly changes in favor of the single European currency and the current weekly candle is with a long lower shadow and the closing price above 1.0879, it is time to think about a reversal. At least, about the reversal on the correction. So far, these are the main points that you should pay attention to on the weekly chart. Daily
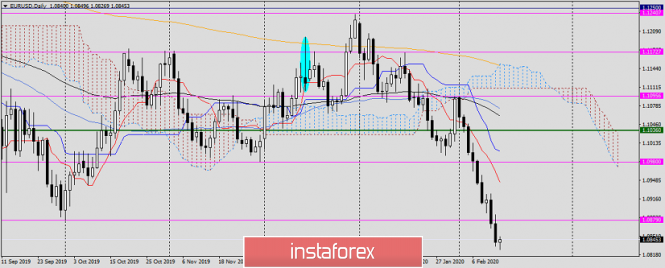
The candle for February 11, which could become a reversal, did not become one. Bears simply "ate" it, as evidenced by the two subsequent days of intensive decline. Is history repeating itself today? Once again, a nondescript candle with a small bull body. After the previous false reversal candle, it is difficult to believe in a reversal for correction. However, various kinds of emotions should be put aside and set out a trading plan for yourself. Although today is Friday, when it is better not to open new deals and not to transfer them to Monday, in case of a rollback to the support area of 1.0879, I suggest selling EUR/USD. A higher and more favorable price for opening short positions on this pair is at 1.0945, where the Tenkan line of the Ichimoku indicator has fallen (following the price). But to be honest, today there is very little chance that the price will reach such high values. It's good if they reach 1.0879. That is all that comes to mind when looking at the daily chart. H1
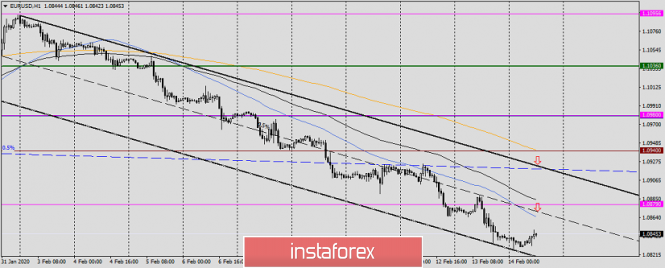
I built a descending channel with the parameters of 1.1093-1.1049 (resistance line) and 1.0834 (support line). Arrows indicate the proposed options for sales. And tellingly, they coincide with the assumptions for opening short positions given above. As you can see, near the broken support of 1.0879, there is a middle line of the channel (dashed), 50 simple and 89 exponential moving averages. All this can become a very strong resistance if the price rises to the area of 1.0879. Sales from here are technically justified. Further prices for opening short positions can be found on the approach to the upper border of the channel — this is the area of 1.0920. Typically, the hourly 200 EMA is at 1.0940, slightly below 1.0945, where the daily line of the Ichimoku Tenkan indicator runs. I think it's clear. I will not load you with unnecessary writing anymore. In my personal opinion, sales are technically justified near 1.0879 and around 1.0915-1.0945. Good luck! The material has been provided by InstaForex Company - www.instaforex.com |
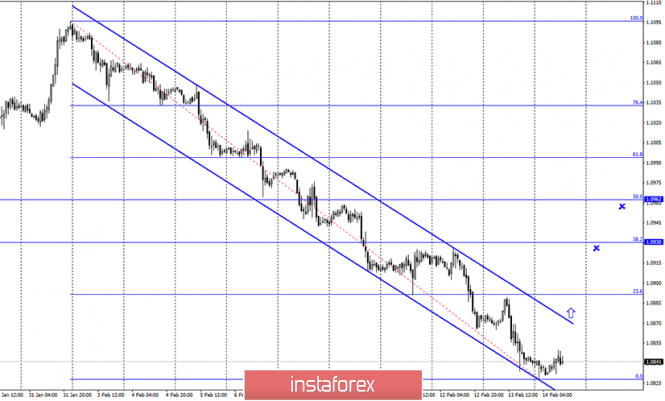
| EUR/USD. February 14. We are waiting for the close above 1.0870 and buy the euro on correction Posted: 14 Feb 2020 05:05 AM PST EUR/USD – 24H.
Good day, dear traders! First of all, I would like to inform you that the long-term trading week that I announced a few weeks ago has been more than fulfilled. Yesterday, I doubted that the drop in quotes would continue, as the pair rested on strong support, which could form a "double bottom" pattern in the event of a rebound. However, the information background now supports the dollar so much that the fall continued and the initial target level of 1.0850 was worked out. Thus, the development of this trading idea can be considered complete. EUR/USD – 1H.
On the hourly chart, we have a downward trend corridor, which is quite narrow, which indicates a small number of pullbacks against the main trend. Thus, the new trading idea is to buy the European currency if the quotes of the euro/dollar pair perform a close over the trend area, which continues to determine the current mood of traders as "bearish". I believe that after such a strong fall, it is reasonable to expect a 38% or 50% pullback. However, also, given the strength of the trend, and the information background that only supports the dollar, I recommend waiting for the exit from the trend range as a confirmation of the trading idea. The targets are 1.0930 and 1.0962. That is, the potential Take Profit will be 60-80 points, which is not so small for the euro. By the way, the information background continues to put pressure on the euro today, Friday, February 14. The GDP of the EU has lost even more growth and is only 0.9% y/y in the fourth quarter, while traders expected at least a 1% increase. The euro is still holding back from a new fall. We are waiting for American news on retail sales and industrial production. Forecast for EUR/USD and trading recommendations: The new trading idea is to buy the euro with the targets of 1.0954 and 1.0981. Unlike previous risky trading ideas, this time I suggest waiting for the closing over the trend range, and then start buying. This condition may take from one to several days to complete. The material has been provided by InstaForex Company - www.instaforex.com |
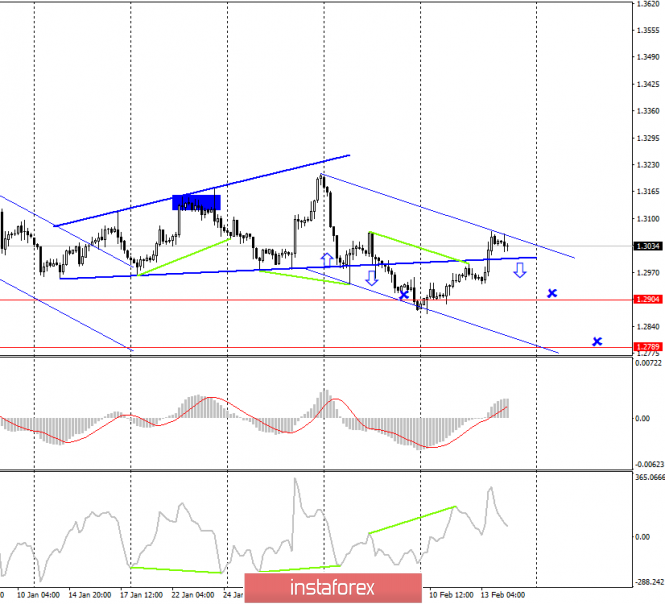
| GBP/USD. February 14. American statistics will determine whether the pound is ready for a new fall Posted: 14 Feb 2020 05:05 AM PST GBP/USD – 4H.
Good day, dear traders! As seen on the 4-hour chart, the pound was easily fixed itself above the global correction line, however, a downward trend corridor was also formed, which now allows us to count on a reversal in favor of the US currency and the resumption of the fall in the direction of the original target levels of 1.2904 and 1.2789. Thus, fixing the pair's rate below the correction line will allow selling the pound. I still believe that the pound is prone to fall, but Friday's information background (the US reports on retail sales and industrial production) may affect the mood of traders. The growth of the pound can be continued if both reports from the US are weaker than forecasts. In the UK, economic data was not released yesterday and today. Forecast for GBP/USD and trading recommendations: The trading idea is to sell the pound with the targets of 1.2904 and 1.2789 when fixing quotes under the correction line (marked with a down arrow). If this condition is met, I recommend selling the pound/dollar pair again. The material has been provided by InstaForex Company - www.instaforex.com |
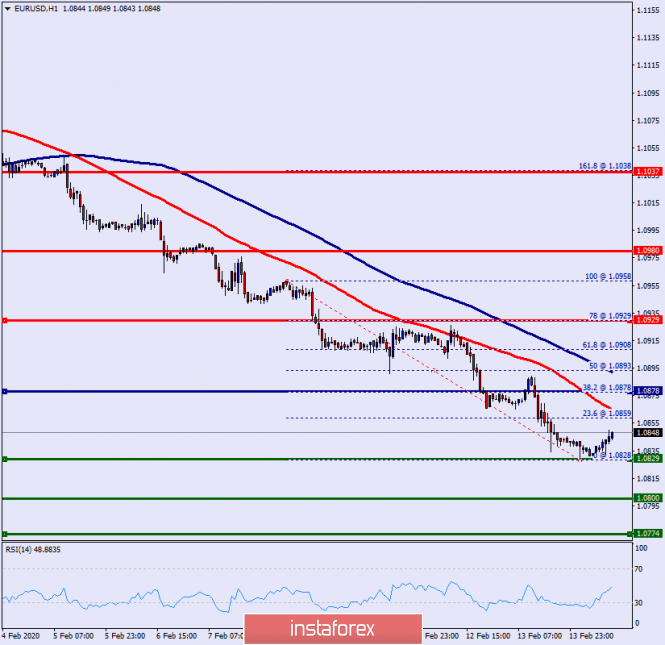
| Technical analysis recommendations for EUR/USD on February 14 Posted: 14 Feb 2020 02:39 AM PST Overview: Bearish outlook for the EUR/USD pair. The EUR/USD pair dropped sharply from the level of 1.0929 towards 1.0829. Now, the price is set at 1.0845. The resistance is seen at the levels of 1.0878 and 1.0929. Volatility is very high for that the EUR/USD pair is still expected to be moving between 1.0878 and 1.0800 in coming hours. We expect the EUR/USD pair to continue to trade in a bearish trend from the new resistance level of 1.0878 to form a bearish channel. Also, it should be noted that major resistance is seen at 1.0929, while immediate resistance is found at 1.0878. According to the previous events, the pair is likely to move from 1.0878 towards 1.0828 and 1.0800 as targets. Moreover, if the pair succeed to pass through the level of 1.0829, the market will indicate a bearish opportunity below the level of 1.08029. So, the market will decline further to 10800 in order to return to the daily support 2. Moreover, a breakout of that target will move the pair further downwards to 0.0774 (S3). On the contrary, if a breakout takes place at the resistance level of 0.0980, then this scenario may become invalidated. The material has been provided by InstaForex Company - www.instaforex.com |
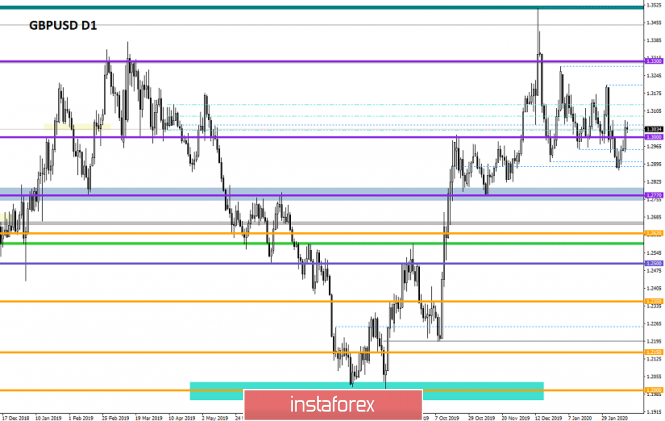
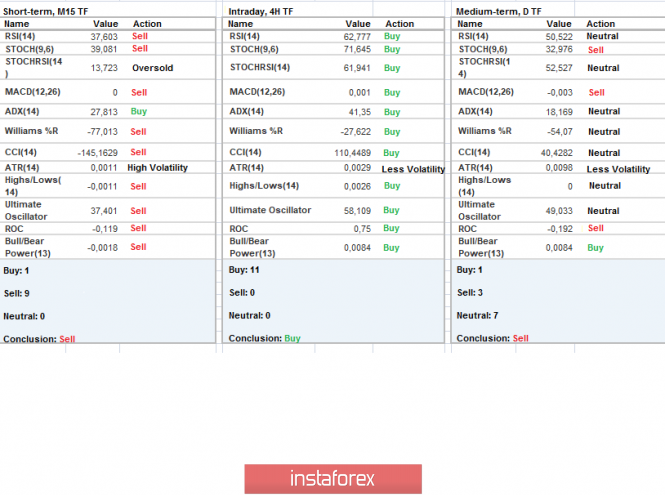
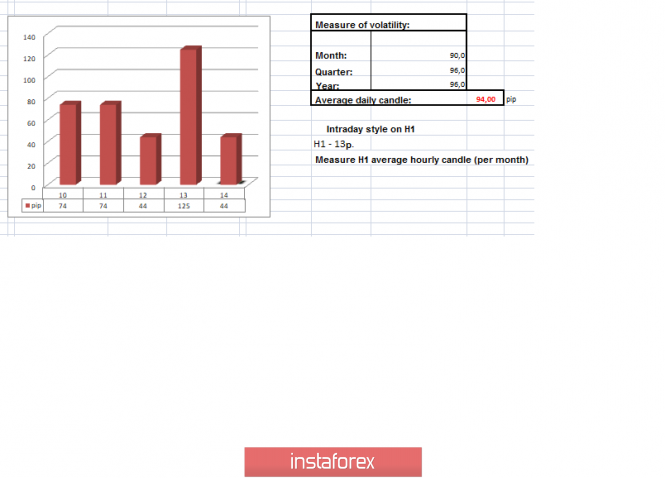
| Trading recommendations for GBP/USD pair - prospects for further movement Posted: 14 Feb 2020 02:37 AM PST From the point of view of complex analysis, we see a sharp acceleration, where the quote locally flew to the level of 1.3068, and now let's talk about the details. After the breakdown of the clock component and decline to a variable level of 1.2885, the process of formation began, where the return to the psychological point of 1.3000 was extremely large. In the previous review, we warned you that fluctuations within the 1.3000 [+/- 50 pip] level are a perfectly normal process where you can even make money. The recommendation on local entry into long positions above the level of 1.000 with a prospect of 1.3050 worked with a profit. Is it worth it to make a noise that the theory of the downward move is being destroyed is still unknown. I think it's too early to panic, since there are still a lot of confirming signals of this theory. In our last articles, we repeatedly presented arguments from the technical and fundamental side, which confirmed the theory, but did not specify the terms. So, the theory is built on the medium-long term, where you should not expect quick changes or immediate jumps, since everything should happen sequentially. After that, we will see a recovery in the global downward trend. The first step in terms of the formation of our theory has already been taken, we broke a looped cycle along the psychological level of 1.3000, and now it does not seem as indestructible as before. The next step, which will give confidence to market participants, will occur at the time of fixing the price in the range of 1.2770 / 1.2885 / 1.3000. Confirmation of the theory will come at the time of the breakdown of the level of 1.2770 and fixing the price below it. In terms of volatility, we see a looping slowdown of five trading days, which led to a regular acceleration, where the activity of the day was 125 points, which is 32% more than the average daily value. Details of volatility: Thursday - 79 points; Friday - 79 points; Monday - 74 points; Tuesday - 74 points; Wednesday - 44 points; Thursday - 125 points. The average daily indicator, relative to the dynamics of volatility is 94 points [see table of volatility at the end of the article]. Detailing the past minute by minute, we see that the main turn occurred in the period 13: 45-14:30 [UTC+00 time at the trading terminal], where we observed the upward movement. The subsequent swing was in terms of a small pullback. As discussed in the previous review, traders who adhere to strategic tactics have downward positions with a conservative volume per trade. In terms of speculative positions, there were local operations from 1.000 to 1.3050. Considering the trading chart in general terms [the daily period], we see a medium-term upward trend, in the structure of which all the existing fluctuations occur. In turn, the global trend remains downward, in the structure of which the current medium-term trend is developing. The news background of the past day contained inflation data in the United States, where growth was recorded from 2.3% to 2.5% with a forecast of 2.4%. The indicators are very strong in terms of medium-term consideration of the dollar, where we get significant support and insurance from a possible Fed rate cut. In terms of general information background, we had a strong market reaction to personnel changes in the UK government. So, Prime Minister Boris Johnson fired four key cabinet ministers, but the highlight of the program was the dismissal of Finance Minister Sajid Javid, which was a surprise to everyone. According to rumors from the media, Sajid Javid refused Johnson to dismiss a number of closest advisers on the ministry, to which he received an answer in the form of his resignation. In his place came the former Goldman Sachs banker, Rishi Sunak, where the market reaction was local in the form of expectations that he would be able to get the right people with incentives in the form of cash injections that would be taken into account in the budget. The reverse side of the picture remained in the shadow; this action, in anticipation of the publication of the budget, casts doubt on the financial caution of the government, which is likely to not complied with and is spontaneous. Let me remind you that the budget was supposed to be published on March 11, but in view of such events it can be delayed as a hypothesis. Today, in terms of the economic calendar, we have data on retail sales in the United States, where they expect a significant slowdown in growth from 5.8% to 4.9%. It is worth considering that the existing forecasts for retail sales do not play in favor of the dollar, but if we consider the recent report of the Ministry of Labor, we see that the forecasts can be changed for the better. The upcoming trading week begins with a weekend in the United States, where Presidential Day is celebrated, which may affect trading volumes. In terms of the economic calendar, we have a lot of statistics, where inflation is expected in Britain, as well as the minutes of the Fed meeting. The most interesting events displayed below ---> Monday February 17th USA - Day off Tuesday February 18 United Kingdom 9:30 Universal time - Applications for unemployment benefits (Jan): Prev 14.9 thousand .---> Forecast 22.6 thousand Great Britain 9:30 Universal time - Unemployment Rate: Prev 3.8% United Kingdom 9:30 Universal time - The average level of salary, including bonuses / excluding bonuses Wednesday February 19th Great Britain 9:30 Universal time - Inflation: Prev 1.3% USA 13:30 Universal time - Dynamics of building permits (m / m) (Jan): Prev 1.420M ---> Forecast 1.450M USA 13:30 Universal time - Started construction of houses (m / m) (Jan): Prev 1,608M ---> Forecast 1,390M USA 13:30 Universal time - Producer Price Index (YoY) (Jan): Prev 1.3 ---> Forecast 1.4% USA 19:00 Universal time - Protocol of the meeting of the US Federal Open Market Committee Thursday, February 20 United Kingdom 9:30 Universal Time - Retail Sales (YoY) (Jan) USA 13:30 Universal time - applications for unemployment benefits Friday, February 21 Great Britain 9:30 Universal time - Preliminary index of business activity in the services sector from Markit Further development Analyzing the current trading chart, we see that the quote has moved into the reverse phase after a slight stagnation within the level of 1.3050, bringing us closer to the key coordinate. In fact, we still see the error in the fluctuations of [1,3000 +/- 50 pip], which we wrote about yesterday; thus, fixing is conditionally still being carried out, although it was broken during the information noise. From the point of view of the emotional mood of market participants, we see a high coefficient of speculative positions, which gives increased interest in the existing fluctuations. By detailing the time interval that we have per minute, we see night stagnation with an amplitude of just over 25 points, where a breakdown of its lower border of 1.3035 occurred during the European trading session. In turn, traders continue to monitor the behavior of quotes, where the theory of decline is still relevant. At the same time, speculators are already in the process of impulse candles that occurred during the breakdown of the night oscillation. Having a general picture of actions, it is possible to assume that a price return below 1.3000 will come soon, and a subsequent tact will come to it, aimed at an average level of 1.2885, which will reflect price fixing in the new range. It is worth considering that the current news background in the United States may exert local pressure if forecasts coincide, thereby returning the price a little later, at the beginning of next week. - Local purchase positions were already considered in case of price fixing higher than 1.3065. - Positions for sale are already being conducted by traders in the direction of the level of 1.2770, a conservative volume per transaction. Speculative positions are lower than 1.3201 with a prospect of 1.2980-1.2960. Indicator analysis Analyzing a different sector of timeframes (TF), we see that hour periods have changed their interest to ascending - local due to the recent surge. At the same time, medium-term plots are still holding a downward trend, signaling sales. Volatility per week / Measurement of volatility: Month; Quarter; Year Measurement of volatility reflects the average daily fluctuation, calculated for the Month / Quarter / Year. (February 14 was built taking into account the time of publication of the article) The current time volatility is 44 points, which is still a low value in terms of dynamics. It is likely to assume that acceleration is possible against the background of the general market sentiment and a large number of speculative operations. Key levels Resistance Zones: 1.3000; 1.3170 **; 1.3300 **; 1.3600; 1.3850; 1.4000 ***; 1.4350 **. Support Areas: 1.2900 *; 1.2885 *; 1.2770 **; 1.2700 *; 1.2620; 1.2580 *; 1.2500 **; 1.2350 **; 1.2205 (+/- 10p.) *; 1.2150 **; 1,2000 ***; 1.1700; 1.1475 **. * Periodic level ** Range Level *** Psychological level **** The article is built on the principle of conducting a transaction, with daily adjustment The material has been provided by InstaForex Company - www.instaforex.com |
| EUR/USD: euro walks along the edge of the bottom Posted: 14 Feb 2020 02:05 AM PST The misadventures of the single European currency continue. The worst (since the 2012 currency block debt crisis) eurozone industrial production dynamics and a sharp increase in the number of deaths and infections with coronavirus in China triggered a drop in EUR / USD to its lowest level since April 2017. Meanwhile, investors continue to buy the us dollar not only as a protective asset, but also as a currency whose issuing country's economy demonstrates resistance to negative external factors. Most of the 63 experts recently polled by The Wall Street Journal believe that, US GDP growth in the first quarter will slightly slow down (by 0.5% or even less) due to the coronavirus epidemic. The consensus estimate for 2020 is 1.9%, for January while 1.6% in March. And according to Fed Chairman Jerome Powell, the US economy is still in excellent shape and there is no reason to believe that the period of low unemployment, wage growth and job creation will end. Moreover, economic expansion in the United States continues for the eleventh year, which is a new record. In turn, wages in the country are growing by about 3%, and unemployment is at 3.6%. Thus, when the United States is doing well, and the rest of the world which are led by China and the Euro zone, is doing poorly, one of the best investment decisions is to buy a dollar. Strengthening the American currency is like a hindrance for US President Donald Trump, who has been promising to bring national GDP growth to 3% for a year. Revaluation also interferes with local exporters, reduces corporate profits in the country and thus, slows down both the economy and stock indices. Therefore, it is not surprising that the head of the White House renewed criticism of J. Powell, noting that the Dow Jones index went down during his speech in Congress. In addition, D. Trump believes that the federal funds rate is too high, and the dollar is too strong, which negatively affects American exports. D. Trump's first statements frightened financial markets and served as a pretext for rumors about currency interventions by Washington, then by the end of D. Trump's first presidential term, they were already taken for granted. Moreover, comments of the owner of the Oval Office are not able to become a serious obstacle to EUR / USD to the downside. Thus, something more substantial is needed to save the "bulls" in the euro, especially since the eurozone industry is shrinking by 4.1% in twelve months, including December, and German manufacturers are already sounding the alarm about the lack of spare parts from China due to an outbreak of coronavirus. Against the background of the spread of the disease in the Middle Kingdom, the recession in the industrial sector of the currency block may continue, which means that the ECB will have every reason to soften its monetary policy. At the same time, the unsuccessful start of the euro in 2020 forced banks and investment companies, including Credit Agricole, JP Morgan, RBC Capital Markets, to revise forecasts for EUR / USD. The consensus estimate for the main currency pair for the fourth quarter was reduced from 1.16 to 1.14. "The hope for many was that Europe would gain momentum, that its assets would be in greater demand than US financial assets," said Danske Bank strategists. "However, these hopes for a European renaissance were not to be fulfilled, given the negative surprises in economic data this year. If the level of 1.12 turns out to be the maximum of 2020 in EUR / USD, we probably have not yet seen a minimum," they added. Now, the bulls will try to cling to support at $ 1.0830. If they fail, then the level of $ 1.0750 will follow, and then the level of $ 1.06. The material has been provided by InstaForex Company - www.instaforex.com |
| Euro knocking on a closed door Posted: 14 Feb 2020 01:27 AM PST By the end of this week, many analysts have understood the situation with the constantly falling euro. It turned out that investors expected a weakening single currency ahead of new data on German GDP. Experts believe that the rapid collapse of the euro can smooth out an extremely negative reaction to this macroeconomic report. A kind of "preparation for the fall" could not but affect the dynamics of the European currency, and for the worse. According to experts, such behavior is akin to learned helplessness, a state where a person does not feel the connection between effort and result. No matter what the euro does, no matter how it tries to rise, all its efforts are crossed out, and there was no difference between victory and defeat. However, nobody will succeed in knocking on the closed door for a long time, and after a while, the euro has surrendered. Experts do not have bright hopes regarding the upcoming report on Germany's GDP, the locomotive of the European economy. They are sure that in the fourth quarter of 2019, economic growth in the country will not exceed 0.1%. As for inflation in Germany, in January 2020 it will remain the same with -1.7%. The eurozone trade surplus is also expected to fall to 19 billion euros. Another, no less important factor that does not allow the euro to rise, but supports the dollar well, is the data on the level of inflation excluding food products and energy in the United States for January of this year. According to experts, this is a key indicator important for the further dynamics of the EUR / USD pair. According to the report, consumer inflation rose at a moderate pace, but this did not save the EUR / USD pair from further decline. On Thursday, February 13, experts recorded an upward correctional movement in the pair, which, as it turned out, was symbolic. Subsequently, rising to 1.0877, the tandem continued to slide in a downward spiral. According to experts, during the current week, the EUR / USD pair shows a recoilless downward movement. At a certain point, the tandem lingered a bit at 1.0852 and then headed towards the bottom. On Friday, February 14, the pair runs in the range of 1.0837–1.0838, trying to move on, but the efforts are ineffective. The greenback is relatively stable, and the euro again has to fight at the closed door and make a lot of effort to stay afloat. Analysts added that right now the average volatility of the EUR / USD pair has grown to 48 points per day, and the correction has completed. The classic tandem has reached minimum annual values and is not going to stop. To paraphrase a well-known saying, we can say that there is no limit to falling. The steady decline in the EUR / USD pair is causing market concern. Main concerns are on the euro, but the greenback also feels a hidden threat from such an unstable neighborhood. Recall that on Tuesday, February 11, a minimum of the year was reached in the EUR / USD pair, when the tandem reached the level of 1.0890. The downward movement continues today, even without significant news occasions and amid growing risk appetites. Experts fear that this recession will turn into a snowball, which will be very difficult to stop. Despite the extremely unfavorable situation for the euro, analysts do not lose hope of its recovery in the long term. At the same time, they expect that the euro will be able to push off from two-year lows, although they do not exclude their next update. Over the past two years, there has been a steady deterioration in the forecast for the growth of the European economy compared with the forecast for the growth of the US. According to experts, a rise of up to 1.8% is predicted for the US economy, and only up to 1% for the eurozone economy. As a result, the euro again loses and experts believe that it is now cheaper compared to the greenback, which has recently been more confident than ever. When examining the EUR / USD pair in a long-term context, experts expect a confident update of current lows and achieve Euro-dollar price parity. The material has been provided by InstaForex Company - www.instaforex.com |
| Posted: 14 Feb 2020 01:26 AM PST Good day, dear traders! Congratulations to those who used our trading idea to buy Netflix from January 23, 2020. Let me remind you that the idea was to combine fundamental and technical analysis presented in the article https://www.instaforex.org/en/forex_analysis/243804 Plan: Adjustment: The pass was an incredible 5600p! Good luck in trading and have a good weekend! The material has been provided by InstaForex Company - www.instaforex.com |
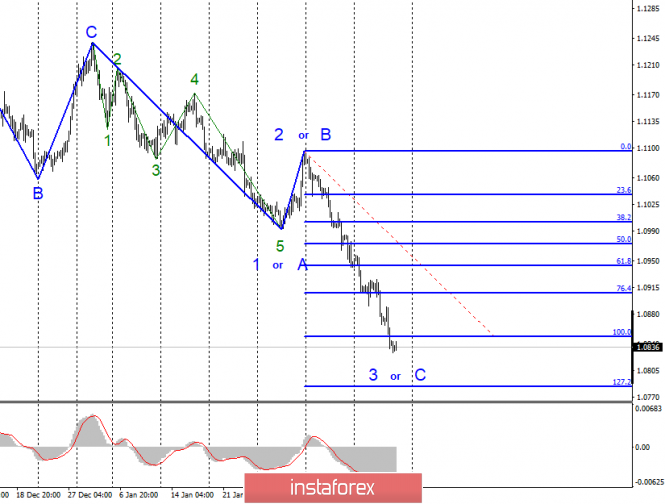
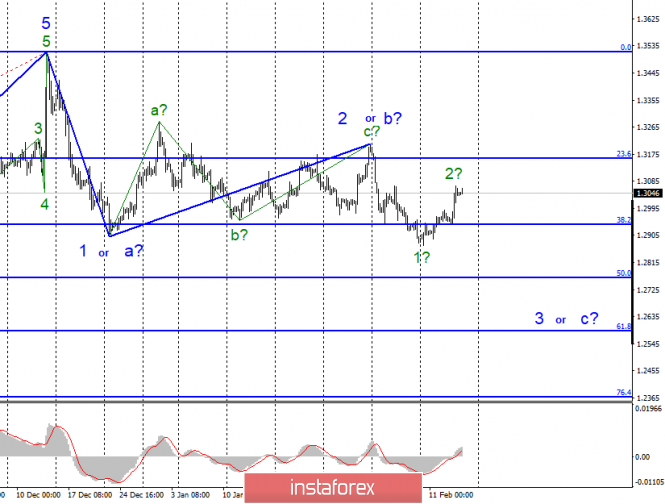
| Analysis of EUR/USD and GBP/USD for February 14. US inflation hit the euro currency hard Posted: 14 Feb 2020 01:18 AM PST EUR / USD On February 13, EUR / USD pair lost about 30 basis points and continued, thus building supposed wave 3 or C. I changed the last version of the current wave marking, since the prospective wave 1 in 3 or C is too extensive, and most of all, it's not just in the first wave 3 or C, and in fact, the whole wave 3 or C. Due to the very strong downward movement and very small correction waves, the internal wave structure of wave 3 or C does not have a pronounced five-wave structure that could be clearly seen. Currently, wave 3 or C has exceeded the size of wave 1 or A. An unsuccessful attempt to break through the 127.2% level may lead to quotes moving away from the lows reached. Fundamental component: Yesterday's news background was extremely interesting again for the euro/dollar instrument. Despite the fact that inflation in Germany coincided with the expectations of the currency market, the demand for the Euro currency continued to decline, as American inflation continued to accelerate and amounted to as much as 2.5% YoY in January. Of course, such a high value can not but rejoice the Fed, which has regularly complained of weak inflation in recent years. Now, the chances that the Federal Reserve will lower its key rate in 2020 are even lower. This means that the American economy continues to strengthen, which is good for the dollar and buyers of American currency. On Friday, the euro/dollar instrument may well continue to decline, as the news background will be strong again, which means that markets can find new reasons and reasons to lower demand for the euro. In Germany, a fourth quarter GDP report has already been released, which is predictably reduced to 0.4% y / y. Now, the next step is the Eurozone GDP report, where 1.0% y / y is expected, and in the afternoon - retail sales in the USA, industrial production and consumer confidence index from the University of Michigan. Judging by the forecasts, one can't expect anything optimistic from European statistics again, although this time, the American one may cause disappointment in the markets, as retail sales have neutral expectations, industrial production may again lose 0.2% compared to the previous period, and the consumer confidence index drops to 99.5. General conclusions and recommendations: The euro-dollar pair continues to build a downward set of waves. Since the current wave counting has changed, I recommend that those who are already in sales, stay in them with goals located near the calculated level of 1.0784, which corresponds to 127.2% Fibonacci. On the other hand, I don't recommend thinking about purchases, too strong downward trend. GBP / USD On February 13, GBP / USD added 75 basis points, which also led to a change in the current wave count. Wave 3 or C is still continuing its construction, but its internal wave structure is becoming more complicated and can take on a very non-standard form. For example, the alleged wave 1 in 3 or C has a pronounced 3-wave form, which does not coincide with the requirements of the impulse section of the trend. At the moment, the instrument is supposedly at the stage of building wave 2, which also does not fit too well into the overall picture of wave 3 or C, since it already has a fairly long view. However, until the current wave count remains valid, I recommend waiting for the construction of wave 3 in 3 or C. Fundamental component: The news background for the GBP / USD instrument on Thursday came down only to the US inflation report. If on EUR / USD, this report caused an increase in demand for the dollar, then the reaction was the opposite on GBP / USD. From which the conclusion follows: the British was influenced by other factors. And unfortunately, these factors are political again, not economic. Yesterday, it became known that British Prime Minister Boris Johnson dismissed five ministers at once and, in particular, Finance Minister Sajid Javid. The resonant event, which did not affect the UK economy in any way, provoked a positive reaction from the markets, which increased the demand for the British currency. However, based on the current wave markup, the decline in the instrument's quotes should resume in the near future. Today, the news background from Britain is empty, so only us news remains, which should be better than market expectations in order to trigger an increase in demand for the dollar and for the instrument to move to building a 3 in wave 3 or C. General conclusions and recommendations: The pound-dollar instrument construction continues downward wave 3 or C. Thus, I recommend resuming sales of the instrument by the MACD signal "down" with targets located near the level of 1.2767, which corresponds to 50.0% Fibonacci. The material has been provided by InstaForex Company - www.instaforex.com |
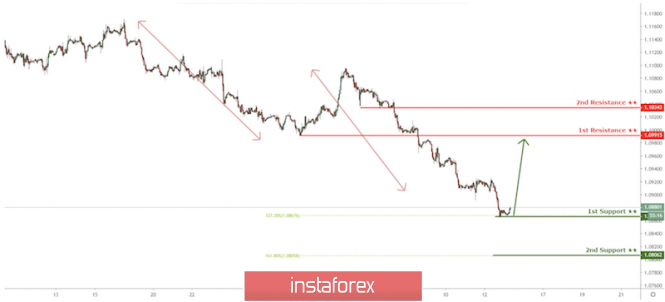
| USD/CAD reversing below key level now! Posted: 14 Feb 2020 01:18 AM PST
Trading Recommendation Entry: 1.32704 Reason for Entry: 38.2% Fibonacci resistance, Horizontal Swing high Take Profit : 1.32426 Reason for Take Profit: 50.00% Fibonacci retracement, Horizontal swing low Stop Loss: 1.32946 Reason for Stop loss: 61.8% Fibonacci retracement The material has been provided by InstaForex Company - www.instaforex.com |
| EUR/JPY approaching support, potential bounce! Posted: 14 Feb 2020 01:15 AM PST
Trading Recommendation Entry:118.744 Reason for Entry: 78.6% Fibonacci extension, horizontal swing low support Take Profit : 119.62 Reason for Take Profit: Horizontal pullback resistance Stop Loss:118.26 Reason for Stop loss: 127% Fibonacci extension The material has been provided by InstaForex Company - www.instaforex.com |
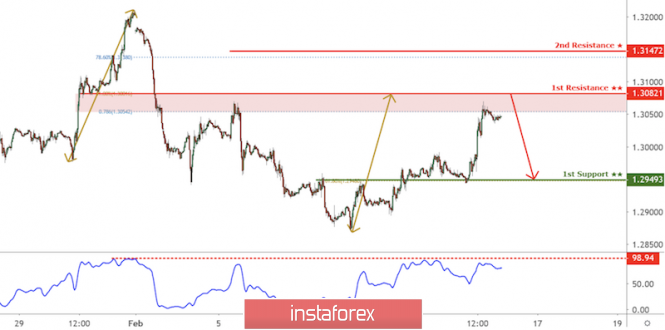
| GBP/USD approaching resistance, potential drop! Posted: 14 Feb 2020 01:14 AM PST
Trading Recommendation Entry: 1.30821 Reason for Entry: 100% Fibonacci extension, horizontal swing high resistance, 78.6% fibonacci retracement Take Profit : 1.29493 Reason for Take Profit: Horizontal overlap support, 61.8% fibonacci retracement Stop Loss: 1.31472 Reason for Stop loss: 78.6% Fibonacci retracement The material has been provided by InstaForex Company - www.instaforex.com |
| Privatization of one Kingdom or more (review of EUR/USD and GBP/USD on 02/14/2020) Posted: 14 Feb 2020 01:08 AM PST Honestly, yesterday gave me a storm of emotions; however, negative for the most part. I have a number of questions for the US Bureau of Employment and Statistics and slightly fewer questions to various financial structures of the Old World, showing the brilliant results of their intellectual activity. Well, what happened yesterday in the UK causes nothing but disgust and contempt.
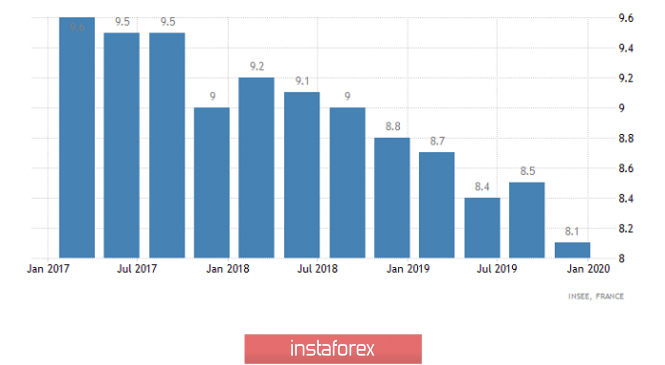
So, let's go in order. As it often happens, the market ignored European macroeconomic statistics, which, frankly, was extremely positive. After all, the unemployment rate in France declined from 8.5% not to 8.4%, but already to 8.1%. But such a noticeable improvement in the situation on the labor market does not bother anyone. At least from the ranks of those who manage the capital, circulating in the financial markets. After all, it's not about some small country there, but about the second economy of the euro area. Which, by the way, is also the second most populous in this very union. That is, a marked improvement in the situation on the labor market in France will inevitably affect the decrease in unemployment in the entire euro area. Unemployment Rate (France):
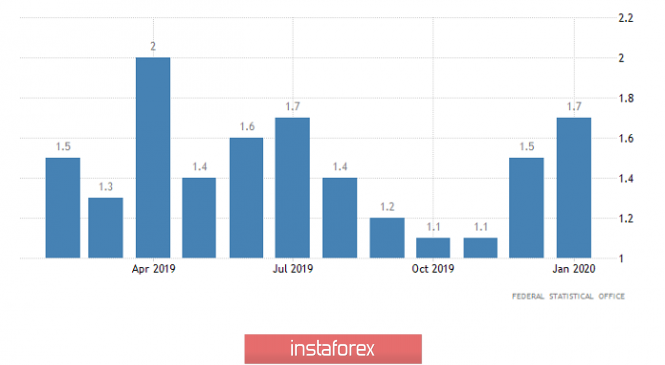
Similarly, data on inflation in Germany were ignored, but this is somehow justified, since they completely coincided with the forecasts. In any case, inflation in Germany rose from 1.5% to 1.7%, and since we are talking about the largest economy in the euro area, it means that inflation will have to increase throughout the monetary union. Nevertheless, this news was also left without attention. Moreover, the single European currency confidently went down about three hours after that. But more on that later. Inflation (Germany):
First you need to figure out what happened to the pound. Moreover, this is just an anecdotal story. The fact is that the pound, on which no news was planned at all, suddenly rushed up. The reason for this was a reshuffle in the UK government. It all started with the unexpected resignation of the chancellor of the government. In the UK, this post is similar to the post of Minister of Finance in other countries. The reason for the resignation of Sajid Javid was a disagreement with Boris Johnson. According to Sajid Javid himself, he could not accept the prime minister's demand to dismiss all his advisers and replace them with others. But these are only official statements. In fact, Sajid Javid, as a true treasurer, is careful about money, and his main task is to prevent squandering the royal treasury entrusted to him. Well, Boris Johnson almost pleases us every day with the next impressive projects designed to stimulate economic growth. At the same time, the cost of not all, but of each individual project, is amazing. And the projects themselves seem fantastic. Suffice it to recall plans to build a bridge between Northern Ireland and Scotland. However, the mere fact that the miser Chancellor resigned does not mean that money rain will be shed. So the pound's joyful growth looks strange. At least until then, until it became known that the new chancellor was Rishi Sunak, who is a native of Goldman Sachs. However, this news already fully justifies the joy of investors, since money can, but they will not pour too much on the implementation of Boris Johnson's projects, but politics will definitely be pursued satisfying the interests of large international capital. However, whether this policy will satisfy the needs and aspirations of Her Majesty's simple subjects remains a mystery. But the financial world is not too worried. And looking at this, one involuntarily recalls the words of the former head of the Federal Reserve System Alan Greenspan that banks need to be nationalized once a hundred years. However, it seems that the reverse process in Great Britain is happening when a single bank privatizes an entire state. But most importantly, this does not change the general economic situation in the UK, which is already causing more and more concern. So the growth of the pound is based solely on emotions, and it will soon go down again without some fundamental justification.
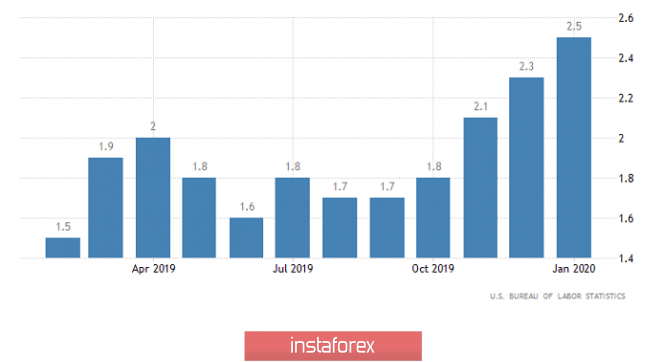
Now it's time to talk about yesterday's decline in the single European currency. On the one hand, everything is logical, since inflation in the United States rose from 2.3% to 2.5%, and not to 2.4%, as predicted. Consequently, the probability that the Federal Reserve will seriously talk about the possibility of raising the refinancing rate is becoming more and more real. But the whole point is that the single European currency was declining before these data were published. The movement stopped shortly before publication. But when it became known of a greater increase in inflation, the single European currency practically did not budge. So it's impossible to get rid of the thought that someone knew everything in advance, which means that the Bureau of Employment and Statistics needs to ask a number of questions about the data protection system. Well, there's only one conclusion from all this: if someone can use insider information and get ahead of all the others inside the day, then the meaning of short-term or intraday trading is simply lost. So, you need to look only at medium-term or long-term trends. Inflation (United States):
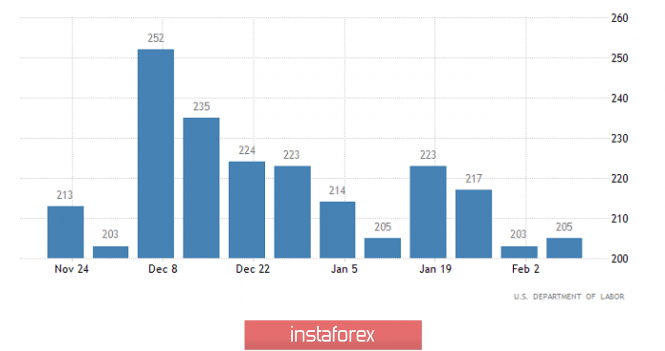
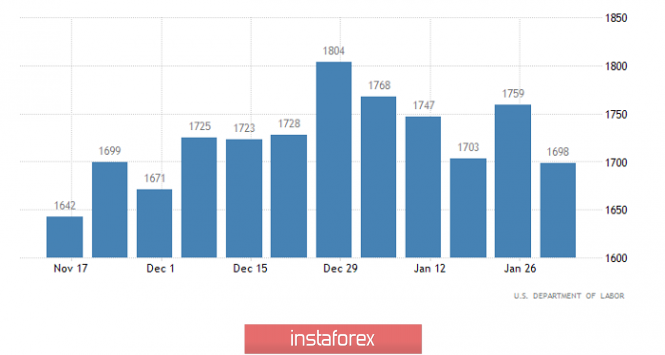
At the same time, the United States also published data on applications for unemployment benefits in addition to inflation. The total number of which was to be reduced by 10 thousand, but it decreased by 59 thousand. In particular, the number of initial applications increased by only 2 thousand, while they expected growth by 11 thousand. The number of repeated applications, instead of being reduced by 21 thousand, decreased by 61 thousand. Number of Initial Jobless Claims (United States):
Repeated Unemployment Insurance Claims (United States):
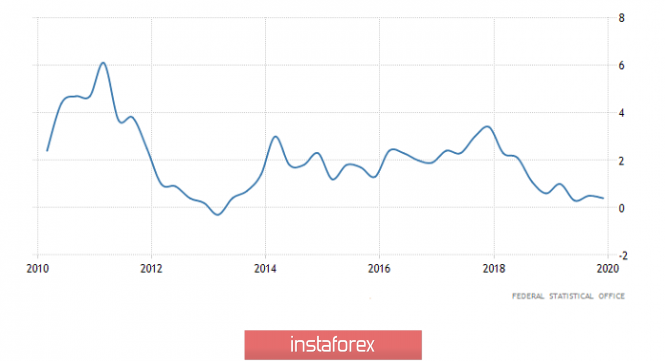
It is obvious that the market has long been overdue for a correction. At least for the single European currency, since the pound released a little steam yesterday. However, the European statistics themselves do not yet provide a reason for this. In particular, German GDP data for the fourth quarter has already been released, showing a slowdown in economic growth from 0.6% to 0.4%. At the same time, we expected a slowdown to 0.5%, so the results are worse than expected. So the extremely low rate of economic growth and the growing threat of recession clearly do not contribute to the growth of the single European currency. I want to note the sensational report of a major German Bank, which issued a study that, they say, the coronavirus will negatively affect the economic growth of Germany and the whole of Europe. As they say, where is the coronavirus and where is Germany? After all, GDP data for the fourth quarter, when there was no virus yet. And the fact that the economy will slow down was already understandable, since for this it's enough to just look at the latest industry data. However, there is such a curious moment. The fact is that the ongoing recession in industry will inevitably affect the growth of unemployment, which will be attributed not to the deplorable state of the economy, but to coronavirus. So we are waiting for the growth of unemployment in Europe. GDP growth rate (Germany):
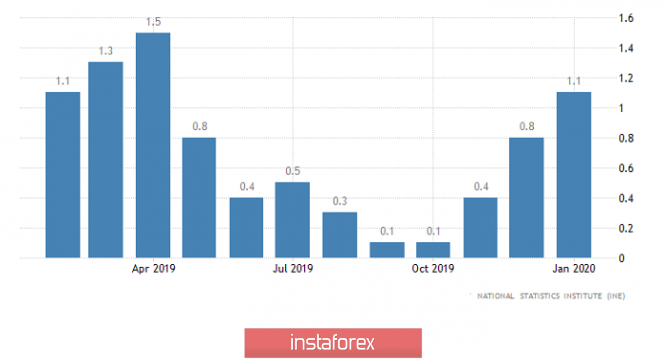
On the other hand, Europe was not without good news from sunny Spain, where the inflation rate increased from 0.8% to 1.1%, which coincided with the forecasts. But the market still did not respond to any data on Europe. Inflation (Spain):
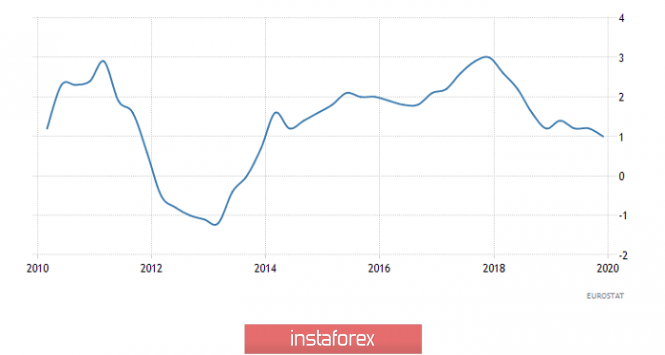
At the same time, the single European currency may decline slightly, since the data will also be published on the GDP of the entire euro area, which should already show a slowdown in economic growth from 1.2% to 1.0%. At the same time, data for Germany suggests that the actual value may be even lower. So the pressure on the single European currency will continue. GDP growth rate (Europe):
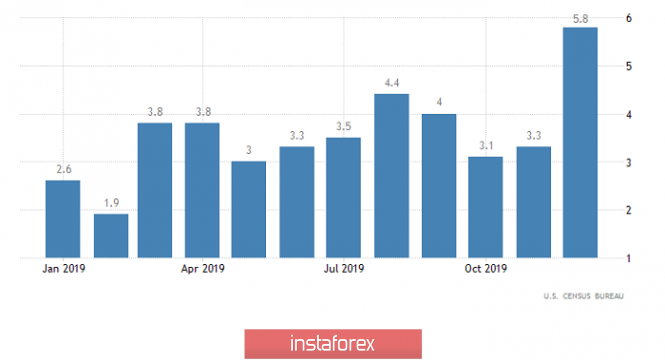
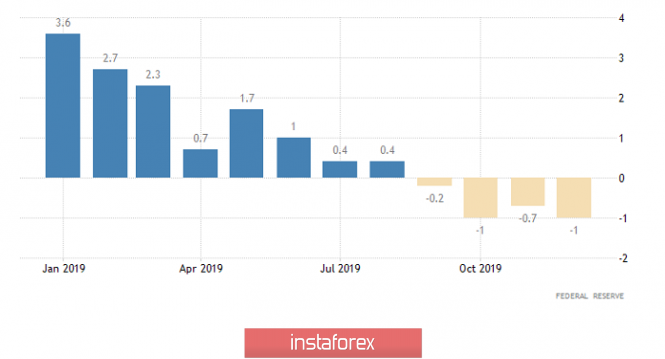
However, American statistics can give a helping hand to the single European currency and, finally, provoke a long-awaited correction. The central news will be data on retail sales, the growth rate of which should slow down from 5.8% to 4.9%. But, there is a possibility that the slowdown will not be so strong, since the report of the Ministry of Labor showed somewhat higher growth rates of the average hourly wage. Well, since revenues are growing, then consumer demand should also increase. Retail Sales (United States):
However, even if the deceleration is not so strong, we are still talking about deceleration. In addition, a further deepening of the decline in industrial production is expected and this time from -1.0% to -1.4%. This means that industrial production has been declining for five consecutive months. Which, of course, does not add optimism and faith in the future. Industrial Production (United States):
Most likely, the single European currency will initially decline to 1.0800, and will increase to 1.0875 by the end of the day.
Everything is somewhat different regarding the pound, since emotions will inevitably fade into the background, and investors will face the deplorable economic situation in the UK. Nevertheless, these same emotions helped it to make a local correction. So for now, it is worth waiting for its stabilization in the region of 1.3000 - 1.3050.
|
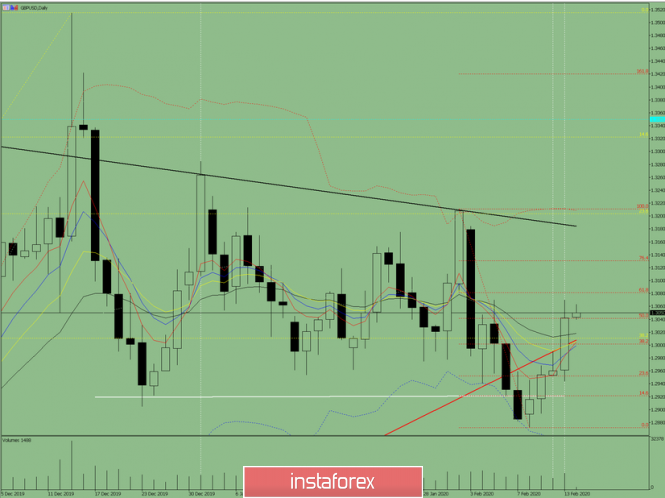
| Indicator analysis. Daily review of GBP / USD on February 14, 2020 Posted: 14 Feb 2020 12:30 AM PST The pair continued to move upward yesterday and broke through the pullback level of 50.0% equivalent to 1.3041 (red dotted line). Today, strong calendar news for the dollar is expected at 13:30 UTC. A possible continuation of upward movement with the first target 1.3081, the retracement level of 61.8% (red dashed line). Trend analysis (Fig. 1). Today, from the pullback level of 50.0% which is equivalent to 1.3041 (red dashed line), it is possible to move upward with the target 1.3081, the retracement level of 61.8% (red dashed line). If this level is reached, there is a rollback down with the target 1.3007, the support line (red bold line).
Fig. 1 (daily chart). Comprehensive analysis: - Indicator analysis - up; - Fibonacci levels - up; - Volumes - up; - Candlestick analysis - down; - Trend analysis - up; - Bollinger Lines - up; - Weekly schedule - up. General conclusion: Today, the price may continue to move up. An unlikely, but quite possible scenario is from a retracement level of 50% equivalent to 1.3041 (red dashed line), work down with a target of 1.3007, the support line (red bold line). The material has been provided by InstaForex Company - www.instaforex.com |
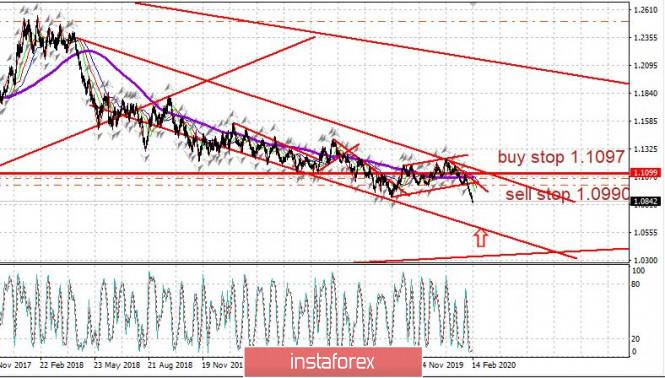
| Trader's Diary: EURUSD on 02/14/2020, Euro's fall until March Posted: 14 Feb 2020 12:25 AM PST
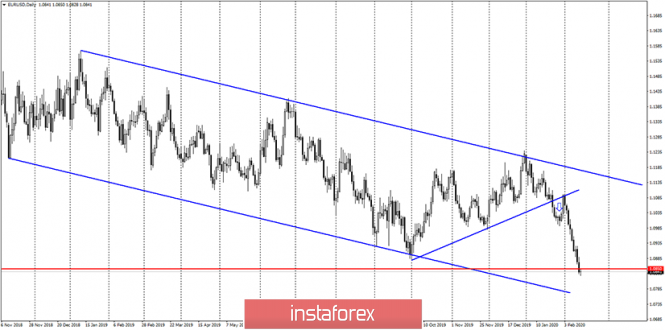
Above is the daily chart of the euro starting from the EUR/USD highs in the spring of 2018. The pair's two years of weak downward movement. The euro has been falling fast since February 3. We can't say exactly what caused the Euro's fall in February. If we take into account that the other major currencies do not fall so significantly against the dollar, we can assume that there are problems with the Euro. Options: revision of large portfolios after Britain left the EU. Britain was one of the EU donors, now the burden is on Germany. France will grow which is bad for the euro. Perhaps there is a crossover from the euro to pounds. A possible option is a significant tie of the German economy to China in supplying machinery and equipment to China, where the supply of parts are from China. The situation in terms of TA: There is a strong signal of a downward trend: a break down 1.0880 and consolidation below. According to the schedule, the descending border of the channel is clearly visible, which is conducted very conservatively. The fall of the euro will continue until the end of February with the target at 1.0600. EURUSD: We hold sales from 1.0990 and we wait for a corrective rebound up to 1.0940. The material has been provided by InstaForex Company - www.instaforex.com |
| You are subscribed to email updates from Forex analysis review. To stop receiving these emails, you may unsubscribe now. | Email delivery powered by Google |
| Google, 1600 Amphitheatre Parkway, Mountain View, CA 94043, United States | |









No comments:
Post a Comment