
Forex analysis review |
- Forecast for EUR/USD on March 5, 2020
- Forecast for GBP/USD on March 5, 2020
- Forecast for AUD/USD on March 5, 2020
- Control zones of USD/CAD on 03/05/20
- Control zones of NZDUSD 03/05/20
- Comprehensive analysis of movement options of #USDX vs EUR/USD vs GBP/USD vs USD/JPY (H4) on March 05, 2020
- EUR/USD. Take-off aborted: the pair retreated, but going into sales is still risky
- GBP/USD. Results of March 4. Pound calm as an elephant. Strong ISM index offset by the Fed key rate cut
- EUR/USD. Results of March 4. Central banks' efforts cannot stop the coronavirus. Just measures to smooth out negative effects
- EUR/USD: Fed upsets the dollar, will the ECB support the euro?
- Gold price has formed important medium-term bottom
- Short-term technical analysis on EURUSD
- AUDUSD moves higher as per our analysis
- March 4, 2020 : GBP/USD Intraday technical analysis and trade recommendations.
- March 4, 2020 : EUR/USD Intraday technical analysis and trade recommendations.
- Review for March 3, 2020. EUR/USD. US labor market remains strong in February
- EURUSD and GBPUSD: the services sector in the eurozone and the UK continues to support their economies. Retail sales recovered
- GBP/USD: plan for the US session on March 4. The nondescript PMI for the UK services sector scared off new buyers of the
- EUR/USD analysis for 03.04.2020 - Upward target reached at the price of 1.1200 but downside rotation is active and selling
- Analysis for Gold 03.04.2020 - Major resistance at the price of $1.650 on the test, watch for potential selling opportunities
- Trading plan for EUR/USD for March 04, 2020
- Trading recommendations for GBPUSD pair on March 4
- Gold dropped the ballast
- BTC analysis for 03.04.2020 - Bigger drop is expected towards the levle of $7.650, the breakout of mini Pitchfork channel
- Market review. Trading ideas. Answers for questions.
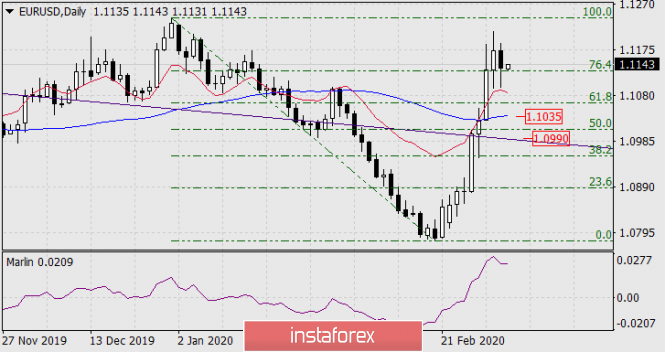
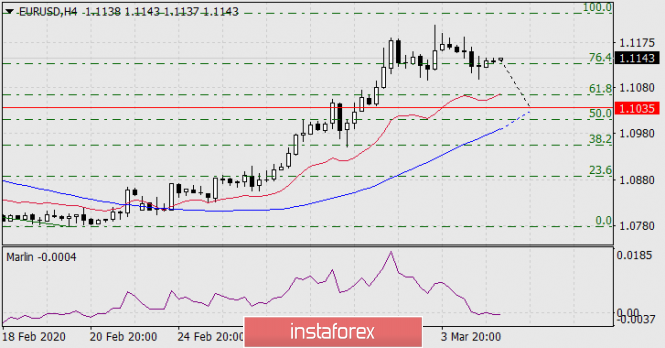
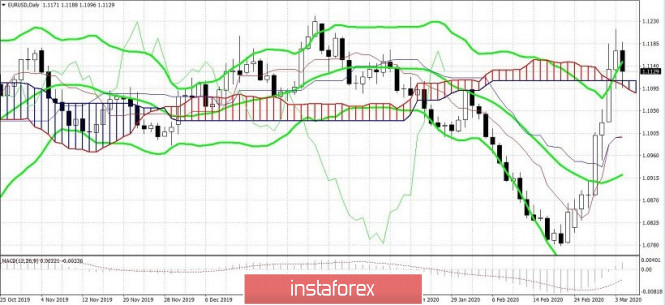
| Forecast for EUR/USD on March 5, 2020 Posted: 04 Mar 2020 08:18 PM PST EUR/USD The EUR/USD quote continues to stay at the Fibonacci level of 76.4% on the daily scale chart, in the area of Monday's close. Trading volumes were high, indicating closing positions from purchases since February 21. The euro is unfolding. The first goal 1.1035 is to support the MACD line on a daily chart. The second target, 1.0990, is an embedded price channel line, overcoming of which, in turn, opens the way to a medium-term decline in the euro. Investors are laying a 90% chance that the ECB will lower the deposit rate from the current -0.50% to -0.60% at its meeting on March 12th. |
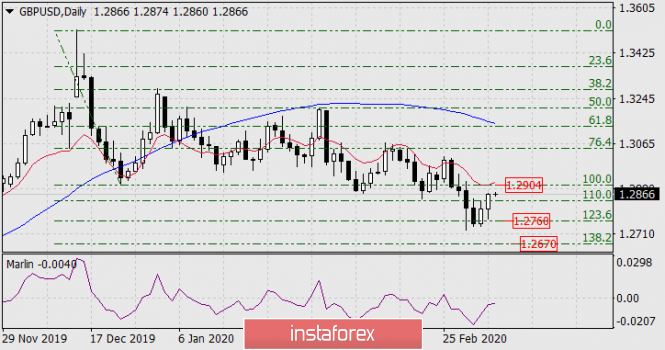
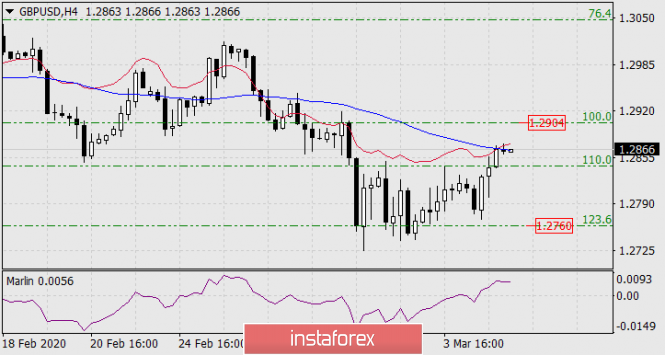
| Forecast for GBP/USD on March 5, 2020 Posted: 04 Mar 2020 08:17 PM PST GBP/USD The British pound completed the technical level of the February 10 low on Wednesday. It is possible that the price will unfold from the resistance achieved, but growth to the development of the Fibonacci level of 100.0% at the price of 1.2904 (December 20 low) is also possible. In this case, the signal line of the Marlin oscillator will test the boundary with the territory of the bulls and move down from it. The price reached the resistance of the MACD line on a four-hour chart. Marlin shows a weak and uncertain reversal, so the option with continued growth has high chances. The price can be helped by today's data on US factory orders for January, the forecast for which is -0.2%. US employment data will be released tomorrow, the non-farm forecast is 175 thousand, as well as the growth of the trade balance from -48.9 billion to -46.3 billion. We are waiting for the main movement on Friday. |
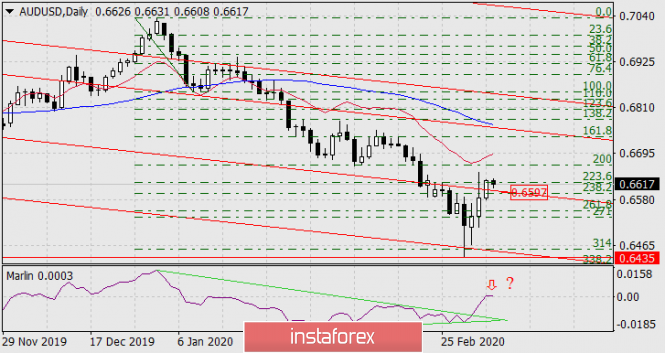
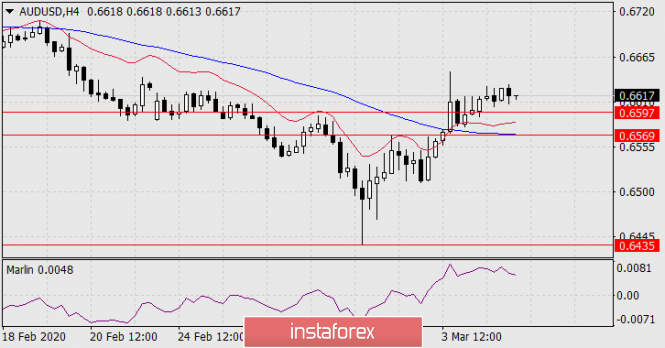
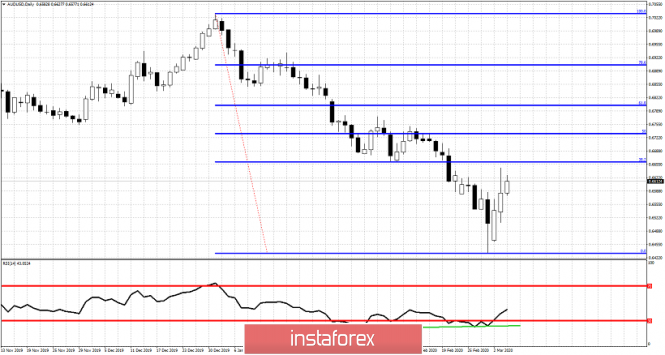
| Forecast for AUD/USD on March 5, 2020 Posted: 04 Mar 2020 08:15 PM PST AUD/USD The RBA lowered its base rate from 0.75% to 0.50% on Tuesday, but since the world was buzzing about the US dollar, the aussie joined it and showed growth for two days, having worked on the daily chart on the Fibonacci resistance level of 223.6 % The Marlin oscillator has left his own wedge up, but currently shows its intention to turn from the boundary with the growth territory. When the price leaves the area under the embedded line of the price channel (below 0.6597) and consolidates below it, this will resume the downward trend with the target of 0.6435 - this is a low of February 28 and support for the underlying price channel line. On the four-hour chart, below the level of 0.6597, there is support for the MACD line at the level of 0.6569 (coincides with the peak on March 2). Leaving prices below this level will be the market's final choice towards selling. |
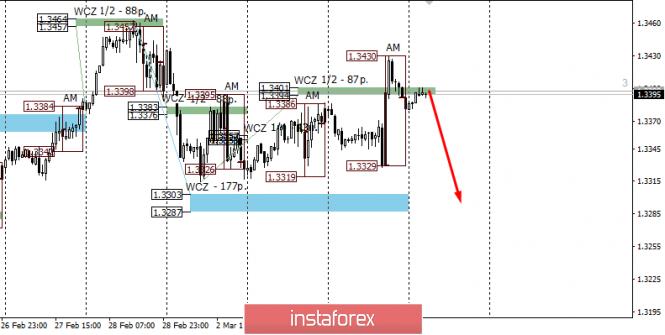
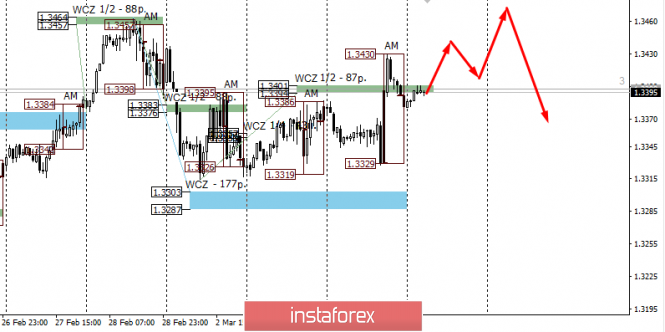
| Control zones of USD/CAD on 03/05/20 Posted: 04 Mar 2020 07:45 PM PST Yesterday, the pair tested the upper border of the average weekly move, which made it possible to fix the next part of purchases. At the same time, there was no structural violation, and thus, it is necessary to consider the pattern for selling the instrument today when testing the important resistance of the Weekly Control Zone 1/2 1.3401-1.3394. If the closing of trading occurs below this zone again, then the main target of the decline will be the weekly control zone 1.3303-1.3287. Developing within the medium-term accumulation zone is profitable and today, the pair is trading at its upper border. This makes it possible to talk about the profitability of sales. An alternative model will be developed if the closing of today's trading occurs above the level of 1.3401. This will open the way for further growth and retest of the annual maximum formed on February 28. It is also important to understand that such an increase will increase the probability of a downward corrective movement in the future up to 90%, since the pair will go beyond the limits of the weekly average move. Daily CZ - daily control zone. The zone formed by important data from the futures market that changes several times a year. Weekly CZ - weekly control zone. The zone formed by the important marks of the futures market, which change several times a year. Monthly CZ - monthly control zone. The zone that reflects the average volatility over the past year. The material has been provided by InstaForex Company - www.instaforex.com |
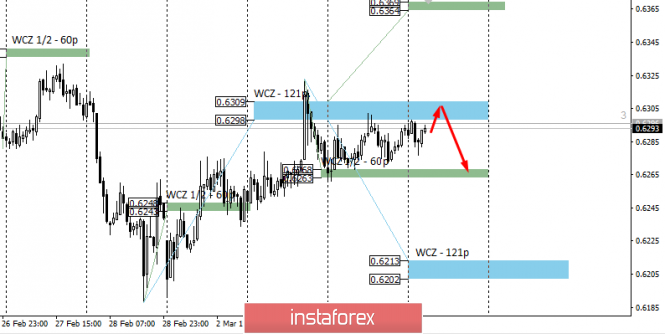
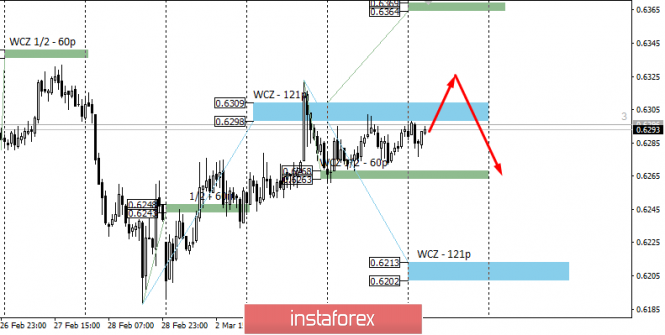
| Control zones of NZDUSD 03/05/20 Posted: 04 Mar 2020 07:35 PM PST The upward movement is still a medium-term impulse, since the pair could not gain a foothold below the WCZ 1/2 0.6268-0.6263. The zone of the average weekly move is a strong resistance, which coincides with the weekly CZ 0.6309-0.6298. The false breakout pattern of yesterday's high will make it possible to enter the market from this resistance. The first target of the fall will be WCZ 1/2, formed from a weekly high. Do not forget that the upward movement is an impulse. This makes it possible for you to consider purchases from WCZ 1/2 0.6268-0.6263 in case the pair falls. An alternative model will be developed if the closure of today's trading occurs above the weekly CZ. This will make it possible for the pair to go beyond the middle course, which will increase the likelihood of a downward movement to 90%. Purchases from current marks are not profitable. This is due to statistics, which indicate the probability of closing trades above the middle course zone in only 30% of cases. Daily CZ - daily control zone. The area formed by important data from the futures market, which changes several times a year. Weekly CZ - weekly control zone. The zone formed by important marks of the futures market, which changes several times a year. Monthly CZ - monthly control zone. The zone, which is a reflection of the average volatility over the past year. The material has been provided by InstaForex Company - www.instaforex.com |
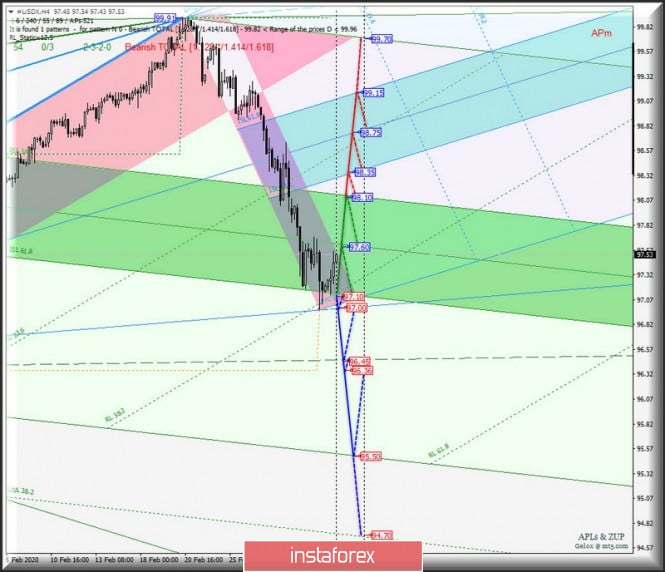
| Posted: 04 Mar 2020 05:29 PM PST Minuette operational scale (H4) Did the dollar stop declining? Here's the development options for the movement of the main currency instruments #USDX vs EUR / USD vs GBP / USD vs USD / JPY for March 5, 2020, in a comprehensive form. ____________________ US dollar index The movement of the #USDX dollar index from March 5, 2020 will be determined by the development and direction of the breakdown of the boundaries of the equilibrium zone (97.10 - 97.60 - 98.10) of the Minuette operational scale forks. We look at the movement markings inside this channel on the animated chart. The breakdown of the upper boundary of the ISL38.2 (resistance level of 98.10) equilibrium zone of the Minuette operational scale forks will determine the continuation of the movement of the dollar index to the equilibrium zone (98.35 - 98.75 - 99.15) of the Minuette operational scale forks. On the contrary, in case that there is a breakdown of the lower boundary of the ISL61.8 (support level of 97.10) equilibrium zone of the Minuette operational scale forks, together with the breakdown of the control line LTL (97.00) of the Minuette operational scale forks then the development of the downward movement of #USDX towards the targets will become relevant : - the final Schiff Line Minuette (96.45); - local minimum 96.36 ; - end line FSL Minuette (95.50). The details of the #USDX movement is presented on the animated chart.
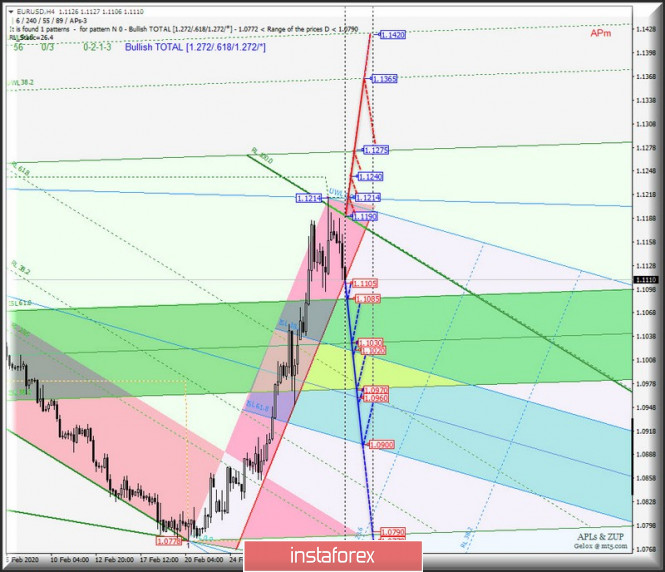
___________________ Euro vs US dollar Further development of the movement of the single European currency EUR / USD from March 5, 2020 will be determined by the direction of the breakdown of the range :
The breakdown of the support level of 1.1105 at the boundary of the red zone of the Minuette operational scale forks is the continuation of the development of the downward movement of the single European currency to the boundaries of the equilibrium zones of the Minuette operational scale forks (1.1085 - 1.1030 - 1.0970) and Minuette (1.1020 - 1.0960 - 1.0900). Alternatively, in case of breakdown of the reaction line RL100.0 (resistance level of 1.1190) of the Minuette operational scale forks will make it possible to continue the upward movement of EUR / USD to the targets: - local maximums (1.1214 - 1.1240); - end line FSL Minuette (1.1275); - warning line UWL38.2 Minuette (1.1365). The details of the EUR / USD movement options are shown on the animated chart.
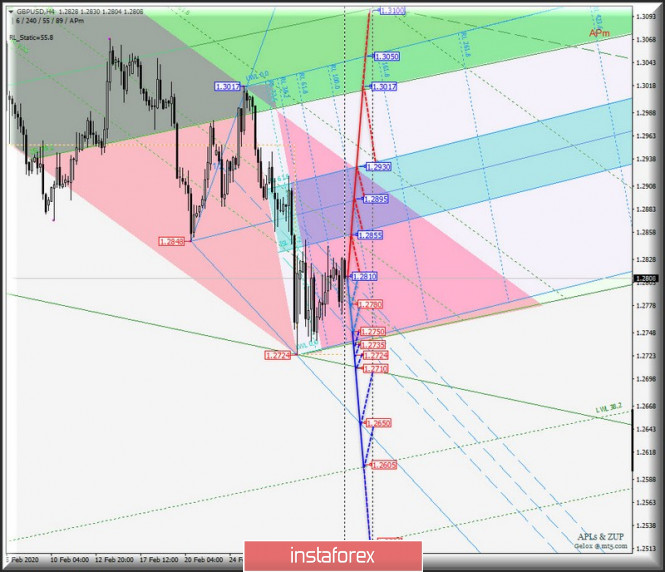
____________________ Great Britain pound vs US dollar From March 05, 2020, Her Majesty's GBP / USD currency will continue to develop its movement depending on the development and direction of the breakdown of 1/2 Median Line channel (1.2810 - 1.2780 - 1.2750) of the Minuette operational scale forks. The details on developing the above levels are present on the animated chart. The breakdown of the upper boundary (resistance level of 1.2810) of the 1/2 Median Line Minuette channel will lead to an option for the development of the upward movement of GBP / USD to the boundaries of the equilibrium zone (1.2855 - 1.2895 - 1.2930) of the Minuette operational scale forks with the prospect of reaching the lower boundary of ISL38.2 (1.3017) of the Minuette operational scale forks. Serial breakdown of support levels : - 1.2750 - lower boundary of the 1/2 Median Line Minuette channel; - 1.2735 - the initial line of SSL Minuette; - 1.2724 - local minimum; - 1.2710- the control line LTL Minuette will determine the continued development of the downward movement of Her Majesty's currency to the control line LTL Minuette (1.2650) and the warning lines of the Minuette operational scale forks - LWL38.2 Minuette (1.2605) and LWL61.8 Minuette (1.2520). The details of the GBP / USD movement can be seen on the animated chart.
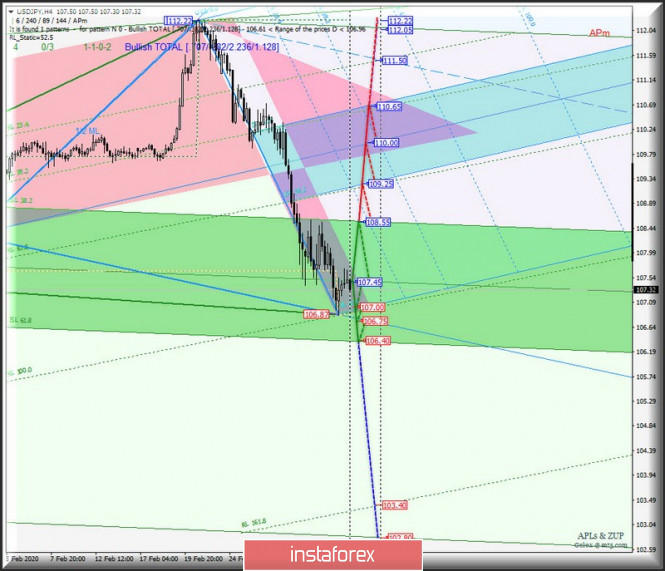
____________________ US dollar vs Japanese yen From March 5, 2020, the development of the USD / JPY currency movement of the rising sun will be due to the development and direction of the breakdown of the boundaries of the equilibrium zone (106.40 - 107.45 - 108.55) of the Minuette operational scale forks. The detailed elaboration of the indicated levels is presented on the animated chart. In case of breakdown of the upper boundary of the ISL38.2 (resistance level of 108.55) equilibrium zone of the Minuette operational scale forks, the development of the upward movement of the currency of the country of the rising sun will be directed to the boundaries of the equilibrium zone (109.25 - 110.00 - 110.65) of the Minuette operational scale forks. Alternatively, the breakdown of the lower boundary of the ISL61.8 (support level of 106.40) equilibrium zone of the Minuette operational scale forks will lead to an option to continue the downward movement of USD / JPY to the reaction line RL161.8 (103.40) and the final line FSL (102.80) of the Minuette operational scale forks. We look at the details of the USD / JPY movement on the animated chart.
____________________ The review was compiled without taking into account the news background. Thus, the opening of trading sessions of major financial centers does not serve as a guide to action (placing orders "sell" or "buy"). The formula for calculating the dollar index : USDX = 50.14348112 * USDEUR0.576 * USDJPY0.136 * USDGBP0.119 * USDCAD0.091 * USDSEK0.042 * USDCHF0.036. where the power coefficients correspond to the weights of the currencies in the basket: Euro - 57.6% ; Yen - 13.6% ; Pound sterling - 11.9% ; Canadian dollar - 9.1%; Swedish krona - 4.2%; Swiss franc - 3.6%. The first coefficient in the formula leads the index to 100 at the starting date - March 1973, when the main currencies began to be freely quoted relative to each other. The material has been provided by InstaForex Company - www.instaforex.com |
| EUR/USD. Take-off aborted: the pair retreated, but going into sales is still risky Posted: 04 Mar 2020 02:51 PM PST After a rapid take-off, the European currency began to gradually lose the points it won. This trend applies not only to the EUR/USD pair: in all cross-pairs, the euro to one degree or another demonstrates weakness. This suggests that the decrease in EUR/USD is not due to the restoration of the greenback - the role of the first violin is played by the single currency. By and large, the corrective pullback has been brewing for a long time: firstly, the price has shown almost growth that has not retreated since February 21, and gaining a half more than 400 points. Secondly, the eurozone does not have immunity from the coronavirus, therefore the problems that other countries of the world have encountered are also common to European states. Italy is now one of the three most epidemiologically disadvantaged countries in the world, along with Iran and South Korea. In Europe, Italians lead in both the number of infected COVID-19 (over 2.5 thousand) and the number of deaths (79 cases). The Italian government decided to close all schools and universities in the country, and many public events were canceled. It is obvious that the European currency can not behave in isolation under such circumstances. Over the previous weeks, the EUR/USD pair has become more expensive due to a certain uncorrelation: representatives of the Federal Reserve prepared the market for a rate cut, while ECB members remained calm and did not rush to any conclusions. Moreover, some officials of the European Central Bank insisted that such situations should be "resolved" not with the help of monetary policy, but with the help of financial policy. At the same time, members of the Fed increasingly talked about the need to ease monetary policy. This verbal uncorrelation provided strong support for the pair. But now, after the Fed has had its say, the market is wondering whether the ECB will become the next regulator to resort to protective measures. Yesterday, interest rates were lowered by the Reserve Bank of Australia and the Federal reserve, today by the Bank of Canada (also by 50 basis points), and next in line are the Bank of Japan and the Reserve Bank of New Zealand. Whether the ECB will stay on the sidelines is an open question. On the one hand, there is a certain split in the ECB's camp: some members of the regulator have often criticized the ultra-soft conditions of monetary policy since the autumn of last year, pointing out its side effects. But it is worth considering that in there was also no unanimity in the Fed's camp during the "peacetime" – some were in favor of lowering the rate, while others were in favor of maintaining a wait-and-see position. Some of them even demanded to raise the rate by the end of this year. In other words, the Fed had a full range of opinions, but the 50-point rate cut was voted for unanimously yesterday. In the light of these events, it has been suggested that ECB members will also "bury the hatchet" if necessary and make a consolidated decision. Today it became known that members of the European regulator held a meeting via conference video link, where they discussed yesterday's decision of the Fed and the general situation in the world and in the eurozone. According to the Reuters news agency, the parties did not come to a single decision based on the results of this "online meeting". At the same time, informed sources stressed that the issue of responding to the consequences of the virus with the help of monetary policy was not on the agenda. Meanwhile, ECB representatives declined to comment on the results of these negotiations. Therefore, traders were left alone with market rumors, which, as we know, do not always correspond to reality. In addition, EUR/USD traders were not very pleased with the findings of the European Commission, whose members assessed the current situation. In their opinion, the consequences of the epidemic will be "more tangible" relative to earlier forecasts. In view of this fact, the European Commission may revise its economic forecasts in the direction of deterioration. For example, in Brussels today it was suggested that Italy and France might face a technical recession this year. Against the background of such prospects, the European currency plunged throughout the market, including paired with the dollar. The EUR/USD pair updated the daily low, dropping to around 1.1096. But in the end, the pair stayed within the 11th figure, confirming the riskiness of short positions. In my opinion, the euro this time will hold back the blow: while the ECB does not openly announce the easing of monetary policy parameters, the pair will demonstrate a bullish mood, primarily due to the vulnerability of the US currency. Moreover, according to some experts, the ECB has a priori fewer opportunities to neutralize the economic consequences of coronavirus than the Fed. Therefore, the market still expects further steps to reduce the interest rate from the Fed (Trump has already urged Powell not to stop there), and any hints in this context will increase pressure on the dollar. From the technical point of view, the EUR/USD bulls need to stay above the 1.1090-1.1110 price range (the lower and upper boundaries of the Kumo cloud on the daily chart). The resistance level (the goal of the upward movement) is still the 1.1240 mark - this is the upper line of the Bollinger Bands indicator on the daily chart. If members of the Fed will continue to maintain a dovish attitude, the pair can test this target as early as this week. The material has been provided by InstaForex Company - www.instaforex.com |
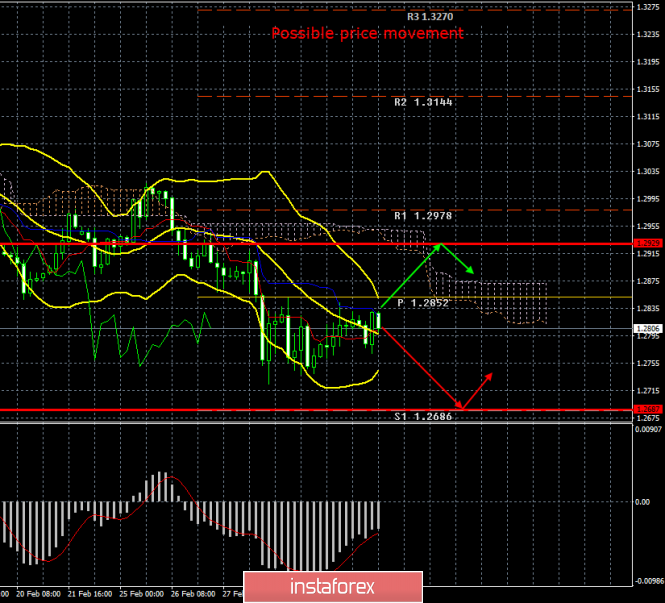
| Posted: 04 Mar 2020 02:51 PM PST 4-hour timeframe Amplitude of the last 5 days (high-low): 108p - 87p - 194p - 111p - 103p. Average volatility over the past 5 days: 121p (high). The British pound has been adjusting quite calmly over the past two days, not reacting in any way to the powerful events taking place in the world. The British currency slightly rose amid the easing of the Fed's monetary policy, did not respond to the comments of Mark Carney, who said that the Bank of England would help British business and the economy cope with the negative impact of coronavirus. The head of the British central bank, who will resign after 10, said that if the situation worsens and the economic shock does not pass, the BoE is ready to take all necessary measures to stabilize the economic situation. It is obvious to all traders that we are talking about lowering the key rate. The Fed and the Reserve Bank of Australia have already lowered their key rates; now the British and European regulators are in line. But we are more interested in the GBP/USD pair rate, as well as the reaction of most traders to what is happening in the world. But there is practically no reaction now. One has only to look at the movement of the EUR/USD pair and compare it with the movement of the pound/dollar. It immediately becomes clear that the British currency is now in hibernation. However, perhaps this is even better than if the same unreasonable and non-predictable movements as the EUR/USD would now flow along the pound/dollar pair. Despite the fact that most traders of the pair keep calm and cool, events concerning the UK and the pound are now abound. We've already talked about Mark Carney's speech. In fact, now you only need to wait for the next meeting of the British regulator to find out about the rate cut. Traders did not react to the Fed rate cut. At the same time, the first stage of negotiations between Britain and the EU concerning the further coexistence of the bloc and the UK after 2020 is taking place. So far, no specific information has been received in the media, but we still believe that it will be very difficult for traders to wait for optimistic data. Although you should not jump to conclusions. You should simply monitor the nature of the information received. And it can start arriving tomorrow, when the first stage of negotiations is completed. By the way, we somehow too quickly concluded that the euro/dollar currency pair is being traded very strangely, but the pound/dollar is much more logical. Today's macroeconomic statistics from overseas were completely ignored by market participants. Let's start, however, with British statistics. The index of business activity in the construction sector was 53.2 in February, only slightly lower than in January (53.3). Thus, such a weak change in the value of the indicator could not cause a serious market reaction. The data from the United States were required to favorably influence the position of the US currency. ADP's report on changes in the number of employees in the private sector exceeded experts' forecasts and amounted to 183,000. Recall that it is very important for the US government that the country maintains low unemployment and a strong labor market. Therefore, any positive data on the labor market almost always causes the dollar to strengthen. But not today. The ISM index of business activity in the service sector could also provide significant support to the greenback, which rose to 57.3 compared to the previous month (55.5). Interestingly, the same Markit index remained unchanged at 49.4. That is, two indexes that show the state of the same sphere indicate completely different things. Nevertheless, the ISM index is considered more important, so we had the right to expect the dollar to grow. But it did not happen after the publication of this indicator. Andrew Bailey, who will succeed Mark Carney from March 16, 2020, is also scheduled to speak today. Perhaps the future head of the Bank of England will tell the markets something interesting. However, we still tend to believe that traders are lying low and waiting. Perhaps they are waiting for data from trade negotiations. Perhaps they are waiting for positive news about the fight against the coronavirus. Perhaps they are waiting for the tension to subside from the stock and currency markets. An upward correction continues from a technical point of view, and the price has already worked out the Kijun-sen line. Thus, a rebound from this line can trigger a resumption of the downward movement. However, despite the fact that, from our point of view, the general fundamental background remains in favor of the dollar, now is such a time that it is extremely difficult to predict the movement of any pair. Ichimoku and Bollinger Bands show a downward trend. Trading recommendations: The GBP/USD pair continues the upward correction. Thus, it will be possible to sell the British pound again with the target of the support level of 1.2686, after the completion of the current correction (MACD indicator turns down or rebounds from the Kijun-sen line). We recommend considering the pair's purchases with targets at the level of 1.2929 and the Senkou Span B line in small lots if the bulls are able to gain a foothold above the Kijun-sen line. The macroeconomic background now has practically no effect on the movement of the pair. Explanation of the illustration: Ichimoku indicator: Tenkan-sen is the red line. Kijun-sen is the blue line. Senkou Span A - light brown dotted line. Senkou Span B - light purple dashed line. Chikou Span - green line. Bollinger Bands Indicator: 3 yellow lines. MACD indicator: Red line and bar graph with white bars in the indicators window. Support / Resistance Classic Levels: Red and gray dashed lines with price symbols. Pivot Level: Yellow solid line. Volatility Support / Resistance Levels: Gray dotted lines without price designations. Possible price movements: Red and green arrows. The material has been provided by InstaForex Company - www.instaforex.com |
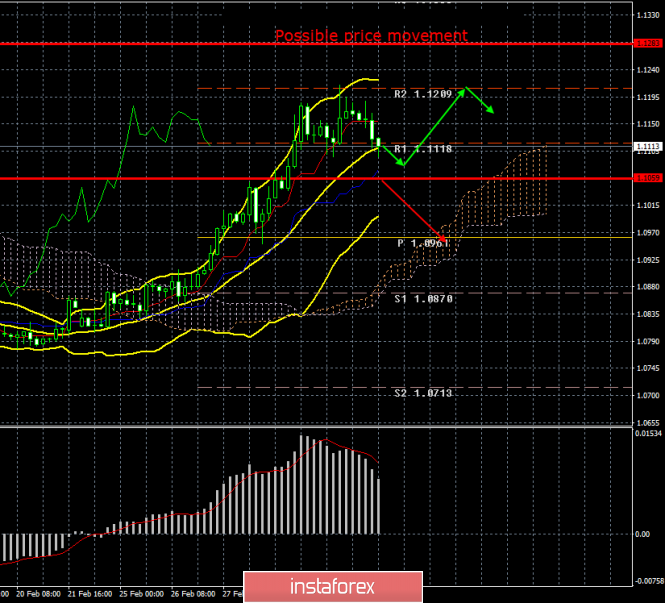
| Posted: 04 Mar 2020 02:51 PM PST 4-hour timeframe Amplitude of the last 5 days (high-low): 54p - 127p - 102p - 157p - 119p. The average volatility over the past 5 days: 112p (high). Over the past five weeks, the European currency, paired with the US dollar, has been moving as if the Forex market will soon cease to function and traders and investors will finally want to complete all their bids. At first, the euro fell without a break for three weeks, now the US dollar has been falling for the second week in a row. The most interesting thing is that these two movements cannot be called either fundamentally sound (at least in full), nor provoked by macroeconomic statistics, or absolutely technical. Perhaps, the logical fall in the euro in those three weeks was really logical, but obviously it should not be so strong without a single correction. What is happening in the last two weeks is generally very difficult to describe in words. The euro grew, breaking all the records of volatility every day. Even in those days when there was no news. The reasons were called the collapse of the US stock market, and the consequences of the coronavirus, as well as the possible lowering of the key Fed rate. And what is the result? The Fed immediately lowered its key rate by 50 basis points, and traders responded ... by closing the pair's purchases. That is, at the very moment when it was most logical to expect the European currency's growth. We also want to note once again that coronavirus affects not only the United States and the US stock market. It concerns all countries of the world, it concerns the European Union, it concerns the ECB, it concerns the European stock markets. However, for some reason, in recent weeks there has been a convenient version of the rationale for what is happening, they say, the fall of the US stock market is to blame. We consider this version incorrect, especially since initially the euro growth was exclusively corrective after a long fall. After that, the news began to come to the disposal of traders, which could not leave them indifferent and a kind of panic began on the markets. And when there is panic in the markets, there is no reason to talk about any logical movement of the pair. Therefore, we end up with what we have. There had to be a correction, but in the end, an upward trend began, which now, it is not clear whether it will continue or not. Most of the macroeconomic statistics of recent weeks have been ignored by market participants. We would like to note in such an unfavorable situation amid the ongoing spread of the coronavirus that, in principle, easing monetary policies will not solve the problem of the disease itself. That is, these are just measures of the central banks to reduce the negative effects of the Chinese virus on the economies of their countries. The virus must be combated through medical means. Or trust Donald Trump, who stated that "there is nothing to fear (at least to the Americans)," and the virus "will not survive the warm season." Literally half an hour after the speech of the US president, medical experts said that the vaccine against the virus would be ready at best in a year, so Trump immediately fell upon a portion of criticism. Thus, if the virus continues to gain momentum, then all lower key rates will not have much effect on the world economy or the economies of individual countries. Moreover, the coronavirus affects all countries, and most likely the ECB and the Bank of England will lower their rates. A lot of different information and macroeconomic data were published during the third trading day of the week. For example, data on retail sales were released in Germany and the European Union. The German indicator added 1.8% y/y, while the European one added 1.7% y/y. Both indicators were higher than forecasted values. Indices of business activity in the services sectors of Germany and the EU were worse than forecast values, as well as the values of the previous month - 50.7 and 52.6, respectively. But the macroeconomic statistics from across the ocean certainly pleased traders. If the Markit services business activity index remained below the key level of 50.0 and amounted to only 49.4, then the ISM services business activity index significantly exceeded the already rather high forecasts and amounted to as much as 57.3 points in February. The ADP report on the level of employment in the US private sector was also quite strong. The data showed an increase of 183,000 new workers with forecasts of +170,000. Thus, we can conclude that the statistics from the United States was strong today. It is on the basis of these data that the US dollar began to strengthen today. At least I want to believe in it. However, the downward movement of the pair is also brewing from a technical point of view, since a correction is simply necessary after such a strong upward movement. Based on the foregoing, the key question remains: have the markets calmed down after the panic? If so, then we are almost 100% but expect a downward movement, perhaps even quite strong. We believe that the euro is now overbought. If the panic has not yet passed and traders will continue to react to the fall of US stock indices or oil in the same way as they did in the last week, then it is generally difficult to imagine what could happen to the euro/dollar rate. A correction began from a technical point of view. We believe that the upward movement is completed, however, above the Kijun-sen critical line, the upward trend continues. Accordingly, a rebound from Kijun-sen may trigger a new round of upward movement. Trading recommendations: The EUR/USD pair retains the same chances for the beginning of the correction and for the continuation of the upward movement. Thus, new long positions can be considered in case of a rebound from Kijun-sen with the target of the resistance level of 1.1209. However, from our point of view, this is rather dangerous, and this level has already been worked out. It will be possible to sell the pair with the first goal of the Senkou Span B line, when traders will be able to gain a foothold back below the critical line. Explanation of the illustration: Ichimoku indicator: Tenkan-sen is the red line. Kijun-sen is the blue line. Senkou Span A - light brown dotted line. Senkou Span B - light purple dashed line. Chikou Span - green line. Bollinger Bands Indicator: 3 yellow lines. MACD indicator: Red line and bar graph with white bars in the indicators window. Support / Resistance Classic Levels: Red and gray dashed lines with price symbols. Pivot Level: Yellow solid line. Volatility Support / Resistance Levels: Gray dotted lines without price designations. Possible price movements: Red and green arrows. The material has been provided by InstaForex Company - www.instaforex.com |
| EUR/USD: Fed upsets the dollar, will the ECB support the euro? Posted: 04 Mar 2020 02:51 PM PST The most serious Federal Reserve interest rate cut since 2009 has shown the decisiveness of the US central bank. However, the market reaction turned out to be completely different from what the regulator expected. The main US stock indices plunged 3%, and the yield on ten-year Treasuries for the first time in history dropped below 1%. The spread of the rates of the US and German debt markets declined to the lowest level since 2017, which put pressure on the dollar and made it possible for the EUR/USD pair to rise above 1.12 for a while. What is the matter? Why did the emergency interest rate cut by the Fed not have a proper impact on the market? Apparently, investors doubt that Jerome Powell and his colleagues are able to cope with the coronavirus. Obviously, the virus cannot be cured by monetary measures. "Lower rates will not stop the spread of the disease. They can help risky assets in the short term, but they look like an extremely imperfect solution to what is actually a health problem," PIMCO experts noted. According to experts, a sharp decrease in the Fed rate is a cause for serious concern about the fate of the US economy. In addition, the regulator did not give a signal of readiness to do much more, which disappointed the financial markets. Previous pandemics have had little impact on US economic growth. For example, the epidemics of 1957–1958 and 1968–1969 were less destructive. However, this time everything looks pretty serious. S&P Global Ratings economists have revised downward the forecast for US GDP growth in the first quarter - from 2.2% to 1%. They expect that the figure will expand by only 1% in April-June. According to Goldman Sachs analysts, things could turn out even worse. They lowered the forecast for US GDP growth to 0.9% per annum in the first quarter and to 0% in the second. It is possible that the Fed has enabled markets themselves to answer the question of what will happen next. The continuation of the correction of the S&P 500 may finally convince investors that the hands of the Fed are short, and will force them to prepare for a recession. The gradual stabilization of US stock indices will signal a return of investor confidence in the ability of the central bank. In neither case will the greenback get any better. Continued pullback of the stock market is fraught with an outflow of capital from the United States, and the growth of quotes will reflect hopes for a further weakening of the Fed's monetary rate. According to some analysts, the difference in interest rates of the Fed and the ECB could become the key driver of EUR/USD this year. The market is still waiting for a decrease in the key rate in the US by another 50 basis points at the Fed meeting in March and another decrease of 25 points by the end of the year. At the same time, certain doubts remain as to whether the ECB will continue to reduce the cost of borrowing. The question of what will be the ECB's policy in 2020 remains open to many investors. "I'm not a dove or a hawk, I strive to be an owl," said ECB Chief Christine Lagarde at her first press conference in December 2019. It is possible that in 2020 she may appear in all three forms. Wise Owl Refraining from making changes to the current monetary policy, C. Lagarde got a chance to reconcile the hawks and the doves. She also refused additional incentives, retaining such an opportunity for the future, because the arsenal of monetary policy instruments of the ECB is already limited. As a wise owl Lagarde is worth holding this trump card up her sleeve, and not playing it right away. The threat of additional incentives could raise pressure on the euro. Thus, during this period, the growth of EUR/USD may be limited. Hawk, but only with the help of Germany Last year, economic growth in the eurozone was sluggish and, most likely, in 2020 the situation will not change. However, the rise in economic activity in the region may disperse the euro and receive positive comments from Lagarde. What will contribute to this? Probably the solution to external problems, such as a slowdown in the global economy and Brexit. However, the most significant driver may be a program of financial stimulation of the German economy. Until now, Angela Merkel has been stubbornly adhering to austerity policies, despite a significant slowdown in economic growth in the country. However, the situation may change in the future, as calls are increasingly being made to abandon the economy, not only from the ECB, but also from the Social Democratic Party of Germany. The new leadership of one of the partners of the Christian Democratic Union in the coalition has already expressed a desire to increase spending. Moreover, both the SPD and the Merkel party are afraid of strengthening the position of the "green". There is a possibility that the German government may start a "Green New Deal", which is designed to help the environment and stimulate the national economy, which will support the euro. Such a decision would help Lagarde breathe a sigh of relief and postpone until better times the adoption of new measures to weaken monetary policy. Thus, it could be hawkish, but it will depend on the position of Germany. Strategic Dove The only statement, although not too much affecting the markets made by Lagarde, was the promise to conduct a strategic review of the ECB policy, which began in January and should be completed before the end of this year. According to its results, the regulator can change the inflation target, which at the moment is slightly below 2%. One likely scenario is setting a target near 2%. A more flexible target level will allow prices to rise above 2%, which will not entail a tightening of the ECB policy. As a result, the euro may decline even at the moment when the target level change is announced. An even bigger dove A bolder measure by the ECB would be to allow the average inflation rate to stay above 2% for several years. This can offset the impact of the previous period of low inflation. Germany and other northern countries are likely to criticize such a decision, but it cannot be completely ruled out. Such a change in the ECB's mood in favor of the "dove may cause a drop in EUR/USD. Thus, ECB Chairman Lagarde may start the year as a wise owl by taking a wait-and-see attitude, which will put pressure on EUR/USD. Then it can take a hawkish position and propose a tightening of monetary policy, however, this will depend on Germany's incentive program. And finally, the head of the ECB may return to a soft policy, which will pull down the single European currency. The material has been provided by InstaForex Company - www.instaforex.com |
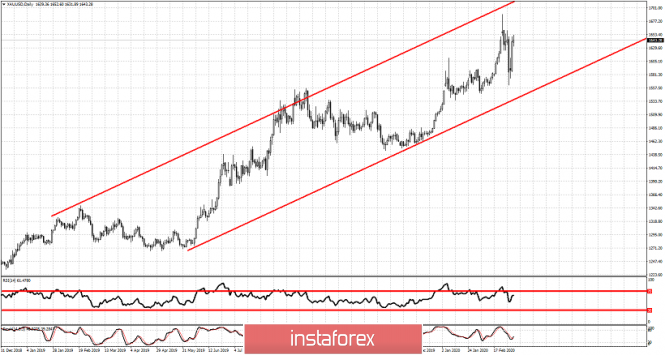
| Gold price has formed important medium-term bottom Posted: 04 Mar 2020 12:49 PM PST Gold price broke above the $1,610-15 resistance area and is now very close to its 2020 highs. Short-term trend is bullish. Price remains inside the longer-term channel and as long as price is above $1,586 I do not expect to see any major pull back.
Gold price is at $1,638 after a strong day yesterday where price started to rise from $1,588. Another pull back towards $1,600 is not out of the question and I believe it is justified. However I would prefer to be neutral rather than bearish at current levels as price seems to have formed a medium-term bottom at $1,562-86 area.
|
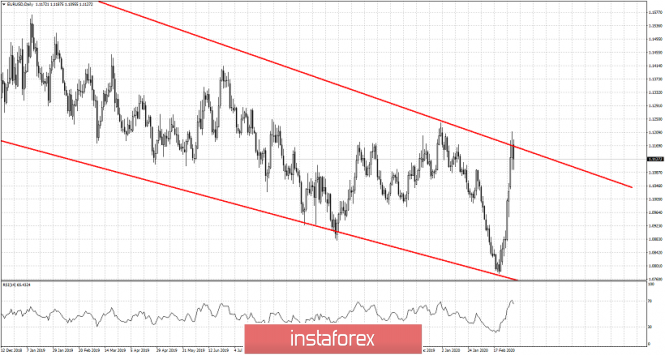
| Short-term technical analysis on EURUSD Posted: 04 Mar 2020 12:43 PM PST EURUSD has reached the upper channel boundary and has stopped its sharp rise. Price is now trading around the 1.1130 resistance area and as we explained in our previous analysis, this is important resistance.
EURUSD is showing rejection signs. Price has reached our second target since this analysis was posted back on February 25th and when price was trading around 1.0850. With the RSI in the Daily chart at overbought levels, bulls need to be cautious and raise their protective stops. Holding above 1.11 will be a sign of strength and could lead to a new higher high towards 1.12. The material has been provided by InstaForex Company - www.instaforex.com |
| AUDUSD moves higher as per our analysis Posted: 04 Mar 2020 10:17 AM PST AUDUSD has moved towards important short-term Fibonacci target level as expected. The bullish divergence warnings we talked about in previous analysis are now being confirmed as price is bouncing.
AUDUSD has moved from 0.6555 to 0.6646 very close to our first target where the 38% Fibonacci retracement is found. The bullish divergence warning we noted is being confirmed and price starts to rise. First resistance is at the 38% level. I expect price to move again and capture that level and most probably to move higher still. The material has been provided by InstaForex Company - www.instaforex.com |
| March 4, 2020 : GBP/USD Intraday technical analysis and trade recommendations. Posted: 04 Mar 2020 07:05 AM PST
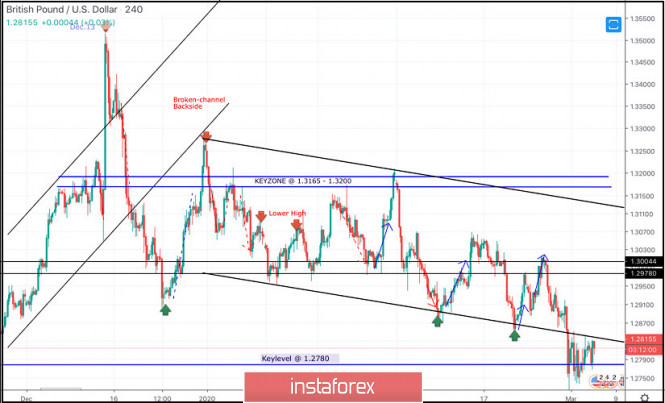
In the period between December 18th - 23rd, bearish breakout below the depicted previous bullish channel followed by quick bearish decline below 1.3000 were demonstrated on the H4 chart. However, immediate bullish recovery (around 1.2900) brought the pair back above 1.3000. Bullish breakout above 1.3000 allowed the mentioned Intraday bullish pullback to pursue towards 1.3250 (the backside of the broken channel) where the current wide-ranged movement channel was established between (1.3200-1.2980). Since January 13, progressive bearish pressure has been built over the price zone of 1.2980-1.3000 until February 5. On February 6, recent bearish breakdown below 1.2980 enhanced further bearish decline towards 1.2890 (the lower limit of the movement channel) where two episodes of bullish rejection were manifested on February 10th and 20th. This was followed by the recent bullish pullback towards the price zone of 1.2980-1.3000 which has offered considerable bearish rejection. On the other hand, the lower limit of the channel around 1.2850 has failed to provide enough bullish Support for the pair. That's why, a quick bearish decline was expressed towards the nearest DEMAND level around 1.2780 where significant bullish rejection and an atypical double-bottom pattern is being demonstrated. Bullish recovery is expected to pursue towards 1.2980 provided that early bullish breakout is achieved above 1.2850 once again. On the other hand, bearish persistence below 1.2780 enhances the bearish side of the market probably towards lower bearish targets around 1.2650 (Daily Demand Level). The material has been provided by InstaForex Company - www.instaforex.com |
| March 4, 2020 : EUR/USD Intraday technical analysis and trade recommendations. Posted: 04 Mar 2020 06:58 AM PST
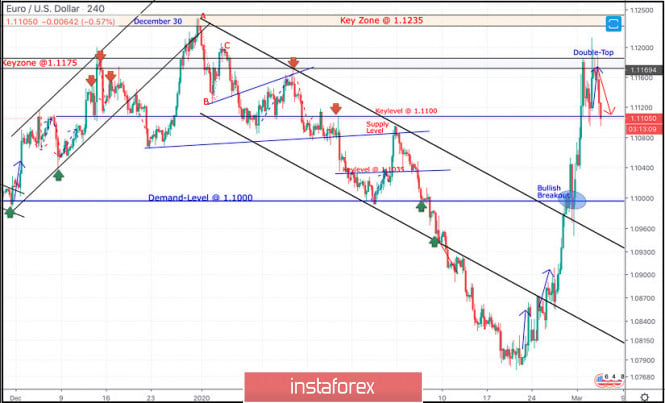
On December 30, a bearish ABC reversal pattern was initiated around 1.1235 (Previous Key-zone) just before another bearish movement could take place towards 1.1100 (In the meanwhile, the EURUSD pair was losing much of its bearish momentum). One more bullish pullback was executed towards 1.1175 where the depicted key-zone as well as the recently-broken uptrend were located. Since then, the pair has been down-trending within the depicted bearish channel until two weeks ago, when extensive bearish decline established a new low around 1.0790. This was where the EUR/USD pair looked oversold after such a long bearish decline. Hence, Intraday traders were advised to look for signs of bullish recovery around the price levels of (1.0790). By the end of Last week, recent signs of bullish recovery were manifested around 1.0790 leading to the current bullish movement towards 1.0910, 1.0950 and 1.1000. The price level of (1.1000) constituted a temporary SUPPLY level in confluence with the upper limit of the current movement channel. That's why, transient bearish pullback was executed towards 1.0950 (Backside of the broken channel) where another bullish swing was initiated. On Monday, a quick bullish spike was expressed above 1.1100 (Previous Key-Level). Further bullish advancement was anticipated towards 1.1175 where the current double-top pattern was completed Today. Currently, the EURUSD pair is retesting the KeyLevel around 1.1100 which may fail to offer enough bullish Support for the pair. That's why, bearish breakout below 1.1100 will probably bring further bearish decline towards 1.1040 and possibly 1.1000. Otherwise, the pair remains trapped between 1.1100 and 1.1175. The material has been provided by InstaForex Company - www.instaforex.com |
| Review for March 3, 2020. EUR/USD. US labor market remains strong in February Posted: 04 Mar 2020 06:36 AM PST
ADP said private sector employment climbed by 183,000 jobs in February which was in line with economist estimates. Thus, the impact of the coronavirus on the US economy was marginal. The market is waiting for the news on the virus in the coming days. EUR/USD: the resistance level for the euro is 1.1246. The euro can break through this leve or fall. Buy deals are at 1.1100 or after a pull back. The material has been provided by InstaForex Company - www.instaforex.com |
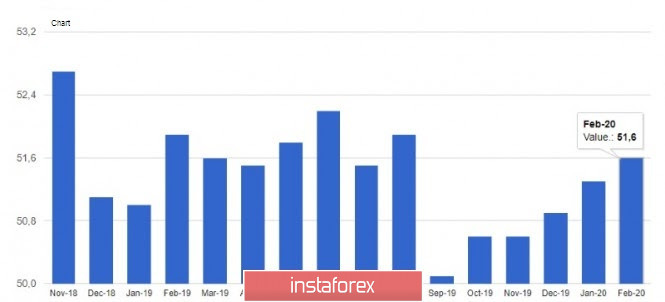
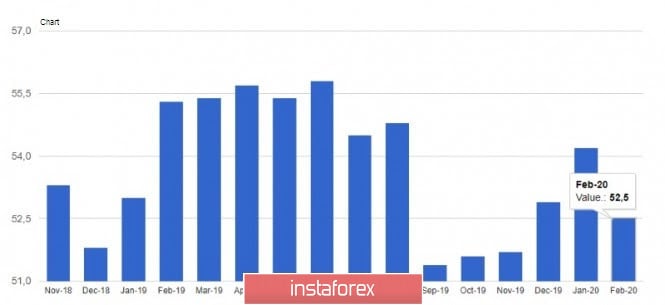
| Posted: 04 Mar 2020 05:34 AM PST Data on the services sector of the eurozone countries did not make adjustments to the market and buyers of risky assets did not manage to regain the resistance of 1.1190, after which the US dollar began to strengthen against the euro and the pound. Growth in activity in the service sector was observed in France and Italy, while the indicator in Germany declined. According to a report by Markit, the purchasing managers' index (PMI) for the Italian services sector rose to 52.1 points in February this year, compared to a January reading of 51.4 points. Economists had forecast it at 51.2. In France, the same index in February reached 52.5 points against 51.0 points in January, with the forecast at 52.6 points. The German economy, which is currently experiencing difficult times, recorded a decline in activity in the service sector, although the index remained above 50 points, indicating growth. According to the report, the purchasing managers' index (PMI) for the German services sector in February fell to 52.5 points against 54.2 points in January and the forecast of 53.3 points. Let me remind you that these values do not yet take into account the spread of coronavirus in the European territory, so it is not quite correct to expect an increase in indicators in March this year. Rather, the slowdown will affect not only the production sector, which is stagnating in both domestic and foreign markets but also the demand for services will significantly decrease. As for the euro area as a whole, the purchasing managers' index for the services sector rose to 52.6 points in February from 52.5 points in March. And the composite PMI, which also takes into account the manufacturing index, coincided with economists' forecasts and amounted to 51.6 points in February against 51.3 points in January. The market was also not supported by data on retail sales growth in Germany in January this year after a significant drop in December. According to a report by the Bureau of Statistics Destatis, retail sales in Germany in January increased by 0.9% compared to December, which fully coincided with the forecasts of economists. Let me remind you that in December 2019, the volume of retail sales fell by 2.0% at once, which negatively affected the overall indicator of the economy. Compared to the same period of the previous year, retail sales increased by 1.8%. As for the eurozone as a whole, the indicator has also recovered, which indicates an acceleration in household consumption. However, it is likely that due to the spread of coronavirus in the 2nd quarter, we should expect a reduction in this indicator. The report shows that retail sales in January 2020 increased by 0.6% compared to the previous month after falling by 1.1% in December. From a technical point of view, nothing has changed significantly. The bears are aimed at supporting 1.1140, a breakout of which will lead to the lows of 1.1090 and 1.1040, from where large buyers of risky assets will only begin to act. GBPUSD The British pound remained trading in the channel of 1.2740-1.2850 after the report on the service sector, which continued its growth in February, although not at such a high pace. According to the data, the purchasing managers' index (PMI) for the UK services sector fell to 53.2 points in February this year, compared to 53.9 points in January. Economists had forecast a rise to 55.8 points, which affected buyers of the pound, which is about to take the level of 1.2795. It is for this range, which acts as the middle of the side channel, that the fight will continue. Breaking the upper limit around 1.2850 will strengthen demand for the pound, which will lead the pair to the highs of 1.2890 and 1.2930. A break of the lower border of the channel in the area of 1.2740 will return the trading instrument to the downward trend, opening a direct road to the lows of 1.2700 and 1.2660. The material has been provided by InstaForex Company - www.instaforex.com |
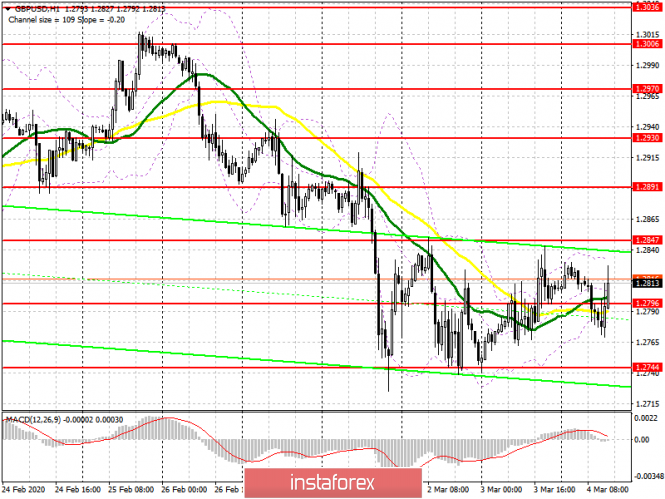
| Posted: 04 Mar 2020 05:31 AM PST To open long positions on GBP/USD, you need: In the first half of the day, I paid attention to the data on the service sector, which turned out to be slightly worse than economists' forecasts. However, they failed to seriously affect the overall technical picture, which kept trade in the side channel. At the same time, the pound pair managed to form a false breakdown in the support area of 1.2796, which is a fairly good bullish signal for further growth of the pound. However, we can only talk about continuing the correction after the breakout and consolidation at the resistance of 1.2847, since the update of this week's highs will lead to the demolition of sellers' stop orders and a larger upward trend with the test of the levels of 1.2891 and 1.2930, where I recommend fixing the profits. If the GBP/USD falls back below the level of 1.2796, you can open long positions for a rebound at the minimum of the month of 1.2744. However, counting on correction of no more than 20-30 points, a break of 1.2796 will increase the probability of resuming the downward trend. To open short positions on GBP/USD, you need: Sellers tried to regain support for 1.2796 against the background of ambiguous data on the service sector. However, they have not yet managed to gain a serious foothold below this level and form a breakthrough of the lower border of the ascending channel. The entire focus will be shifted to data on a similar index in the US, and if the indicator is better than economists' forecasts, we can expect a return and breakdown of the minimum of 1.2744 and a resumption of the bearish trend, which will open for GBP/USD lows in the area of 1.2707 and 1.2664, where I recommend fixing the profits. If the demand for the pound returns, it is best to open short positions from the resistance of 1.2847 but subject to the formation of a false breakdown. Otherwise, you can only sell the pound for a rebound after testing the highs of 1.2891 and 1.2930. Signals of indicators: Moving averages Trading is conducted in the area of 30 and 50 daily averages, which indicates a possible change in the short-term trend to an upward one. Bollinger Bands Volatility has decreased, but a break in the upper limit of the indicator at 1.2840 may provide growth for the British pound.
Description of indicators
|
| Posted: 04 Mar 2020 04:47 AM PST Technical analysis:
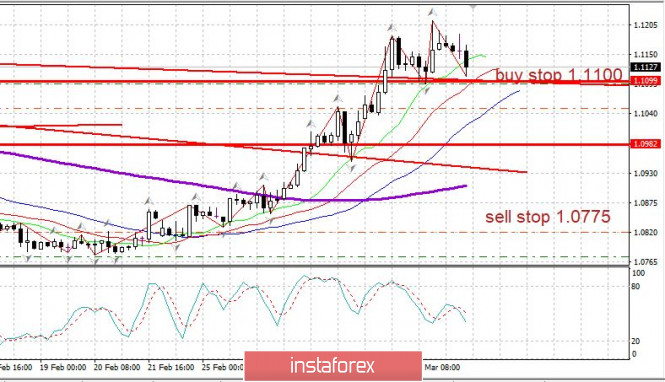
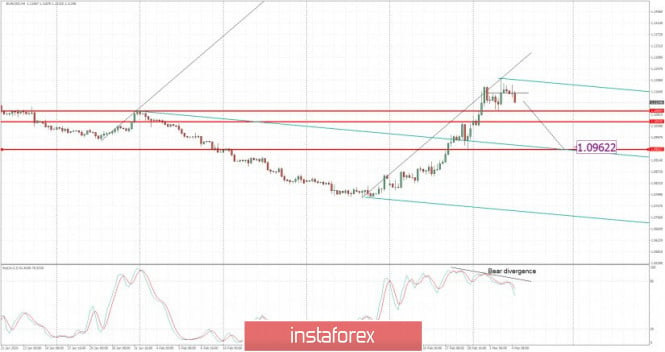
EUR/USD has been trading upwards The price tested and rejected from our yesterday's target at 1.1185. I see potential for the downside movement and I expect bearish movement towards the level at 1.0965 (Pitchfork median line). Watch for selling opportunities using the intraday frames 15/30 minutes... Stochastic oscillator is on the overbought zone and it is showing the bearish divergecence, which is good confirmation for the further drop. Support levels are set at hte price of 1.1093 amd 1.0962 Resistance level is set at the price of 1.1210 The material has been provided by InstaForex Company - www.instaforex.com |
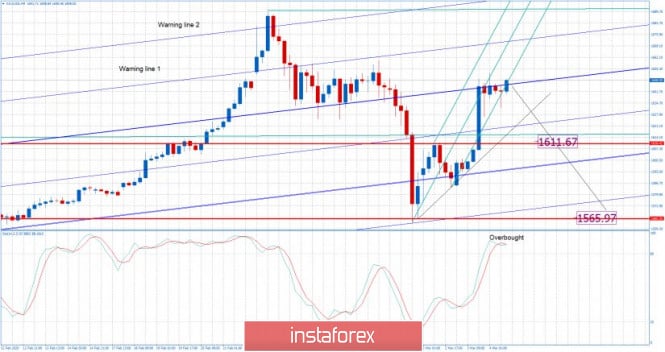
| Posted: 04 Mar 2020 04:38 AM PST Technical analysis:
Gold has been trading upwards The price tested the level of $1.652. Anyway, I found that there is the strong resistance at the level of $1.647 and my advice is to watch for selling opportunities on the rallies using the intraday frames like 15/30 minutes.\ Downnward targets are set at the price of $1.611 and $1.565 Stochastic oscillator is on the overbought zone on the 4H time-frame and there is the fresh bear cross, which is good confirmation for the further downside movement. Support levels and downward targets are set at the price of $1.611and $1.565 Resistance level is set at $1.563 and $1.557 The material has been provided by InstaForex Company - www.instaforex.com |
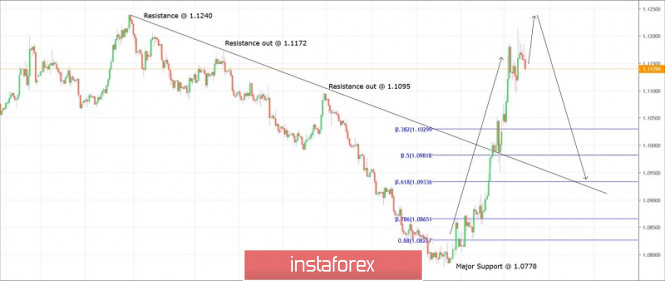
| Trading plan for EUR/USD for March 04, 2020 Posted: 04 Mar 2020 04:31 AM PST
Technical outlook: EUR/USD managed to print 1.1214 before pulling back, and it has remained shy of just a few pips from 1.1250 resistance. It remains possible for another push through 1.1250 before giving in to bears and produce a meaningful correction. The euro could then drop until the fibonacci 0.618 retracement around 1.0930/40. This is also converging with backside of resistance trend line, which should now act as support. If we compress the chart view and go back in time, a potential inverted head and shoulder could also be in the making. The expected drop after 1.1250 highs would be the right shoulder and a great point for a potential buy. The overall structure looks constructive for bulls until prices stay above the 1.0778 low print on February 20,2020. It would be considered safe to enter buying at lower levels rather than trade a counter trend. The upside target potential remains until 1.1500, 1.1800 and even further. Trading plan: Remain flat for now and look to buy ! 1.0930/40 stop @ 1.0778, target is open. Good luck! The material has been provided by InstaForex Company - www.instaforex.com |
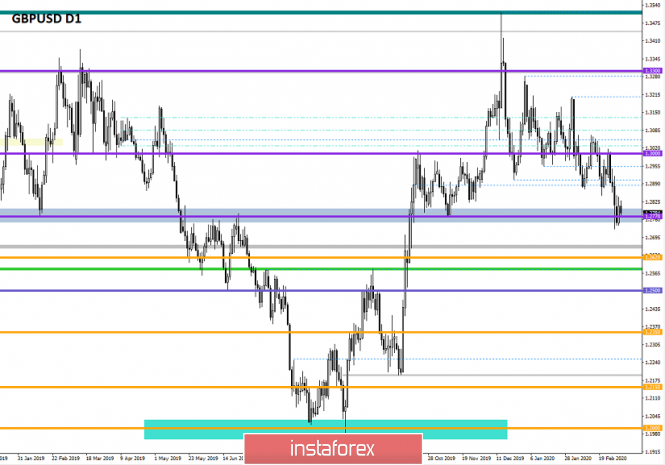
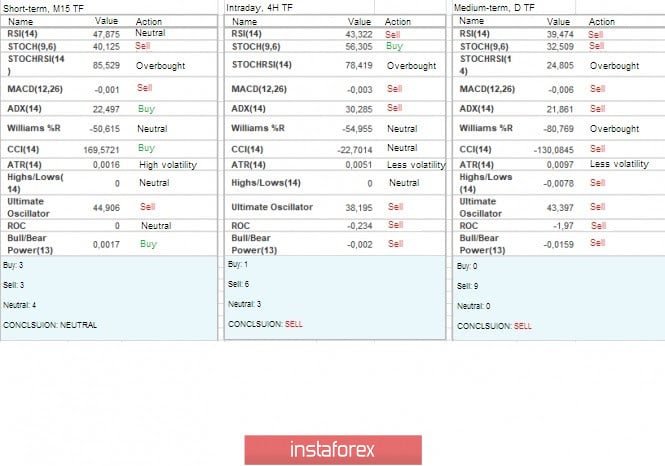
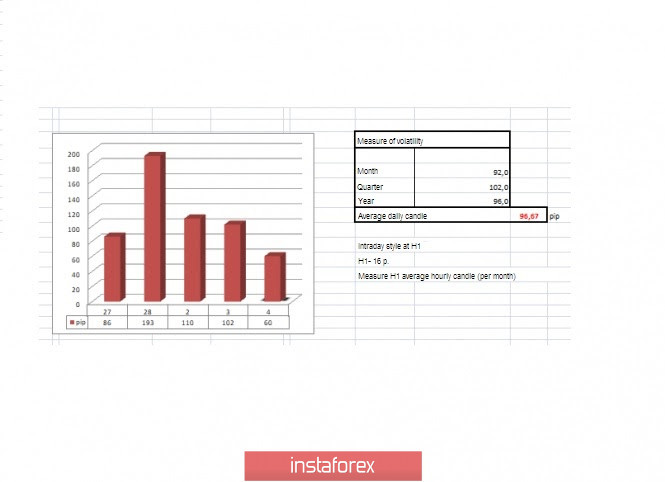
| Trading recommendations for GBPUSD pair on March 4 Posted: 04 Mar 2020 04:28 AM PST From a comprehensive analysis, we see an unchanged picture. The quote makes fluctuations along with the level of 1.2770, increasing the interest of market participants. Now, about the details. For the third day, the quote has been tirelessly wavering within the control level of 1.2770, where there seems to be a background. Emotions are off the scale, however, there are no drastic changes in the pound. This is a very interesting phenomenon, and if we compare the behavior of the pound with its close counterpart in the EURUSD market, we will see that the dynamics are radically different. Let's start with the fact that the correlation between pairs has long been positive, however, now it is negative the dynamics in the synchronous analysis are significantly lower. It turns out that the background that pushes the euro bypasses the pound and the downward pressure of the English currency keeps the quote from correcting, having a flat with variable borders as a result. Regarding the theory of top-down development, we have confirmation of the sellers, as well as their intentions for further development. The only stumbling block remains the level of 1.2770 with its amplitude limits, which deters sellers from further decline. If we compare the euro/dollar pair, where there was a similar theory of downward development, the external background did not disrupt the overall cycle in any way. In terms of volatility, we see that the movement in the conditional flat did not affect the dynamics, which still shows acceleration, exceeding the daily average by 6%. Volatility details: Tuesday-103 points; Wednesday-115 points; Thursday-86 points; Friday-193 points; Monday-110 points; Tuesday-102 points. The average daily indicator relative to the volatility dynamics is 96 points (see the volatility table at the end of the article). Detailing the past day by the minute, we see that the movement was mostly upward but within the framework of the flat oscillation. The most notable impulses occurred from 17:00, where there was a strong news background. As discussed in the previous review, intraday traders do not rush into short positions due to the risk of a reverse move and fluctuations within the range of 1.2770//1.2885//1.3000. Therefore, the tactic was chosen as a wait-and-see approach with an analysis of the fixing points relative to the February 28 minimum (1.2725). Looking at the trading chart in general terms (the daily period), we see that the downward move we are in has been held on the market for more than ten weeks, and this is the longest anti-movement in the structure of the medium-term upward trend. It turns out that the theory of downward development has a chance to soon move to the phase of full recovery. The news background of the previous day included data on the index of business activity in the construction sector in Britain, which recorded an increase from 48.4 to 52.6 with a forecast of 48.8. The market reaction to such positive data was in favor of the pound but the rate growth was local. The main event was an emergency meeting of the Federal Reserve System (FRS), during which the interest rate was cut by 0.5% unscheduled, which put the strongest pressure on financial markets. The main arguments for lowering the rate for the Federal Reserve were the possible risks of the impact of the coronavirus on the country's economy. Such important news almost immediately played on the market in terms of local weakening of the US dollar. A kind of agreement between the US government and the Fed is strongly overlooked. For example, if we look at EURUSD, we will see that the pair grew in price in advance. However, at the time of publication, there was a surge of not so large scales, as if this step was already taken into account in the quote, and someone made a good profit on it. In fact, the Fed's move will play heavily on the decisions of the Bank of England and the ECB, which will be forced to follow the locomotive in terms of rate cuts. For his part, outgoing Bank of England Governor Mark Carney said that there is a line of communication between central banks around the world. Moreover, politicians are working on a strong and timely response to the economic blow from the coronavirus, which has raised fears of a new global recession. Today, in terms of the economic calendar, we have the ADP report for employment in the United States, which expects a decrease in the number of people employed in the non-agricultural sector from 291 thousand to 170 thousand. At the same time, the noise reduction rate and possible retaliatory actions by central banks scare many investors. Further development Analyzing the current trading chart, we see a quote returning to the level of 1.2770, which means that there have been no major changes in the market. All movement is within the conditional limits of the oscillation. With all the information provided above in the arsenal, confidence in the further depreciation of the pound and the development of the recovery theory is growing every day. If this is not enough, then an insider report came out less than an hour ago that the Bank of England, like the Fed, may hold an emergency meeting during which the interest rate will be lowered. Just do not panic unnecessarily and do not make deliberate manipulations, since we are interested in the main course and not local jumps. From the point of view of emotional mood, we see how a dense information background focuses on increased interest, which leads to high activity and speculative outbursts. Detailing the minute-by-minute time interval, we see that when the price approaches the level of 1.2770, local jumps in the opposite direction occurred but within the established flat. In turn, intraday traders are waiting for an exit from the existing fluctuation, where the main goal is to develop downward positions. Medium-term traders are already in short positions but they are also waiting for a new stage, as it will bring new profits, as well as a top-up in the position. Having a general picture of actions, we see that the quote is moving along the level of 1.2770, where the conditional boundaries are the values of 1.2740/1.2850. The main plans are at the time of fixing the price below the February 28 minimum of 1.2725, but in this case, we are waiting for a conditional push from the information background, which will be expressed as inertia. Based on the above information, we will output trading recommendations: - Local buy positions are already higher than 1.2850 if the price is fixed. - Sell positions are considered if the price is fixed below 1.2725. Please note that you need the appropriate background, as well as inertia, to stay in this direction, otherwise there may be stagnation, as it was before. Indicator analysis Analyzing different sectors of timeframes (TF), we see that the indicators of technical instruments have almost a unanimous signal to sell due to a strong downward background. At the same time, due to the flat indicator, the indicators for the minute and hour periods are variable. Volatility for the week / Volatility Measurement: Month; Quarter; Year. The volatility measurement reflects the average daily fluctuation, based on the calculation for the Month / Quarter / Year. (March 4 was based on the time of publication of the article) The volatility of the current time is 60 points, which is the average for this section of time. It is likely to assume that the background, emotions, and noise can lead to acceleration, which in principle has been maintained for the past few days. Key levels Resistance zones: 1.2885*; 1.3000; 1.3170**; 1.3300**; 1.3600; 1.3850; 1.4000***; 1.4350**. Support zones: 1.2770**; 1.2700*; 1.2620; 1.2580*; 1.2500**; 1.2350**; 1.2205(+/-10p.)*; 1.2150**; 1.2000***; 1.1700; 1.1475**. * Periodic level ** Range level *** Psychological level **** The article is based on the principle of conducting a transaction, with daily adjustments. The material has been provided by InstaForex Company - www.instaforex.com |
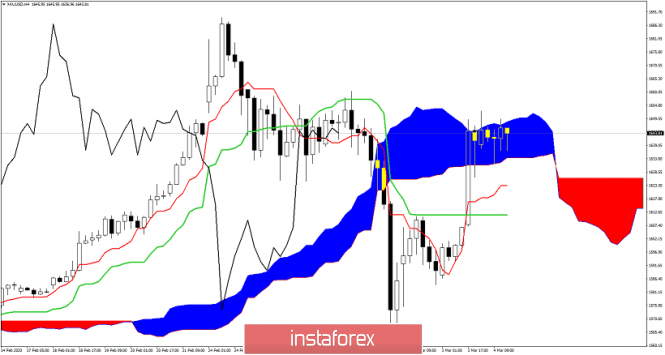
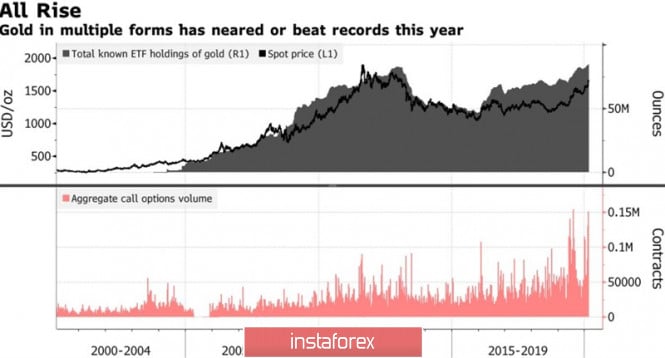
| Posted: 04 Mar 2020 04:28 AM PST In recent years, the market often talks about paradoxes. But the 5% peak of gold at the auction on February 28 does not climb any gates at all. The fastest correction of US stock indices from the levels of record highs, the fall of 10-year bonds in the direction of 1%, the lowest in history, and the collapse of the US dollar created an extremely favorable environment for the precious metal in which it almost always strengthens its positions. This time it was the opposite. Gold lost about $100 per ounce. They didn't really understand what was going on. The market was bursting with rumors. Someone said that in the conditions of finding speculative positions on the asset in the area of record highs, the risks of a sharp pullback should not be surprising. Someone claimed that the holders of gold do not want to get rid of it, however, they are forced to sell it to cover losses in other asset classes. Asset Manager Canaccord Genuity noted that since 1989, there have been only 16 cases when a sharp drop in XAU/USD was accompanied by a rapid peak in the S&P 500. All of them ended with a serious weakening of the Fed's monetary policy and the restoration of the "bullish" trend for the precious metal. A typical example is 2008, when during the height of the global financial crisis, gold suddenly lost almost a quarter of its value before heading for historical highs of more than $1,900 per ounce. As a confirmation that the sale of the XAU/USD at the end of February was speculative, we can cite an increase in stocks of specialized exchange-traded funds by 8.6 tons on the 28th, resulting in a record high of 2634.4 tons. Dynamics of gold prices and ETF stocks
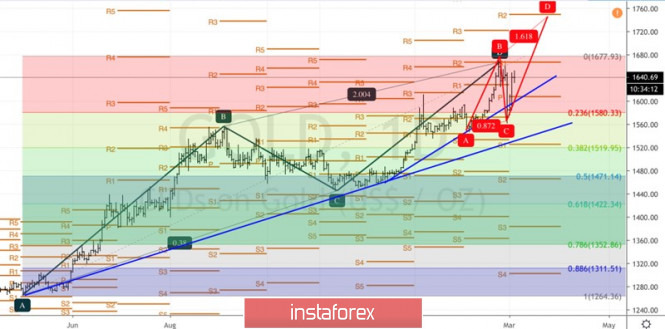
There is a high probability that events will develop according to the 2008 scenario. The inversion of the yield curve and the fall in rates on 10-year Treasury bonds below 1% indicate increased risks of a recession. The Fed was forced to make an unscheduled easing of monetary policy, reducing the federal funds rate by 50 bps at once. Donald Trump believes that this is too little, and the US Central Bank will most likely not stop there, which creates downward pressure on the US dollar and is good news for fans of the precious metal. The Fed is likely to be followed by other regulators. Money markets believe the ECB will cut its deposit rate by 10 bps in March and another 10 bps by the end of 2020. The Bank of England and the Bank of Japan have indicated their willingness to ease monetary policy, and the Reserve Bank of Australia has already done so. The devaluation of the main world currencies associated with monetary expansion plays into the hands of gold. Technically, the inability of the precious metal bears to storm the trend line of the acceleration stage of the "surge and reversal with acceleration" pattern and support at $1,580 per ounce (23.6% of the last rising wave) indicates their weakness and increases the risks of activating the AB=CD model with a target of 161.8%. Gold, the daily chart
|
| Posted: 04 Mar 2020 04:23 AM PST Industry news:
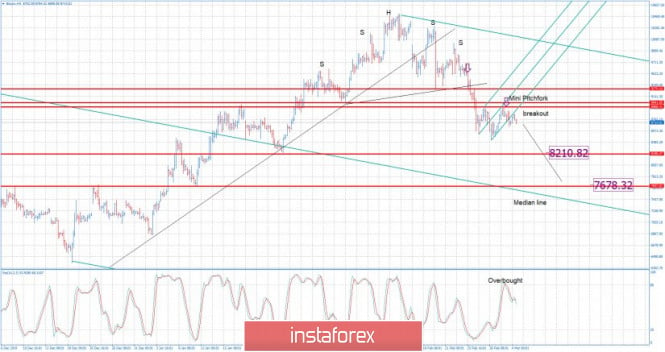
The digital asset ecosystem has been losing sleep over the past 15 days after a bearish turnaround in mid-February contributed to a substantial dip in the prices of major crypto-assets. Coins such as Bitcoin, Ethereum, and Litecoin were significantly affected as their prices slumped below key resistances.\However, taking a moment away from the current bearish trend, institutional investments in both BTC Futures and BTC Options recorded a fruitful period in February.Deribit has grabbed a foothold in the industry over the past year, with the exchange recording consistently high Options volume over the past 6 months. According to Deribit's latest institutional newsletter, the exchange recorded an average of 120K Bitcoin Options per month. However, over the past two months in 2020, the volume shifted gears and recorded an even higher average. Technical analysis: BTC has been trading downwards as I expected. BTC did break the mini Pitchfork upward channel and confimed the downside continuation . Watch for selling opportuntiies with the downward targets at the price of $8.210 and $7.680 The most recent drop did start after the BTC breakdown of the bear flag that we mentioned yesterday. Watch for selling opportunities on the rallies using the intraday frames like 15/30 minutes... Stochastic oscillator got the bear cross in the background, which is good confirmation for our short bias. Support levels and downward targets are set at the price of $8.210 and $7.680 Resistance levels are set at $8.515 and $8.925. The material has been provided by InstaForex Company - www.instaforex.com |
| Market review. Trading ideas. Answers for questions. Posted: 04 Mar 2020 04:13 AM PST EUR/USD – buy positions within the range of 1.10000-1.09500 CAD/CHF - buy limit grid orders within the range of 0.71-0.70 USD/CHF - buy limit grid orders within the range of 0.954-0.950 GOLD - neutral The material has been provided by InstaForex Company - www.instaforex.com |


| You are subscribed to email updates from Forex analysis review. To stop receiving these emails, you may unsubscribe now. | Email delivery powered by Google |
| Google, 1600 Amphitheatre Parkway, Mountain View, CA 94043, United States | |
No comments:
Post a Comment