Forex analysis review |
- Short-term Ichimoku cloud indicator analysis of Gold
- Eurusd stops upward move at major Fibonacci resistance
- USDJPY bounces towards our short-term target of 105.75
- EUR/USD. Caution, correction!
- Comprehensive analysis of movement options for #USDX vs EUR/USD & GBP/USD & USD/JPY (Daily) on August 2020
- July 31, 2020 : GBP/USD Intraday technical analysis and trade recommendations.
- July 31, 2020 : EUR/USD daily technical review and trade recommendations.
- July 31, 2020 : EUR/USD Intraday technical analysis and trade recommendations.
- America, Asia, and Europe stock markets remain in an irresolute movement
- BTC analysis for July 31,.2020 - Watch for the potential breakout of the symmetrical triangle pattern to confirm further
- Trading plan for SPX500 for July 31, 2020
- Trading plan for USDCHF for July 31, 2020
- Euro bets on foundation
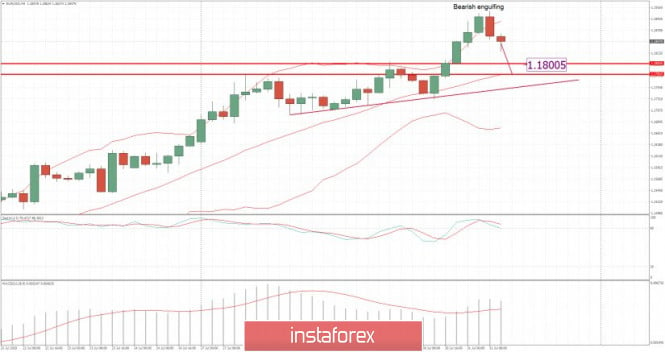
- EUR/USD analysis for July 31 2020 - Bearish engulfing on the 4H time-frame and poential for the downside rotation towards
- US dollar weakens: it just beginning
- Trading plan for Silver for July 31, 2020
- Analysis of Gold for July 31,.2020 - Intraday potential rotation to the downside due to resistance on the test
- Trading recommendations for the EUR/USD pair on July 31, 2020
- Trading plan for Gold for July 31, 2020
- Trading plan for USDJPY for July 31, 2020
- EUR/USD At New Highs As Expected!
- Trader's diary on 07/31/2020. EURUSD
- Oil prices ride roller coaster
- Trading plan for GBPUSD for July 31, 2020
- Analysis of EUR/USD and GBP/USD for July 31. New rise in COVID-19 cases in the US; Donald Trump proposes to postpone elections
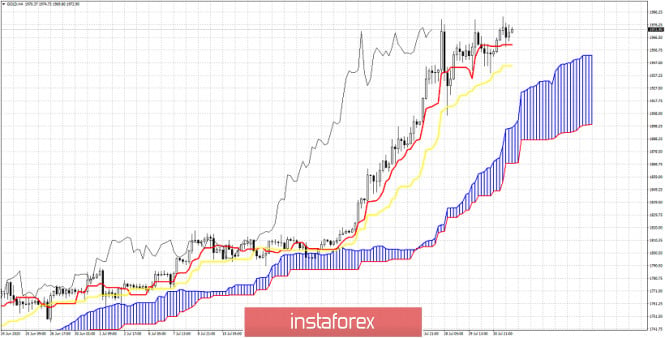
| Short-term Ichimoku cloud indicator analysis of Gold Posted: 31 Jul 2020 01:24 PM PDT Gold price made a slight new higher high today. Trend remains bullish but the chances for a deeper pull back increase. Today we are going to use the Ichimoku cloud indicator in order to identify support levels that if broken could provide signal for a bigger pull back.
The tenkan-sen (red line indicator) is the first key short-term support at $1,960. A 4 hour close below it will push price towards the kijun-sen (yellow line indicator) at $1,944. If we break this level too then we expect price to push towards the Kumo (cloud) support at $1,920. So short-term traders need keep a close eye on these support levels. Breaking one will increase chances of reaching the next. The material has been provided by InstaForex Company - www.instaforex.com |
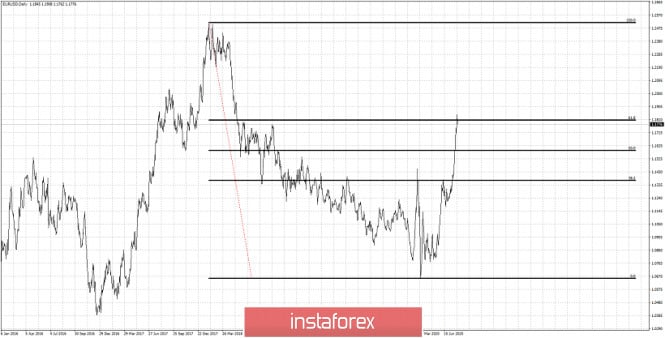
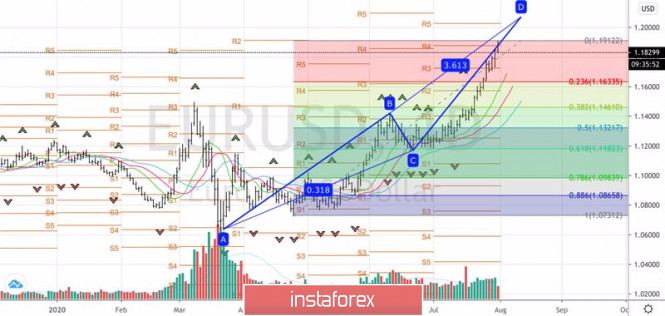
| Eurusd stops upward move at major Fibonacci resistance Posted: 31 Jul 2020 01:20 PM PDT Although EURUSD made new higher highs today at 1.1908, price has significantly pulled back since then and is now below 1.18. As we explained in previous posts this is important resistance area and I do not expect it to be broken immediately.
The 61.8% Fibonacci retracement is important resistance. It is was expected that the parabolic upward move would stop there. I expect next week to see a deeper pull back towards 1.17. This is the most probable scenario. The bullish trend remains intact. The material has been provided by InstaForex Company - www.instaforex.com |
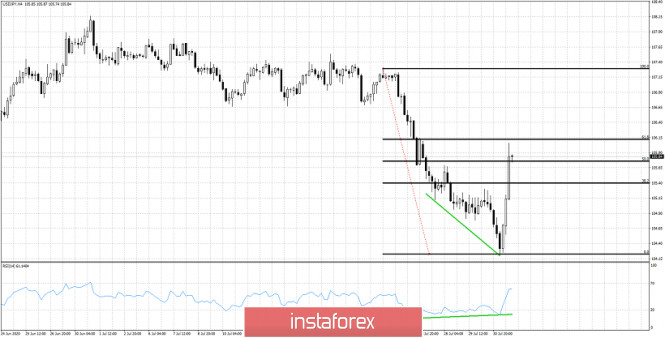
| USDJPY bounces towards our short-term target of 105.75 Posted: 31 Jul 2020 01:16 PM PDT USDJPY made a new lower low on Friday at 104.20 but the pressures were short-lived. As we explained in our last USDJPY analysis, the RSI was showing bullish divergence signs. Our bounce target was at 105.75.
Green lines - bullish divergence USDJPY is bouncing strongly towards the key Fibonacci resistance at 106.10. This is important short-term resistance and a first rejection at this level is expected. USDJPY remains in a bearish trend as long as price is below 107.50. Failure to hold price above 105 will be a bearish sign. Next week will be decisive for the medium-term trend in USDJPY. The material has been provided by InstaForex Company - www.instaforex.com |
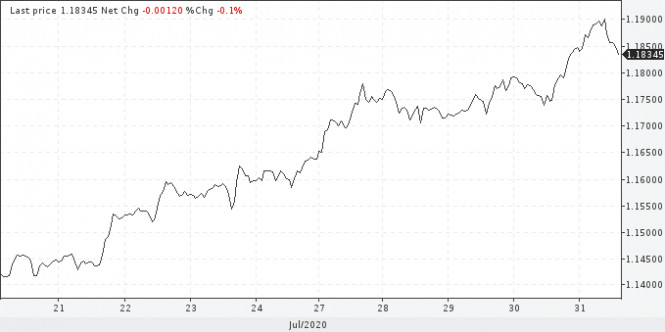
| Posted: 31 Jul 2020 09:05 AM PDT The euro/dollar pair today updated the next price highs on the background of rising European inflation and the general weakness of the US currency. On the wave of such optimism, traders tested even the 19th figure, impulsively overcoming price barriers. But they were unable to gain a foothold in this price area, apparently "scared" of such a height. The pair was last around the 19th price level in May 2018, more than two years ago. Therefore, as soon as buyers of EUR/USD touched the resistance level, there was an almost 100-point price pullback. The stakes are quite high: fixing in the area of the 19th figure will open the way to the 20th figures, that is, to the highs of 2017-2018 (then the euro/dollar pair was able to reach 1.25 - unprecedented heights since 2015). That is why it will be more and more difficult for EUR/USD bulls now, given the 20th figure that has appeared on the horizon. The closer the pair gets to it, the more actively it will be sold, fearing mass profit-taking.
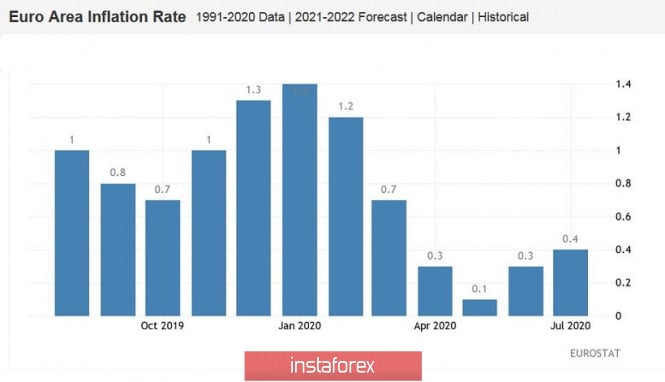
Let me remind you that the dollar was "broken" by three main factors: the Fed's pessimism, the coronavirus, and the record fall of the American economy. Against the background of such a fundamental picture, the dollar index updated two-year lows, reflecting the weakening across the market. The euro/dollar pair, in turn, gained a foothold within the 18th figure yesterday, but could not overcome the resistance level of 1.1850. Today, European statistics came to the aid of buyers of the pair. However, it is also not so clear, but in the first half of the day on Friday, the market focused only on the positive aspects of statistical reporting. First of all, we are talking about European inflation, which was in the "green zone", that is, better than forecasts. The most important indicator for the ECB – the consumer price index – has been gradually declining since the beginning of the year (that is, even before the "coronavirus crisis"): if in January the overall CPI was at 1.4%, in May, it fell to a multi-year low: 0.1%. However, the June figures reflected a slight increase (+0.3%), and today we saw its continuation: in July, the indicator came out at 0.4%. The core inflation index (that is, excluding volatile energy and food prices) showed a more significant increase: after the June decline to an annual minimum of 0.8%, the indicator jumped to 1.2%, that is, to the "pre-crisis" level. Immediately after the release, the euro/dollar pair tested the 19th figure but almost immediately retreated.
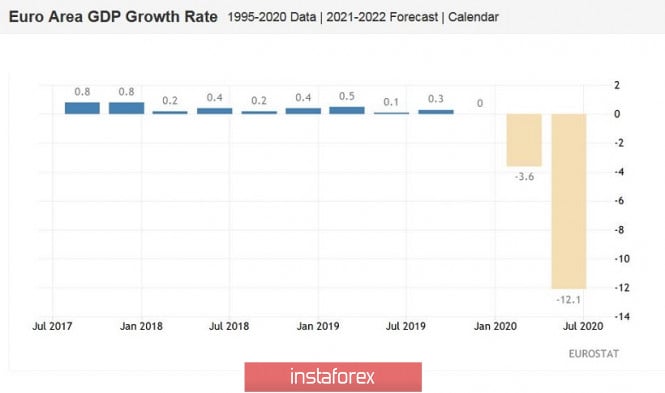
The fact is that other data were published today, which reflect a less rosy picture. We are talking about the dynamics of the growth of the European economy in the second quarter. Yesterday, a similar indicator of the US updated the anti-record, and today Europe "took over the baton". The volume of European GDP decreased by 12% quarterly and by 15% on an annual basis. This is the biggest drop in 25 years – that is since such statistics have been kept. The economy of Spain suffered the most: their GDP collapsed immediately by 18.5%. In second and third places, respectively, Portugal and France, with -14.1% and -13.8%. The best indicator was Lithuania – where the economy shrank by only 5.1%.
Experts expected to see these figures slightly higher, so the European currency was still under pressure, despite the increase in inflation. Also, the so-called "Friday factor" played a role: many traders do not risk leaving orders for the weekend and fix profits. The mass nature of such decisions led to the fact that the euro/dollar pair declined to the base of the 18th figure. Thus, taking into account the current circumstances, we can conclude that the euro/dollar pair has reached its local peak today (i.e., the 1.1909 marks). After an unsuccessful assault on the 19th figure, many traders decided to pause until Monday, thereby exerting some pressure on the pair. But the technical side of the issue is still on the side of buyers: on all "senior" timeframes (from H4 and above), the pair is either on the upper or between the middle and upper lines of the Bollinger Bands indicator. Also, on the daily and weekly charts, the Ichimoku indicator has formed one of its strongest bullish signals, the "Line Parade". All this suggests that next week buyers can make a second attempt to storm the 19th figure. But it is advisable to make trading decisions on Monday since the fundamental picture for the euro/dollar pair is changing at a kaleidoscopic speed and it is not recommended to leave open positions for the weekend. The material has been provided by InstaForex Company - www.instaforex.com |
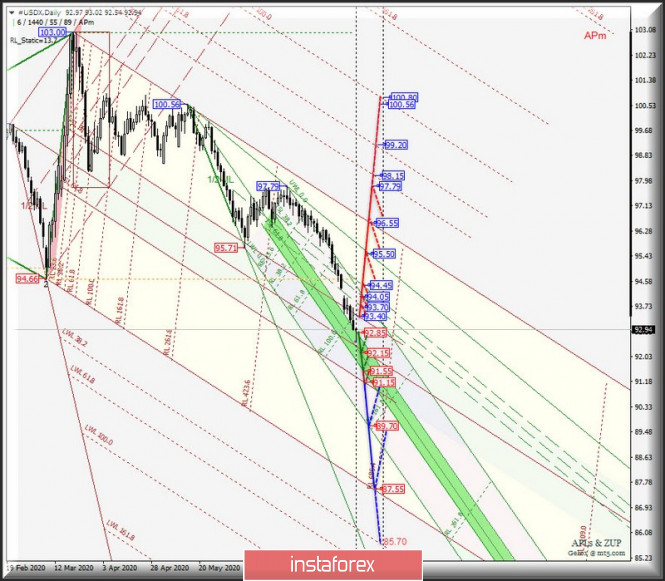
| Posted: 31 Jul 2020 09:05 AM PDT Minor operational scale (Daily) Dream and reality flights in July will continue in August? Or are we still waiting for a correction? Options for the development of the movement for #USDX vs EUR/USD & GBP/USD & USD/JPY (Daily) on August 1, 2020. ____________________ US dollar index From August 01, 2020, the movement of the dollar index #USDX will depend on the direction of the breakout of the range:
In the case of breakdown of the resistance level of 93.40 at the upper boundary ISL38.2 equilibrium zone of the Minute operational scale fork, the movement of the dollar index will be sent to the borders of the channel 1/2 Median Line (93.70 - 94.05 - 94.45) of the Minute operational scale fork, and if it will be the place to be break of the upper border (94.45) this channel, then the upward movement #USDX can be continued to the objectives:
In case of a breakdown of the support level of 92.85 at ISL38.2 Minute, the movement of the dollar index will continue in the equilibrium zone (92.85 - 92.15 - 91.55) of the Minute operational scale fork, and if there is a joint breakdown of ISL61.8 Minute (91.55) and the lower border of ISL61.8 (91.15) the equilibrium zones of the Minor operational scale fork, then the downward movement of #USDX can be continued to the final FSL Minute line (89.70) and the final FSL Minor line (87.55). The layout of the #USDX movement options from August 1, 2020 is shown on the animated chart.
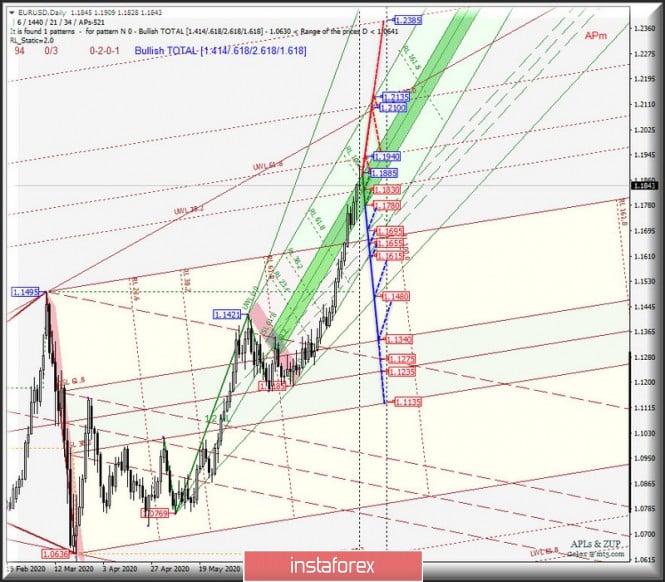
____________________ Euro vs US dollar The single European currency EUR/USD will continue to move from August 1, 2020, depending on the development and direction of the breakdown of the boundaries of the equilibrium zone (1.1885 - 1.1830 - 1.1780) of the Minute operational scale fork - details of movement within this equilibrium zone are shown on the animated graph. In case of a breakdown of the support level 1.1780 at the lower border of the ISL38.2 channel, the equilibrium zone of the Minute operational scale fork, the downward movement of the single European currency can be continued to the borders of the 1/2 Median Line Minute channel (1.1695 - 1.1655 - 1.1615) with the prospect of reaching the control line LTL Minute ( 1.1480) and to the upper boundary ISL61.8 (1.1340) of the balance zone of the Minute operational scale fork. Breakdown of the resistance level of 1.1885 at the upper border of the ISL61.8 channel of the equilibrium zone of the Minute operational scale fork - a variant of the continuation of the EUR/USD upward movement towards the targets:
The EUR/USD movement options from August 1, 2020 are shown on the animated chart.
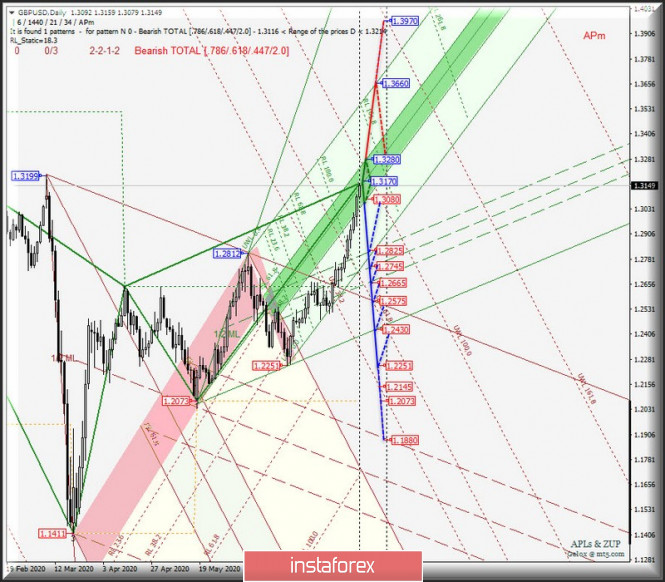
____________________ Great Britain pound vs US dollar The development of the movement of Her Majesty's currency GBP/USD from August 1, 2020 will also be due to the development and direction of the breakdown of the boundaries of the equilibrium zone (1.3280 - 1.3170 - 1.3080) of the Minute operational scale fork - details of movement inside this channel are shown on the animated chart. The breakdown of the support level of 1.3080 on the bottom of the channel ISJ38.2 equilibrium zone of the Minute operational scale fork will direct the movement of GBP/USD to the borders of the channel 1/2 Median Line Minute (1.2825 - 1.2745 - 1.2665), when breaking the lower border (1.2665) which downward movement can be continued to the line of control UTL (1.2575) of the Minor operational scale fork, and to the control line LTL Minute (1.2430). The breakdown of the resistance level of 1.3280 on the top border ISL61.8 equilibrium zone of the Minute operational scale fork will be relevant in the continued development of the upward movement of the currency of Her Majesty to the end of the line FSL Minute (1.3660). We look at the options for the movement of GBP/USD from August 1, 2020 on an animated chart.
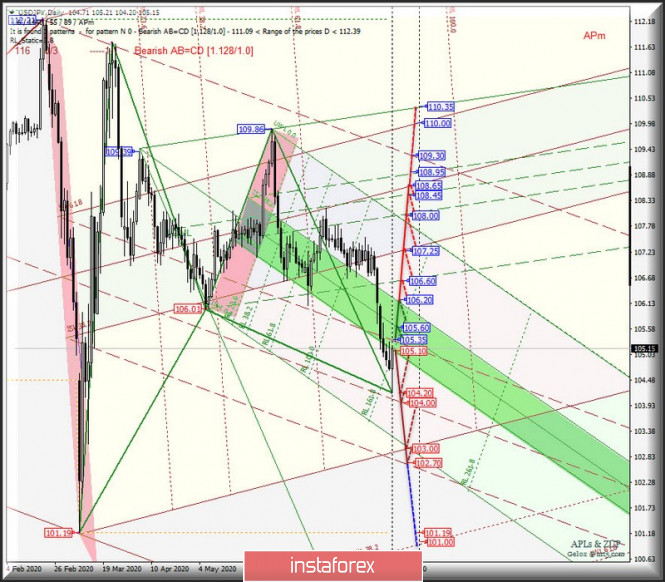
____________________ US dollar vs Japanese yen The development of the movement of the currency of the "Land of the Rising Sun" USD/JPY from August 1, 2020 will be determined by the development and direction of the breakdown of the range:
The breakdown of the resistance level of 105.35 on the upper border of the channel 1/2 Median Line Minor will confirm the movement of the currency "Land of the Rising Sun" in the zone of equilibrium (105.10 - 105.60 - 106.20) of the Minute operational scale fork, and if you happen to breakdown ISL38.2 Minute (106.20), the upward movement of the USD/JPY will continue to the ultimate Shiff Line Minute (106.60) with the prospect of reaching the zone boundary equilibrium (107.25 - 108.65 - 110.00) of the Minor operational scale fork, and channel 1/2 Median Line Minute (108.00 - 108.45 - 108.95). A breakout of the lower border ISL61.8 zone equilibrium of the Minute operational scale fork - support level of 105.10 - will determine further movement of the USD/JPY in the channel 1/2 Median Line (105.35 - 104.00 - 102.70) of the Minor operational scale fork. The markup of the USD/JPY movement options from August 1, 2020 is shown on the animated chart.
____________________ The review is compiled without taking into account the news background, the opening of trading sessions of the main financial centers and is not a guide to action (placing "sell" or "buy" orders). Formula for calculating the dollar index: USDX = 50.14348112 * USDEUR0.576 * USDJPY0.136 * USDGBP0.119 * USDCAD0.091 * USDSEK0.042 * USDCHF0.036. Where the power coefficients correspond to the weights of currencies in the basket: Euro - 57.6 %; Yen - 13.6 %; Pound sterling - 11.9 %; Canadian dollar - 9.1 %; Swedish Krona - 4.2 %; Swiss franc - 3.6 %. The first coefficient in the formula brings the index value to 100 on the starting date - March 1973, when the main currencies began to be freely quoted relative to each other. The material has been provided by InstaForex Company - www.instaforex.com |
| July 31, 2020 : GBP/USD Intraday technical analysis and trade recommendations. Posted: 31 Jul 2020 07:42 AM PDT
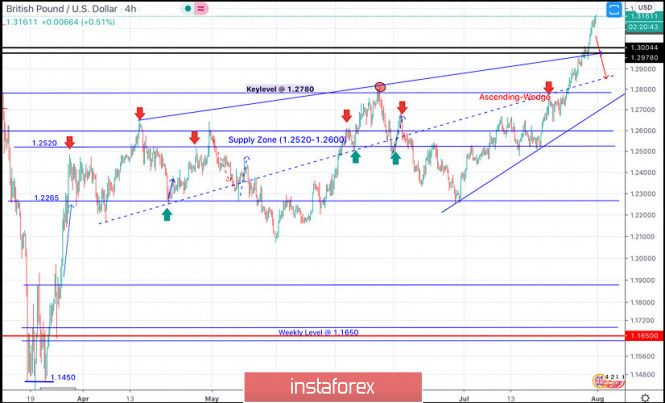
Intermediate-term Technical outlook for the GBP/USD pair remains bullish as long as bullish persistence is maintained above 1.2265 (Previous Consolidation range Lower Limit) on the H4 Charts. On May 15, transient bearish breakout below 1.2265 (the depicted demand-level) was demonstrated in the period between May 13 - May 26, denoting some sort of weakness from the current bullish trend. However, immediate bullish rebound has been expressed around the price level of 1.2080 bringing the GBPUSD back above the depicted price zone of 1.2520-1.2600 which failed to offer sufficient bearish rejection. Further bullish advancement was expressed towards 1.2780 (Previous Key-Level) where another episode of bearish pullback was initiated. Short-term bearish movement was expressed, initial bearish targets were located around 1.2600 and 1.2520 which paused the bullish outlook for sometime & enabled further bearish decline towards 1.2265. Significant bullish rejection was originated around 1.2265 bringing the GBP/USD pair back towards 1.2780, where the mid-range of the depicted wedge-pattern failed to offer enough bearish rejection. This indicated a continuation of the current bullish movement towards 1.2970-1.2980 where the upper limit of the depicted pattern came to meet the pair. Trade recommendations : Technical traders are advised to wait for any upcoming bearish breakdown below 1.2980 as a valid SELL Entry. Initial T/p level is to be located around 1.2780. On the other hand, bullish persistence above 1.2980 invalidates this trading scenario. The material has been provided by InstaForex Company - www.instaforex.com |
| July 31, 2020 : EUR/USD daily technical review and trade recommendations. Posted: 31 Jul 2020 07:30 AM PDT
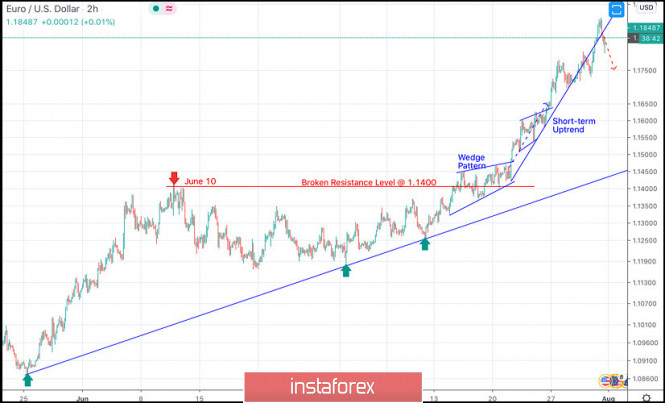
The EURUSD pair has been moving-up since the pair has initiated the depicted uptrend line on May 25. On June 11, a major resistance level was formed around 1.1400 which prevented further upside movement for some time and forced the pair to have a downside pause. However, a few negative fundamental data from the U.S. have caused the EUR/USD to achieve another breakout to the upside. This week, the EURUSD has approached the price levels around 1.1750 while temporary signs of downside pressure were demonstrated before another upside movement could be expressed towards 1.1900. Intraday traders should be considering any breakdown of the depicted short-term uptrend line. A Breakdown below the price level of 1.1750 and 1.1650 is going to give a better confirmation for a valid SELL Position. Estimated targets would be located around 1.1550, 1.1500 then 1.1450. The material has been provided by InstaForex Company - www.instaforex.com |
| July 31, 2020 : EUR/USD Intraday technical analysis and trade recommendations. Posted: 31 Jul 2020 07:19 AM PDT
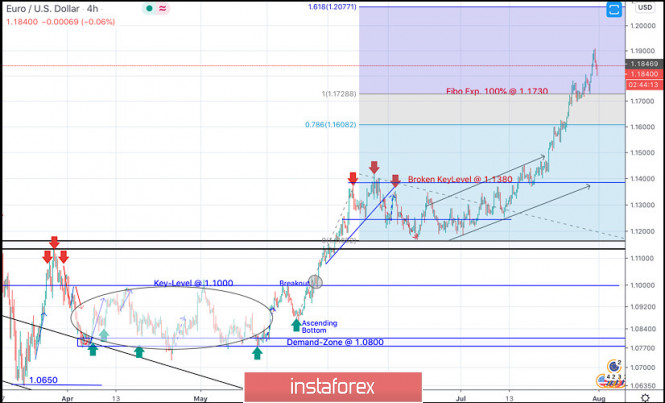
On March 20, the EURUSD pair has expressed remarkable bullish recovery around the established bottom around 1.0650. Shortly after, a sideway consolidation range was established in the price range extending between 1.0770 - 1.1000. On May 14, evident signs of Bullish rejection as well as a recent ascending bottom have been manifested around the price zone of (1.0815 - 1.0775), which enhances the bullish side of the market in the short-term. Bullish breakout above 1.1000 has enhanced further bullish advancement towards 1.1150 then 1.1380 where another sideway consolidation range was established. Hence, Bearish persistence below 1.1150 (consolidation range lower limit) was needed to enhance further bearish decline. However, the EURUSD pair has failed to maintain enough bearish momentum to do so. Instead, the current bullish breakout above 1.1380-1.1400 has lead to a quick bullish spike directly towards 1.1600 (Fibonacci Expansion 78.6% level) which failed to offer sufficient bearish pressure. That's why, further bullish advancement pursued towards 1.1730 (Fibonacci Expansion 100% level) which is failing to offer sufficient bearish rejection up till now as well. Bullish persistence above 1.1730 will probably favor further bullish advancement towards 1.2075 (161% Fibo Expansion Level) in the intermediate-term. Trade recommendations : Conservative traders should wait for the current bullish movement to pause and get back below 1.1730 as an indicator for lack of bearish momentum for a valid SELL Entry.T/P levels to be located around 1.1600 and 1.1500 while S/L to be placed above 1.1800 to minimize the associated risk. The material has been provided by InstaForex Company - www.instaforex.com |
| America, Asia, and Europe stock markets remain in an irresolute movement Posted: 31 Jul 2020 07:16 AM PDT
Growth could not slide through the Asia-Pacific stock exchanges on Friday as decline took place in almost all directions. The reason for the negative dynamics was the very unconvincing statistics on the economic growth of the United States of America, as well as the employment market in the country. According to the latest data, the level of the US gross domestic product in the second quarter decreased significantly by 32.9% on an annualized basis. This was a huge collapse, which has never been encountered in the entire history of this indicator research. It should be noted that the initial expectation of the experts would be around 34.1% or even 34.6%. However, the real figures also did not inspire the stock markets too much, as they reflected the obvious problems in the country's economy that need to be addressed urgently. The data on the unemployment rate in the USA were not too good either. As it turned out, the number of new applications for benefits has become higher, which indicates an increase for the second week in a row. The number of workers who were sent on unplanned and unpaid leave associated with the closure of bars, restaurants and other establishments in the southern and western states of the state is also growing amid the ongoing coronavirus pandemic. All this leads analysts to say that the unemployment rate in the country in the second month of July will be even higher than previously expected. Japan's Nikkei 225 index began to decline Friday morning by about 2.82%. Even very good data on the Japanese labor market could not support the indicator. Thus, the unemployment rate in the country in the first month of the summer decreased to 2.8%, while earlier it was at the level of 2.9%. Economists were preparing for a more serious failure of the indicator, believing that it will drop to the 3.1% region. Despite clear progress, the indicator is still higher than last year's level of 2.3%, which means that the problem has not yet been resolved. Another important indicator of the labor market is the number of applicants for available vacancies. In June, there were 111 available jobs for every 100 applicants in Japan. This was evidence of a decline, since a month earlier their ratio was 100 to 120. The current level has become the lowest over the past almost six years. The volume of Japanese industrial production in the first month of summer increased which happened for the first time in the past five months. The increase was 2.7% compared to previous data, while analysts were preparing for an increase of no more than 1.2%. However, on a yearly basis, this indicator showed a drop of 17.7%, while experts argued that it would not fall below 17%. China's Shanghai Composite Index rose 0.55%, unlike its Japanese counterpart. The Hong Kong Hang Seng index did not support the positive trend of China and dropped by 0.1%. The PMI index in the Chinese processing industry for the second month of the summer was able to increase and reach 51.1 points, while a month earlier its level was 50.9 points. At the same time, preliminary data indicated a possible reduction of the indicator to 50.7 points. Recall that the level above 50 points is evidence of the growth of business activity in the field, which means that things are on the mend in China, especially since the growth has been observed for the fifth month in a row after the massive collapse occurred against the backdrop of the COVID-19 pandemic. Companies are gradually returning to their usual way of life and increasing the pace of activity. The index of business activity in the construction and services of the PRC is also growing. In July it has already reached 54.2 points, while in the first month of summer it was 54.2 points. Here, the fifth growth in a row was also recorded. South Korea's Kospi index moved down and fell to 0.78%. The Australian S & P / ASX 200 index supported the negative trend and declined even more - by 2.5%. At the end of the trading in the US stock markets on Friday, a single vector of movement could not be determined and parted on different sides. Thus, the Dow Jones and S&P 500 stock indicators were marked by a reduction, while the Nasdaq Composite grew on the background of an increase in the value of shares of a number of companies in the technology sector. The Dow Jones Industrial Average fell by 0.85% or 225.92 points, which sent it to the area of 26,313.65 points. During the trading day, the indicator's losses reached 550 points, which indicates high volatility in the market. The Standard & Poor's 500 index was also in the negative declining by about 0.38% or 12.22 points, and the current level moved to the level of 3,246.22 points. The Nasdaq Composite was the only one that felt support and rose by 0.43% or 44.87 points, which moved it to the level of 10,587.81 points. At the same time, a significant drop was recorded earlier up to 10,412.09 points. Despite some pullback, the indicators were unable to move below their minimum session values. The main influence on them will now have the reporting on the work of the largest US companies, which still continues to appear in the press. Since the policy to stimulate the country's economy has not yet been fully determined by the government, and the statistics on economic growth are poor, investors are waiting for positive signals from the corporate sector. Meanwhile, the European stock exchanges went on positive dynamics is almost everywhere, the reason for which was the good statistics from the largest companies in Europe. Even the growing fears of a slowdown in the growth rate of the EU economy amid the global coronavirus pandemic could not interrupt the enthusiasm of investors. The general index of the largest enterprises in the European region Stoxx Europe 600 began to grow by 0.79%, and as a result, was at around 362.36 points. However, yesterday the indicator was in a deep negative and declined by 2.2% becoming the maximum for a day over the past four weeks. However, it may show a slight drop of 0.2% by the end of the month. The UK FTSE 100 Index rose 0.31%. The German DAX Index climbed 0.74%. France's CAC 40 index rose 0.6%. The Italian FTSE MIB index was the leader of growth with 1.04%. On the other hand, Spain's IBEX 35 index is the only one that has moved backward: it fell by 0.13%. The material has been provided by InstaForex Company - www.instaforex.com |
| Posted: 31 Jul 2020 05:39 AM PDT
Analyzing the current trading chart on the 4H time-frame, I found that there is symmetrical triangle chart formation in creation, which is sign that BTC is in period of contraction and that breakout should happen in next period. The material has been provided by InstaForex Company - www.instaforex.com |
| Trading plan for SPX500 for July 31, 2020 Posted: 31 Jul 2020 05:37 AM PDT
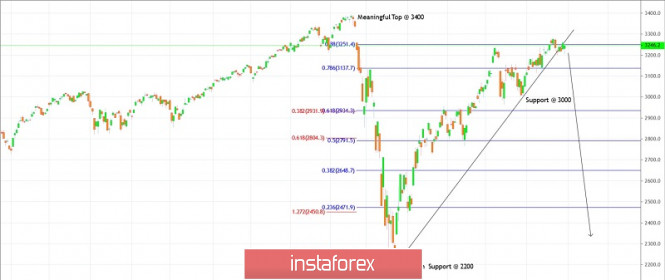
Technical outlook: SPX500 is looking to turn lower from current price around 3250/60 levels respectively. The index futures are seen to be trading around 3265 levels at this point in writing and seems to have carved a meaningful lower top around 3280 levels earlier. SPX500 faces major resistance around 3400 levels and is expected to remain under control of bears until prices stay below that mark, going forward. Immediate support is seen towards 3100, while resistance is around 3280 levels respectively. The boundary which is being worked upon is between 3400 and 2200 respectively. Also note that SPX500 has retraced up to fibonacci 0.88 levels of the previous drop. High probability remains for a bearish reversal ahead. Trading plan: Remain short stop @ 3400 target is open Good luck! The material has been provided by InstaForex Company - www.instaforex.com |
| Trading plan for USDCHF for July 31, 2020 Posted: 31 Jul 2020 05:27 AM PDT
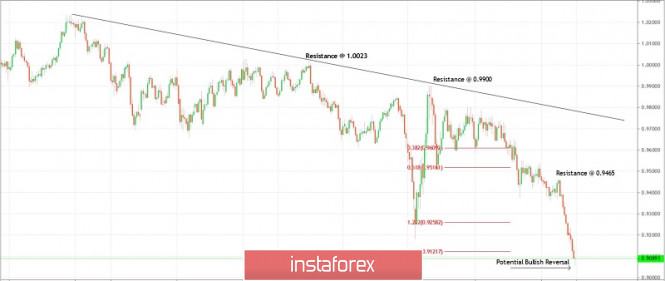
Technical outlook: USDCHF had dropped through 0.9056 levels during early hours of trade today. The currency pair is seen to be trading around 0.9090 levels at this point in writing and might have carved a meaningful bottom. Also note that a bullish pin-bar or hammer candlestick pattern is being produced on the daily chart as we write this article. This could be a potential bullish reversal starting Monday, as bulls prepare to regain control. Immediate resistance on the daily chart is seen towards 0.9465 while interim support is today's low around 0.9056 respectively. Also note that USDCHF seems to have completed its drop from 0.9900 as highlighted by the fibonacci extensions on the chart here. High probability remains for a bullish reversal ahead. Trading plan: Remain long with stop @ 0.9000, target is open Good luck! The material has been provided by InstaForex Company - www.instaforex.com |
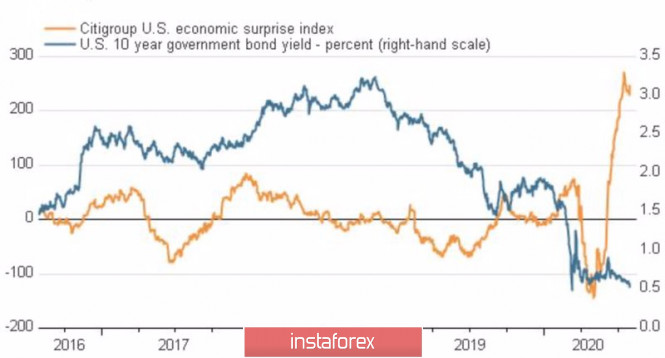
| Posted: 31 Jul 2020 05:25 AM PDT When investors' desire to get rid of the US dollar and the growing interest in the euro are intertwined, the "bulls" on EUR/USD cannot be stopped. The GBP/USD soared to the highest since May 2018 against the serious sagging US GDP since the beginning of the accounting in the post-war period, undermining faith in the V-shaped recovery of the US economy, the willingness of the Fed to expand its program of liquidity provision on repo and currency swaps, as well as the comments of Donald Trump. The president suggested the idea of postponing the elections, since voting by mail creates grounds for fraud. Political uncertainty is an important negative driver for the US dollar, and it must be admitted that it is not the only one. After the world's leading central banks in unison lowered their main interest rates to zero levels, and the turmoil in financial markets remained in the past, life in Forex has become more fundamental. If in the spring and early summer, the USD and S&P 500 indices reacted differently to macro statistics for the United States, then their combined fall in response to the more than 32% sagging of US GDP in the second quarter suggests that the dollar no longer enjoys the preference of the main safe-haven asset. It shows an increased sensitivity to the state of the US economy. In this regard, disappointing data on business activity and the labor market in the week to August 7 may lead to a drop in the index of economic surprises and a rise in EUR/USD. Dynamics of bond yields and the US economic surprise index
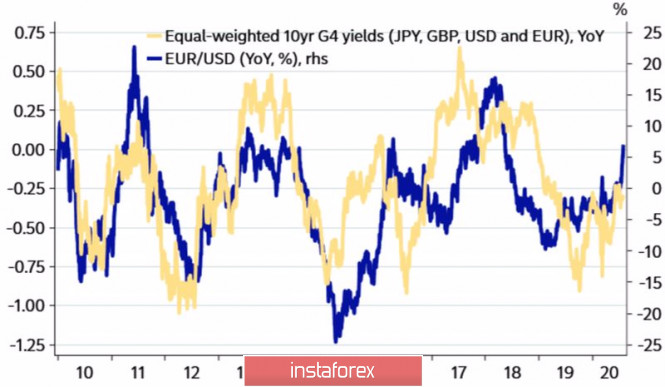
If the US dollar falls due to policy and a potential deterioration in macroeconomic conditions, growth in the number of infected COVID-19, the euro draws strength in improving the epidemiological situation in the Old World, in the belief that the Eurozone economy will return to pre-crisis levels faster than the US, and finally, in anticipation of the diversification of portfolio investors and foreign exchange reserves by central banks in favor of "Europeans". An important driver of EUR/USD growth in the medium term may be the acceleration of global inflation triggered by a large-scale monetary stimulus. As a result, US, German, British and Japanese bond yields will go up, which is historically considered good news for the main currency pair. Dynamics of EUR/USD and bond yields
However, in my opinion, at the end of July, the market was running ahead of itself and it needs a break. The outlook for global GDP is far from rosy, with German and Spanish gross domestic product data in the second quarter disappointing, as did French consumer confidence. Leading indicators from Bloomberg indicate that the Chinese economy slowed down in July. If you add to this the severe epidemiological situation in the world and in the US, then a correction of EUR/USD looks very likely. In this situation, you can sell the pair on the breakout of support at 1.1845 and 1.177 with narrow targets or form long-term positions on the rebound from the levels of 1.177, 1.172 and 1.1665 with targets at 1.202 and 1.207. EUR/USD, the daily chart
|
| Posted: 31 Jul 2020 05:24 AM PDT News: Prior +0.3%
Euro area inflation unexpectedly comes in at a beat and that is welcome news for policymakers for the time being. The bigger question of whether or not price pressures can improve amid the fallout from the virus crisis still remains but at least there is some positive takeaway in terms of data from Europe today after the doom and gloom Q2 GDP reports.
|
| US dollar weakens: it just beginning Posted: 31 Jul 2020 05:19 AM PDT Global investors were really nervous, and they had reasons for that. Stock bulls have lost their positivity whereas bears are becoming more and more active. Increasing uncertainty about the US economy after the sharpest drop of GDP in history forced investors to focus on sell deals. Political instability also causes concerns. Thus, it is quite possible that the US presidential election will be postponed. At least that is what Donald Trump said. He believes that it is impossible to hold fair elections amid the coronavirus pandemic. In addition, the party members have not agreed yet on a package of state support for the economy in the amount of $1 trillion. They have too different views. Democrats want to keep the increased unemployment benefits, while Republicans are opposing this idea. If the authorities fail to increase unemployment benefits by $600, markets' reaction is likely to be negative. This background contributes to a decline in stock indices of the United States. On Thursday, the Dow Jones index fell by 0.85%, the S&P 500 dropped by 0.38%. On Friday, the moderate negative dynamic continued. The strong financial results of the US tech giants seem to mark the end of a period of good news. There is a lot of negative news for the stock market ahead, at least during the coming weeks. Today's main event is the US fiscal decision. The issue of a possible postponement of the US election is also of vital importance. At the end of the week, markets will focus mainly on these issues. Outlook for the US dollar The US dollar continues to fall on doubts about the economic health of the United States. The US dollar index reached its lowest level since May 2018. Further weakening of the greenback is pushing the US dollar index to a new two-year low of 92.50 and is boosting the EUR/USD pair above the two-year high of 1.1900. EUR / USD The euro is set for a sixth weekly increase today. And as most experts believe, the single currency has may reach the 1.2000 level against the US dollar. Now, the significant weakness of the US dollar looks justified and the correction is likely to be limited. Has the US dollar hit the bottom? There is no point in answering this question yet. The US has a lot of reasons to ease its monetary policy. The country's economy is fragile, and there is no clear prospect of the weakening of the coronavirus pandemic. If sellers of the EUR/USD pair fail to create resistance in the area of 1.2000, then before the end of the year, the price may approach the level of 1.2500. There will be no doubt about the long-term downward trend of the US dollar. The material has been provided by InstaForex Company - www.instaforex.com |
| Trading plan for Silver for July 31, 2020 Posted: 31 Jul 2020 04:54 AM PDT
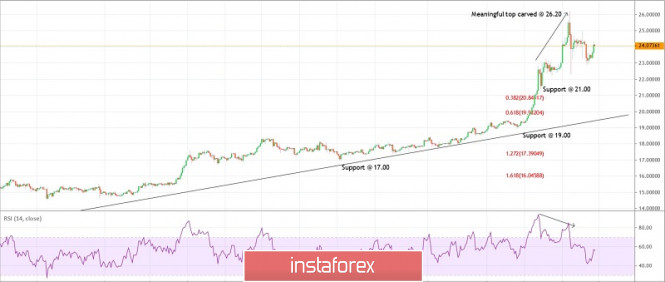
Technical outlook: Silver has lagged behind its counterpart Gold and has not been able to print above $26.20 highs today. This is also a kind of bearish divergence which traders should remain watchful off. A potential top might just have been carved out at $26.20, and a break below $22.30 would certainly confirm that the trend has reversed. Immediate support is seen around $21.00, followed by $19.00, while resistance is seen towards $26.20 respectively. It would be considered safe to remain flat for now but plan to sell on a break below $23.00, going forward. The recent boundary which is being worked upon is between $26.20 and $22.30 and a fibonacci extension reveals a potential drop towards $16.00 levels, going forward. Trading plan: Aggressive traders remain short against @ 26.20, target is open Conservative traders sell on a break below $23.00, stop @ 26.20, target is open. Good luck! The material has been provided by InstaForex Company - www.instaforex.com |
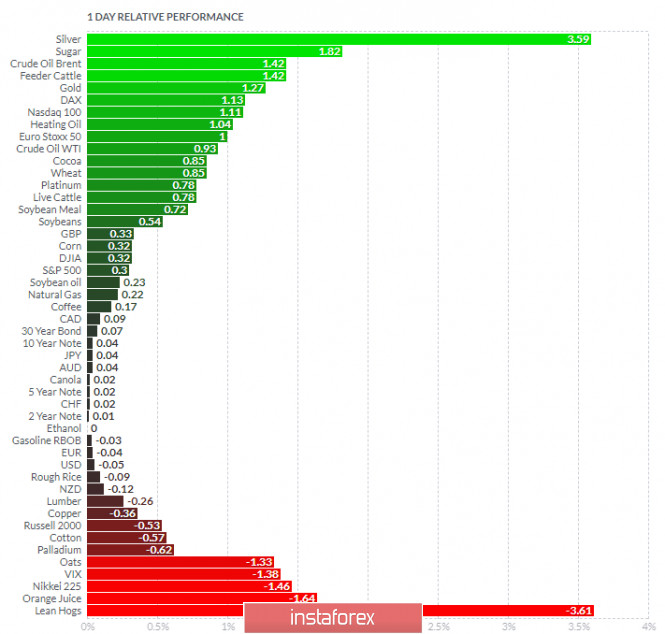
| Posted: 31 Jul 2020 04:53 AM PDT US strikes $2.1 billion coronavirus vaccine deal with Sanofi, GlaxoSmithKline The deal will see the firms provide the US government with 100 million doses of the corona virus vaccine, with the US to provide up to $2.1 billion for development, clinical trials, manufacturing and the delivery of the initial batch of doses. The US will also have a further option for a supply of additional 500 million doses of the vaccine in the longer-term. GSK adds that if study data are positive, the companies can request US regulatory approval some time in 1H 2021. To put a bit of a timeline on things, phase 1/2 of the study is expected to start in September with Phase 3 set to be conducted by the end of the year.
1-Day relative strength performance by Finviz
|
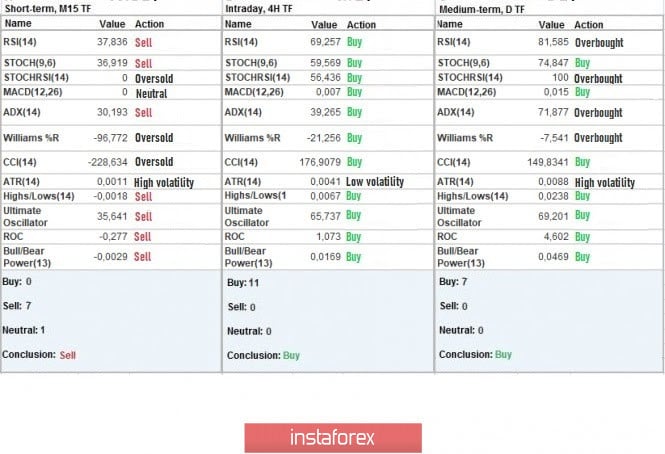
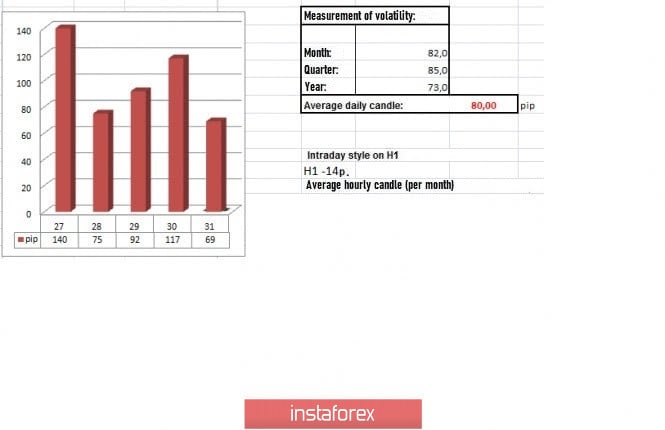
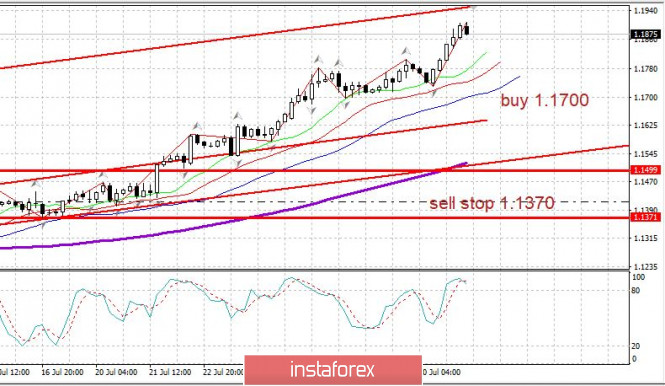
| Trading recommendations for the EUR/USD pair on July 31, 2020 Posted: 31 Jul 2020 04:36 AM PDT The current trading week is coming to an end. If we review all the movement starting from the beginning of the week, we will see that the change in the medium-term downward trend is no longer something theoretical, but rather a fact in the market. The breakout of quotes in the area of 1.1550 / 1.1650 was a signal of major changes in the market, and the rate of change in quotes is very alarming. July was the second most active month after March, with which the quote managed to form such significant market changes in just a short period of time. Unfortunately, as before, a high rate of change in quotes lead to new bursts of activity, but only in the opposite direction. Thus, in order for the trend to be stable, the market needs a correction, but such will cause overheating of trading positions, which results in instability of the entire market structure. Thus, the current bullish speculative mood can change into a bearish one, if one of these reasons occur (technical correction, external background, consolidation). Analyzing the last trading day by minute, we can see that at the start of the European session, the quote tried to undergo a correction, but at the start of the American session, a round of long positions appeared, which led to the renewal of local highs. As a result, a high rate of volatility at 117 points was recorded, which is 46% higher than the average value. Such acceleration has been registered for the second week already, which indicates a high speculative mood in the market. Looking at the trading chart in general terms (daily period), we can see the breakdown of the June and September 2018 highs, with which 33% is left before the quote fully reaches the medium-term trend last 2018. Meanwhile, the news published yesterday included data on the US GDP for the second quarter, in which the GDP contracted -32.9% (q / q), and fell by almost 10% (-9.5%) y / y. Data on applications for unemployment benefits was also reported, with which initial applications increased from 1,422,000 to 1,434,000 (+12 thousand), while repeated applications increased from 16,151,000 to 17,018,000 (+867 thousand). Such confirms the fact that the situation with the coronavirus in the United States is not better, as well as the state of the labor market, which is directly reflected in the US dollar. Today, data on EU GDP will be released, forecasts of which are no better than the US. Everyone is expecting a decline, so, on an annualized basis, GDP may decrease by -14.7%, which is significantly higher with a minus sign than that of the United States. In quarterly terms, the decline may amount to -12.5%, but this does not change the situation that everything is bad. Data on inflation in Europe was also expected, where they also forecast a decline from 0.3% to 0.2%. The upcoming trading week will be full of events such as the release of PMI and retail sales in the EU, and the report of ADP and US Department of Labor on the US labor market. Important issues such as the coronavirus, Brexit and stimulus measures to support the economy will also be monitored. Monday, August 3 EU 09:00 - Manufacturing PMI (July) US 15:00 - ISM Business Activity Index (manufacturing sector) (July) Tuesday, August 4 US 15:00 - Volume of industrial orders (June) Wednesday, August 5 EU 10:00 - Retail Sales (July) US 13:30 - ADP Employment Report (private sector) (July) US 15:00 - ISM Business Activity Index (services sector) (July) Thursday, August 6 US 13:30 - Applications for unemployment benefits Friday, August 7 US 13:30 - Unemployment Report (from US Department of Labor) - Change in the number of people employed in the non-agricultural sector - Unemployment rate - Average hourly wages Further development Analyzing the current trading chart, we can see a slight pullback in quotes, probably due to the overheating of long positions, as well as the upcoming data for Europe. The current pullback should turn into a full-scale correction of about 20-30% relative to the upward move in the market, but speculators can use the upcoming EU GDP data to turn it into a regrouping of trade forces. Unfortunately, such will further exacerbate the overheating of long positions, which is likely to have a negative impact in the future, with which a collapse may occur. Thus, based on the above information, we present these trading recommendations: - Open sell transactions at positions lower than 1.1850, in the direction of 1.1800 - 1.1700 --- 1.1650. - Open buy transactions at positions higher than 1.1915, in the direction of 1.1980. Indicator analysis Analyzing the different sectors of time frames (TF), we can see that the indicators of technical instruments on the minute period signal "sell" due to the rollback in quotes, while the hourly and daily periods, as before, signal "buy" due to the upward trend. Weekly volatility / Volatility measurement: Month; Quarter; Year The measurement of volatility reflects the average daily fluctuation, calculated per Month / Quarter / Year. (July 31 was built, taking into account the time the article is published) The volatility at this current time is 69 points, which is 13% below the average daily value. It is assumed that volatility will remain high, due to the speculative mood of market participants and latest news on Europe and the US. Key levels Resistance zones: 1.2000 ***; 1.2100 *; 1.2450 **. Support Zones: 1.1800 **; 1.1650 *; 1.1500; 1.1350; 1.1250 *; 1.1.180 **; 1.1080; 1.1000 ***; 1.0850 **; 1.0775 *; 1.0650 (1.0636); 1.0500 ***; 1.0350 **; 1.0000 ***. * Periodic level ** Range level *** Psychological level Also check the trading recommendation for the GBP / USD pair here . The material has been provided by InstaForex Company - www.instaforex.com |
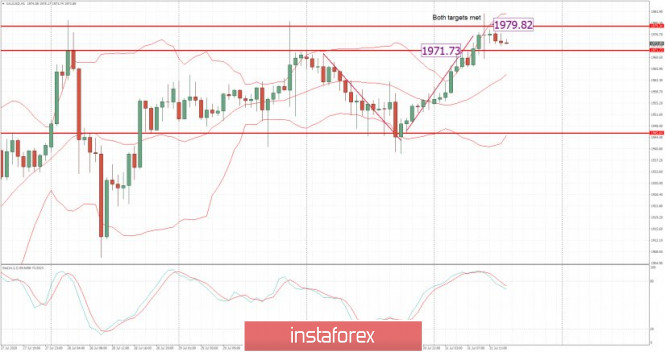
| Trading plan for Gold for July 31, 2020 Posted: 31 Jul 2020 04:30 AM PDT
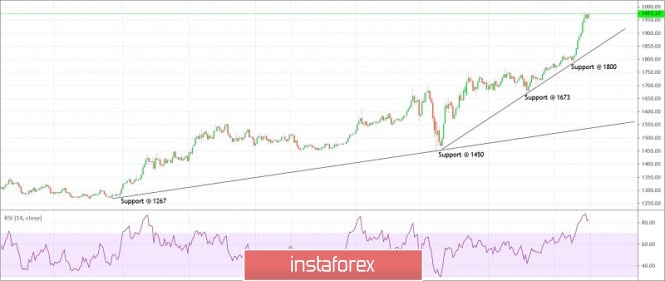
Technical outlook: Gold has print yet another high today at $1,984.22 levels before pulling back. The yellow metal is trading around $1,973.00 levels at this point in writing and is expected to carve a meaningful top anytime soon. A break below $1,939.36 would confirm that Gold has carved a top and is heading lower. Immediate support is seen towards $1,800, followed by $1,673 and $1,450 respectively. At the moment, Gold is trading clearly into the buy zones of the above support trend lines. Conservative traders would wait until prices drop below the trend line and enter into the sell zone. We remain flat for the moment and wait for the metal to break below $1,939.00 at least to resume selling on rallies. Trading plan: Remain flat for now, allow a break below $1,939.00 Good luck! The material has been provided by InstaForex Company - www.instaforex.com |
| Trading plan for USDJPY for July 31, 2020 Posted: 31 Jul 2020 04:06 AM PDT
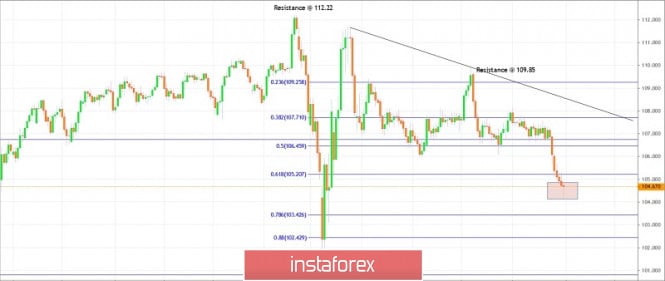
Technical outlook: USDJPY has dropped to 104.18 levels today and might have carved a meaningful bottom today. The currency pair is seen to be trading around 104.67 levels at this point in writing and is expected to produce a bullish reversal here. USDJPY is carving a potential pin-bar candlestick pattern on the daily chart, which is also known as a hammer. A confirmation of a hammer today will increase probability of a bullish Morning Star candlestick pattern on Monday. Also note that USDJPY is trading just below the fibonacci 0.618 retracement of the previous rally between 101.18 and 111.75 respectively, which is passing through 105.00/20 levels. The currency pair should trade higher from here, going forward. Trading plan Remain long, stop @ 103.18 target @ open Good luck! The material has been provided by InstaForex Company - www.instaforex.com |
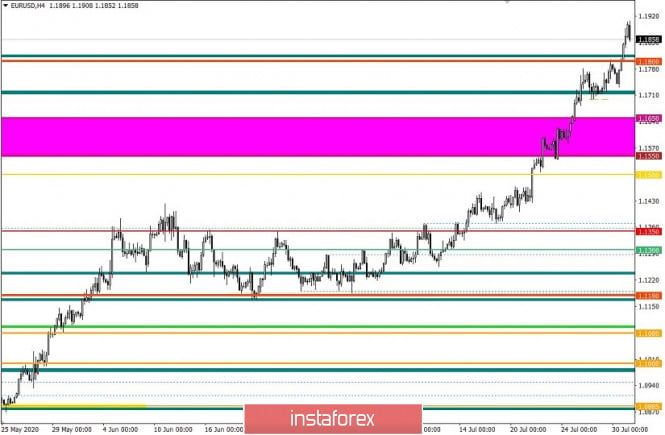
| EUR/USD At New Highs As Expected! Posted: 31 Jul 2020 03:54 AM PDT
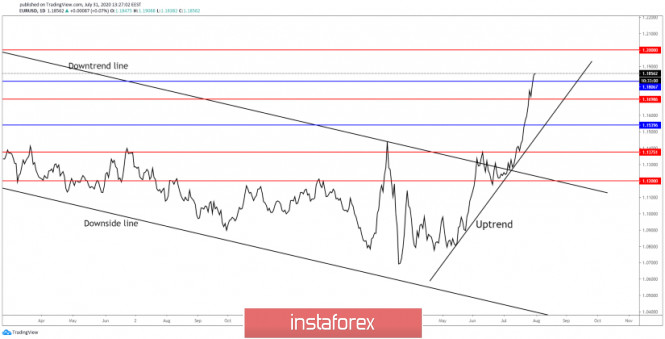
EUR/USD has resumed its upside movement and now is traded at 1.1861 level, the next major upside targets are seen at the 1.19 and at the 1.20 levels. The pair is traded far above the uptrend line, so the outlook is bullish, EUR/USD could climb higher, towards new highs as long as it stays within the uptrend. The 1.1806 was seen as an important upside target, the breakout above this obstacle signals that the buyers are very strong and they could push the rate higher in the upcoming period.
A minor consolidation, accumulation, sideways movement above the 1.1806 - 1.1800 area could bring another buying opportunity. You should know that a sideways movement will suggest that EUR/USD tries to capture more energy before going higher towards the 1.1900 and towards the 1.20 psychological level. The upside bias will remain intact as long as the uptrend line is intact. I believe that only a valid breakdown through the uptrend line could invalidate a further increase and will suggest selling this pair. The material has been provided by InstaForex Company - www.instaforex.com |
| Trader's diary on 07/31/2020. EURUSD Posted: 31 Jul 2020 03:35 AM PDT EUR/USD: The single European currency is ready for a deep correction. Buying will be considered from a strong pullback from the level of 1.1700 and below. Selling, on the other hand, will be considered from the last high with a stop of 45 pips. The material has been provided by InstaForex Company - www.instaforex.com |
| Oil prices ride roller coaster Posted: 31 Jul 2020 03:35 AM PDT
The volatility of oil demand is one of the reasons for the coronavirus spread. There is a risk of additional restrictive measures, as new outbreaks of the disease have been fixed in the United States, India, and China. The timing of economic recovery directly depends on the pandemic, the head of the US Federal Reserve said. If the pandemic worsens, it will be difficult to hope for a quick recovery in oil prices. According to official figures from the Department of Energy, US oil reserves fell by 10.6 million barrels. This is a record decline in oil reserves since the beginning of this year. The reduction in oil reserves was facilitated by a rise in net imports by 1 million barrels per day. Reserves of gasoline and distillates grew by 0.65 and 0.5 million barrels, respectively. The data exceeded the forecast. Also, from August 1, the terms of the new OPEC + deal will come into force. Oil production will rise despite the fact that demand is falling. In this regard, Saudi Arabia will reduce the official prices for its Arab Light oil for September delivery by $0.48 per barrel. Earlier, Saudi Arabia regularly raised prices, taking advantage of OPEC + production cuts and recovery in demand. Analysts also reported a significant drop in spot prices for Russian ESPO oil and UAE Upper Zakum blend in Asia. The reason for this was a drop in demand on the side of China. China does not need oil, as in the spring, it took advantage of the collapse in prices and bought cheap oil. China's oil reserves, both government and commercial, are overfilled. Moreover, recent floods in China have led to problems with logistics and, as a result, contributed to a reduction in imports. Due to this, fuel sales in India fell. Although, the demand for fuel in Asia has grown rapidly relative to the rest of the world, global reserves of oil and petroleum products are still very high. Moreover, the coronavirus continues to spread all over the world. Now, Arab Light oil is supplied to Asia at the price of $1.20 per barrel, but in September the price will fall to $0.72 per barrel. Benchmark oil prices rose after falling. Brent crude again approached the resistance of $43-44 per barrel. WTI price rose by 0,23% to trade at $40.01. The material has been provided by InstaForex Company - www.instaforex.com |
| Trading plan for GBPUSD for July 31, 2020 Posted: 31 Jul 2020 03:32 AM PDT
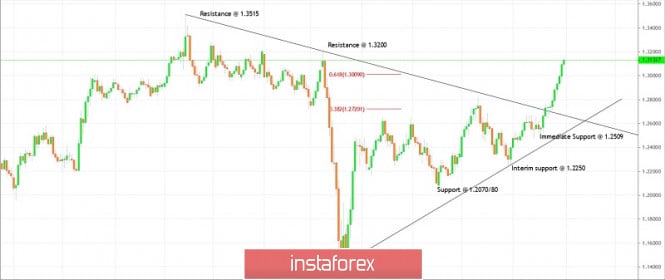
Technical outlook: GBPUSD has continued its rally through 1.3144 levels today before slipping lower. The currency is back to 1.1335 levels at this point in writing and might be looking to push through 1.3200 resistance going forward. It is not mandatory for GBPUSD to clear 1.3200 before reversing lower again but probabilities remain high. On the flip side, a break below 1.3100 would confirm that a meaningful top might be in place around 1.3144 today and bears would remain in control going forward. Also note that GBPUSD has already hit fibonacci 0.618 extension of the initial rally between 1.1414 and 1.2650 mark respectively. Hence a bearish reversal could be due anytime soon and traders might be prepare to sell again on a break below 1.3100 interim support. Trading plan: Remain flat for now and sell on a break below 1.3100, stop @ 1.3250, target is open Good luck! The material has been provided by InstaForex Company - www.instaforex.com |
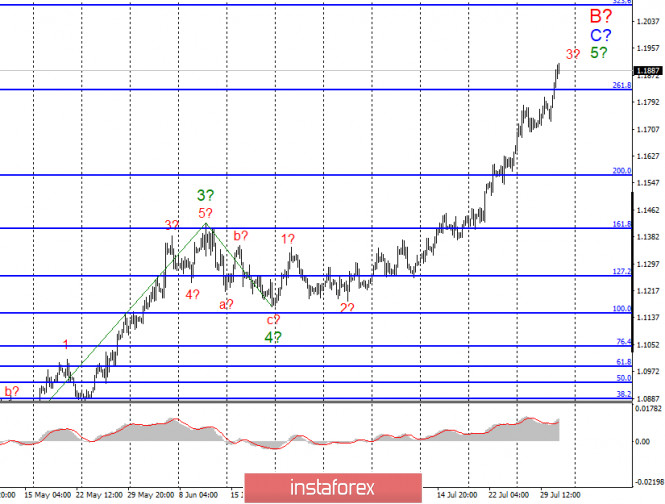
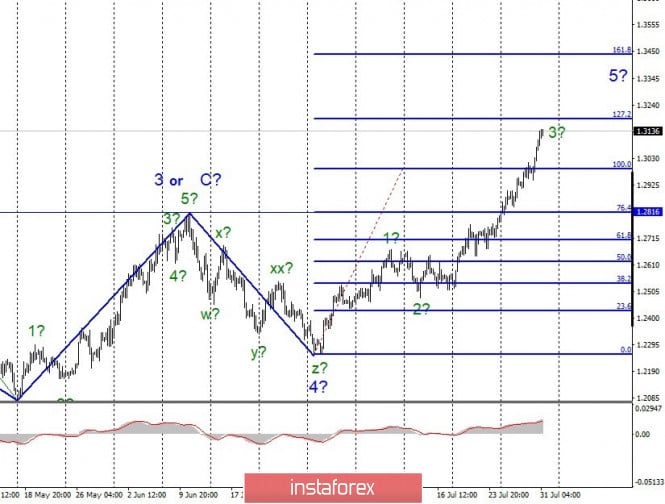
| Posted: 31 Jul 2020 03:23 AM PDT EUR / USD On July 30, the EUR/USD pair gained about 60 pips and thus, continues to build the supposed wave 3 in 5 in C in B, which takes on a very complex and extended form. But at the same time, there are still no signs of completion of this wave. You should be reminded that after the completion of this wave, a downward pullback and renewal of the rally is expected, as it takes another wave 5 in 5 in C in B to complete the wave structure. Moreover, a successful attempt to break through the 261.8% level indicates that the markets are ready for further purchases of the euro. Thus, the entire wave C to B may end near the 323.6% Fibonacci level. Fundamental component: Yesterday was truly a nightmare for the US currency. No, the US dollar did not collapse by 200 or 300 basis points, it continued to trade with the same amplitude with a decline. However, a new news pack from America was a verdict for the US currency. To begin with, GDP in the second quarter declined by almost 33%. No economist in the country can recall such a fall. Historians and political scientists say that if there was such a fall in the economy, it was 100 years ago, during the Great Depression. Secondly, Donald Trump proposed yesterday to postpone the elections in the country due to the COVID-2019 pandemic. The President of the United States wrote on his Twitter that citizens should be able to vote in person, not by mail, and also safely, which cannot be achieved given the current epidemiological situation in the country. The president's proposal drew a flurry of criticism from both Democrats and his own party members, Republicans. It should be noted that elections in the United States have never been postponed or canceled, even during the world wars, which, of course, Trump himself could not fail to know. Thus, Trump's attempt to buy time and hold elections later, when the situation in the country improves, failed. Well, the third thing I draw your attention to is a new increase in the number of cases per day in the US. Yesterday, the number of new infections was 90 thousand. Thus, the coronavirus continues to infect more and more of the American population, in such conditions it is extremely difficult to demand or at least expect a rapid recovery from the US economy, as Jerome Powell, Fed Chairman, said two days earlier. Thus, while the "golden time", what Trump promised is being postponed indefinitely. Today, I recommend paying attention to the inflation and GDP reports for the euro area, which may slightly reduce the demand for the EU currency. General conclusions and recommendations: The euro/dollar pair presumably continues to build an upward wave C in B. Thus, I recommend staying in buying the instrument with targets located near the calculated level of 1.2084, which equates to 323.6% Fibonacci. GBP / USD The GBP/USD pair gained about 100 pips by the end of the day on July 30 and thus, continues the construction of the expected wave 3 in 5. A successful attempt to break through the 100.0% Fibonacci level led to further growth of the British currency with targets located near the calculated 127.2% Fibonacci level. However, wave 5 still doesn't look complete. A successful attempt to break through the 127.2% Fibonacci level will indicate that the markets are ready for further purchases of the pound. Fundamental component: There was not a single important economic report in the UK this week, nevertheless, there was also little other news. Thus, the markets are still trading this instrument based on US statistics and news from this country. And this news is so bad that the US dollar has no chance to start growing. General conclusions and recommendations: The pound/dollar pair continues to build upward wave 5, nothing changes. Therefore, I recommend at this time to continue buying the instrument for each MACD signal "up" with targets located around the level of 1.3183, which equates to 127.2% Fibonacci. The material has been provided by InstaForex Company - www.instaforex.com |
| You are subscribed to email updates from Forex analysis review. To stop receiving these emails, you may unsubscribe now. | Email delivery powered by Google |
| Google, 1600 Amphitheatre Parkway, Mountain View, CA 94043, United States | |








No comments:
Post a Comment