Forex analysis review |
- Gold remains in bullish trend
- EURUSD remains inside triangle pattern
- GBPUSD pulls back but bulls can be back next week
- July 3, 2020 : EUR/USD Intraday technical analysis and trade recommendations.
- July 3, 2020 : GBP/USD Intraday technical analysis and trade recommendations.
- Dollar plunges despite good US employment report
- USD / CAD. Loonie plunges amid weak economic data
- Stock markets are disappointing in Europe, but rose in US and Asia
- Oil shows a negative correction: pressure from COVID-19 continues
- Brexit weighs on pound sterling
- Oil demand to return to pre-crisis level by 2022
- The dollar played on pessimism
- EUR/USD. July 3. COT report. The euro continues to mumble trading.
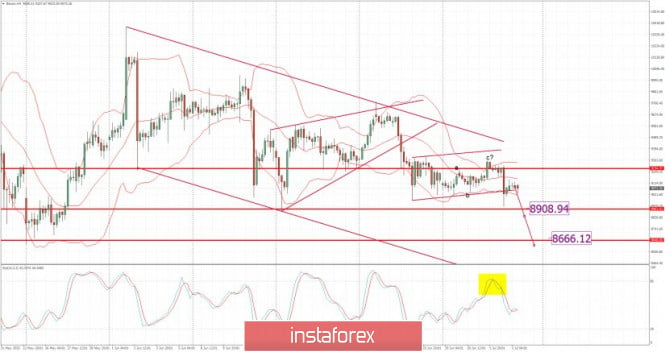
- BTC analysis for July 03,.2020 - The drop has started as I expected. Watch for bigger drop in the future towards the $8.666
- Trading recommendations for the EUR/USD pair on July 3, 2020.
- GBP/USD. July 3. COT report. The pound again aimed at 1.2358. Another failure in negotiations between London and Brussels
- Analysis of Gold for July 03,.2020 - Potential for the new upside leg due to strng upside trend in the background and rising
- EUR/USD analysis for July 03 2020 - Potential for the bigger drop towards the 1.1035
- Why emerging markets shocked by 2020?
- Trading plan for EUR/USD on July 3, 2020. COVID-19: infection rate continues to grow, but the number of deaths has decreased
- USD/CAD Showing Bullish Signs!
- EUR / USD: US unemployment report's impact on the pair's dynamics
- Can gold rise to $3,000?
- Trading idea for EUR/USD
- Technical analysis of AUD/USD for July 03, 2020
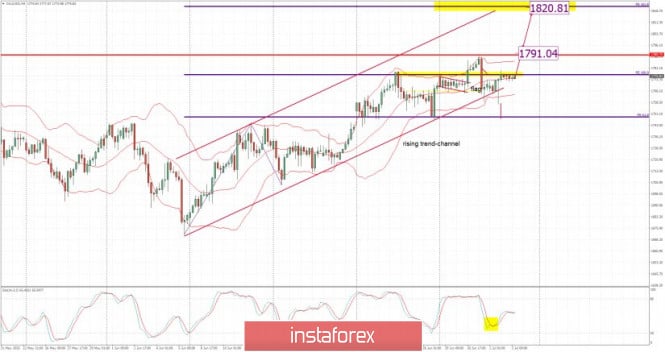
| Posted: 03 Jul 2020 10:22 AM PDT Gold price has pulled back as expected towards $1,750-60 area and is now moving back towards the recent highs at $1,780. Trend remains bullish as price is still inside the upward sloping channel and so far every time price challenges the lower channel boundary, bulls step in to push price back up.
Red lines - bullish channel Price continues to make higher highs and higher lows. The recent low at $1,757 did not break below $1,746 low made on June 26th. Price is holding inside the channel and has the potential to make a new higher high. The bearish divergence by the RSI warns bulls not to be overly optimistic. Yes trend remains bullish but bulls should also protect their gains by raising their stops. Any move below $1,758 would be considered a sign of weakness and could lead to a deeper correction. The material has been provided by InstaForex Company - www.instaforex.com |
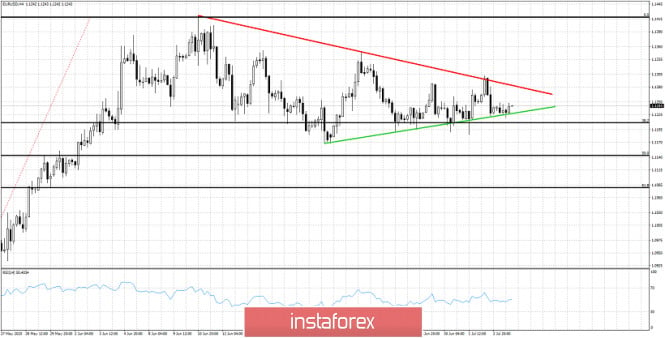
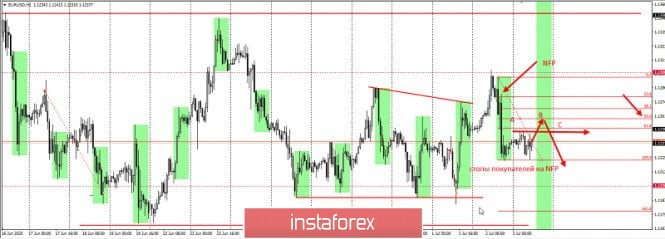
| EURUSD remains inside triangle pattern Posted: 03 Jul 2020 10:15 AM PDT EURUSD continues to respect the boundaries of the triangle pattern. More action is expected to be seen from Monday as the space inside the triangle is running out. As we explained in previous analysis, I believe the most probable outcome would be a break to the downside.
Red line - resistance Green line - support So far price respects the boundaries. If support at 1.1225-1.12 fails to hold, I expect price to move towards 1.11. If resistance at 1.1285-1.13 is broken, then 1.14 should be challenged. Longer-term view I have is to wait patiently for a move towards the 61.8% Fibonacci retracement at 1.1085. The material has been provided by InstaForex Company - www.instaforex.com |
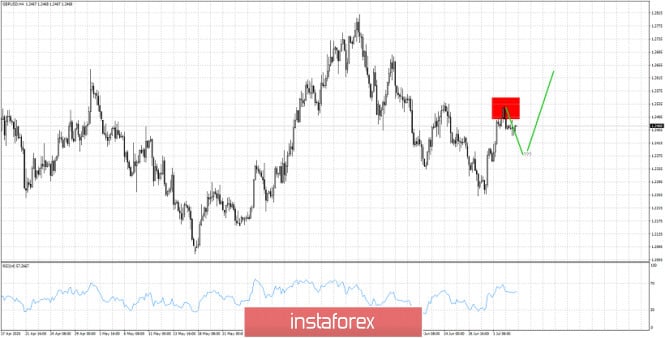
| GBPUSD pulls back but bulls can be back next week Posted: 03 Jul 2020 10:10 AM PDT GBPUSD had shown short-term overbought signs in the 4 hour chart and is pulling back after making a short-term top at 1.2522. Price is expected to form a higher low around 1.24 before the resumption of the up trend.
Red rectangle - resistance area Green lines - expected path GBPUSD has made a higher low at 1.2250 relative to the May low at 1.2075. This formation could unfold into a bigger leg higher that could eventually push price above 1.28. For this bullish scenario to come true, bulls need to start forming higher highs and higher lows. The last leg up from 1.2250 to 1.2525 is now under correction. This correction needs to provide a higher low around 1.24 in order to fuel the next leg higher. Our preferred strategy is to be bullish around 1.24, with stops at 1.2250 targeting a move above 1.2525 and most probably towards 1.2655. The material has been provided by InstaForex Company - www.instaforex.com |
| July 3, 2020 : EUR/USD Intraday technical analysis and trade recommendations. Posted: 03 Jul 2020 09:43 AM PDT
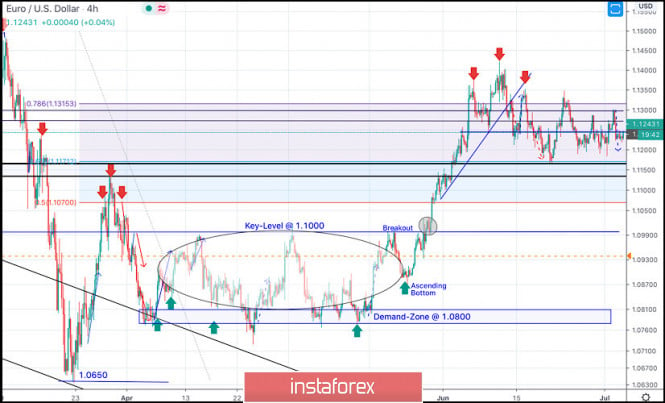
On March 20, the EURUSD pair has expressed remarkable bullish recovery around the newly-established bottom around 1.0650. Shortly after, a sideway consolidation range was established in the price range extending between 1.0770 - 1.1000. On May 14, evident signs of Bullish rejection as well as a recent ascending bottom have been manifested around the price zone of (1.0815 - 1.0775), which enhances the bullish side of the market in the short-term. Bullish breakout above 1.1000 has enhanced further bullish advancement towards 1.1175 (61.8% Fibonacci Level) then 1.1315 (78.6% Fibonacci Level) where bearish rejection was anticipated. Although the EUR/USD pair has temporarily expressed a bullish breakout above 1.1315 (78.6% Fibonacci Level), bearish rejection was being demonstrated in the period between June 10th- June 12th. This suggested a probable bearish reversal around the Recent Price Zone of (1.1270-1.1315) to be watched by Intraday traders. Hence, Bearish persistence below 1.1250-1.1240 (Head & Shoulders Pattern neckline) was needed to confirm the pattern & to enhance further bearish decline towards 1.1150. Moreover, bearish breakdown below the depicted keyzone around 1.1150 is mandatory to ensure further bearish decline towards 1.1070 and 1.0990 if enough bearish pressure is maintained. Trade recommendations : The current bullish movement towards the price zone around 1.1300-1.1330 (recently-established supply zone) should be followed by Intraday Traders as a valid SELL Signal.T/P levels to be located around 1.1175 then 1.1100 while S/L to be placed above 1.1350 to offset the associated risk. The material has been provided by InstaForex Company - www.instaforex.com |
| July 3, 2020 : GBP/USD Intraday technical analysis and trade recommendations. Posted: 03 Jul 2020 09:13 AM PDT
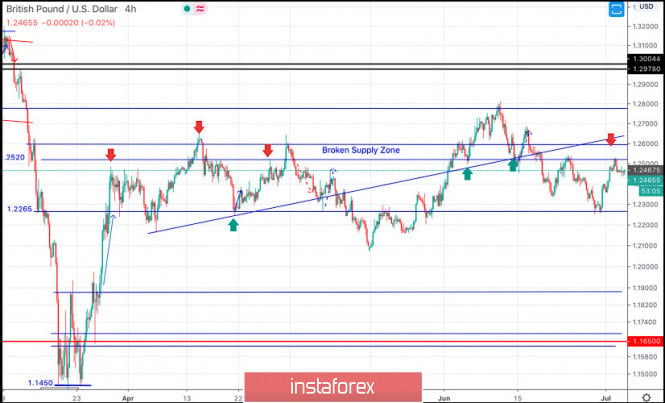
Recently, Bullish breakout above 1.2265 has enhanced many bullish movements up to the price levels of 1.2520-1.2590 where temporary bearish rejection as well as a sideway consolidation range were established (In the period between March 27- May 12). Shortly after, transient bearish breakout below 1.2265 (Consolidation Range Lower Limit) was demonstrated in the period between May 13 - May 26. However, immediate bullish rebound has been expressed around the price level of 1.2080. This brought the GBPUSD back above the depicted price zone of 1.2520-1.2600 which failed to offer sufficient bearish rejection. Hence, short-term technical outlook has turned into bullish, further bullish advancement was expressed towards 1.2780 (Previous Key-Level) where signs of bearish rejection were expressed. Short-term bearish pullback was expressed, initial bearish destination was located around 1.2600 and 1.2520. Moreover, a bearish Head & Shoulders pattern (with potential bearish target around 12265) was recently demonstrated on the chart. That's why, bearish persistence below 1.2500 ( neckline of the reversal pattern ) pauses the bullish outlook for sometime and should be considered as an early exit signal for short-term buyers. Any bullish pullback towards 1.2520-1.2550 (recent supply zone) should be watched by Intraday traders for a valid SELL Entry. Trade recommendations : Intraday traders can wait for the current bullish pullback towards 1.2520-1.2550 (recent supply zone) for another valid SELL Entry. S/L should be placed above 1.2600 while T/P level to be located around 1.2450 & 1.2265. The material has been provided by InstaForex Company - www.instaforex.com |
| Dollar plunges despite good US employment report Posted: 03 Jul 2020 07:16 AM PDT
This morning, the greenback was in a narrow corridor, which is facing multidirectional pressure. So, on the one hand, total sales have become less due to the weekend in the United States for tomorrow's holiday. On the other hand, the number of people infected with coronavirus infection continues to grow rapidly. And finally, the positive influence comes from the good statistics, which was published the day before. The index of the greenback in relation to a basket of six major currencies of the world showed a decrease of 0.1%, which moved this figure to 97.203. The dollar has changed its position with respect to the euro where quotes remained at $1.1249 per euro. The pound sterling, on the other hand, strengthened a little by 0.1% and began to cost $1.2477 per pound. Japanese yen was also not marked by significant dynamics and maintained its position at 107.50 yen per dollar. Meanwhile, aussie has not changed much in relation to the dollar, demonstrating stability, which is also good. In the morning, it was around $0.6929 per aussie. Although there is no growth, there is confirmed data on the restoration of the level of retail sales to the level that was recorded in May of this year. Today, the kiwi was worth $ 0.6518 per Qiwi. Strong statistics from China, which was released this morning, put pressure on the foreign exchange market. It particularly became the reason for the reduction of the greenback in relation to the Chinese yuan by 0.1%. Thus, the value of the dollar reached 7.0606 yuan. If we take into account the fact that the labor market and the unemployment rate in the United States of America showed excellent dynamics, and activity in the manufacturing sector also turned out to be on top, it is worth noting that the world's first economy is rapidly recovering its lost positions. This means that the planned incentive policy, the basis of which was to receive new portions of banknotes issued by fiscal authorities, still gives certain results. This means that the extent of this strengthening is not yet clear. However, one thing is clear today: the active printing of money, which the Federal Reserve launched, has become a fulcrum for the correlation between risky assets and the US national currency. Until the US government stops the printing press and asset buybacks, investors will continue to show interest in the risk sector. Most analysts believe that the emerging trend is unlikely to change in the near future and will remain dominant for at least several quarters. Not so fast economic growth, in turn, will also make the greenback sag even further. There are real concerns about the slowdown in economic recovery. Coronavirus infection continues to spread rapidly throughout the state, which can lead to the second wave of a pandemic and, as a result, a new restrictive policy. Recall that yesterday the United States recorded more than 52 new cases of COVID-19. The material has been provided by InstaForex Company - www.instaforex.com |
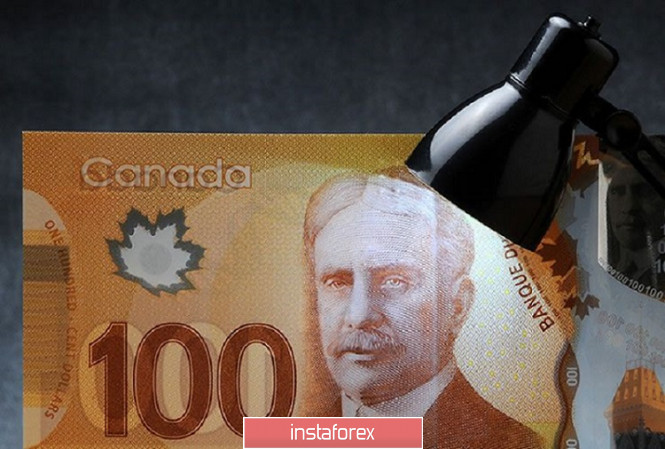
| USD / CAD. Loonie plunges amid weak economic data Posted: 03 Jul 2020 06:47 AM PDT
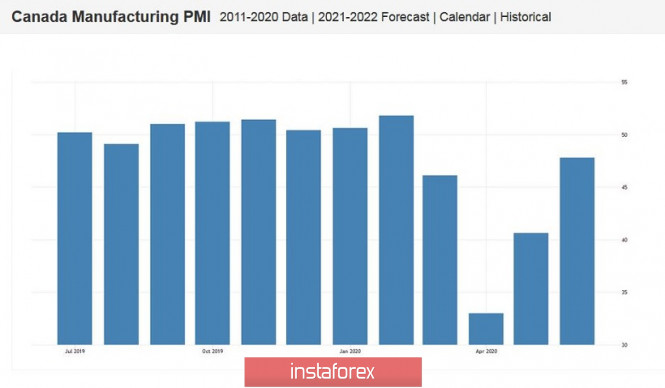
At first glance, the reaction of loonie to the published data seems illogical. After all, the April figures reflected a record decline in the Canadian economy in the entire history of observations. Canada's GDP fell in April by 11.6%, while in March a decrease of 7.5% was recorded (the indicator was revised downward from -7.2%). In annual terms, the key indicator collapsed by 17.1% (which was in line with the expectations of most experts), while in March the annual indicator fell by 5.8%. The main spheres of the economy showed the most negative dynamics. The manufacturing sector decreased by 22.5%, the construction sector by 22.9%, and the retail sector by 23%. But all these disastrous figures were ignored by the market. Moreover, after a failed release, the USD/CAD pair moved downward, and impulse decreased to the area of the 35th figure, where it remains until now. In my opinion, traders have shifted their focus from April data to more distant prospects. The fact is that preliminary data for May were published on the same date of release. According to these estimates, GDP growth of 3% in May will be recorded in monthly terms. Given the unprecedented coronavirus crisis, many traders were ready to see a record decline in the Canadian economy in April, especially since this release was published after similar releases in other major countries of the world. Investors are now primarily interested in the dynamics of recovery. As preliminary, as well as indirect (but more operational) indicators show, that the Canadian economy is already recovering. For example, manufacturing PMI rose in June to 47.8 points. And although this indicator has not crossed the key 50-point mark, the dynamics itself speaks of positive trends (in May, the PMI reached 40.6 points). The component of new orders (45.5 points from the previous value of 37.9 points) and the employment component also increased. It is worth noting that this indicator came out at almost the same level as a year ago. In June 2019, it amounted to 49.2 points. Considering the prospects of the USD/CAD pair, it is necessary to recall the results of the last meeting of the Bank of Canada. The rhetoric of the accompanying statement was quite optimistic and was in favor of the loonie. First, the Central Bank said that the negative impact of the pandemic has peaked, although the process of global economic recovery will be slower than earlier forecasts. Secondly, regulator members recognized that the Canadian economy seems to have managed to avoid the worst-case scenario - that is, the scenario that was announced in the bank's monetary policy report in April. Well, the Central Bank published a forecast regarding the growth of the Canadian economy in the third quarter. According to the regulator's members, a sharp economic growth will follow in the second half of the year, "especially if the oil market continues to show positive dynamics".
The oil market is really showing good dynamics. A decrease in commercial stocks of raw materials in the United States, as well as a recovery in demand from China, are supporting oil prices. The "black gold" market reacts quite nervously to the theme of coronavirus (especially against the background of an increase in daily cases of Covid-19 infection in the world), but in general quotes "stay afloat" - Brent in the range of 40–42 dollars per barrel, WTI - $ 30– 40 per barrel. Uncertain positions of the US dollar also contributed, adding to the overall fundamental picture for the pair. Even yesterday's Nonpharma, which by and large turned out to be quite good, did not help the pair's bulls. After an impulse surge to the level of 1.3615, the price again returned to the area of the frame of the 35th figure. All this suggests that the greenback today is not able to organize its own offensive - at least in relation to the loonie. Thus, the fundamental background helps to further reduce the USD/CAD pair. True, for this, the bears need to gain a foothold below 1.3550, where the middle line of the BB indicator on the daily chart passes. Now the price is slightly higher, so sales look somewhat risky. But as soon as the pair falls below the indicated target, it will be possible to consider short positions with the main target at around 1.3410 - this is a three-week price low that coincides with the lower line of the Bollinger Bands indicator on D1. The material has been provided by InstaForex Company - www.instaforex.com |
| Stock markets are disappointing in Europe, but rose in US and Asia Posted: 03 Jul 2020 06:30 AM PDT
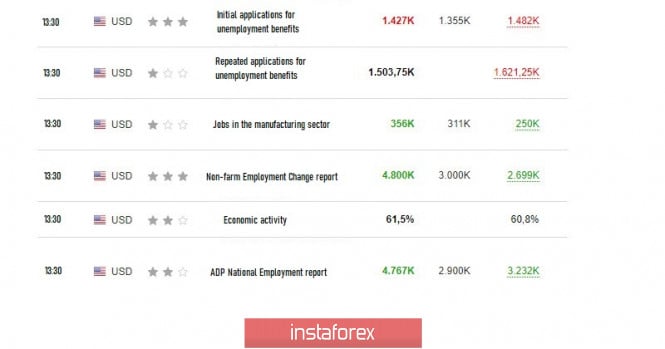
US stock markets showed good growth towards the close of trading yesterday. The reason for the positive was statistics regarding the employment market in the country. It came out much better than what the experts expected in their preliminary forecasts. Yesterday, one day earlier, statistics released by the US Department of Labor came out due to the holiday. As it became known, there were significantly more jobs in the country in June of this year. A record increase in this indicator was noted (immediately by 4.8 million). The unemployment rate in the state also declined sharply (to the level of 11.1%), while the rate in April of this year was at the maximum level of 14.7%. Analysts' preliminary forecasts were much more fair. They assumed that there would be an increase in the number of jobs, but no more than 3 million. Preliminary data on unemployment also reflected its reduction to the level of 12.3%. The total number of Americans who first applied for unemployment benefits last week declined by 55,000: the current level of this indicator is 1,427 million. This also did not coincide with the forecasts of experts who expected a decline to 1,355 million people. Of course, such good numbers inspired investors in the market. On the contrary, the trade deficit of the United States of America showed an increase. In May of this year, it reached a level of $ 54.6 billion, while it amounted to $ 49.8 billion according to revised April data, which was the highest value in almost two years. Preliminary expert surveys also reflected an increase in the indicator, only it should have become less significant - minus $ 53 billion. Thus, it became a problem of very good statistics on the American economy. The number of orders of industrial enterprises in the country has increased by 8%. It can be recalled that previously, a significant decline was recorded (by 13.5% in April and 11% in March). Thus, this was the first growth in the last three months. The change of vector could not go unnoticed by market participants who took this news very positively. Meanwhile, this rise is due to the lifting of quarantine measures in the US states. The current epidemiological situation in the country makes us think about the need to return to restrictions, which will be followed by a decline in the number of orders of enterprises, as was already the case during the first wave of the pandemic. Today, most analysts warn that, despite the general positive picture, the labor market and other sectors of the economy will not recover at a very fast pace: it will take a lot of time to fully return to normal functioning. Moreover, the emerging second wave of the disease may worsen the already difficult situation. Even more people may lose their job which is their only source of income. The Dow Jones Industrial Average index during yesterday's closing of trading was higher by 0.36%, or 92.39 points, which sent it to the level of 22 827.36 points. The Standard & Poor's 500 index followed a positive trend and rose 0.45% or 14.15 points. Its level was in the region of 3 130.01 points. Nasdaq Composite Index showed the best dynamics - plus 0.52%, or 53 points. It managed to complete the trading session with record levels of 10 207.63 points again, but it has not yet reached his maximum, which is located at 10 310.36 points. Over the past week, US indices have shown good growth. So, the Dow Jones rose by 3.3%, the S&P 500 rose by 4%, and the leader was Nasdaq, which managed to rise by 4.6%. This morning, stock markets in the Asia-Pacific region playback yesterday's generally good statistics from America, as well as their own data on economic growth, which turned out to be very encouraging. Positivity in the market was supported by data from China. Japan's Nikkei 225 Index is up by 0.45%. China's Shanghai Composite Index rose 1.26% in the morning. In turn, Hong Kong's Hang Seng Index climbed slightly less - 0.83%. The Kospi South Korea index also gained positivity this morning (0.67%). Australia's S&P/ASX 200 Index climbed 0.33%. Positive statistics from China's territory inspired market participants no less than good data on the US economy. Thus, the PMI index in the Chinese services sector jumped sharply for the first month of summer, being able to reach its highest levels over the past ten years. The thing is that the same sharp jump in demand occurred after the gradual elimination of the restrictions associated with the COVID-19 pandemic. The indicator reached the mark of 58.4 points. It can be recalled that it was also at a high level of 55 points in May of this year, and now has updated its maximum. If the indicator rises above 50 points, this becomes evidence of a sharp increase in business activity in this area. The general index of business activity in China in June also turned out to be on top: it was able to reach 55.7 points, which is also the highest value over the past ten years. In the previous period (in May), its level was in the region of 54.5 points. All this positivity was able to overshadow a continuous series of negative emotions associated with the active growth in the number of people infected with coronavirus infection both in the United States and the whole world in general. Today, stock markets in Europe are separated from the positive trend of America and Asia and began to notice a predominantly decline. The reason for the negative phenomenon here was the same notorious possibility of a second wave of the coronavirus pandemic, which seriously frightened the local investors. The general index of enterprises in the European region of Stoxx Europe 600 showed a slight decline of 0.09% in the morning. Now, its level is within 367.95 points. On the other hand, the UK FTSE 100 index declined by 0.37%. The French CAC index also fell by 0.22%, and Italy's FTSE MIB Index fell 0.36%. The largest decline was recorded in Spain's IBEX 35 index, which declined by 0.65%. But the German DAX index became the only one that went against the negative trend of this morning and became slightly higher - by 0.1%. The main attention of participants in European markets is focused on the number of people infected with COVID-19 in America. It is growing rapidly, as well as the fears of investors, which are dragging the global decline of the main indicators. Meanwhile, analysts say that this is a temporary phenomenon, since there are more positive factors and they will soon take effect. The material has been provided by InstaForex Company - www.instaforex.com |
| Oil shows a negative correction: pressure from COVID-19 continues Posted: 03 Jul 2020 06:30 AM PDT
The price of crude oil turned to negative dynamics this morning, which is primarily due to the level of demand for black gold, which could suffer significantly due to the increase in the number of people infected with coronavirus infection in the United States and the world as a whole. The pandemic is increasing its pace, so investors have justifiable concerns about continued demand for raw materials. Therefore, reintroduction of quarantine restrictive measures will be likely. The number of cases of COVID-19 in America is growing rapidly. There are now already 50 thousand more. What's particularly dangerous is the fact that cases of infection are detected again in fairly densely populated states located in the south of the country. They are the largest consumers of crude oil in the country. Of course, new outbreaks will seriously affect the level of demand, and the introduction of quarantine can completely undermine it completely. It becomes clear that the black gold market is still playing a very strong role in the incidence of coronavirus infection. This is perhaps one of the most significant factors in pressure on oil. The cost of crude oil is very negative about the potential risk of a new quarantine, which could be disastrous for it. According to statistics provided by Baker Hughes, the number of operating oil producing stations in the United States of America has declined again a little earlier than usual. The total number decreased by three units in the previous week. Now, there are only 185 operating plants for the extraction of raw materials. It can be recalled that their number was much larger - 788 units over the same period last year. Of course, such news supported the market a little, but this support was not enough for the positive dynamics of the price. The good news for the oil market has come from OPEC. As it became known, the organization reduced the export of oil by 1.84 million barrels per day in the first month of summer. Thus, the total volume of exports in the member countries of the organization was at the level of 17.2 million barrels per day. At the same time, Saudi Arabia managed to achieve the largest indicators for reducing exports: the decline amounted to 979 thousand barrels per day. Another state that is not a member of OPEC has also announced a decline in the supply of raw materials to the world market. This country has become Oman, which plans to reduce exports by 161 thousand barrels per day. The total volume of oil exported by him to the market is not too large - only 1%, but this decline has already pleased investors. Oman has fully complied with its obligations to reduce oil production. Even earlier, the UAE also warned its direct customers that it was reducing its supply by about 5% in August this year. At the same time, all grades of oil raw materials that are extracted on the territory of the state will be reduced. The price of Brent crude oil futures for delivery in September declined by 1.11%, or 0.46 dollars on a trading floor in London this morning, which pushed them to the mark of 42.66 dollars per barrel. It can be noted that yesterday's trading ended with a growth of 2.6%, or 1.11 dollars, and the closing price was at the level of 43.14 dollars per barrel. So far, the decline, of course, has not allowed to lose all the advantage gained, but there is still a whole trading day ahead of the weekend. The price of WTI crude oil futures for delivery in August on a trading floor in New York also underwent a negative correction. The morning drop was already 1.11%, or 0.45 dollars. Thus, its value declined to the level of $ 40.20 per barrel, but has not yet stepped over the strategically important line of $ 40 per barrel. At the close of yesterday's trading, the oil brand climbed 2.1%, or 0.83 dollars, and the price stopped at 40.65 dollars per barrel. Today, trading on the NYMEX site does not take place, since it is a holiday in the United States of America. The material has been provided by InstaForex Company - www.instaforex.com |
| Brexit weighs on pound sterling Posted: 03 Jul 2020 06:16 AM PDT
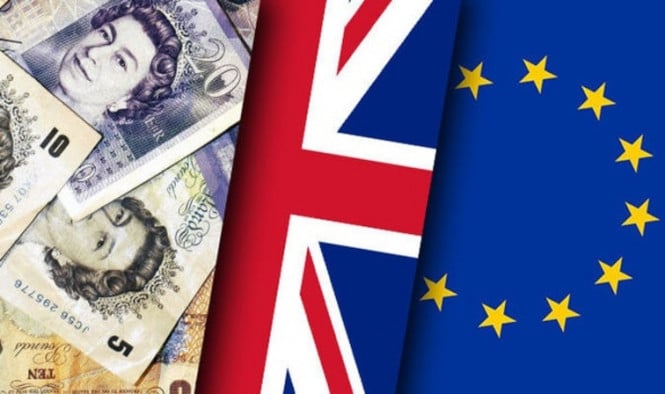
All countries are suffering the COVID-19 consequences. Despite the fact that it is a global problem, the pandemic is considered to be a temporary phenomenon. In the UK, the lockdown caused a 20% drop in GDP, but this did not greatly affect the British currency. As new cases of coronavirus are rising again, traders are losing their appetite for risk assets. Therefore, central banks and governments are ready to provide stimulus. At the same time, markets rely on scientists who will develop the vaccine. According to Standard Chartered analysts, Brexit has a significant impact on the pound sterling. They consider the British pound vulnerable to the UK's withdrawal from the EU without a deal. The pound may rise to the level of 1.40. Experts also believe that a compromise on the Brexit issue will be more profitable. The material has been provided by InstaForex Company - www.instaforex.com |
| Oil demand to return to pre-crisis level by 2022 Posted: 03 Jul 2020 06:11 AM PDT
The coronavirus pandemic has severely damaged the global economy. Oil demand has fallen significantly due to the global isolation. However, many countries are lifting the quarantine measures and demand is growing slowly. According to Goldman Sachs experts, international flights, car trips, and increased government spending on infrastructure will help oil demand to return to pre-crisis levels by 2022. Oil demand is expected to fall by 8% this year. In the following year it would grow by 6%. And in 2022, demand would return to the level that was before the COVID-19 spread around the world. The Bank said that demand is recovering thanks to the lifting of restrictions in many countries. However, the required level is still far away. Experts have suggested that gasoline demand will revive faster than other petroleum products. Demand for jet fuel will not recover soon, because people will refrain from traveling until a vaccine appears or the virus is defeated. Meanwhile, the latest news is not good for the markets. In the US, the number of new infected people is growing rapidly. The threat of a second wave of coronavirus, which will easily nullify the demand recovery, has hung in the world. Brent crude oil rose in price by 0.10% to $42.07 per barrel. WTI crude is trading at $39.80 a barrel. The material has been provided by InstaForex Company - www.instaforex.com |
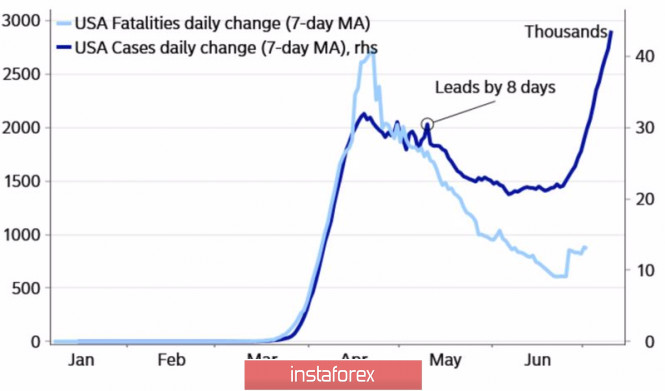
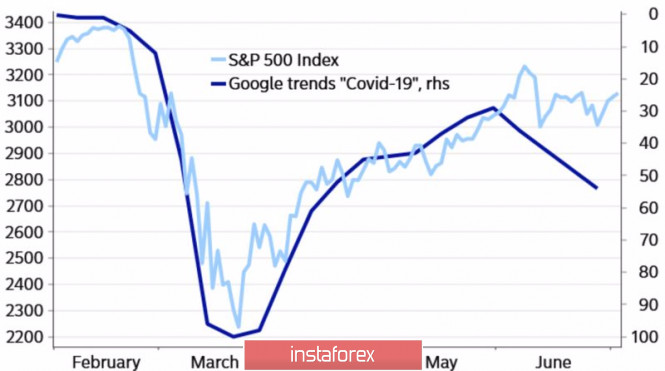
| The dollar played on pessimism Posted: 03 Jul 2020 04:49 AM PDT The report on the state of the American labor market for June gave plenty of food for thought, and the US independence Day – time to digest everything properly. If earlier the market was dominated by the idea of a V-shaped recovery of the world economy, which gave grounds for buying risky assets, now the principle of "tomorrow everything will be better than today" should be put on the back burner. Rather, on the contrary, the deterioration of the epidemiological situation in the United States suggests that tomorrow will be worse than today. It's time to adjust investment ideas, stop zealously getting rid of safe-haven assets. At first glance, the strengthening of the US dollar in response to the best increase in employment outside the agricultural sector (+4.8 million) since records began in 1939 looks illogical. Strong statistics should have led to the growth of stock indices and weakened the position of the "American", which is in reverse correlation with them. However, investors are well aware that the good news is likely to end in June. The faster people return to work, the more COVID-19 infections, and the worse the labor market will be in July and August. It is too early to sell the dollar, which was proved by the rebound of EUR/USD from the resistance at 1.128-1.129. The S&P 500 is still holding near 4-week highs, even though a record increase in the number of detected daily infections in the US. The indicator exceeded the psychologically important mark of 50,000, however, the death rate is still not growing, but most likely it will begin to do so within the next 6-10 days. As a result, there will be a new surge of interest in the topic of COVID-19 on the internet, and the growth in the number of queries on this topic in the Google search engine has a close connection with the American stock market. Correction of stock indices is becoming more likely and a pullback in the EUR/USD pair comes with it. Dynamics of the number of infected and dead from COVID-19 in the United States
Dynamics of the S&P 500 and Google search queries COVID-19
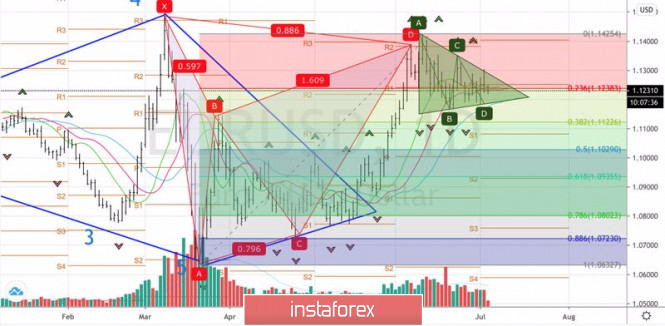
Still, the S&P 500's fall to the March bottom looks extremely doubtful. A large-scale monetary stimulus from the Fed and progress in the process of creating and testing coronavirus vaccines will not allow the stock market to sink too deep. Therefore, the upward trend for both it and the euro remains in force, and the fall in these assets will allow us to buy them cheaper. Especially since the German Parliament accepted the ECB's proposed justification for the feasibility and effectiveness of QE and allowed the Bundesbank to continue participating in the quantitative easing program. The conflict with the constitutional court from Karlsruhe seems to be over, there is little doubt that the EU will approve a large-scale fiscal stimulus, and a faster recovery of the European economy compared to the US will certainly play for the euro in the future. Technically, a triangle was formed on the daily EUR/USD chart. The pair's quotes going beyond its lower limit, which suggests a test of support at 1.119 and 1.117, will increase the risks of a correction to 1.112 and 1.108, where the euro makes sense to buy. EUR/USD, the daily chart
|
| EUR/USD. July 3. COT report. The euro continues to mumble trading. Posted: 03 Jul 2020 04:46 AM PDT EUR/USD – 1H.
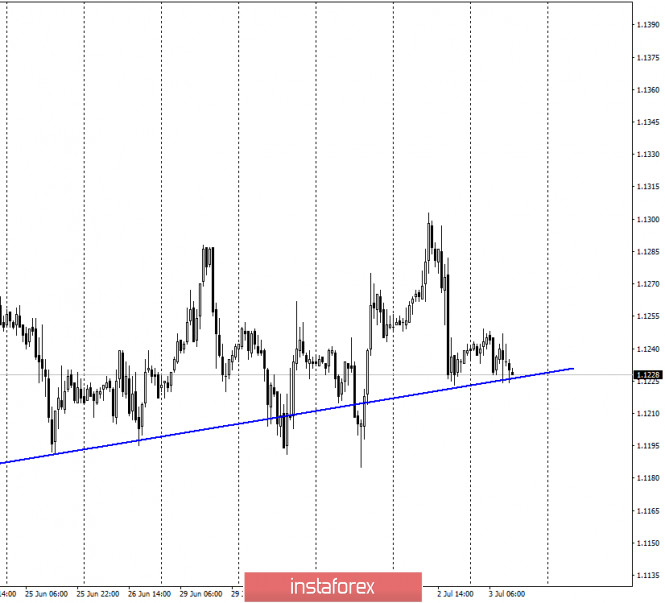
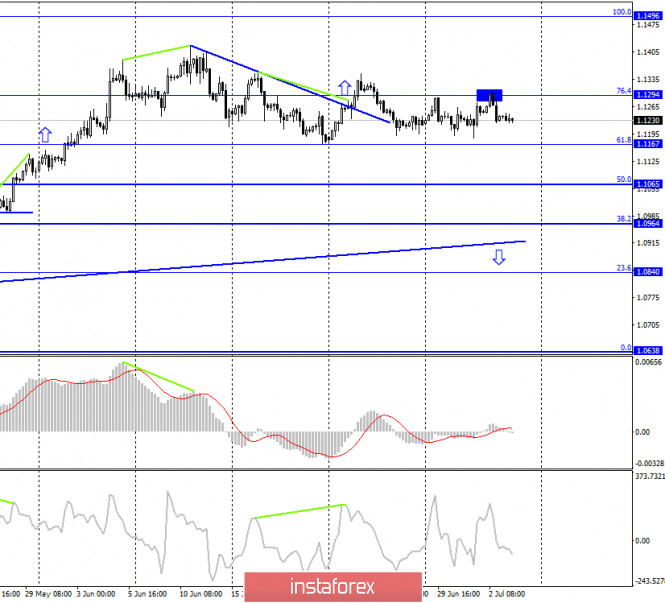
Hello, traders! The euro/dollar pair made another attempt to close under the upward trend line on July 2. However, at the same time, it continues to trade above this line, so the overall mood of traders continues to be "bullish". In the event of a pullback of quotes from the trend line, the growth process can be resumed. I recommend setting goals on the higher charts. By and large, the pair is still trading in a narrow side corridor. Traders are still afraid to buy the US currency, as the coronavirus has become active again in the US and records for diseases are updated daily. Some states have re-introduced quarantine measures, and all this threatens a new "lockdown" and a new blow to the economy. EUR/USD – 4H.
On the 4-hour chart, the quotes of the euro/dollar pair performed an increase to the corrective level of 76.4% (1.1294), rebounding from it and turning in favor of the US currency. Thus, the process of falling quotes can be continued in the direction of the corrective level of 61.8% (1.1167). At the same time, to expect a convenient movement for work, it is necessary just for the pair to get out of the side corridor, limited by the levels of 1.1294 and 1.1167. Today, the divergence is not observed in any indicator. EUR/USD – Daily.
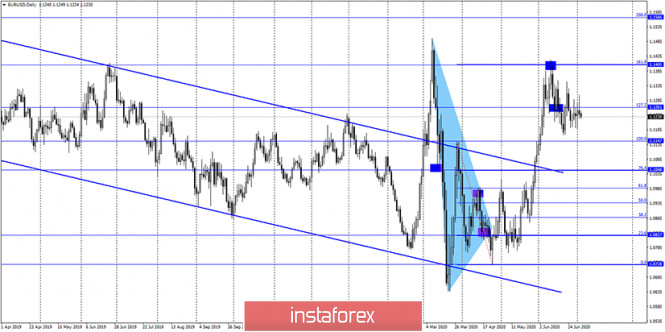
On the daily chart, the euro/dollar pair again performed a reversal in favor of the US currency and closed under the corrective level of 127.2% (1.1261), which allows traders to expect a continued fall in the direction of the Fibo level of 100.0% (1.1147). EUR/USD – Weekly.
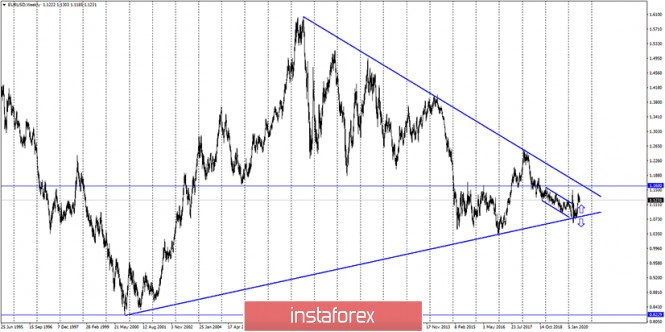
On the weekly chart, the euro/dollar pair rebounded from the lower line of the "narrowing triangle", which still allows traders to expect growth in the direction of the 1.1600 level (the upper line of the "triangle"). However, the lower charts are now in a more bearish mood, so working out this goal is being postponed for now. Overview of fundamentals: On July 2, the European Union released the unemployment rate for May, which rose to 7.4%. In America, the unemployment rate fell to 11.1%, average hourly earnings rose by 5%, and the number of people employed in the non-agricultural sector was 4.8 million in June. In general, the US statistics were quite good, however, this did not help the dollar in any way. News calendar for the United States and the European Union: EU - index of business activity in the service sector (08:00 GMT). On July 3, the EU will release only the index of business activity in the service sector, which is unlikely to interest traders. In America, today is a holiday due to Independence Day, which will be celebrated tomorrow. COT (Commitments of Traders) report:
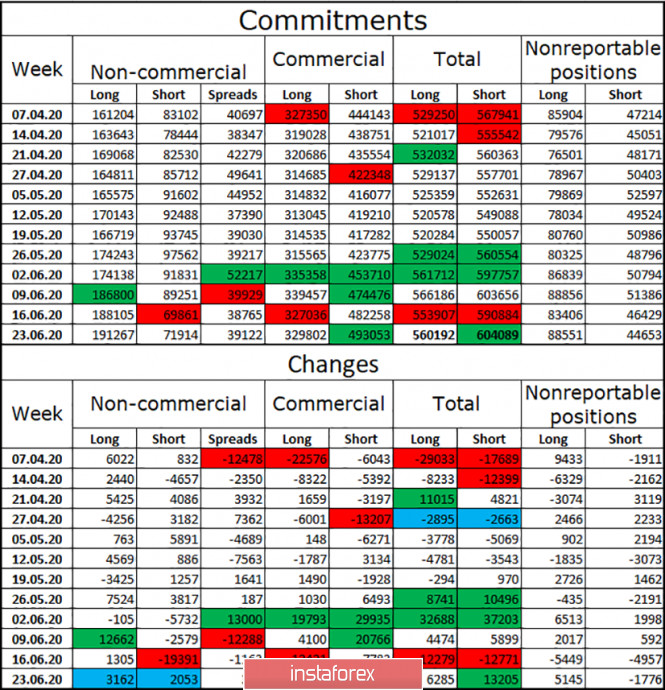
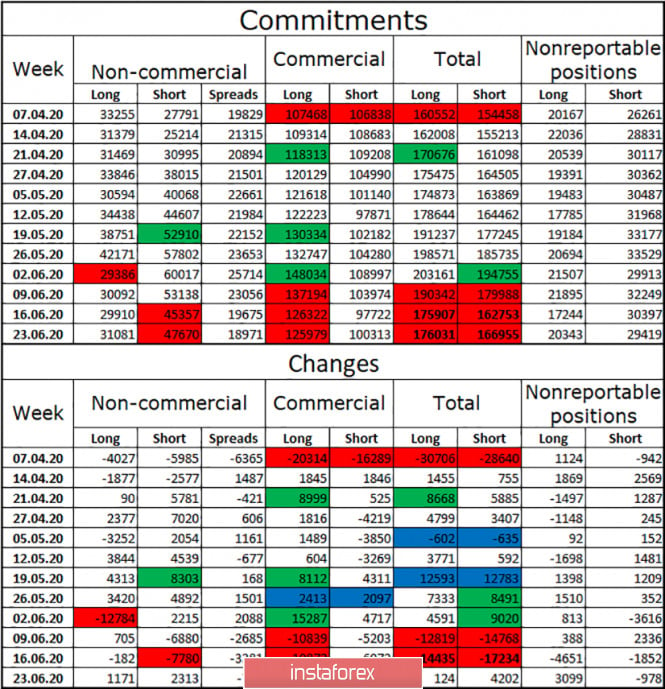
The latest COT report, released last Friday, showed almost nothing. The "Non-commercial" group, which is the most important group, and is considered to be the one that drives the market, has opened a total of only 5,000 contracts, of which 3,000 are long and 2,000 are short. The "Commercial" group (hedgers) were more active and opened almost 11,000 short-contracts, however, as we can see, in the period from June 17 to 23, the euro/dollar pair was trading first down, then up, then down again. In other words, it is impossible to conclude that the mood of traders during this period of time was the same and did not change. And the changes in the balance of forces that the latest COT report showed do not allow us to draw any conclusions for the long term. Forecast for EUR/USD and recommendations to traders: Today, I recommend buying the euro currency with the goal of 1.1496, if the close is made above the correction level of 76.4% (1.1294). It is more reasonable to sell the pair now with the target level of 61.8% (1.1167), since the rebound from the level of 1.1294 was performed. Terms: "Non-commercial" - major market players: banks, hedge funds, investment funds, private, large investors. "Commercial" - commercial enterprises, firms, banks, corporations, companies that buy currency, not for speculative profit, but to ensure current activities or export-import operations. "Non-reportable positions" - small traders who do not have a significant impact on the price. The material has been provided by InstaForex Company - www.instaforex.com |
| Posted: 03 Jul 2020 04:45 AM PDT Corona virus summary:
Cases of coronavirus are surging in South Africa, exactly a month after the country lifted most of the restrictions brought in with one of the world's strictest lockdowns, writes Jason Burke, the Guardian's Africa correspondent. On Thursday, authorities reported the country's biggest single-day jump in corona-virus cases, adding 8,728 confirmed infections and taking the total count to 168,061. Technical analysis: BTC has been trading downwards as I expected. BTC finally broken the bear flag pattern and completed the ABC upward correction. I see more downside movement yet to come. Trading recommendation: Watch for selling opportunities on the rallies with the targets at $8,900 and $8,666 Stochastic oscillator is showing fresh new bear cross, which is another indication of the selling continuation. Downward targets are set at $8,900, $8,666 and $8,170 The material has been provided by InstaForex Company - www.instaforex.com |
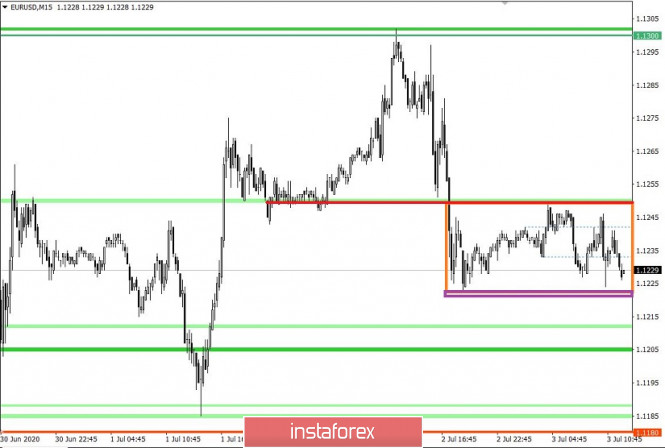
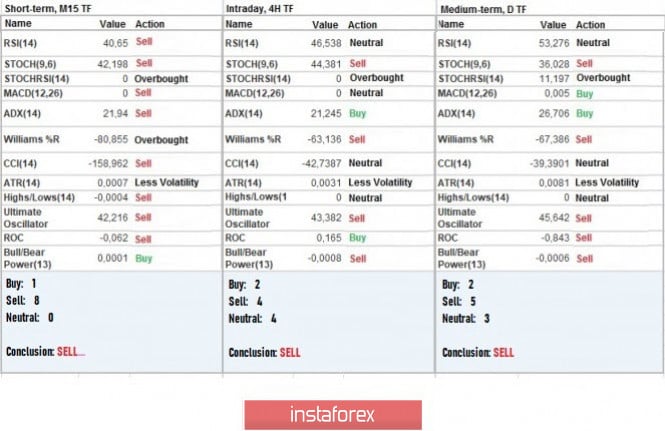
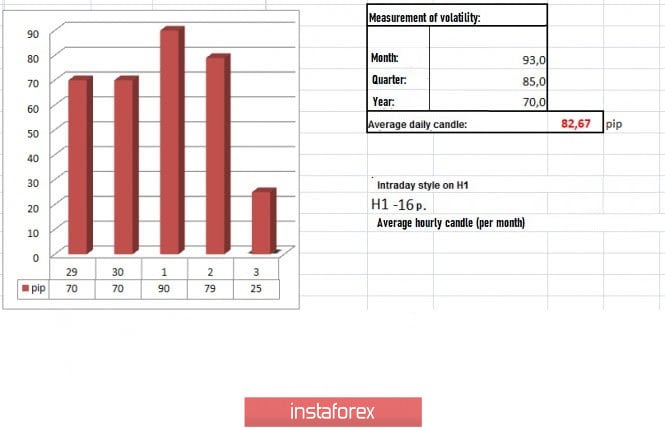
| Trading recommendations for the EUR/USD pair on July 3, 2020. Posted: 03 Jul 2020 04:44 AM PDT Using complex analysis, we can see that the quotes underwent a local acceleration, which was expected in the market. The current trading week is coming to an end. Looking back at it, we can see the horizontal course of the prices, in which the range level 1.1180 [1.1165 // 1.1180 // 1.1190] plays an integral role of support in the current price fluctuation. For as many as four times a week, the quote underwent pressure as soon as it approached the borders of the range. But, market participants reversed their positions, which put the quote into a pullback and made the 1.1300 / 1.1350 area become a variable resistance level. This hindered the rollback from developing into something more. With regards to the downward tact observed on June 11, a recovery occurred, during which the quotes reached the level of 1.1180 [June 19]. Afterwards, they began to bounce from the area of 1.1180, which resulted to the loss of trading volumes and led to the formation of variable fluctuations and emergence of a new movement - horizontal. Nevertheless, it is still unclear whether this fluctuation will become the future range of 1.1180 // 1.1300 // 1.1440 (1.1500). There are signs pointing to it, but the conditions for development are not enough. If we compare it with the movement on the GBP / USD pair, we will see a downward tact whose structure has not been violated. This suggests that if the downward trend in the pound remains, then the downward trend in the EUR / USD pair will prevail as well. Thus, to form the range 1.1180 // 1.1300 // 1.1440 (1.1500), a number of technical factors is needed in order to set the mood for the market. Analyzing the trading conducted yesterday in detail, we can see that a round of short positions arose at 10:00 (UTC + 1), during which the quotes were able to touch the level of 1.1300. The main bursts of activity started at the beginning of the American session, coinciding with the time that important news were published. The most remarkable moment was the accumulation of quotes, which started at 17:00 (UTC + 1). With regards to volatility, a value close to the daily average was recorded, which indicates the intense movement of quotes yesterday. As discussed in the previous review, traders considered the level of 1.1300 as a resistance and the news as a lever to strengthen the US dollar, which ultimately led to profitable deals. Analyzing the trading chart in general terms (the daily period), we can see the last five candles are "Doji", which indicates instability and the possible occurrence of impulse movement. In the event of damage, a radical change awaits us relative to the existing fluctuation. The news published yesterday contained reports on the US labor market, which greatly pleased traders and inspired brighter prospects for the future. According to the data, the unemployment rate fell from 13.3% to 11.1% in June, better than the forecast of 12.3%. Jobs outside of agriculture increased by 4,800,000, much higher than the forecast of 2,509,000. Market reaction to such good data strengthened the US dollar. As for weekly applications for unemployment benefits in the US, initial applications decreased from 1,482,000 to 1,427,000, while repeated applications increased from 19,231,000 to 19,290,000. With such improving figues, US President Donald said that the US economy is rapidly recovering from its losses during the coronavirus pandemic. "The US economy recorded almost 5 million new jobs in June, which exceeded all expectations. This is the most significant increase in the history of our country, "Trump said. At the same time, the head of the Washington administration noted that there were no similar results for the third quarter in history, which is an excellent indicator, especially before the elections. "Voters will be able to see our effective work. The fourth quarter will also be incredibly good, and the next year will be completely historic. " Today, the final data on business activity in Europe was published, in which according to the report, the index for the services sector recorded growth from 30.5 to 48.3, and the composite PMI grew from 31.9 to 48.5. Market reaction to these was negligible. The United States is on a holiday today, in celebration to the country Independence Day. It will definitely affect today's trading volumes. The upcoming trading week is not as busy as this current week. The main stimulus for price jumps will be the external news, coupled with a number of speculative jumps due to unstable market sentiment. Below are the most important events for next week: Monday, July 6 (UTC + 1) EU 10:00 - Retail sales (May) US 15:00 - ISM business activity index for the services sector (July) Tuesday July 7 US 15:00 - JOLTS (May) Thursday, July 9 US 13:30 - Applications for unemployment benefits Friday, July 10 US 13:30 - Producer Price Index (June) Further development Analyzing the current trading chart, we can see that the quotes underwent an accumulation at 1.1225 / 1.1250 yesterday, in which the level of 1.1250 became the upper limit of the range. Such a fluctuation is just temporary, thus, if the downward move observed yesterday continues in the market, the quotes will decline to the level 1.1180 [1.1165 // 1.1180 // 1.1190]. If the quotes consolidate lower than 1.1220, the pair will move towards the level 1.1190 / 1.1180, where we should be extremely careful because a rebound could happen especially if the quotes consolidate lower than 1.1165. An alternative scenario will happen if the quotes consolidate instead above the mirror level 1.1250, which will lead to a price move in the direction of 1.1280–1.1300. Indicator analysis Analyzing the different sectors of time frames (TF), we can see that the indicators of technical instruments in the minute, hour and day periods signal sell due to the drop of prices below 1.1250. Volatility per week / Measurement of volatility: Month; Quarter Year The measurement of volatility reflects the average daily fluctuation calculated by Month / Quarter / Year. (July 3 was built, taking into account the time of publication of the article) The volatility of the current time is 25 points, which is 69% lower than the daily average. Since the United States is on a holiday, activity in the markets will be low today. Key levels Resistance Zones: 1.1300; 1.1440 / 1.1500; 1.1650 *; 1.1720 **; 1.1850 **; 1,2100 Support areas: 1.1180 **; 1.1080; 1,1000 ***; 1.0850 **; 1.0775 *; 1.0650 (1.0636); 1,0500 ***; 1.0350 **; 1,0000 ***. * Periodic level ** Range Level *** Psychological level The material has been provided by InstaForex Company - www.instaforex.com |
| Posted: 03 Jul 2020 04:37 AM PDT GBP/USD – 1H.
Hello, traders! According to the hourly chart, the pound/dollar pair performed a consolidation over the downward trend corridor, so the current mood of traders changed to "bullish". However, yesterday the pair's quotes also performed a reversal in favor of the US dollar, receiving a little support from the information background. In America, several quite good reports were released, and news continues to arrive from the UK about the failures in the Brexit negotiations. Yesterday, it was again reported that the negotiating groups met and decided nothing. Neither London nor Brussels is willing to make concessions and cannot agree on any of the most contentious issues. Thus, the probability that the deal will be concluded before the end of 2020 is no more than 5%. For the pound, this news is extremely bad. The UK economy without a trade agreement with the European Union could shrink even further. GBP/USD – 4H.
On the 4-hour chart, the pound/dollar pair rebounded from the corrective level of 38.2% (1.2530), turned in favor of the US dollar and fell to the Fibo level of 50.0% (1.2444). Closing the pair's exchange rate below this level will work in favor of continuing the fall of quotes in the direction of the next corrective levels of 61.8% (1.2358) and 76.4% (1.2250). Today, the divergence is not observed in any indicator. A rebound from the Fibo level of 50.0% will allow traders to expect a reversal in favor of the British pound and a return to the level of 1.2530. GBP/USD – Daily.
On the daily chart, the pair's quotes returned to the corrective level of 50.0% (1.2462). The process of falling can be resumed in the direction of the Fibo level of 38.2% (1.2215) only in the case of a rebound from 1.2462. GBP/USD – Weekly.
On the weekly chart, the pound/dollar pair performed a false breakdown of the lower trend line and rebound from it. Thus, until the pair's quotes are fixed under this line, there is a high probability of growth in the direction of two downward trend lines. Overview of fundamentals: There were no important economic reports in the UK on Thursday. However, the information about another failure in the negotiations between Brussels and London was enough for traders to return to buying the dollar. Statistics from this country also helped the US currency, as the unemployment rate fell, and Nonfarm Payrolls were stronger than traders' expectations. News calendar for the US and UK: UK - PMI for services (08:30 GMT). There will be no interesting economic reports on July 3. Thus, the information background will be virtually absent. COT (Commitments of Traders) report:
The latest COT report for the British pound was even less interesting than the euro report. Major market players trading the British pound were even less active during the reporting week. In total, the Non-commercial group opened only 3,500 new contracts. A more or less normal value is the number of 10,000 or more contracts. Thus, globally, the mood of major market players has not changed at all. In the last 10 days, as in the case of the euro, the British pound first fell, then rose, then fell again. The Non-commercial group was even less active, opening 2,500 new short contracts and closing 343 long ones. Well, the general changes for all groups of traders are completely depressing. Thus, the overall conclusion is disappointing. No special changes in the mood of major market players during the reporting week can be noted. Forecast for GBP/USD and recommendations to traders: I recommend selling the British dollar today with the goals of 1.2358 and 1.2250, if the closing level is 50.0% (1.2444). New purchases of the pair can be considered with the goal of 1.2530, if the pair rebounds from the level of 1.2444. Terms: "Non-commercial" - major market players: banks, hedge funds, investment funds, private, large investors. "Commercial" - commercial enterprises, firms, banks, corporations, companies that buy currency, not for speculative profit, but to ensure current activities or export-import operations. "Non-reportable positions" - small traders who do not have a significant impact on the price. The material has been provided by InstaForex Company - www.instaforex.com |
| Posted: 03 Jul 2020 04:28 AM PDT Corona virus summary:
The German chancellor, Angela Merkel, has started making official appearances wearing a maskAssociated Press reports. Merkel appeared in the upper house of parliament in Berlin on Friday wearing a black mask sporting the logo of Germany's European Union presidency, taking it off after she took her seat at an appropriate distance from others in the chamber. Technical analysis: Gold has been trading sideways at the price of $1,776. I still see further upside continuation due to strong upward trend in the background and rejection of the support. Trading recommendation: The material has been provided by InstaForex Company - www.instaforex.com |
| EUR/USD analysis for July 03 2020 - Potential for the bigger drop towards the 1.1035 Posted: 03 Jul 2020 04:23 AM PDT Corona virus summary:
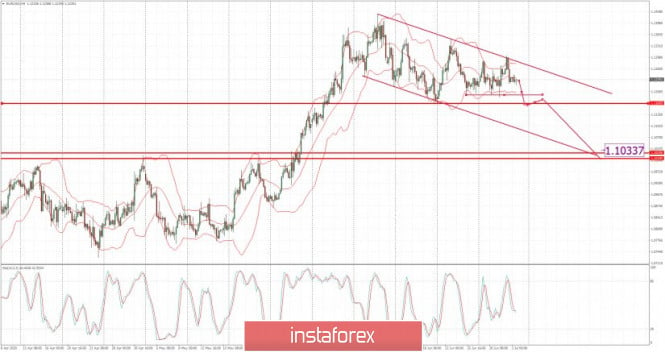
Boris Johnson is standing by his decision to allow pubs, bars and restaurants to reopen in England on a Saturday despite concerns from the public that it could put extra strain on the police and the health service. In a radio interview the prime minister suggested that the day of the week for reopening would not make a difference, but reminded people to enjoy themselves safely. Johnson told LBC that the government had thought carefully about the date, after a caller into the station suggested a weekday might have been more appropriate, given the increase in drunken behavior at weekends. Technical analysis: EUR/USD has been trading sideways at the price of 1,1233. The EUR is trading in well defined trading range between the price of 1.1185 (support) and 1,1290 (resistance). Trading recommendation: Watch for potential breakout of the support to confirm further upside movement. EUR is trading in the downside channel and there is still chance for the down continuation towards the levels at 1,1170 and 1,1035. The material has been provided by InstaForex Company - www.instaforex.com |
| Why emerging markets shocked by 2020? Posted: 03 Jul 2020 03:12 AM PDT The first half of 2020 caused many troubles. The coronavirus pandemic, tensions between the US and China, the oil prices collapse and, as a result, the fall in stocks, currencies and bonds of developing countries. Moreover, the global recession is only gaining momentum. Obviously, traders and investors had a tough time.
1. Wuhan outbreak Analysts expected a favorable year, investors hoped for a trade agreement between the US and China, but a new virus began to spread in Wuhan. A large number of people suffered from pneumonia. Many of them died. The Chinese government decided to implement restrictive measures to limit the infection. This, in turn, caused a fall in risk assets in mid-January. At the end of March, the Emerging Markets Stock Index hit the bottom. And only last Wednesday, it rose by 0.3%. 2. Ultra low rates Amid the pandemic and global isolation, developing countries' officials lowered rates to their minimums to avoid massive stock sales. This led to the fact that in the second quarter of 2020, dollar bonds of developing markets showed the maximum quarterly growth since 2009. 3. Oil collapse The disagreements between OPEC and Russia led to a historic fall in oil prices below zero in March. Moreover, the coronavirus pandemic has created new economic troubles. Due to the lack of demand for fuel, the petroleum storage tanks were full. So the countries managed to reach an agreement in April to reduce production. The deal was prolonged in June. 4. On the verge of default Many countries spent a huge amount of money on fighting the pandemic and eliminating its consequences. In this regard, many developing countries were on the verge of default. Most heavily indebted states have suffered as expanding credit spreads hinder the sale of Eurobonds. 5. Recrimination Towards the end of 2019, relations between China and the United States improved. However, after the United States became first in number of the coronavirus cases, relations between countries again became hostile. Donald Trump began accusing China of the COVID-19 outbreak's inappropriate control. This was followed by a series of accusations towards Beijing. This led to a record drop of the yuan against the US dollar in overseas trading. 6. Murder in Iran The United States was also involved in a conflict with Iran. In January, the Americans killed Iranian General Qasem Soleimani. Iran threatened with counter measures. After that the United States sent additional troops to the Middle East. As a result, the Middle East markets showed the worst dynamics of world stock indexes. Fortunately, Washington and Tehran ceased hostilities. Currencies and stocks of emerging markets have recovered. The material has been provided by InstaForex Company - www.instaforex.com |
| Posted: 03 Jul 2020 02:57 AM PDT
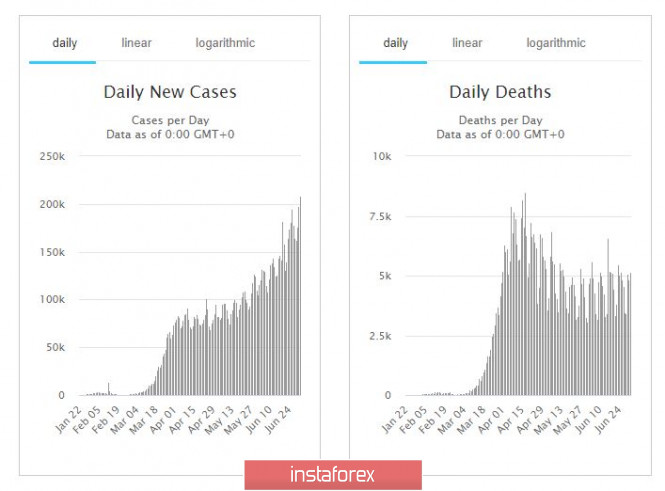
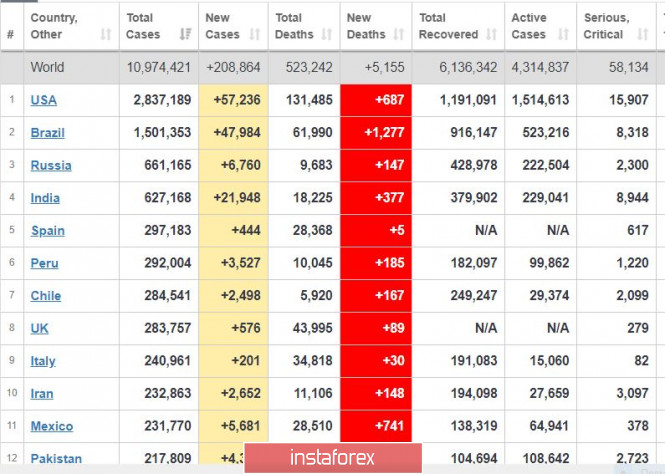
The latest data indicates that there is a new peak in coronavirus incidence today - more than 200 thousand new cases. Meanwhile, the number of deaths has decreased significantly, which suggests that the virus may not be as lethal as before.
In the US, the number of new infections has jumped to more than 57 thousand per day, but the number of deaths is less than 700 per day. Brazil and India see the same, with 48 thousand and 22 thousand new cases respectively. Mexico also records an acceleration, listing about 6 thousand new cases in the country.
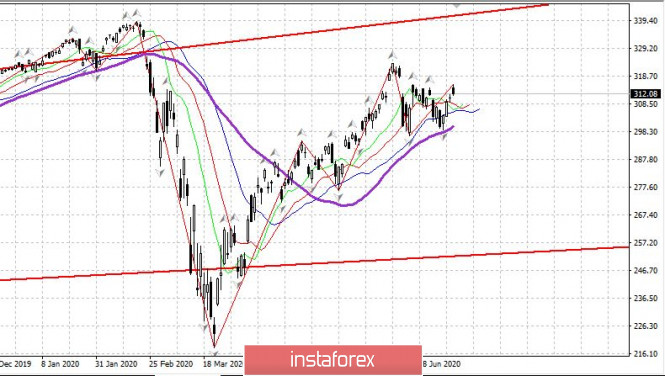
S&P 500: The US market records a new leap due to strong US labor market report. According to the latest data, 4.8 million new jobs were listed, and the unemployment rate has fallen to 11%. Industrial orders also increased by 8%, which is a very good news.
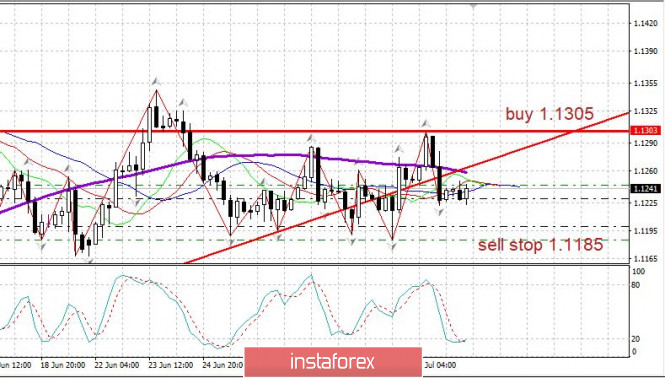
EUR / USD: The euro continues to rally amid strong data on the US economy. Trade long positions to raise the quotes to the level of 1.1500 and onwards. Stop buying when the pair reaches 1.1200. In case of a downward turn, sell positions from 1.1185. The material has been provided by InstaForex Company - www.instaforex.com |
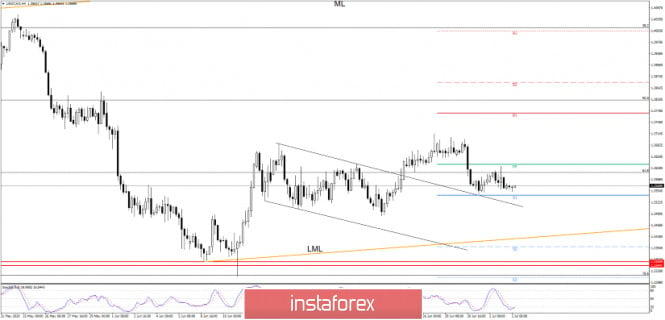
| USD/CAD Showing Bullish Signs! Posted: 03 Jul 2020 02:49 AM PDT USD/CAD is trading at 1.3567 and it could come back higher if the US Dollar Index jumps higher. The pair has decreased a little, but it could still resume its short-term rebound, the minor decrease could give us a great chance to go long on this pair. Another higher high, or a false breakdown with great separation below the near-term support will confirm another bullish momentum. The Stochastic indicator is oversold, so a bullish movement is somehow expected.
USD/CAD has retreated after the failure to stabilize above the 1.3665 static resistance, and now it has found support right above the S1 (1.3541) level. A valid breakout above the PP (1.3628) could suggest buying again. The pair has decreased but it has failed to retest the downtrend line, down channel's resistance, this is one of the reasons that USD/CAD could give birth to another leg higher in the short term. Personally, I would like to see a false breakdown with a huge separation below the S1 (1.3541) before moving higher again, this situation would have given us a chance to buy it low. Without a false breakdown, pin bar, or a bullish engulfing, we have to wait for another higher high before going long.
A valid breakdown below the S1 (1.3541) will signal a further drop towards the lower median line (LML) of the major ascending pitchfork, this scenario could take shape only if the USDX drops aggressively in the short term. USD/CAD is moving in a range between the S1 (1.3541) and the PP (1.3628), an upside breakout from this pattern will bring a long opportunity. Still, only a valid breakout above the 1.3665 and another higher high, a jump above the 1.3715 will really validate a major upwards swing towards the R3 (1.4001) level. The material has been provided by InstaForex Company - www.instaforex.com |
| EUR / USD: US unemployment report's impact on the pair's dynamics Posted: 03 Jul 2020 02:43 AM PDT
The greenback interrupted the decline on Thursday after the US Department of Labor released monthly statistics on employment in the country. The USD index, which first sagged to a weekly low of 96.8 points, then rose to 97.3 points against the backdrop of data showing that jobs in the largest economy in the world are recovering 1.5 times faster than forecasts. According to the US Department of Labor report, in June the number of jobs in the country increased by a record 4.8 million, and the unemployment rate fell to 11.1% from 13.3% recorded in May. "At first glance, the data just looks fantastic. Employment has grown in all sectors of the American economy. At the same time, the largest number of new jobs (2.08 million) accounted for the services sector, "said economists at ING. "At the same time, the total number of employees is still 14.66 million lower than in February. At the same time, more than 19 million Americans receive unemployment benefits. Now they are supported by payments of $ 600 per week from the Trump administration. However, it is not clear what will happen after July 31, when the validity of these measures expires, "they added. "More Americans now live on unemployment benefits than during the worst periods of the Great Depression. At the same time, according to the National Federation of Independent Businesses (NFIB), small entrepreneurs have been downsizing since mid-June. All this indicates that the road to recovery will be long, "said ING experts. The bank expects a steady weakening of the greenback and is optimistic about the prospects for the euro. ING strategists expected EUR / USD growth to 1.18 by the end of the current quarter and by 1.20 by the end of the year. "The COVID-19 topic and statistical data are certainly important for investors, but the Fed's" printing press "is the real driver for the currency market, and the regulator is unlikely to decide to turn it off in the foreseeable future. It is assumed that the flow of money from the US Central Bank will ensure the maintenance of an acceptable level of risk appetite in the coming quarters. In light of the persistent negative correlation between the USD exchange rate and the S&P 500 index, this allows us to expect a weakening of the US currency, the downward trend of which will develop as the global economy slowly recovers and adapts to new conditions, "they said. According to OCBC analysts, the EUR / USD pair currently lies flat around 1.1236 and is preparing to form a basis at the psychological level of 1.12, which might mean further growth. "The couple lost points earned on a risk appetite, as media reported that EU member states were still unable to come to an agreement on a stimulus package for the region's economy. This news restrained the further growth of the pair and strengthened its position in the range. The inability of the EUR / USD to break the support at 1.1200 should alert the bears. The pair is likely to form a base around 1.1200, and then move north, " said OCBC analysts. The material has been provided by InstaForex Company - www.instaforex.com |
| Posted: 03 Jul 2020 02:39 AM PDT The popularity of the yellow metal, gold, has become especially noticeable after COVID-19 is gradually fading. Previously, investors massively "ran away" to this asset, considering it the most reliable during the crisis. As a result, the price of gold rose, giving rise to further positive forecasts. Experts of Bank of America shared one of these assumptions related to the active growth in the price of precious metals. Bank experts were optimistic about gold back in April 2020, in the midst of a pandemic. They believe that neither $ 2,000 nor $ 3,000 per ounce is an obstacle for the yellow metal. According to some analysts, coronavirus infection serves as an impulse for precious metals, increasing its attractiveness to investors and helping it to rise. Last week, at the end of June, against the backdrop of a new outbreak of COVID-19, the yellow metal came close to a nine-year high. Market fears about the next wave of coronavirus triggered an explosion in demand for protective assets, the key of which is gold. The price of the main precious metal almost approached $1800, but could not reach the desired level. However, the market does not lose hope for a repeat of the storm, counting on overcoming not only this peak, but also reaching $1,900 per 1 ounce. Currently, gold runs near the levels of $ 1774.80– $ 1774.90. On Friday, July 3, gold rose to $ 1,775.50– $ 1,775.60 per ounce, confirming analysts' forecasts of a possible increase. According to experts of Bank of America, in the next 18 months, the cost of precious metals can skyrocket to $ 3,000. In the bank's previous forecast, it was supposed to increase to $2000 per 1 ounce. This coincides with the forecasts of other experts, foreshadowing the rise in the price of precious metals to $ 2000 per 1 ounce by the end of 2020. The main reason for this increase is the current crisis caused by the COVID-19 pandemic, deeper and wider than the previous financial failure of 2008. One of the key impulses of growth in the price of precious metals is the soft monetary policy of leading central banks that flooded the market with money. The inclusion of the "printing press" led to the fact that part of this capital went to the gold market, supporting the defensive asset. Another catalyst for the growth of the yellow metal was the total weakening of the American currency, declining across the entire spectrum of the market. Analysts conclude that the cost of gold from $ 2,000 to $ 3,000 per ounce is quite achievable. According to preliminary estimates, the precious metal will reach $ 2,000 per ounce by the end of this year, and they will give $ 3,000 in the medium-term. Experts also concluded that the growing popularity of yellow metal will allow it to maintain a high price range for a long time. The material has been provided by InstaForex Company - www.instaforex.com |
| Posted: 03 Jul 2020 02:29 AM PDT Good afternoon traders! A trading idea for the EUR / USD pair: A good data on the US labor market was published yesterday. It resulted to a short impulse in the EUR / USD pair, in which the movement was in favor of the US dollar. View it as wave "A" of the classic "ABC" pattern and use the Stop Hunting strategy to locate the stops of the bulls yesterday. Close half of the short positions after the quotes breakout of 1.12226, while hold the rest at the level of 1.11688. "Price Action" and "Stop Hunting" strategies were used to formulate this trading idea. The United States is on a holiday today, in honor of the country's Independence Day. Good luck in trading and have a good weekend! The material has been provided by InstaForex Company - www.instaforex.com |
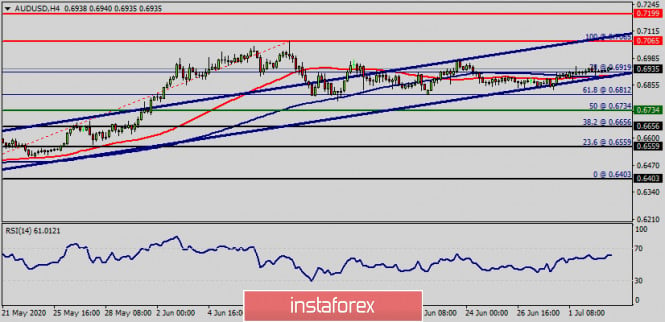
| Technical analysis of AUD/USD for July 03, 2020 Posted: 03 Jul 2020 02:22 AM PDT Overview :
The trend of AUD/USD pair movement was controversial as it took place in a narrow sideways channel, the market showed signs of instability. Amid the previous events, the price is still moving between the levels of 0.6812 and 0.7065. Also, the daily resistance and support are seen at the levels of 0.7065 and 0.6734 respectively. Therefore, it is recommended to be cautious while placing orders in this area. So, we need to wait until the sideways channel has completed. Yesterday, the market moved from its bottom at 0.6812 and continued to rise towards the top of 0.6853. Today, in the one-hour chart, the current rise will remain within a framework of correction. However, if the pair fails to pass through the level of 0.6919, the market will indicate a bearish opportunity below the strong resistance level of 0.6919 (the level of 0.6919 coincides with the double top too). Since there is nothing new in this market, it is not bullish yet. Sell deals are recommended below the level of 0.6919 with the first target at 0.6734. If the trend breaks the support level of 0.6734, the pair is likely to move downwards continuing the development of a bearish trend to the level 0.6656 in order to test the daily support 2 (32% of fibonacci retracement). The material has been provided by InstaForex Company - www.instaforex.com |
| You are subscribed to email updates from Forex analysis review. To stop receiving these emails, you may unsubscribe now. | Email delivery powered by Google |
| Google, 1600 Amphitheatre Parkway, Mountain View, CA 94043, United States | |











No comments:
Post a Comment