
Forex analysis review |
- Control zones for USD/CAD on 08/21/20
- Control zones for EURUSD on 08/21/20
- Control zones for AUDUSD on 08/21/20
- Hot forecast and trading signals for the GBP/USD pair on August 20. COT report. Crazy pound. Sterling neutralized almost
- Hot forecast and trading signals for the EUR/USD pair on August 21. COT report. Rumors completely baffled traders. Price
- Control zones for NZDUSD on August 21, 2020
- Overview of the GBP/USD pair. August 21. Brexit negotiations continue. Boris Johnson will have to rebuild the economy and
- Overview of the EUR/USD pair. August 21. The FOMC minutes: nothing interesting. The US tech giants do not benefit from Trump
- Analytics and trading signals for beginners. How to trade the EUR/USD pair on August 21? Analysis of Thursday trades. Preparation
- EUR/USD. Dollar's fragile position and deceptiveness of the China issue
- USD to resume weakness after brief pause?
- Comprehensive analysis of movement options for #Bitcoin & #Ethereum (H4) on August 21, 2020
- Bitcoin gradually moving higher
- Gold continues to rally, sees positive prospect
- Evening review on August 20, 2020
- August 20, 2020 : GBP/USD Intraday technical analysis and trade recommendations.
- August 20, 2020 : EUR/USD Intraday technical analysis and trade recommendations.
- Analysis of GBP/USD on August 20
- Analysis of EUR/USD on August 20. FOMC minutes did not stop the dollar from starting long-awaited growth
- Trading plan for GBPUSD for August 20, 2020
- Trading plan for US Dollar Index for August 20, 2020
- Trading plan for EURUSD for August 20, 2020
- Global stock markets went on sudden correction
- GBP/USD: plan for the American session on August 20
- EUR/USD: plan for the American session on August 20
| Control zones for USD/CAD on 08/21/20 Posted: 20 Aug 2020 07:35 PM PDT Working in the direction of the downward movement remains a priority. The nearest goal is a monthly minimum. It is important to note that the local accumulation zone is formed on the third day. Going outside this zone will indicate further priority. The continuation of the pair's declining is more likely. On the other hand, working within the flat implies a partial fixing of a sale during the retest of the weekly control zone 1.3160-1.3137. The option to continue the downward medium-term impulse will become relevant if the current week's trading closes below the weekly control zone. This will open an opportunity to hold part of the short position to the level of 1.3050. Daily CZ - daily control zone. A zone formed by important data from the futures market that changes several times a year. Weekly CZ - weekly control zone. A zone formed by important marks of the futures market that change several times a year. Monthly CZ - monthly control zone. A zone that reflects the average volatility over the past year. The material has been provided by InstaForex Company - www.instaforex.com |
| Control zones for EURUSD on 08/21/20 Posted: 20 Aug 2020 06:41 PM PDT The pair was corrected by 50% after forming the absorption pattern of the daily level. The main resistance for today is the WCZ 1/2 1.1902-1.1893. If testing this zone leads to forming a sell pattern, then the short position will come to the fore. The target of the fall is still the weekly control zone of 1.1784-1.1766. Working in a range between two control zones implies partial profit taking at the lower border. Selling should be made only after an absorption pattern has formed not lower than the TF M30. An alternative model will develop if today's trading closes above the WCZ 1/2. This cancels the option to sell the instrument and allows you to search for purchases that will be aimed at updating the monthly high. Daily CZ - daily control zone. The area formed by important data from the futures market, which changes several times a year. Weekly CZ - weekly control zone. The zone formed by important marks of the futures market, which changes several times a year. Monthly CZ - monthly control zone. The zone, which is a reflection of the average volatility over the past year. The material has been provided by InstaForex Company - www.instaforex.com |
| Control zones for AUDUSD on 08/21/20 Posted: 20 Aug 2020 06:20 PM PDT A medium-term accumulation zone continues to form for the fourth week. This allows you to consider purchases when testing the lower part of the range and selling when updating the monthly high. Working within the framework of a flat implies short profit taking on its borders. The target for the upward movement is still the weekly control zone of 0.7308-0.7290. Yesterday's purchases should be kept until the structure of the upward movement is broken. The alternative option will develop if the closing of Asian or US trades occurs below the WCZ 1/2 0.7187-0.7178. This will allow you to review your trading plan and sell the instrument. The first goal of the decline will be a weekly low. Daily CZ - daily control zone. The area formed by important data from the futures market, which changes several times a year. Weekly CZ - weekly control zone. The zone formed by important marks of the futures market, which changes several times a year. Monthly CZ - monthly control zone. The zone, which is a reflection of the average volatility over the past year. The material has been provided by InstaForex Company - www.instaforex.com |
| Posted: 20 Aug 2020 06:07 PM PDT GBP/USD 1H The GBP/USD pair nearly collapsed on August 20 until yesterday morning. And since yesterday morning, it has moved on to a strong growth and at the time of writing, offset 75% of losses. Thus, the pair's quotes returned to the area above the critical line, the bulls quickly caught on, and the bears once again showed their weakness and unwillingness to attack. By the way, the European currency did not grow on the fourth trading day of the week. Thus, uncorrelation has occurred, which raises questions. If the pound sterling rose today but not on the basis of the US fundamental background, then why? One way or another, at this time the pair has excellent chances of resuming the upward trend, but at the same time, yesterday's growth may just be a deep correction, after which the downward movement will resume. GBP/USD 15M The lower linear regression channel has already turned up on the 15-minute timeframe, signaling a possible resumption of the upward trend. The latest Commitment of Traders (COT) report for the British pound, which was released last Friday, turned out to be almost an exact copy of the report on the euro currency. As for the euro, big traders opened new Buy-contracts in the reporting week (2,569) and closed Sell-contracts (8,405). Thus, the net position for non-commercial traders increased by almost 11,000 during the reporting week, which, in fact, means an increase in bullish sentiment. We could draw the same conclusions based on the nature of the pair's movement itself. Given the fact that we have not seen a normal correction of the British pound for several weeks, we can make a clear conclusion that big traders are not selling this currency now. Therefore, even the COT report does not yet suggest the beginning of a new downward trend. At the same time, quotes started falling on Wednesday, August 19, but, first, this day will not be included in the new COT report, which is for the period of August 12-18, and secondly, the pair began to sharply grow on Thursday.. Therefore, it is unlikely that we will see a major change in the mood of non-commercial traders in the new report. The fundamental background for the GBP/USD pair on Thursday was not strong or interesting. During the day, not a single macroeconomic report was published in the UK, but there was one report on applications for unemployment benefits in the United States, however, it could not cause the dollar to fall by 130 points. The fall began in the morning, and the report was released in the afternoon. Thus, there can be only two explanations. Either traders caught on very quickly and started buying the pound again, selling off the dollar, or the market received some optimistic news from the UK. However, no news has been received from the UK, so we are leaning towards the first option. UK business activity indices are also set to be published in the last trading day of the week, but the macroeconomic background currently plays a low role in the exchange rate. There are two main options for the development of events on August 21: 1) Buyers finally let go of the pound dollar pair, which immediately led to a landslide fall. However, this process did not last long. Since the price returned to the area above 1.3157-1.3181, now you are advised to consider long positions while aiming for 1.3213 and 1.3284. A rebound from any target can provoke a strong new round of the downward movement. Take Profit in this case will be up to 70 points. 2) Bears gave up very quickly and released the initiative from their hands. Thus, settling the price below the Kijun-sen line (1.3156) is required, so that the downward movement can resume with the targets of the Senkou Span B line (1.3084) and the support level of 1.3010. Take Profit in this case will be from 50 to 100 points. Hot forecast and trading signals for the GBP/USD pair. We recommend that you also explore the fundamental background in these articles: Overview of the EUR/USD pair. August 21. FOMC minutes: nothing interesting. US tech giants do not benefit from Trump becoming president a second time. The war with China will continue. Overview of the GBP/USD pair. August 21. Ongoing Brexit talks. Boris Johnson will have to rebuild the economy and keep Northern Ireland and Scotland as part of Britain. Explanations for illustrations: Support and Resistance Levels are the levels that serve as targets when buying or selling the pair. You can place Take Profit near these levels. Kijun-sen and Senkou Span B lines are lines of the Ichimoku indicator transferred to the hourly timeframe from the 4-hour one. Support and resistance areas are areas from which the price has repeatedly rebounded off. Yellow lines are trend lines, trend channels and any other technical patterns. The material has been provided by InstaForex Company - www.instaforex.com |
| Posted: 20 Aug 2020 06:05 PM PDT EUR/USD 1H The euro/dollar pair perfectly reached the Senkou Span B line on the hourly timeframe of August 20, which, let me remind you, is the most important and strong line of the Ichimoku indicator. So the price reached it and rebounded. Thus, the bears' fuse dried up very quickly. And now, in order for the US dollar to continue to rise in price, it is necessary for sellers to keep the pair through the Senkou Span b line. However, now the most interesting question is whether yesterday's fall was an accident? We have already concluded yesterday that traders of both major pairs just started taking profits, which resulted in the simultaneous fall of both the euro and the pound. However, both pairs stopped falling today, and the pound sterling has jumped at a breakneck speed. Thus, both pairs may soon return to the upward trend. EUR/USD 15M Both linear regression channels turned down on the 15-minute timeframe, but this still did not help the quotes to continue falling. The last available Commitment of Traders (COT) report was released last Friday. According to this report, non-commercial traders reopened Buy-contracts and closed Sell-deals. Thus, the net position for the "non-commercial" category of traders, which is the most important and significant category of traders, has grown again, this time by 15,000 contracts, which is a high value (5,128 Buy-contracts were opened and 9,681 Sell-contracts were closed). Hence, the conclusion is that the mood of big traders has not changed at all over the past week. In principle, the same conclusion can be drawn by looking at the chart of the euro/dollar currency pair. The pair has been in the side channel since July 27, that is, for three weeks, after which the upward movement resumed. During all this time, traders managed to adjust the pair by a maximum of 200 points down, which is very little to be reflected in the COT report. The euro only began to fall in price the day before yesterday,, which gives reason to assume the end of the upward trend. If in today's COT report we see non-commercial traders sharply reducing Buy-contracts, or an increase in the number of Sell-contracts, it will show that their mood is beginning to change in favor of a bearish one. The fundamental background for the EUR/USD pair was extremely contradictory on Thursday. There are a lot of rumors on the market now, but there are practically no facts. Let's start with the fact that yesterday the media leaked information that Republicans and Democrats began to conduct almost secret talks on a new package of financial assistance to the US economy. Furthermore, it was also reported yesterday that China and the United States have begun preparing for new talks on trade relations. In both cases, the participants in the negotiation process did not want to advertise the upcoming dialogues. And this is the main doubt that this information is true. Of course, this may be the case in reality, but what is confidential? Germany, the European Union and the United States will publish business activity indices in the services and manufacturing sectors on Friday. We believe that there will not be much reaction to these reports, as they are highly likely to exceed the 50.0 level, above which the corresponding area is considered to be growing. Based on the above, we have two trading ideas for August 21: 1) Bulls temporarily abandoned further purchases of the pair and began to take profits. The pair dropped to the Senkou Span B line and stopped. Thus, in order for the upward trend to resume, the quotes must return to the area above the 1.1886-1.1910 range. In this case, we will recommend buying the euro again with targets at the levels of 1.1958 and 1.2051. Take Profit in this case will be from 40 to 120 points. 2) Bears finally seized the initiative in the market and began to attack. However, so far more and more depends on the bulls, which simply closed part of the longs. Nevertheless, we recommend to continue selling the pair with the target of the support level of 1.1745 if sellers manage to overcome the Senkou Span B line (1.1812). The potential Take Profit in this case will be about 50 points. Hot forecast and trading signals for the GBP/USD pair. We recommend that you also explore the fundamental background in these articles: Overview of the EUR/USD pair. August 21. FOMC minutes: nothing interesting. US tech giants do not benefit from Trump becoming president a second time. The war with China will continue. Overview of the GBP/USD pair. August 21. Ongoing Brexit talks. Boris Johnson will have to rebuild the economy and keep Northern Ireland and Scotland as part of Britain. Explanations for illustrations: Support and Resistance Levels are the levels that serve as targets when buying or selling the pair. You can place Take Profit near these levels. Kijun-sen and Senkou Span B lines are lines of the Ichimoku indicator transferred to the hourly timeframe from the 4-hour one. Support and resistance areas are areas from which the price has repeatedly rebounded off. Yellow lines are trend lines, trend channels and any other technical patterns. The material has been provided by InstaForex Company - www.instaforex.com |
| Control zones for NZDUSD on August 21, 2020 Posted: 20 Aug 2020 05:52 PM PDT Yesterday's decline led to a test of two significant supports at once. The weekly CZ 0.6498-0.6483 coincided with the zone of the weekly average move, which led to a sharp increase in demand. It is important to note that the growth did not lead to the formation of a reversal model, so sales still remain relevant. If there are still short positions that are in breakeven, then you can continue to lead them. The most favorable prices for repeat sales are within the WCZ 1/2 0.6568-0.6561. An alternative growth model will develop if the closing of today's trading occurs above the WCZ 1/2. This will open the way for growth and updating the monthly maximum. The probability of development of this model is 50%, so it must be taken into account when building a trading plan within the day. Daily CZ - daily control zone. A zone formed by important data from the futures market that changes several times a year. Weekly CZ - weekly control zone. The zone formed by important marks of the futures market, which change several times a year. Monthly CZ - monthly control zone. A zone that reflects the average volatility over the past year. The material has been provided by InstaForex Company - www.instaforex.com |
| Posted: 20 Aug 2020 05:35 PM PDT 4-hour timeframe
Technical details: Higher linear regression channel: direction - upward. Lower linear regression channel: direction - upward. Moving average (20; smoothed) - sideways. CCI: 67.0898 The British pound also settled slightly below the moving average line following the fall that began the day before yesterday. However, due to the fact that the fall began quite abruptly and unexpectedly, the moving average line could not go too far up, and now the price is very close to it. On August 20, sellers failed to continue moving the pair down. Thus, none of the previous local lows were updated, and fixing the price above the moving average line will return the bulls to the market at all. Thus, we would not rush to declare the end of the upward trend. It may still resume despite the fact that the pound is heavily overbought, there were no special reasons for the growth of the British currency, but, nevertheless, traders continue to sell the US dollar, so in general it may continue to fall in price. A new COT report will be released today, which could show a reduction in buy-contracts for non-profit traders, however, this is unlikely to happen, since the report will cover only the period of August 12-18, and the fall in the British pound quotes occurred on August 19. Very little macroeconomic information has been received from the UK recently. And most importantly, there is no information about the progress of negotiations on the relationship between the UK and the European Union after the end of the "transition period". Thus, "who is still there", and the pound still has little reason to strengthen. As we said earlier, if everything is relatively calm and good in the European Union, which really contrasts with what is happening in the US, the situation in the UK (economic and political) is no better. The economy is clear. The loss of 20.4% of GDP in the second quarter is the highest among all EU countries, among which the Kingdom will not be listed very soon. But the political situation is not so clear. We have been skeptical of Boris Johnson and his manner of governing since day one, repeatedly criticizing him. By and large, in more than a year of his rule, Johnson won few victories. He can only be credited with bringing Brexit to an end and not delaying the process for several more years. However, what is blood? We are sure that any politician could have taken the country out of the EU in such a way as Johnson did. After all, think about it, Johnson did not agree with Brussels on a "soft divorce", he did not manage to conclude a trade deal, and what will happen after the "transition period" can only be guessed, although all economists as one continue to say that the British economy will be dealt another blow due to the complete severance of ties with European companies. It is to the EU countries that more than 50% of exports from the UK are sent. Thanks to Boris Johnson, who simply "took the axe" and cut all the ropes that stretched from Britain to the EU, the bloc and the Kingdom will now trade under WTO rules. That is, with duties, quotas, and so on. And now tell me, what did Johnson do so special for Great Britain? Nothing. Moreover, in the best traditions of Donald Trump, Johnson tried several times to play dishonestly. First, he blocked the work of the Parliament in order to take the country out of the EU unhindered and in the way he wants. Before that, he kicked out of his party all those who did not support his views on Brexit. Thus, at the head of Britain is just a smaller copy of Donald Trump. A little later, the British government completely failed to fight the "coronavirus" in the Foggy Albion, as well as his colleague and friend across the ocean. And if two more friends worked for each other, there would be a lot to forgive. But there is no trade deal between the United States and Britain yet. There are no negotiations between London and Washington. And Johnson, apparently, is very much counting on this deal. It seems that he really believes that "friendship" with Trump will help him. However, Trump can leave his post in six months and then have to negotiate with another President. In general, we believe that the UK is headed by the same ambiguous leader as the US. At the same time, we should not forget that almost the main task of Johnson is not to restore the economy now (this is already clear), but to keep Scotland and Northern Ireland as part of the United Kingdom. We have already written several times about the fact that Scotland is trying to leave the EU since 2014, when the first independence referendum was held. However, at the time, most Scots thought it would be better to remain part of the Kingdom. Now the majority (according to opinion polls) believe that it would be better to leave the Kingdom and return to the European Union. However, to do this, you need to get official permission from London to hold a second referendum, and it is obvious that London will not give the "go-ahead" for this. However, the events of recent decades show that a region does not always need "good" from above to leave or join another state or bloc. Just as it is not always possible for the government to reassure its population, which does not want to live by the new rules or vice versa, in the old way. The events in Ukraine and Belarus are a clear confirmation of this. Thus, it is quite possible that one of these scenarios is also possible in Scotland. And there is nothing to say about Northern Ireland, which has been in conflict with the British authorities for decades. Its residents are clearly not happy that the island of Ireland will now have a border, customs and border crossing system, even if it will pass by sea. Thus, we once again point to the fact that the reasons for growth in the pound are few. And we once again point out that you still need to trade in accordance with the technical picture, since it best reflects what is happening now in the market.
The average volatility of the GBP/USD pair is currently 122 points per day. For the pound/dollar pair, this value is "high". On Friday, August 21, thus, we expect movement within the channel, limited by the levels of 1.3069 and 1.3313. Turning the Heiken Ashi indicator upward will indicate a possible new round of downward correction. Nearest support levels: S1 – 1.3123 S2 – 1.3062 S3 – 1.3000 Nearest resistance levels: R1 – 1.3184 R2 – 1.3245 R3 – 1.3306 Trading recommendations: The GBP/USD pair is trying to resume the upward trend on a 4-hour timeframe. Thus, today it is recommended to consider new longs with the goals of 1.3245 and 1.3306, which could be opened after fixing the price above the moving average,and hold them until the MACD indicator turns down. It is recommended to open sell orders no earlier than fixing the price below the moving average with the goals of 1.3062-1.3000. The material has been provided by InstaForex Company - www.instaforex.com |
| Posted: 20 Aug 2020 05:35 PM PDT 4-hour timeframe
Technical details: Higher linear regression channel: direction - upward. Lower linear regression channel: direction - upward. Moving average (20; smoothed) - sideways. CCI: -29.7360 The EUR/USD currency pair, after rebounding yesterday from the Murray level of "6/8" - 1.1963, continued to move down for most of Thursday, August 20. And as a result, it was fixed below the moving average line. However, despite the fact that we have been waiting for the pair's quotes to fall for a long time, and despite the fact that the price has fixed below the moving average, and despite the fact that the dollar has finally risen in price, we do not believe that the upward trend is definitely over. Yes, the pair is fixed below the moving average, however, look at the illustration: over the past two weeks, the price overcame the moving average three times and each time could not start forming a downward trend. Thus, it is absolutely possible that this time the bears will fail and the upward movement will resume, although we have repeatedly said that the euro/dollar pair, from our point of view, is strongly overbought. But market participants are not interested in this. Major traders do not seem to leave the market, and yesterday recorded only a part of the profit on long positions. Thus, in order for the downward movement to continue, it is necessary that professional traders continue to reduce longs. At the same time, sellers should start opening short positions. Only in this case, the US currency can count on further strengthening. In fundamental terms, nothing has changed for the euro/dollar pair. There was no positive news from America. The overall fundamental background has not changed. Last night, the minutes of the last Fed meeting were published in the States. And this document could well send the US dollar into another "knockout". However, we warned traders that market participants rarely pay attention to this publication, so the reaction is unlikely to follow. In reality, there was no reaction, and the US dollar was actively rising in price at this time, which clearly does not correspond to what was stated in the document. The first thing to note is that the Fed leaders consider it necessary to further support the US economy through various types of stimulus measures. Representatives of the Monetary Committee note that the uncertainty in the future of the economy is extremely high and will depend on how the fight against the "coronavirus" epidemic will take place and what its results will be. Members of the Monetary Committee agreed that the economy will need additional incentives, but have not yet decided what tools and when to use them. Two key factors that will affect the economy in the future are government actions and the scale of the pandemic. The greatest concerns are related to the economic activity of Americans, which may remain at a low level for a long period of time if the COVID-2019 virus can not be curbed or a vaccine against it is created soon. However, not everyone supports additional monetary stimulus. Opinions differ. Some members of the FOMC believe that serious fiscal stimulus will be needed to improve labor market conditions, and some believe that new monetary injections will be needed to return inflation to the 2% level. The minutes also said that at the next meeting, representatives of the Federal Reserve may re-evaluate monetary policy, which will lead to a significant change in the text of the final communique. Thus, there was nothing optimistic about this protocol. By and large, everything really depends on how strong the "coronavirus" epidemic will be in America in a month, two, three or six months. Now we all see that the United States continues to lead in the number of cases, in the number of deaths from the pandemic. Of course, the United States is also one of the most numerous countries in the world, so the large number of diseases and deaths is partly due to this. Moreover, many countries clearly falsify real data, hiding the real scale of the epidemic. In particular, this is China, which, according to the Johns Hopkins Institute, currently recorded a total of 90,000 cases of diseases and 4,707 deaths. Obviously, this information is not true. Meanwhile, US President Donald Trump once again "rode the roller" on his main opponent in the presidential election, Joe Biden. Recall that for America and, accordingly, the US dollar, now the topic of elections is one of the most important. After all, the entire international policy of the country depends on who will become the next President. "Putin, President Xi Jinping, Kim Jong Un, Turkish President Erdogan, all of them are world-class grandmasters. We can't let a man who can't think straight deal with them. He was not very good at his best," Trump said. The US leader also said that Biden is "a puppet of the ultra-left political forces and does not understand what is happening". However, the Americans will choose a new President clearly not based on how well the new leader will stand up to Xi, Erdogan, Kim Jong-Un and Putin. After all, everyone knows that people are primarily interested in their own standard of living, and not in foreign economic policy. It is Trump who is interested in the struggle and confrontation with other countries. 90% of the inhabitants of any country are interested in going to work, getting a salary, starting a family and living well, and not the political course of Syria or Turkey. Trump has shown himself to be a leader in 2020 who cannot effectively lead the country at a difficult moment. Another question is, can Biden be a better President than Trump? If Trump becomes President for the second time, there is no doubt that he will launch an even greater campaign against China. There is no doubt that Trump will impose new duties, require all American companies to return their production to the United States, impose duties on those who refuse, and give benefits to those who agree. Thus, by and large, all the industrial and technological giants of America do not benefit from Trump becoming President for the second time. Well, a new trade war with Beijing or an escalation of the old one does not benefit anyone at all, but the US President is unlikely to stop these judgments. He set a goal to eradicate the injustice in China's attitude to America and will go to it to the end. The US dollar remains in the high-risk zone. Yes, technical factors speak in favor of the fact that this currency should have started strengthening long ago, however, it is not technical factors that rule the currency market, but traders. If traders continue to find reasons to get rid of the US currency, it will continue to fall in price.
The volatility of the euro/dollar currency pair as of August 21 is 82 points and is characterized as "average". Thus, we expect the pair to move today between the levels of 1.1771 and 1.1935. A reversal of the Heiken Ashi indicator to the top will signal a possible resumption of the upward trend. Nearest support levels: S1 – 1.1841 S2 – 1.1719 S3 – 1.1597 Nearest resistance levels: R1 – 1.1963 R2 – 1.2085 R3 – 1.2207 Trading recommendations: The EUR/USD pair has started to adjust and is located just below the moving average. Thus, today it is recommended to open new long positions with targets of 1.1935 and 1.2085, if the pair returns to the area above the moving average line. It is recommended to consider short positions only after a more confident fixing of the price below the moving average with the first goals of 1.1771 and 1.1719. The material has been provided by InstaForex Company - www.instaforex.com |
| Posted: 20 Aug 2020 01:44 PM PDT Hourly chart of the EUR/USD pair The EUR/USD pair tried to continue its downward movement for most of the day on Thursday, August 20. However, the pair's sellers failed to do any of this. The MACD indicator turned up, as we warned this morning, and began to discharge. If you look closely at the illustration, you will see that the indicator began to rise while the pair was trying to continue moving down. This is called "discharge", but today it has provided an excellent service to novice traders, since a new signal to sell did not form, and the price eventually began an upward correction. This is good. If the trend has changed to a downward trend, then in any case, you need to wait for a pullback to the top and only then should you open new sales of the euro/dollar pair. Of course, the downward movement can continue without a pullback, but in this case, it will be more difficult and dangerous to work with such a movement. There was only one macroeconomic release today. The report on applications for unemployment benefits. We have said in previous articles that this is not the most important report in the current environment, so there is unlikely to be a reaction to it. In practice, it turned out that the report was worse than forecasts (1,106,000 against 925,000), so in any case, it could not support the US dollar. Therefore, the upward movement of the euro/dollar pair (which means the fall of the dollar and the growth of the euro currency) could be caused by a technical correction, a weak report on applications for benefits, or both. As for the overall fundamental background, it has not changed much in recent days. Democrats and Republicans continue to negotiate a new package of economic assistance to the unemployed and small businesses, relations between China and the United States continue to deteriorate, and the scale of the pandemic in America remains high. Thus, if the current positions of the pair were led by a US fundamental background (absolutely negative), then it has not changed recently. Six business activity indices in the manufacturing and services sectors will be published at once on August 21, Friday, in America and the European Union. These indices reflect the activity of purchasing managers and business conditions in the areas of economics. As a reminder, any reading above 50 is considered positive. All six indices have higher than 50.0 past values as well as higher forecasts. Moreover, after the severe fall of both economies, a recovery has now begun, which means that all business activity indices are simply obliged to go up. Accordingly, market participants can be disappointed only if one or more indices are unexpectedly below 50.0. In this case, pressure on the currency of this country may begin. The following scenarios are possible on August 21: 1) Longs on the pair are currently not relevant, since the price has overcome the upward trend line. Thus, now buyers need to wait for a new upward trend to form. You need to wait until new trend patterns have been constructed or cancel the corresponding descending patterns. Since the latter are not available at this time, it is not necessary to expect buy signals in the near future. 2) Sales of the currency pair are more relevant at this time, since the breakdown of the trend line was not false. Thus, we recommend waiting for the MACD indicator to turn down and then open new sell orders with the goals of 1.1794 and 1.1751. The closer to the zero mark the MACD indicator turns down, the less the indicator will be late to react. What's on the chart: Support and Resistance Levels are the levels that serve as targets when buying or selling the pair. You can place Take Profit near these levels. Red lines are the channels or trend lines that display the current trend and show in which direction it is preferable to trade now. Up/down arrows show where you should sell or buy after reaching or breaking through particular levels. MACD indicator (10,20,3) consists of a histogram and a signal line. When they cross, this is a signal to enter the market. It is recommended to use this indicator in combination with trend lines (channels and trend lines). Important announcements and economic reports (you can always find them in the news calendar) can seriously influence the trajectory of a currency pair. Therefore, at the time of their release, it is recommended to trade as carefully as possible or exit the market in order to avoid a sharp price reversal. Beginners in the Forex market should remember that not every single trade should be profitable. The development of a clear strategy and money management are the key to success in trading over a long period of time. The material has been provided by InstaForex Company - www.instaforex.com |
| EUR/USD. Dollar's fragile position and deceptiveness of the China issue Posted: 20 Aug 2020 01:44 PM PDT The downward momentum of the EUR/USD pair faded in the middle of the 18th figure. Now traders are faced with a difficult choice, given the contradictory fundamental picture. Neither the bears nor the bulls of the pair have enough weighty arguments to lure investors to their side. As a result, the price stands still waiting for the next news impulse. What happened? As a rule, one of them dominates all news items during the day - whether it is a macroeconomic report or a comment by a politician/official. But now the market has a different situation, more complicated from the point of view of fundamental analysis. The market receives a lot of contradictory information that confuses traders and analysts. This explains the flat for the EUR/USD pair – in contrast to positive news, negative news comes and vice versa. In general, the focus of the market is now on US-China relations. And if at the beginning of the week the dollar was losing ground amid the strengthening of anti-Chinese rhetoric on the part of US President Donald Trump, then yesterday the situation turned 180 degrees. The fact is that, according to authoritative news resource Bloomberg, the United States and China are still preparing for joint negotiations, although they do not advertise this in the public plane. It is worth recalling here that literally the day before yesterday, Trump made a loud statement that he refused to negotiate with Beijing. Along the way, he again accused China of spreading the coronavirus (negligent attitude to the epidemic), saying that he "does not want to talk to this country." But, as it turned out a little later, in fact, the White House not only wants to conduct a dialogue with China, but is already in the stage of "building bridges." According to Bloomberg sources, representatives of the countries are holding consultations, paving the way for negotiations at a higher level. Moreover, today representatives of the Ministry of Commerce of China indirectly confirmed these rumors, saying that "both sides are in favor of continuing the dialogue, which will resume very soon." And although he did not speak about any specific dates, what was said was enough for the dollar to restore its positions throughout the market. This fundamental factor is clearly on the side of the US currency. But all other factors put pressure on the greenback in one way or another. For example, today's release on the data on the US labor market turned out to be worse than predicted values. First of all, we are talking about the increase in the number of initial applications for unemployment benefits. This indicator has been steadily declining for 11 weeks starting in May, reflecting the recovery in the US labor market. But then the weekly indicators began to come out in disarray, often exceeding the forecast values. This is what happened today: according to forecasts, the number of initial applications should have increased by 930,000. But in reality, the indicator jumped by 1,106,000. Let me remind you that the last Nonfarm data pleased the dollar bulls - the number of people employed in the non-agricultural sector increased by 1,763,000 (with a forecast of growth of 1.5 million). The unemployment rate also fell to 10.3%. But here it is worth noting that Nonfarm are two weeks behind the reports on claims for unemployment benefits. Therefore, given the dynamics of these reports, the August figures for Nonfarm could be disappointing. In addition, the manufacturing index of the Fed-Philadelphia was also published today, which also turned out to be in the red zone (a slowdown was recorded to 17 points from the previous 21-point value). In addition to macroeconomic reports, the dollar is also under pressure from the domestic political situation in the United States, in the context of the adoption of a long-suffering bill to provide additional assistance to the country's economy. Here, the information is also contradictory: according to some representatives of the White House, talks have finally reached an impasse. According to other representatives of the administration, the parties can still sit down at the negotiating table. At the moment the pendulum has swung towards a negative scenario: apparently, the bill will not be agreed until at least September. Yesterday, there was hope that Democrats would support a truncated version of this bill, but later representatives of the Democratic party flatly refused such a proposal. How to trade? As you can see, the fundamental background for the euro-dollar pair is contradictory. And yet, in my opinion, the pair retains the potential for its further growth. The fact is that the US currency is now being kept afloat mainly due to the Chinese issue. Rumors that the parties may resume negotiations in the near future are supporting the dollar bulls. But the fact of the matter is that information about this is either unofficial, or semi-official - from the Chinese side. The White House, including Trump, are voicing anti-Chinese rhetoric amid the dire coronavirus crisis. In my opinion, Trump will adhere to such tactics until the end of the presidential race. And this means that in the foreseeable future he will again voice aggressive rhetoric against China (for example, in the context of sanctions against Alibaba). In this case, dollar bulls will lose an advantage, and buyers of EUR/USD will be able to regain their lost positions. This means that longs can be viewed from current positions with the first target at 1.1930 (the upper line of the Bollinger Bands indicator on the daily chart). The material has been provided by InstaForex Company - www.instaforex.com |
| USD to resume weakness after brief pause? Posted: 20 Aug 2020 09:57 AM PDT Let's sum the recent developments of the US dollar index. It was losing ground across the board in June which was followed by consolidation in July. In the same month, the index sank below 93. Now the USDX is consolidating at around 93. The Fed's minutes released yesterday propped up its consolidation at the level above 93. Let's try to figure out what is actually going on: a pause or a trend reversal. Obviously, it was yesterday's publication of the Fed's minutes that influenced the dynamics of the US dollar. The thing is that it began to strengthen at the beginning of the American session. Some market participants think that bearish sentiment in the American stock market and an increase in yields on US Treasuries account for the greenback's growth. An auction of new 20-year government bonds with a placement volume of $ 25 billion could have also played a role here. Hm ... It makes sense. So, on Wednesday, the oversold greenback posted the biggest daily gain since March. This afternoon, the dollar index was trading mostly sideways with brief spikes. It opened the evening session at just above 93 points with prospects for further growth. Both the long-term and medium-term outlook for the US dollar is bullish. The recovery of the greenback is also supported by the negative dynamics of stock indices and the energy market. In this context, it would be a good idea to consider long deals on the US currency. Nevertheless, investors doubt that dollar bulls will be forceful enough to rule the market for long. No extra fiscal measures have been introduced yet. When it comes to the new package of financial aid, market participants are pondering over the stimulus size. They reckon the package is likely to be 1 trillion dollars. If the predictions come true, a new wave of dollar selling will hit the market. Labor statistics are in the spotlight on Thursday. Last week the US Labor Department reported that the recovery of the labor market in the country was gaining momentum, the number of initial applications for unemployment benefits fell below 1 million to 963 thousand. This was a positive factor for the stock market and the dollar. Some traders were still worried about the sustainability of the labor and stock market recovery, and they were right. Today, the Labor Department announced an increase in initial applications for unemployment benefits by 135 thousand last week. Thus, the indicator again crossed the round figure of 1 million, which caught the markets off guard. Uncertainty about the future movement of the stock market and the dollar remains due to the ongoing negative impact of the coronavirus on the economy. This, in turn, creates conditions for higher volatility in financial markets. When it comes to the most popular currency pair, EUR/USD fell sharply on Wednesday amid an advance of the US dollar. On Friday, when PMIs are published for the manufacturing and services sectors, everything may change. According to forecasts, PMIs in European countries will come out with scores above 50. The higher they rise, the more it will strengthen the euro. On the whole, EUR/USD is likely to continue the overall uptrend. |
| Comprehensive analysis of movement options for #Bitcoin & #Ethereum (H4) on August 21, 2020 Posted: 20 Aug 2020 09:53 AM PDT Minute operational scale (H4) Cryptocurrencies in the last week of August - an overview of options for the development of the movement of #Bitcoin & # Ethereum (H4) on August 21, 2020. ____________________ #Bitcoin The movement of # Bitcoin from August 21, 2020 will occur depending on the development and direction of the breakdown of the range:
In case of breakdown of the upper border of ISL38.2 of the equilibrium zone of the Minuette operational scale forks - resistance level of 11795.00 - the development of the #Bitcoin movement within the boundaries of the 1/2 Median Line Minuette channel (11750.00 - 11910.00 - 12070.00) will be confirmed with the prospect of the continuation of the movement of this cryptocurrency already within the boundaries equilibrium zones (12070.00 - 12415.00 - 12750.00) of the Minute operational scale forks. In case of breakdown of the lower border of the 1/2 Median Line Minuette - support level 11750.00 - #Bitcoin movement will continue within the equilibrium zone (11796.00 - 11615.00 - 11425.00) of the Minuette operational scale forks with the possibility of reaching the initial SSL line (11100.00) of the Minute operational scale forks and updating local minimum 11083.00, and as an option - continuation of the downward movement of this instrument to the boundaries of the 1/2 Median Line Minute channel (10830.00 - 10606.00 - 10380.00). Details of the movement of #Bitcoin from August 21, 2020 can be seen on the animated chart.
____________________ #Ethereum The development of the #Ethereum movement from August 21, 2020 will also be determined by the development and direction of the breakdown of the range:
Breakout of ISL38.2 Minuette - support level 408.68 - a variant of the development of the #Ethereum movement within the boundaries of the equilibrium zones of the operational scale forks - Minuette (408.68 - 397.50 - 386.00) and Minute (394.00 - 377.00 - 359.50). If the resistance level of 414.00 is broken, the development of the #Ethereum movement can be continued in the 1/2 Median Line channel (414.00 - 422.00 - 430.00) of the Minuette operational scale fork with the prospect of reaching the initial SSL line (443.50) of the Minuette operational scale fork and updating the maximum 447.36. Details of the #Ethereum movement options from August 21, 2020 are shown in the animated chart.
____________________ The review is compiled without taking into account the news background, the opening of trading sessions of the main financial centers and is not a guide to action (placing "sell" or "buy" orders). The material has been provided by InstaForex Company - www.instaforex.com |
| Bitcoin gradually moving higher Posted: 20 Aug 2020 07:02 AM PDT Greetings to all crypto enthusiasts! Two weeks have passed since our last publication, and bitcoin has already tested new highs of this year. Hype around the cryptocurrency is bringing more and more fresh investments into the crypto industry. Today, we are going to talk about the best investment strategy when working with crypto assets. We will also see what bitcoin traders are guided by and how experienced players behave. We have been dealing with crypto industry for quite a long time, but most traders still do not have a clear strategy and understanding of the market. Let's consider several investment strategies. The first and most profitable strategy is called HOLD which implies holding the asset for a long time. Even when bitcoin first appeared, it was possible to buy several thousand BTC for just $10. Now the price has surged to more than $11,000 per unit. At the beginning of 2017, it was possible to buy bitcoin for $1,000, and today you could have a profit of more than 1,000%. This is the main point of the HOLD trading strategy. The HOLD strategy has high prospects for income, but the selected asset should meet the requirements needed for a long-term investment. One of the key criteria for selecting an asset suitable for the HOLD strategy is the prospects of its future demand. Over the entire period of the crypto industry, tens of thousands of crypto coins have been created. However, only some of them gained popularity among investors. It is important to evaluate the activity of the company which issued this particular crypto asset. You should pay attention to whether the company is actively developing and how it is integrating its coin in the community. Life hack You should also pay attention to the way in which the crypto community is interacting with the stock exchanges. The first in space is the first on the Moon. The №1 cryptocurrency bitcoin will always have a special status. This is why bitcoin has a strong foundation for development which is being constantly improved and it is already integrated into the community. All this makes bitcoin a perfect HOLD asset. Many experienced traders prefer to follow this strategy. For example, quite recently a large business analytics company MicroStrategy, whose shares are listed on the Nasdaq exchange, invested $250 million in bitcoin, having bought about 21,454 BTC. "Our investment in Bitcoin is part of our new capital allocation strategy that aims to maximize long-term value for our shareholders," said Michael J. Sailor, CEO of MicroStrategy Incorporated. According to the US Securities and Exchange Commission (SEC), investment company Pantera Capital and its bitcoin-focused Pantera Venture Fund III have raised about $164 million over the past 12 months. And this is the money of huge institutional investors which means that suggests that interest in cryptocurrency is gaining momentum. The second strategy is of a local nature and is called HYPE. This is a surge in popularity that leads to a sharp change in the value of an asset during a given hype period. Currently, all the hype is going around Decentralized Finance (DeFi) which has logged $6.34 billion in DeFi services in several months. Let me explain how it works. Community members invest into newly created DeFi projects, and in return they receive new coins. The coins instantly show an income of 100%, 200%, 800%, 1,000% as soon as they are listed on the exchange. A good example is the DeFi yEarn Finance project, an aggregator platform that collects the best offers from the crypto market on a landing page. The users of this application make a deposit and receive a fixed income on their deposit. In order to deposit funds on the yEarn Finance account, the users need to convert their currency into a local currency, the so-called token (YFI), which will be used inside the service. Basically, the company itself and its coin have no value. But thanks to the hype around DeFi and the listing of the YFI token on popular cryptocurrency exchanges, the value of one YFI coin has reached unprecedented highs. In just one month after it was issued, YFI surged from $35 to $12,900 (!!!). HYPE + SPECULATIONS = JACKPOT This kind of record profitability spurs more interest in cryptocurrency and brings massive inflow of new funds. Notably, the existing crypto projects, as well as just newly created ones, may declare that they are also engaged in DeFi , and the value of their tokens will soar. With the HYPE strategy, it is difficult to fail. Later on, the coins with record-high profitability turn into more stable assets such as bitcoin. The HYPE strategy is a local phenomenon, and sooner or later it will lose its steam. This happened to ICO and IEO. It is important to take profit in US dollars or in the most stable crypto instruments BTC. Bitcoin's current trend and forecasts After a two-week fluctuation of BTC price within $11,000 and $12,000, market participants managed to hit new local highs. So the value of bitcoin jumped to $12,486 and confirmed that the bullish momentum will continue in the future. The level of $13,868 remains the main target for many investors. This was the high of 2019. When the price tests the level of $13,868, it will be clear where the market will move next. It is possible that within the uptrend bitcoin will break above $13,868 and send the quotes to new highs. Background for crypto market Looking at the total market capitalization of the crypto industry, we can observe the long-awaited event. Finally, the total market capitalization exceeded the high of $366 billion in 2019 and rose to $367 billion in 2020. This indicates a strong bullish trend which pushes the value of the first cryptocurrency, as well as of all other altcoins, to record highs. If we look at the chart showing volumes, we can see that the total market capitalization has been growing since in 2018 in the following way: $472 billion, $571 billion, $834 billion. Bitcoin Fear and Greed Index is currently showing 75 points, which indicates a high level of interest in crypto assets. On August 11, the index settled at 84 points. However, the peak of 2019 – 90 points – has not yet been surpassed. Indicator analysis Now let's have a look at the different sectors of time frames (TF). On H4 time frame we can see that technical indicators give a sell signal after the pullback of the price. Yet, on the daily and weekly time frames we can see a clear buy signal which is confirmed by the general sentiment in the crypto market. The material has been provided by InstaForex Company - www.instaforex.com |
| Gold continues to rally, sees positive prospect Posted: 20 Aug 2020 06:55 AM PDT
The price of gold remained practically unchanged on Thursday. Even the minutes of the July meeting of the US Federal Reserve System, which caused such confusion in the stock markets, did not affect it. The said document contains information on how the US economy has been seriously affected by the coronavirus pandemic and that the country's recovery will be long and difficult. The gold went on correction on Wednesday, which, however, has not worsened today. Although the drop in the environment was already quite noticeable by 3% of the previous value. The US authorities, including the Federal Reserve officials, believe that it is necessary to maintain monetary stimulus in the country for quite a long time to support the economy and cope with the crisis. Meanwhile, the price of gold slightly increased by 0.01% on Thursday. Its current level is at around $ 1,929.69 per troy ounce. The support level for the precious metal was around $ 1,930.50 per troy ounce, while resistance was at $ 2,024.60 per troy ounce. The FRS protocol led to the fact that sales in the market began to rise sharply. In this regard, it can be assumed that gold again has a great chance to strengthen its positions and move to the next strategic level of $ 2,500 per troy ounce. Now, for the most part, everything will depend on where the US dollar moves, as well as how the yield on debt securities will change. Silver futures contracts for September delivery rose 0.37% reaching $ 27,240 per troy ounce. Palladium, on the other hand, declined 0.17%, and the new price is at $ 2,152.76 per ounce. Platinum also went negative on Thursday and sank 0.79%. Its current level is $ 924.35 per ounce. Copper futures for September delivery fell 0.46% to trade at $ 2.9855 a pound. The material has been provided by InstaForex Company - www.instaforex.com |
| Evening review on August 20, 2020 Posted: 20 Aug 2020 06:40 AM PDT
EURUSD The data on employment in the United States showed that long-term unemployment currently amounts to 14.84 million. This is significantly better than the forecast. Meanwhile, the number of unemployment benefit applications for the week is 1.106 million. You may consider purchases from 1.1870. Sell from 1.1710. The material has been provided by InstaForex Company - www.instaforex.com |
| August 20, 2020 : GBP/USD Intraday technical analysis and trade recommendations. Posted: 20 Aug 2020 06:11 AM PDT
In the period between April and June 2020, the GBPUSD has been moving sideways within the depicted consolidation range extending between (1.2265 - 1.2600) Transient bearish breakout below 1.2265 (consolidation range lower limit) was demonstrated in the period between May 13 - May 26, denoting some sort of weakness from the ongoing bullish trend. However, immediate bullish rebound has been expressed around the price level of 1.2080 bringing the GBP/USD back towards 1.2780 (Previous Key-Level) where another episode of bearish pullback was initiated. Short-term bearish movement was expressed towards 1.2265 where Significant bullish rejection was originated bringing the GBP/USD pair back towards 1.2780 where the mid-range of the depicted wedge-pattern failed to offer enough bearish rejection. Intermediate-term Technical outlook for the GBP/USD pair remains bullish as long as bullish persistence is maintained above 1.2780 (Depicted KeyLevel) on the H4 Charts.On the other hand, the pair looks overbought after such a quick bullish movement. Hence, upcoming bearish reversal shouldn't be excluded provided that early bearish breakout occurs below 1.2980 (the depicted wedge pattern upper limit). Trade recommendations : Technical traders are advised to wait for any upcoming bearish breakdown below 1.2980 as a valid SELL Entry. Initial T/p level is to be located around 1.2780. On the other hand, bullish persistence above 1.2980 invalidates this trading scenario. The material has been provided by InstaForex Company - www.instaforex.com |
| August 20, 2020 : EUR/USD Intraday technical analysis and trade recommendations. Posted: 20 Aug 2020 06:09 AM PDT
On March 20, the EURUSD pair has expressed remarkable bullish recovery around the established bottom around 1.0650. Shortly after, a sideway consolidation range was established in the price range extending between 1.0770 - 1.1000. On May 14, evident signs of Bullish rejection as well as a recent ascending bottom have been manifested around the price zone of (1.0815 - 1.0775), which enhances the bullish side of the market in the short-term. Bullish breakout above 1.1000 has enhanced further bullish advancement towards 1.1150 then 1.1380 where another sideway consolidation range was established. Hence, Bearish persistence below 1.1150 (consolidation range lower limit) was needed to enhance further bearish decline. However, the EURUSD pair has failed to maintain enough bearish momentum to do so. Instead, the current bullish breakout above 1.1380-1.1400 has lead to a quick bullish spike directly towards 1.1600 (Fibonacci Expansion 78.6% level) which failed to offer sufficient bearish pressure. That's why, further bullish advancement pursued towards 1.1730 (Fibonacci Expansion 100% level) which failed to offer sufficient bearish rejection for a few days until Today. Bullish persistence above 1.1730 will probably favor further bullish advancement towards 1.2075 (161% Fibo Expansion Level) in the intermediate-term. On the other hand, bearish re-closure below 1.1730 indicates lack of bullish momentum and enhances further bearish decline initially towards 1.1600. Trade recommendations : Conservative traders should wait for the current bullish movement to pause and get back below 1.1730 as an indicator for lack of bearish momentum for a valid SELL Entry.T/P levels to be located around 1.1600 and 1.1500 while S/L to be placed above 1.1800 to minimize the associated risk. The material has been provided by InstaForex Company - www.instaforex.com |
| Analysis of GBP/USD on August 20 Posted: 20 Aug 2020 05:59 AM PDT
The wave structure of the upward section of the trend, which began on March 20 and took the form of a triple zigzag, required adjustments and additions. A successful attempt to break the previous maximum led to a complication of the internal wave structure of the wave Z. Now the waves a-b-c are still visible inside this wave, however, the wave C takes a more complex five-wave form. If this is true, then the increase in quotes will continue for some time within the wave 5, C, Z. At the same time, the construction of an upward section of the trend is in any case nearing its completion.
If we look at the current wave pattern in more detail, we can see that the upward section of the trend and, in particular, the wave Z can already be completed due to yesterday's departure of quotes from the reached highs. However, in the past few months, demand for the US currency has been extremely low, and if it continues to be so, the wave 5, C, Z may take an even more complex and extended form. Unfortunately, from the current positions, the instrument can go down and start building a new downward section of the trend, or it can endlessly complicate wave 5. Nevertheless, a successful attempt to break the minimum of the expected wave 4, C, Z will indicate the readiness of the markets to lower the instrument. The news background for the pound/dollar instrument on Wednesday was not strong. The report on inflation in the UK was quite strong, exceeded the expectations of the markets almost twice, and thanks to it, the British pound fell down. This is the market reaction to the optimistic report. Also yesterday, it was reported that Republicans and Democrats are holding secret talks on a new package of financial assistance for the American economy. Why secret or, at least, not advertised - it is unclear. It is this point that suggests the absurdity of such an assumption. However, some economists believe that this information was the reason for the strong growth of the US dollar. I will allow myself to disagree with them, since the information is too weak for both European currencies to collapse by 100-150 points on completely unconfirmed facts. Let me remind you that when the US Congress and the Fed approved trillion-dollar stimulus packages, there was no such strong market reaction. And then there was official information, not rumors. I believe that the reasons for the growth of the dollar lie in the fact that the wave marking has long assumed the completion of the upward section of the trend. Sooner or later, the markets had to reduce the demand for European currencies, which may have happened yesterday. Now you need to update the low of wave 4, then the probability of further decline in the instrument's quotes will increase. General conclusions and recommendations: The pound/dollar instrument resumed building the upward wave Z and could immediately complete it. Thus, I would recommend now to buy the instrument with the goals located near the estimated mark of 1.3368, which is equal to 200% for Fibonacci, for each signal of the MACD up, but at the same time, I still believe that the entire upward section of the trend is nearing its end. If this is true, then buying now is too risky. The material has been provided by InstaForex Company - www.instaforex.com |
| Posted: 20 Aug 2020 05:54 AM PDT In the most global sense, the wave counting of the EUR/USD instrument has undergone certain changes in recent days. If earlier, I hoped that the upward trend section would not become more complex, then a successful attempt to break through the previous high led to the fact that the wave counting required adjustments. Thus, the supposed wave 4 took on a pronounced three-wave form, and the instrument proceeded to building wave 5 at 5 at 3 or C, which at the moment may already be completed, since the breakout of the previous maximum took place. This means this wave can complete its construction in some moment. The wave counting on a smaller scale refines the data obtained from a higher scale. An attempt to break through the peak of the supposed wave 3 turned out to be successful, but as mentioned above, wave 5 can now end at any moment. At the same time, the quotes of the instrument may continue to rise if the wave 5 in 5 in 3 or C takes a complex and extended form. That is, in spite of the fact that the current wave counting looks quite complete again and now presupposes the construction of a correction wave 4, the instrument can easily resume an upward movement. On Wednesday, August 19, the European Union became aware of the consumer price index for July, which amounted to -0.4% m / m and 0.4% y / y. These numbers are extremely weak, however, in accordance with the wave counting in the first half of the day, the euro continued to rise. But in the afternoon, a landslide began. The instrument had already lost about 70 points by the evening. Thus, the release of "minutes" by the FRS cannot be the reason for the growth of the US dollar. Moreover, the very tone of the "minutes" was not positive. Monetary committee members acknowledged that a new monetary stimulus is likely to be needed to restore the economy. To simply put it, the Fed or Congress will have to inject additional hundreds of billions and trillions of dollars into the economy so that it continues to recover and does not slow down. Furthermore, All members of the monetary committee acknowledged that the future of the American economy is entirely dependent on the COVID-19 epidemic, on new waves of the pandemic, on the success of the fight against the epidemic and on government actions. Thus, the future of the economy is not thoroughly determined, such is the main result of the FRS minutes. There will be no important events or reports in the European Union on Thursday. In America, there is only a report today - on claims for unemployment benefits, which is unlikely to attract the attention of the markets. Thus, nothing should prevent the US currency from continuing to grow. However, I cannot assume that the upward trend has completed its construction until the successful attempt to break the low of the supposed wave 4. General conclusions and recommendations: The euro/dollar pair resumed the construction of the assumed global wave 3 or C. Thus, at this time, I recommend new purchases of the instrument with targets located near the calculated level of 1.2089, which corresponds to 323.6% Fibonacci, for each MACD signal up. At the same time, wave 5 in 5 in 3 or C can end literally at any moment (or already be completed), then the construction of a correctional wave 4 or a new downward trend section will begin. The material has been provided by InstaForex Company - www.instaforex.com |
| Trading plan for GBPUSD for August 20, 2020 Posted: 20 Aug 2020 05:46 AM PDT
Technical outlook: GBPUSD also reversed sharply lower following the FOMC minutes yesterday after printing highs around 1.3267 levels. It has carved an intermediary bottom around 1.3064 today, before pulling back higher. The Cable pair is seen to be trading at near 1.3136 at this point in writing and might be looking to retrace after yesterday's drop. Immediate resistance is now in place around 1.3267, while support remains around 1.3000/10 levels respectively. A break below 1.3000 will confirm that bears are back in control and a meaningful top is in place around 1.3267 respectively. GBPUSD should be looking to carve lower lows and lower highs until prices stay below 1.3267, going forward. Trading plan: Remain short, stop @ 1.3300, target is open. Good luck! The material has been provided by InstaForex Company - www.instaforex.com |
| Trading plan for US Dollar Index for August 20, 2020 Posted: 20 Aug 2020 05:33 AM PDT
Technical outlook: US Dollar Index seems to have finally bottomed around 92.15 levels. The index reversed sharply following the FOMC minutes and managed to produce an Engulfing Bullish candlestick pattern on the daily chart. This might indicate a potential trend reversal, going forward. The index is seen to be trading close to 92.95 levels at this point in writing and it should be poised to push towards 93.40/50 mark either today or tomorrow. It should be a good idea to buy on dips thereafter. Also note that the bullish pattern has been produced around fibonacci 0.618 retracement levels of the previous rally between 88.50 and 103.00 respectively. Immediate resistance is seen through 103.00 and bulls might be inclined to break higher. Trading plan: Remain long, stop @ 92.00, target @ 98.00 at least. Good luck! The material has been provided by InstaForex Company - www.instaforex.com |
| Trading plan for EURUSD for August 20, 2020 Posted: 20 Aug 2020 05:17 AM PDT
Technical outlook: EURUSD finally reversed from 1.1965 levels yesterday. The single currency pair is seen to be trading at around 1.1847 at this point in writing and should be looking to continue lower towards 1.1780 today or tomorrow. Also note that bears have managed to produce an Engulfing Bearish candlestick pattern on the daily chart, indicating potential reversal ahead. Furthermore, the reversal has occurred around fibonacci 0.618 retracement zone of the earlier drop between 1.2555 and 1.0636 respectively. Keeping all the above facts in mind, it would be safe to continue selling on rallies until prices stay below 1.1965 levels. Trading plan: Remain short @ 1.1850 and add further around 1.1900/20, stop above 1.1965 and target below 1.1200. Good luck! The material has been provided by InstaForex Company - www.instaforex.com |
| Global stock markets went on sudden correction Posted: 20 Aug 2020 05:14 AM PDT
Asian stock markets declined in almost all major areas on Thursday, followed by the US where there was also a fairly significant recession, and deterioration of investor sentiment. Market participants were unpleasantly surprised by the final minutes of the meeting of the US Federal Reserve System which took place at the end of July. The document presents very gloomy prospects for the country's economic recovery and its further growth. According to the document, the authorities believe that the coronavirus pandemic will seriously affect the economic development of the country, and its consequences have yet to be seen in full in the future. In general, the medium term will be associated with a fairly large number of risks, which will be difficult to cope with. Japan's Nikkei 225 Index dropped 1%. China's Shanghai Composite Index declined even more by 1.17%. The Hong Kong Hang Seng Index followed this negative trend and shed 2.07%. The main regulator of the country - the People's Bank of China - decided to keep the base interest rates at 3.85%. The PBC has kept everything as it is for the fourth time in a row, although it was previously reduced by 20 basis points to revive the economy of the country badly affected by the crisis caused by the coronavirus pandemic. South Korea's Kospi Index became the leader in the fall in the Asian region: it sank 3.22% at once. Australia's S & P / ASX 200 index declined moderately by 0.8%. The US stock markets, on the other hand, closed Wednesday's trading depressingly after the publication of the minutes of the Federal Reserve meeting, which did not at all satisfy the expectations of market participants. The Dow Jones Industrial Average closed Wednesday's trading with a drop of 0.31% or 85.19 points, which forced it to move to the level of 27,692.88 points. The Standard & Poor's 500 Index parted with 0.44% or 14.93 points. Its current level was 3,374.85 points. The Nasdaq Composite index fell by 0.57% or 64.38 points: its new level is at 11,146.46 points. Market participants focused on corporate news about the growth of some of America's big companies and then turned their attention to the thorny problem of the fiscal stimulus package, which has not been resolved. However, there has been some progress, and the political impasse may be overcome in the near future. Yet too much negativity and uncertainty came with the publication of the minutes of the July meeting of the US Federal Reserve. In particular, the document contains many references stating that the coronavirus crisin in the country will be quite difficult to overcome. Implementation of expanded economic support measures is necessary so that it can successfully cope with the difficulties and move on to recovery and growth. However, the document does not suggest specific measures, nor does it describe possible instruments of monetary policy that should be used to get out of the crisis. The situation is aggravated by the still absent decision on the new financial incentive program. However, Democrats and Republicans have at least made statements that they are ready to seek consensus. Another important problem is the conflict between Washington and Beijing, which has already led to the disruption of the negotiation process on a trade agreement between the countries. US President Donald Trump continues to accuse China of being responsible for the financial collapse that happened in the world against the backdrop of the COVID-19 pandemic. European stock exchanges also faced the same situation. On Thursday morning, a reduction in the main stock indicators was noted. The US Federal Reserve Protocol, containing an extremely gloomy prospect for the development of the US economy, was also met with hostility. The general index of large enterprises in the European region Stoxx Europe 600 fell significantly by 1.72%, which lowered it to 365.86 points. The UK FTSE 100 Index declined 1.56%. The German DAX index sank even more by 1.65%. The French CAC 40 index led the fall and lost 1.73%. Spain's IBEX 35 had to give up 1.62%. Investors in the European region also expect that the press will receive the minutes of the ECB meeting, which also took place back in July. However, after the Fed's protocol, the tension has seriously increased. Meanwhile, the news that China and the United States may meet in the near future and discuss the details of their trade agreement somewhat softens the situation. Note that negotiations on this issue were previously disrupted. In any case, the situation on stock exchanges is as unstable as the political and economic situation in the world. The material has been provided by InstaForex Company - www.instaforex.com |
| GBP/USD: plan for the American session on August 20 Posted: 20 Aug 2020 04:31 AM PDT To open long positions on GBPUSD, you need: In my morning forecast, I focused on buying in the support area of 1.3075 and recommended opening long positions from there if a false breakout is formed, which happened. Let's analyze the entry point. Look at the 5-minute chart: you can see how buyers are actively protecting the support level of 1.3075, forming a false breakout on it. But even if you did not manage to enter at the first signal, the downward movement and repeated testing of this level on the volume in the middle of the European session became another proof of the presence of large buyers in the market. As a result, the pair quickly returned to the resistance area of 1.3126, adding 50 points of profit to the piggy bank. How the bulls defended the closing level at 1.3075 is also clearly visible on the hourly chart. In the second half of the day, the entire focus is shifted to the resistance of 1.3126, which will be the main focus. Do not rush to buy from it at the first consolidation, since the market is still in a downward correction, and it is possible that the data on the US labor market will play on the side of sellers of the pound. If active sales from the area of 1.3126 do not occur after the data is released, and trading continues above this range, you can count on a strong bullish rebound to the maximum area of 1.3164 and 1.3212, where I recommend fixing the profits. In the scenario of a decline in GBP/USD in the second half of the day, you can still expect to buy from the minimum of 1.3075 or open long positions immediately on a rebound from the support of 1.3044 in the calculation of a correction of 30-40 points within the day.
To open short positions on GBPUSD, you need: The sellers tried, but nothing came of it. Now their task is to protect the resistance of 1.3126, from which there are also no active sales. Only the formation of a false breakout in this range after the release of strong fundamental statistics on the US labor market will be the first signal to open short positions. The main focus will be on the return of the pound to the opening level of the day and, at best, on updating its minimum in the area of 1.3075. The longer-term goal is the support of 1.3044, where I recommend fixing the profits. In the scenario of further growth of the pair, it is best to open short positions only on the rebound from the resistance of 1.3164, where the moving averages that play on the side of bears also pass. However, you should not expect a correction of more than 20-30 points from this level.
Signals of indicators: Moving averages Trading is conducted below the 30 and 50 daily averages, which indicates the continuation of a downward correction in the pair. Note: The period and prices of moving averages are considered by the author on the hourly chart H1 and differ from the general definition of the classic daily moving averages on the daily chart D1. Bollinger Bands Growth will be limited by the upper level of the indicator in the area of 1.3155, while the lower border in the area of 1.3060 will act as support. Description of indicators
|
| EUR/USD: plan for the American session on August 20 Posted: 20 Aug 2020 04:30 AM PDT To open long positions on EURUSD, you need: In my morning review, I paid attention to the high probability of protection of the support level of 1.1830, which happened. If you look at the 5-minute chart, you will see how the bears seem to have coped with their task and achieved a breakout and consolidation below the support of 1.1830, but even the test of this level from the bottom up, which became a good entry point into short positions, did not lead to a continuation of the downward correction. The formation of a false breakout at the level of 1.1830 has become a new entry point into long positions, and as long as the market remains above this range, there is a probability of an upward trend in the euro to the resistance area of 1.1884, where I recommend fixing the profits. The longer-term goal will be a maximum of 1.1920. If the bulls again miss the area of 1.1830, and this will most likely happen during the publication of data on the number of initial applications for unemployment benefits in the US, then it is best to consider new long positions from the support of 1.1784 or buy the euro immediately on the rebound from the minimum of 1.1746 in the calculation of a correction of 30-40 points within the day.
To open short positions on EURUSD, you need: In the second half of the day, sellers will probably try to pick up support for 1.1830 again today, but I recommend selling below this level only after the pair returns to this range again. In this case, we can expect a larger downward movement to the area of the minimum of 1.1784. Good data on the state of the American labor market may completely collapse the pair to the support of 1.1746, where I recommend fixing the profits. In the EUR/USD growth scenario, the bears will most likely declare themselves only after updating the major resistance of 1.1884, from which you can sell the euro immediately on the rebound, since the moving averages are also in this range, now playing on the side of the bears. If there is no activity at this level, short positions can be considered for a rebound from the resistance of 1.1920, based on a correction of 20-30 points within the day.
Signals of indicators: Moving averages Trading is conducted below the 30 and 50 daily moving averages, which indicates the continuation of the downward correction of the market. Note: The period and prices of moving averages are considered by the author on the hourly chart H1 and differ from the general definition of the classic daily moving averages on the daily chart D1. Bollinger Bands A break in the lower border of the indicator around 1.1784 will increase pressure on the euro. Growth will be limited by the upper level of the indicator in the area of 1.1884. Description of indicators
|
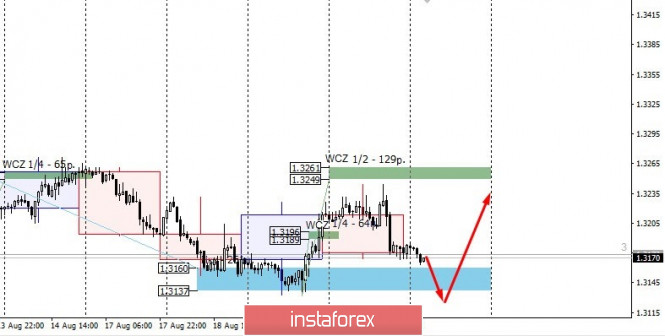
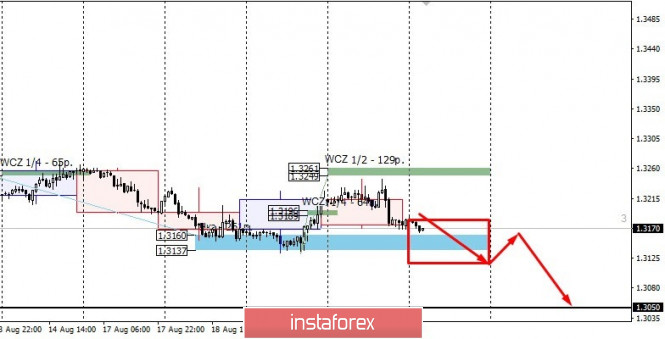
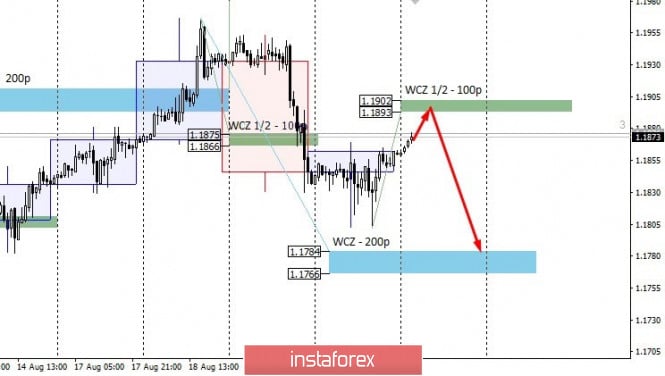
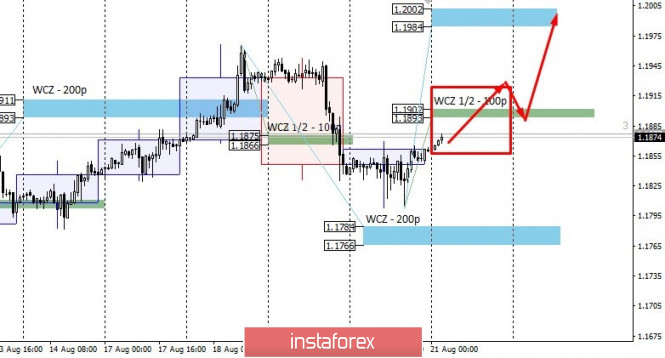
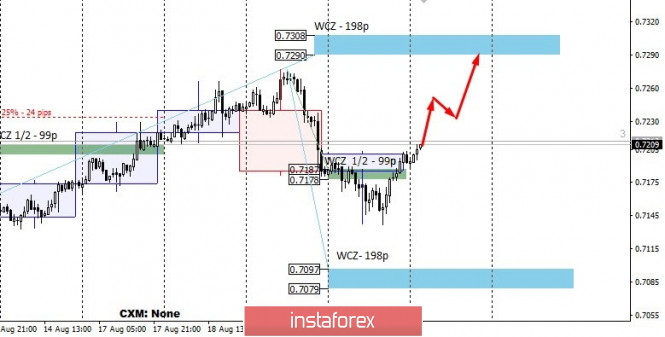
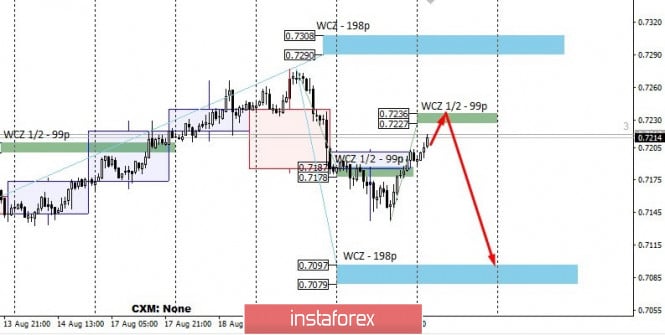
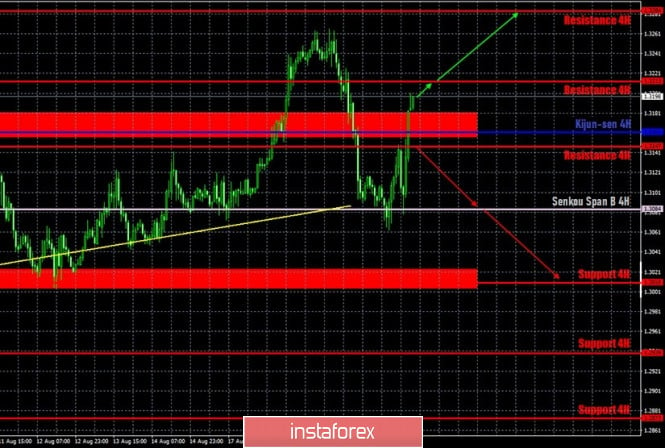
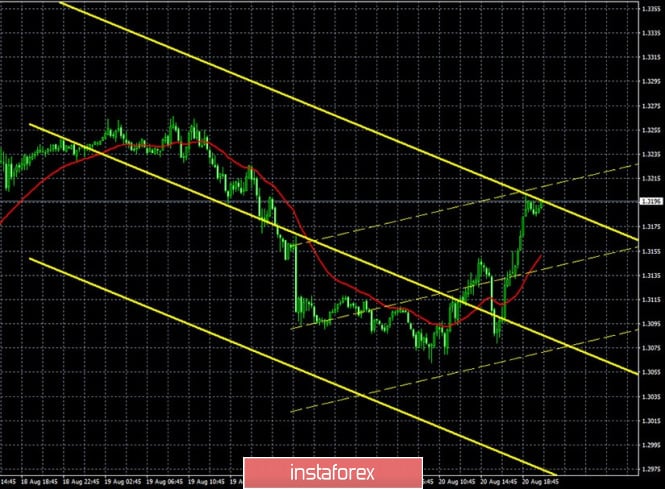
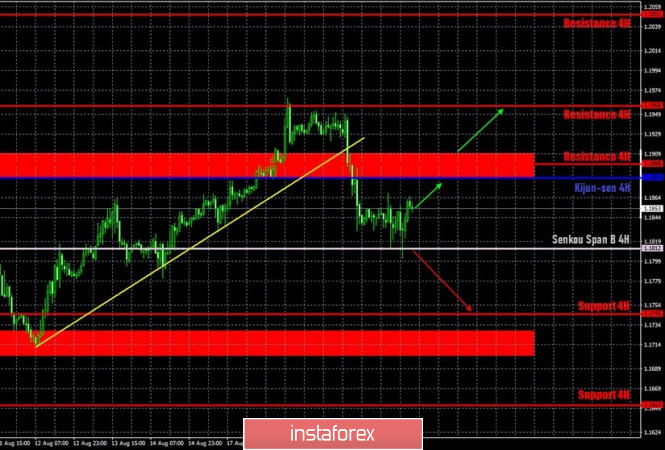
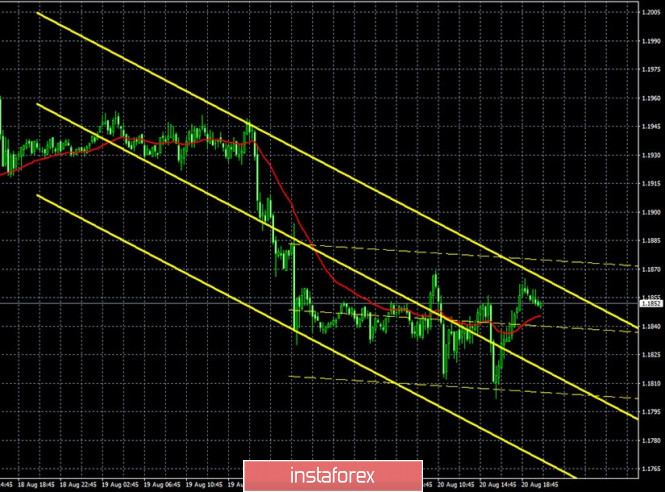
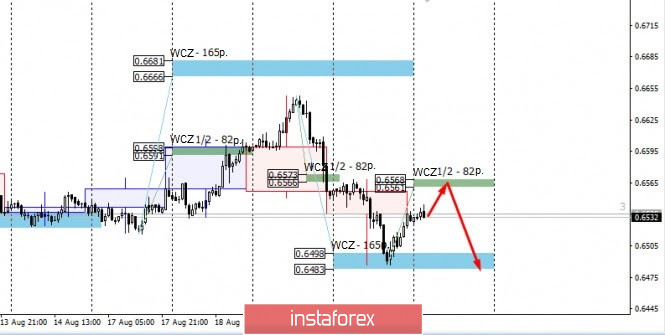
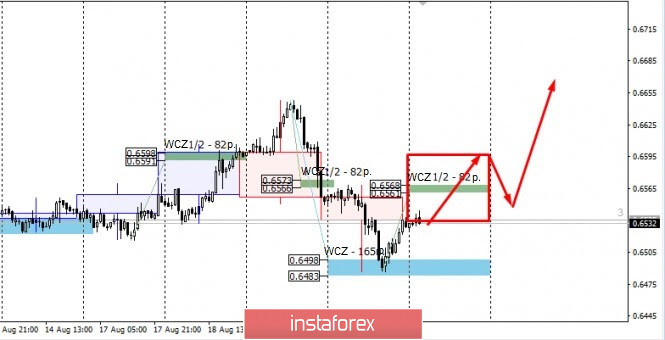
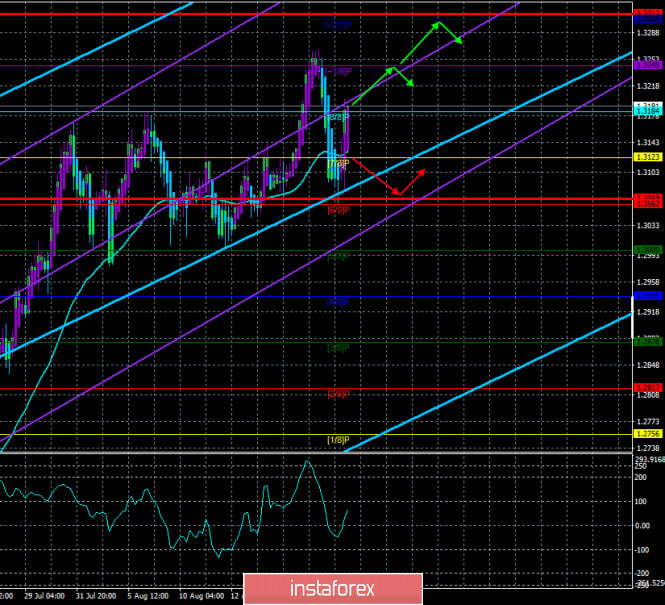
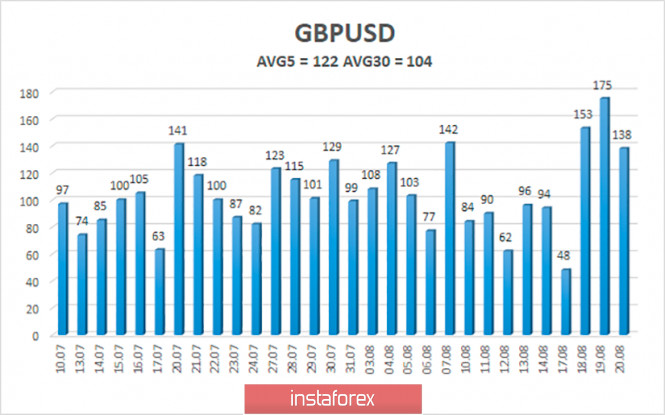
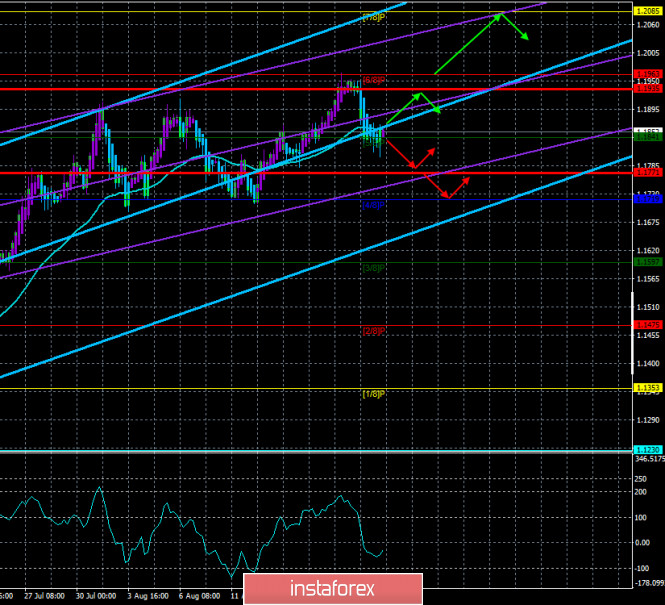
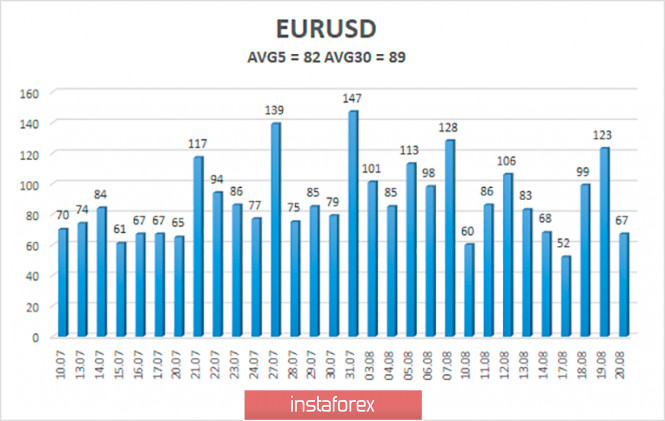
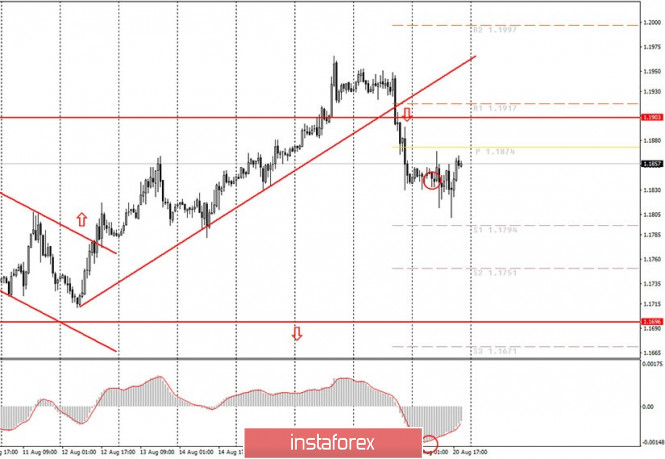


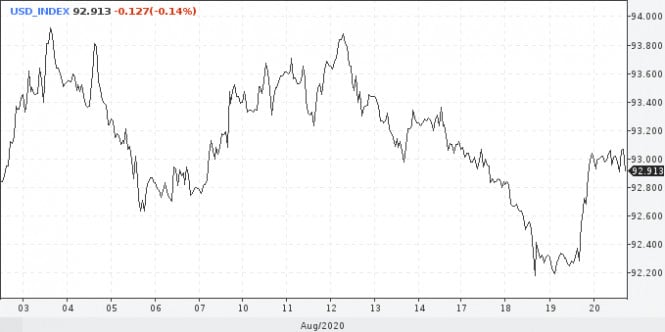
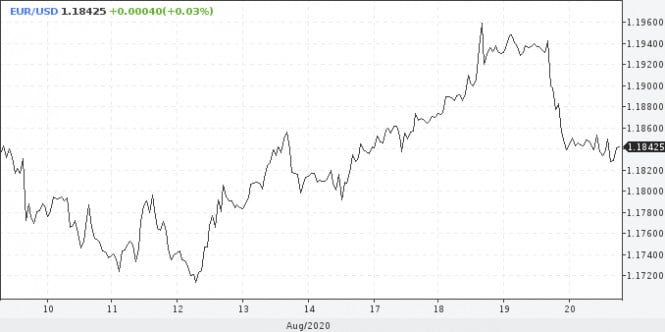
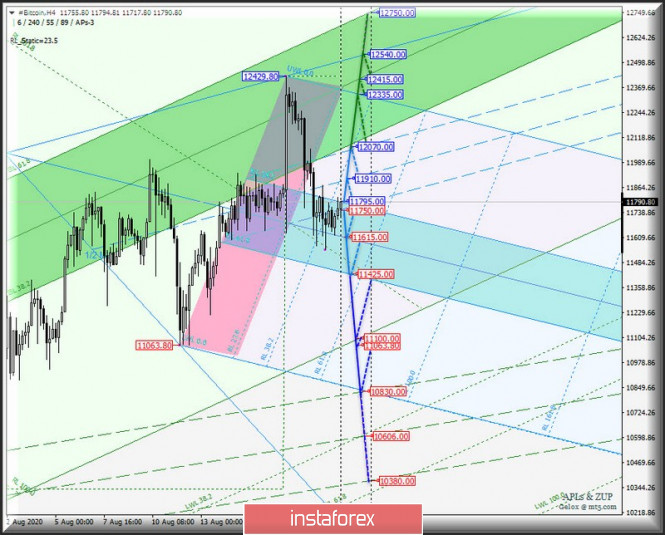
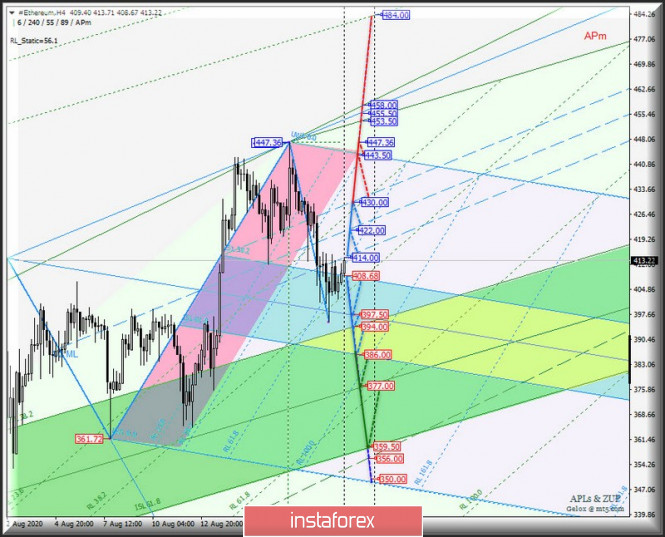

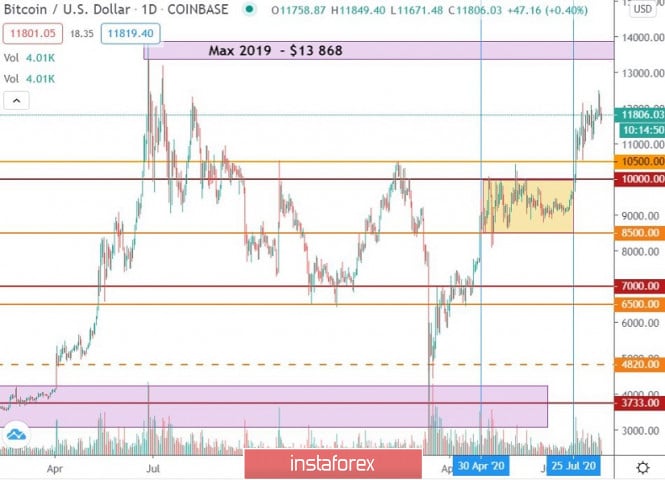
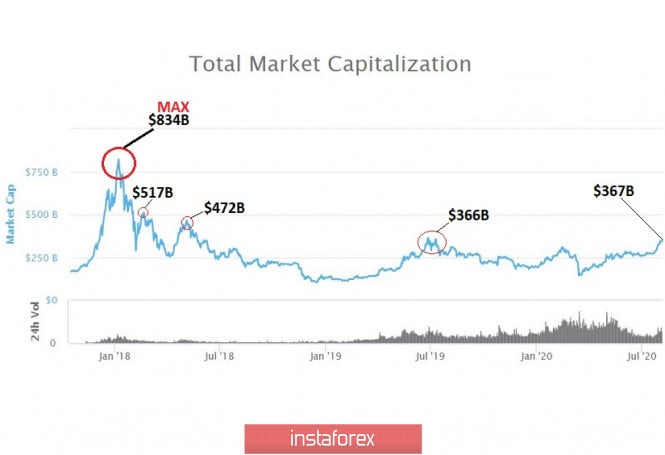
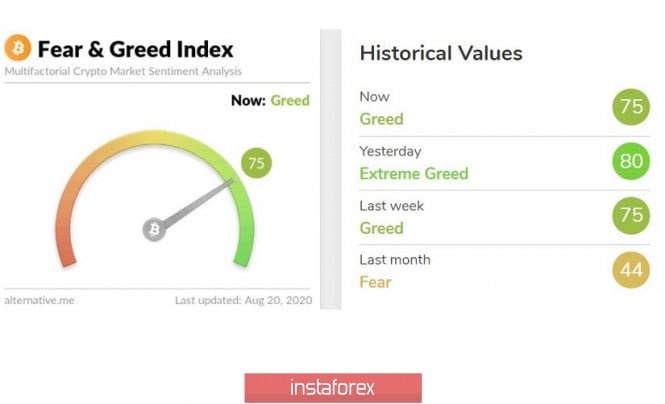

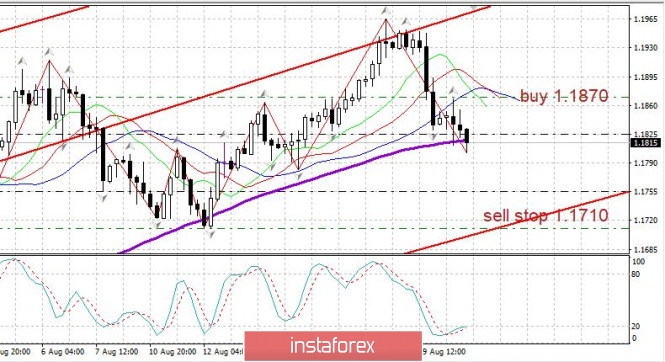
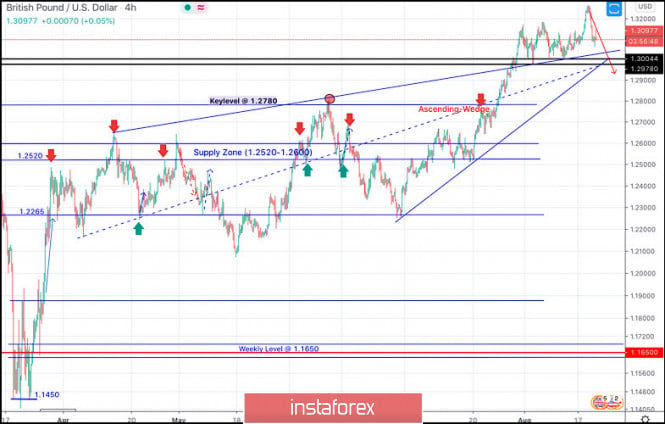
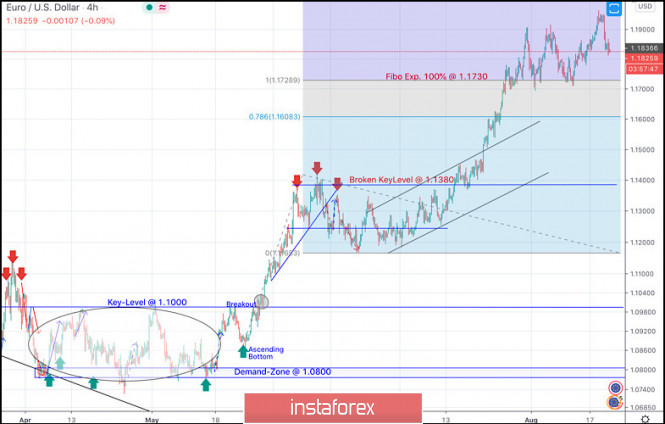
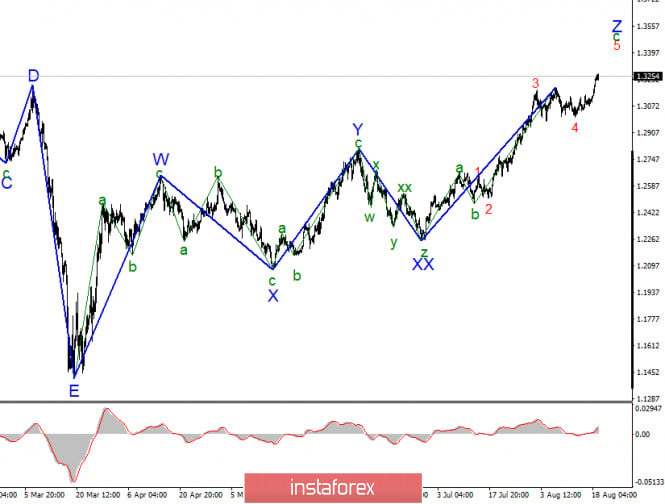
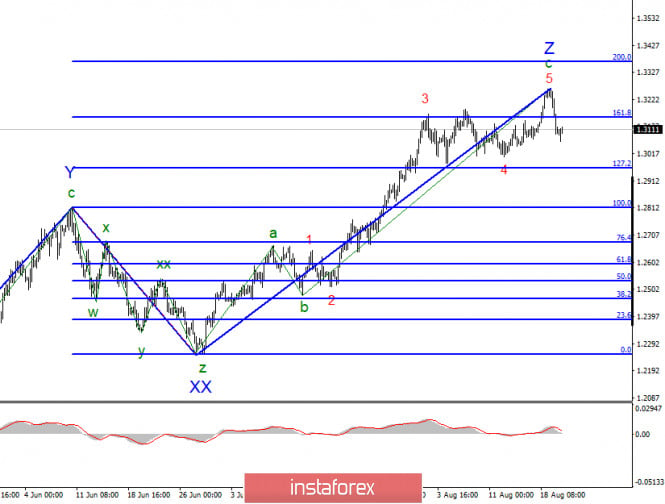
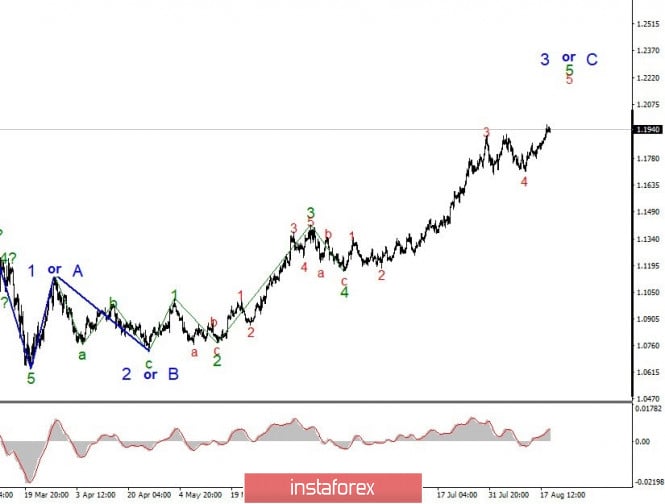
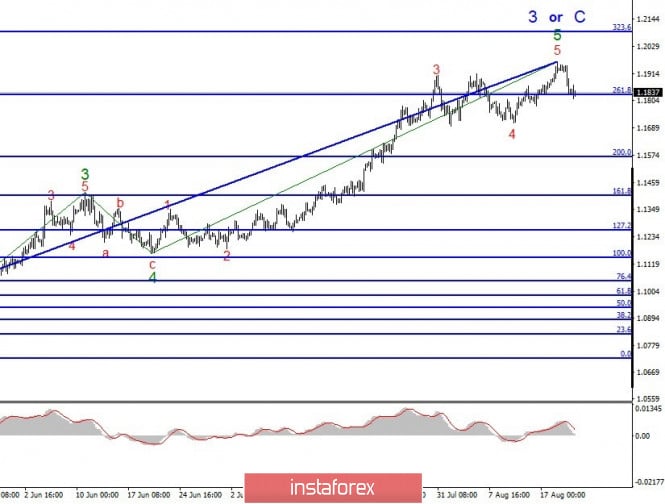
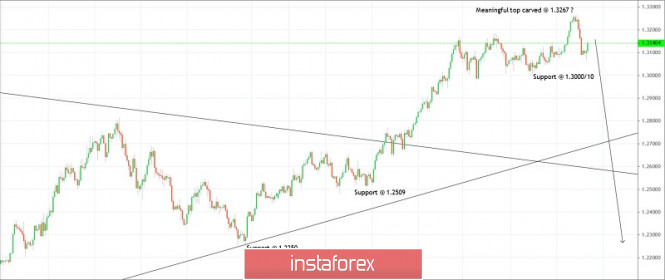
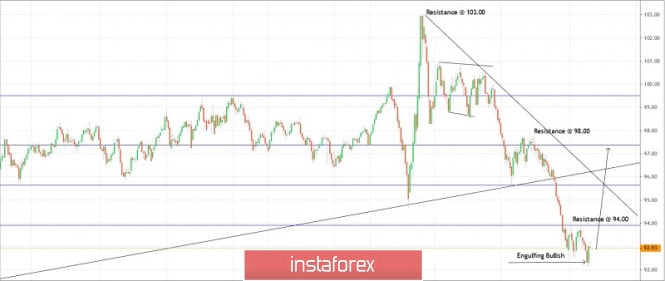
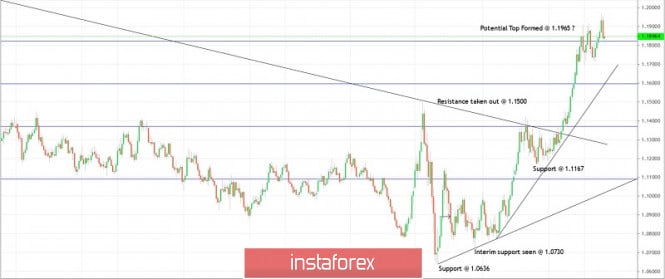


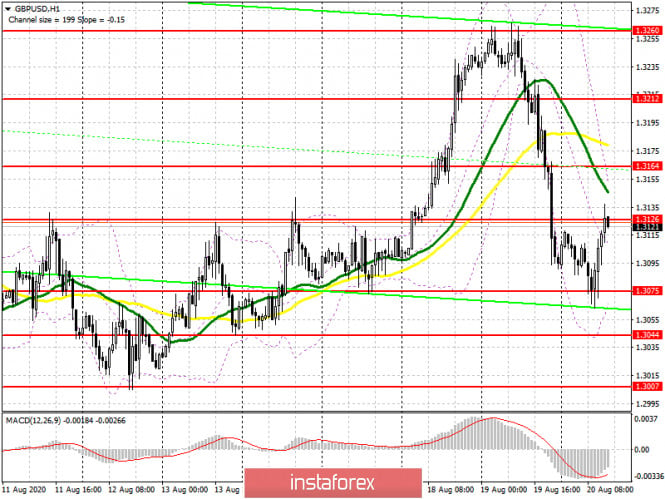
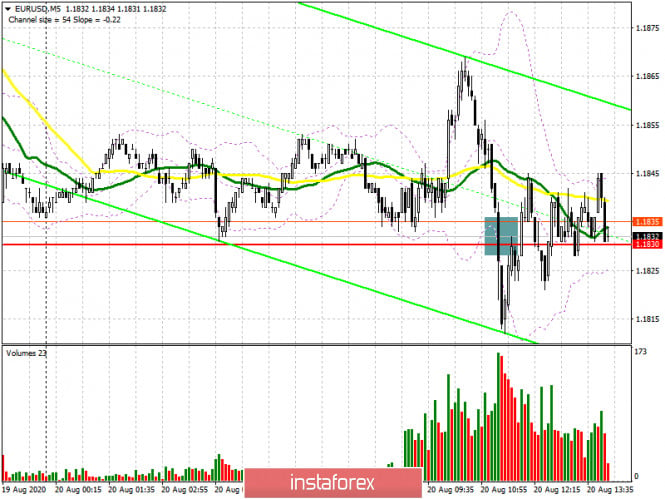
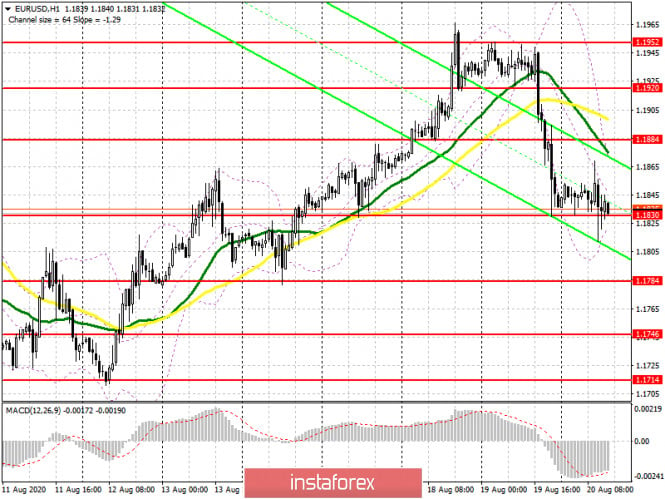
| You are subscribed to email updates from Forex analysis review. To stop receiving these emails, you may unsubscribe now. | Email delivery powered by Google |
| Google, 1600 Amphitheatre Parkway, Mountain View, CA 94043, United States | |
No comments:
Post a Comment