
Forex analysis review |
- Forecast for EUR/USD on September 1, 2020
- Forecast for AUD/USD on September 1, 2020
- Forecast for USD/JPY on September 1, 2020
- Hot forecast and trading signals for GBP/USD on September 1. COT report. France accused London of deliberately prolonging
- Hot forecast and trading signals for EUR/USD on September 1. COT report. Dollar continues to free fall without the help of
- Analytics and trading signals for beginners. How to trade EUR/USD on September 1? Getting ready for Tuesday session
- Analysis of the EUR/USD pair on August 31. Speech of Fed chairman Jerome Powell sparks another decline for the US dollar
- August 31, 2020 : GBP/USD Intraday technical analysis and trade recommendations.
- Analysis of GBP/USD on August 31
- August 31, 2020 : EUR/USD Intraday technical analysis and trade recommendations.
- August 31, 2020 : EUR/USD daily technical review and trade recommendations.
- Evening review on August 31, 2020
- USDCAD remains in a bearish trend approaching our target since 1.35.
- Short-term Ichimoku cloud indicator analysis of Gold for August 31, 2020
- EURUSD remains in a bullish trend challenging new highs
- Comprehensive analysis of movement options for commodity currencies AUD/USD & USD/CAD & NZD/USD (H4) on September
- EURUSD and GBPUSD
- US dollar slightly stabilizes, future prospects still suggests resumption of decline
- Trading plan for Silver on August 31, 2020
- Daily Video Analysis: USDCAD High Probability Setup
- Trading plan for Gold on August 31, 2020
- USDCAD to reverse from downside confirmation, potential drop!
- Trading plan for NASDAQ on August 31, 2020
- Trading plan for SPX500 for August 31, 2020
- What may crash markets in autumn?
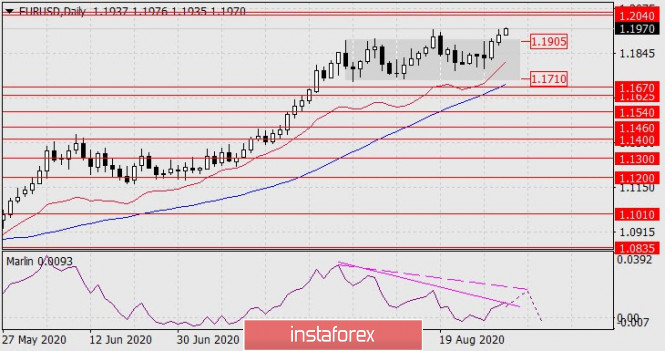
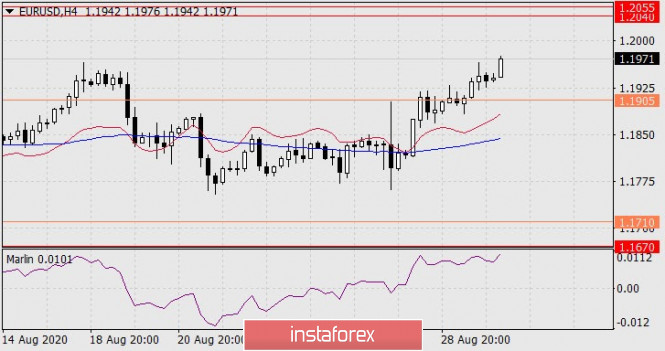
| Forecast for EUR/USD on September 1, 2020 Posted: 31 Aug 2020 08:18 PM PDT EUR/USD The dollar index fell by 0.12% on Tuesday, as investors continued to inertly buy up counterdollar currencies in the absence of new incoming data following Federal Reserve Chairman Jerome Powell's speech from last Thursday. We expect new data today, potentially capable of stopping and significantly outstripping the reaction of investors. Such data might be indicators of business activity in the eurozone and the United States, as well as European data on inflation and employment. So, the final estimate of the eurozone Manufacturing PMI for August is expected to remain unchanged at 51.7 points, the US ISM Manufacturing PMI is expected to grow from 54.2 to 54.6. The eurozone consumer price index for August may weaken from 0.4% y/y to 0.2% y/y, and the unemployment rate may also show an increase from 7.8% to 8.0%. Perhaps, the employment index will be a key event today, as data on the US will be released on Friday and unemployment there is projected to fall from 10.2% to 9.8%. At the same time, today's data on construction spending in the July estimate is expected to grow by 1.0%. The daily chart shows that the price moved up from the uncertainty zone and now it has two equally probable scenarios: return to this free roaming range as it happened on August 19, if today's macro data turns out to be effective, or continue to grow into the target range of 1.2040/55 in case of ambiguous data release... The Marlin oscillator, which has formed a divergence with the price, is also ready for two scenarios: completing the nearest development from the current levels, and with its arrangement above, approximately in the area of the dashed line. There are no signs of a reversal on the four-hour chart yet. The signal line of the Marlin oscillator is moving horizontally and may continue to rise. We are waiting for the development of events. Trading in both directions carries an equal risk of uncertainty. The material has been provided by InstaForex Company - www.instaforex.com |
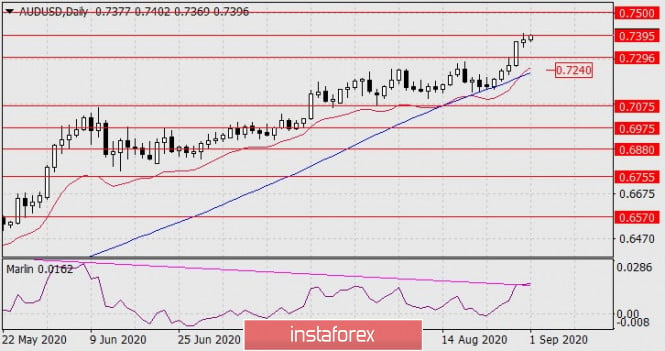
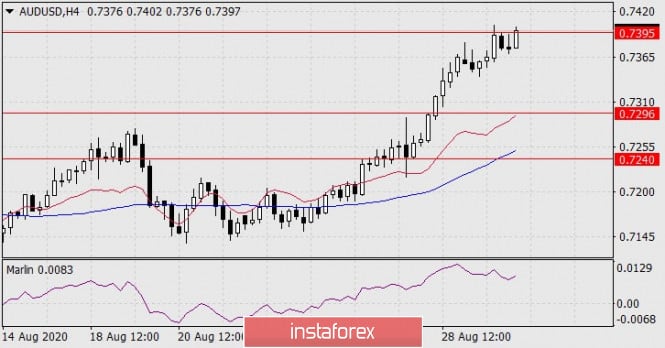
| Forecast for AUD/USD on September 1, 2020 Posted: 31 Aug 2020 08:12 PM PDT AUD/USD The Australian dollar reached the target level of 0.7395. An ideal triple divergence formed with the Marlin oscillator, exactly described by its line. Mathematically, the probability of a price reversal is more than 70%, but now the aussie is under the great impression of external markets, and the US dollar's long-term weakness will send AUD/USD higher to the target level of 0.7500. Commodities and metals are also slightly growing. Setting the price above the 0.7395 level will make it possible to continue growth towards the second target of 0.7500. The price shows its intention to settle above the 0.7395 level on the four-hour chart. The leading Marlin oscillator is declining, creating an intrigue of uncertainty. We are waiting for the development of events. |
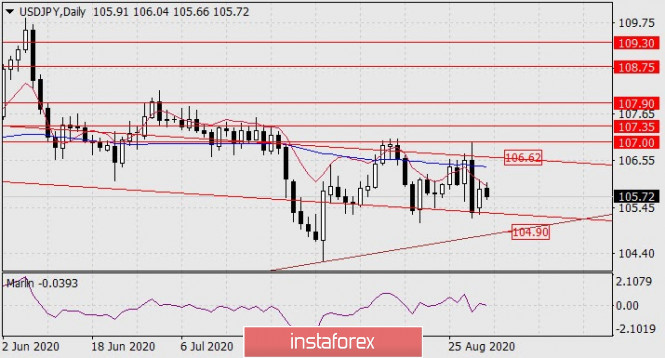
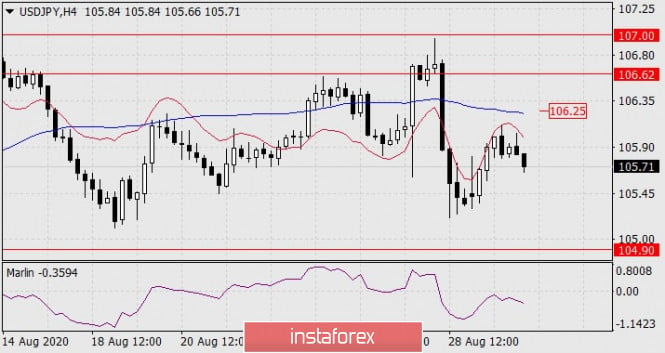
| Forecast for USD/JPY on September 1, 2020 Posted: 31 Aug 2020 08:05 PM PDT USD/JPY USD/JPY gained 54 points on Monday. Having reached the balance line on the daily chart, the price turned down from it. The decline intensified during today's Asian session. It is very likely that our fears about the price falling to support the lower border of the price channel towards the 104.90 level is turning into the main scenario. The signal line of the Marlin oscillator returns to the area of negative values again. The price turned away from the balance line on the four-hour chart, which is very indicative that the trend has not gone upward. Also, Marlin did not try to enter the growth trend zone. We are waiting for the price to decline further, the target is 104.90. |
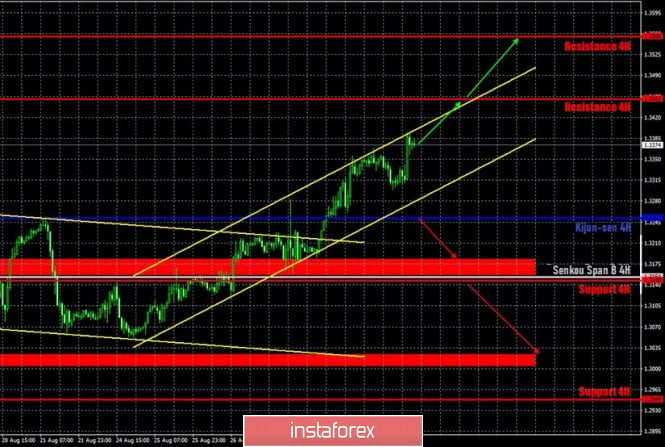
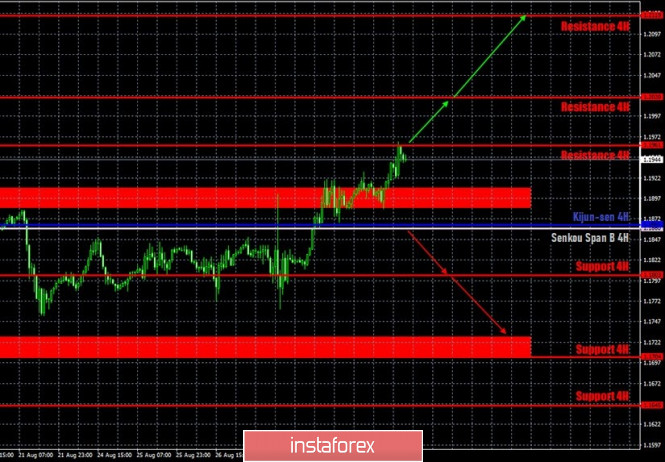
| Posted: 31 Aug 2020 06:57 PM PDT GBP/USD 1H After a low downward correction, the GBP/USD pair resumed its upward movement within a new ascending channel on August 31. Thus, the upward trend for the pound/dollar pair persists after the pair's quotes left the downward channel. The nearest target for the upward movement is the 1.3451 level. Take note that all targets are located far enough both from the price and from each other. As for the technical reasons for the new upward movement, there are still few of them. A downward correction has been brewing for more than a month, which has not started due to low demand for the US dollar. This point is when it is most alarming to make long deals on the British currency. GBP/USD 15M The lower linear regression channel turned sideways on the 15-minute timeframe, but the channel on the hourly chart is more important now, which supports the bulls. The latest Commitment of Traders (COT) report for the British pound, which came out on Friday, was completely neutral. Despite the fact that the UK currency resumed growth against the dollar and continued to do so at the beginning of the new week, professional traders did not open new Buy-contracts during the reporting week of August 19-25. On the contrary, 9,700 Buy-contracts and 9,100 Sell-contracts were reduced. Thus, the net position for the non-commercial category of traders even slightly decreased. However, this change is so insignificant that it makes no sense to draw conclusions on it. Thus, the general attitude of large traders remains the same. The last four trading days were not included in the latest COT report, and it was on these days that the British currency rose in price again. Thus, in the new COT report, we can see a significant increase in net position among non-commercial traders, which, in turn, will confirm the intention of the big bulls to continue investing in the pound, while getting rid of the US dollar. Meanwhile, new, important data for the British pound and the whole of Great Britain appeared on Monday. France has officially accused London of deliberately delaying talks on a deal regarding its future relationship. "Negotiations are not advancing, because of the intransigent and unrealistic attitude of the United Kingdom," said French Foreign Minister Le Drian. Recall that the last comments of Michel Barnier indicated that the talks began to move in the opposite direction. Le Drian makes it clear to London that the European Union will not follow the lead of 10 Downing Street. Europeans believe that British Prime Minister Boris Johnson does not want to conclude a fair agreement, and in this case will not receive any deal at all. Germany also put an end to the talks. Diplomatic talks were to take place at the highest level on September 2, at which the issues of the Brexit deal would be discussed. However, Berlin said that it will not participate in them, as no progress has been made, and "time was wasted." The EU government believes that London is morally ready to leave the EU without a deal and blames Brussels for what is happening. We remind you that initially Johnson planned to withdraw Britain from the EU without a deal. Thus, from our point of view, London is bending the line that it initially adhered to. The pound sterling does not show any interest in this news, although it is negative for it. Based on the above, we have two trading ideas for September 1: 1) Buyers have been active in recent days and are pushing the pair up again. At the moment there is a new channel to the upside. The price has reached its upper line, so today a correction to the lower line may begin, around which you can consider new long deals on the British currency while aiming for the resistance level of 1.3451. Take Profit in this case will be about 110 points. 2) Bears once again released the pair from their hands, as the quotes went above the downward trend channel, so sales are no longer relevant. Thus, it is now recommended to consider short positions again after the price settles below the new ascending channel and the Kijun-sen line (1.3252) while aiming for the support area of 1.3156-1.3182 and the 1.3025 level. Take Profit in this case will be from 50 to 250 points. Explanations for illustrations: Support and Resistance Levels are the levels that serve as targets when buying or selling the pair. You can place Take Profit near these levels. Kijun-sen and Senkou Span B lines are lines of the Ichimoku indicator transferred to the hourly timeframe from the 4-hour one. Support and resistance areas are areas from which the price has repeatedly rebounded off. Yellow lines are trend lines, trend channels and any other technical patterns. The material has been provided by InstaForex Company - www.instaforex.com |
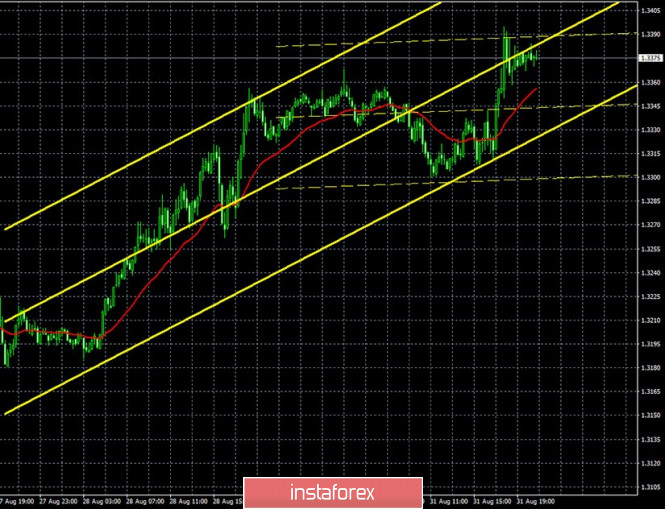
| Posted: 31 Aug 2020 06:51 PM PDT EUR/USD 1H The euro/dollar pair quite easily overcame the resistance area of 1.1886-1.1910 for the second time and continued to move up to the first resistance level of 1.1961 on the hourly timeframe. Formally, the quotes of the pair left the side channel, in which they traded for more than a month. However, at the same time they failed to gain a foothold above the 1.1961 level, which is also the previous local high. Thus, despite the fact that the flat is formally over, the price can go down from the current positions. From a technical point of view, a strong downward correction is still more logical. And with the fundamental - the long-term fall of the dollar. The situation is confusing and complicated by the absence of trend lines or channels that would greatly help in trading. EUR/USD 15M Both linear regression channels are directed upward on the 15-minute timeframe, but in the near future they may turn down if the resistance level of 1.1961 is not overcome. A new Commitment of Traders (COT) report was released last Friday. Take note that its character has not changed at all compared to previous COT reports. Despite the fact that the euro/dollar has been trading within the side channel for more than a month, professional traders continue to increase their net position. In other words, non-commercial traders (the most important group of traders) raise the number of Buy-contracts, while the number of Sell-contracts is decreasing. The non-commercial category of traders opened 1,302 Buy-contracts and closed 11,310 Sell-contracts during the reporting week on August 19-25. Thus, the net position (the difference between the number of buy and sell contracts) increased by 12,000 Therefore, we can draw the same conclusions as a week ago, as two weeks ago: professional traders continue to view the euro as a more attractive currency to invest in than the US dollar. The situation did not change during the last three trading days of the past week, which were not included in the latest COT report, as the euro continued to rise in price. There was practically no fundamental background for the EUR/USD pair on Monday. No important macroeconomic data for the European Union or the United States were published that day either. There were also few important and interesting news. Riots and rallies against police violence under the auspices of "Black Lives Matter" continue in some cities in the United States. The social crisis, as we see, is not over. Meanwhile, US President Donald Trump criticized the Democrats again, including those who are mayors of US cities, and accused them of complete inaction in opposing the protesters. "The only way you will stop the violence in the high crime Democrat run cities is through strength!" Trump tweeted. The EU is set to publish the unemployment and inflation rate, and the US will release the index of business activity in the manufacturing sector (ISM), which will both be interesting. We would like to remind you that the previous European business activity indices significantly dropped compared to the previous month. The same fate may await US business activity. Based on the above, we have two trading ideas for September 1: 1) Bulls again went over to attack and pushed the pair to the previous local high of 1.1961. They also managed to withdraw the pair from the side channel for the second time, in which trades were mainly held in recent weeks. Thus, if the price settles above the 1.1961 level, we recommend buying the euro again with targets at the resistance levels of 1.2020 and 1.2119. Take Profit in this case will be from 35 to 130 points. 2) Bears again missed the opportunity to start forming a new downward trend, although the bulls gave them a whole month to do so. Thus, sales of the pair can be done with targets at the 1.1803 level and the support area of 1.1702-1.1727, if the price manages to gain a foothold below the Senkou Span B line (1.1860). In this case, the potential Take Profit ranges from 35 to 115 points. Explanations for illustrations: Support and Resistance Levels are the levels that serve as targets when buying or selling the pair. You can place Take Profit near these levels. Kijun-sen and Senkou Span B lines are lines of the Ichimoku indicator transferred to the hourly timeframe from the 4-hour one. Support and resistance areas are areas from which the price has repeatedly rebounded off. Yellow lines are trend lines, trend channels and any other technical patterns. The material has been provided by InstaForex Company - www.instaforex.com |
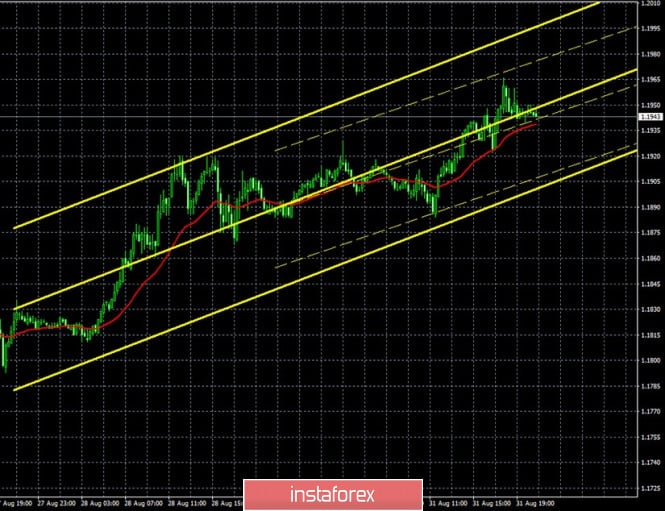
| Posted: 31 Aug 2020 01:16 PM PDT Hourly chart of the EUR/USD pair The EUR/USD pair resumed its upward movement on Monday, August 31, without any noticeable correction after a fairly strong growth on Thursday and Friday. The MACD indicator turned up, but it turned back when the upward movement was almost over. This happens when the indicator turns too far from the zero mark. Thus, a formal buy signal had formed today, but it was extremely inconvenient and impractical to work it out, especially for novice traders. Moreover, there are still no patterns or graphical figures that identify the current trend as an upward trend and support it. That is, in fact, we have an upward movement, but this movement is not supported by a trend line or channel, which again complicates the trading process. By the end of the trading day, the euro/dollar pair rose to the 1.1967 level, which is the previous local high. Both price peaks are connected by a red horizontal line and now form a resistance line. Formally, we can build an upward trend line through the lows of August 27 and 31, but in this case we will get a trend line that is excessively directed up. The first noticeable correction will lead to the fact that the quotes will settle below such a trend line, which may not mean the end of the upward movement. In general, the technical picture is now ambiguous and complex. There were almost no macroeconomic events on Monday. As we wrote in this morning's article, market participants were not interested in consumer price indices in Spain, Italy and Germany, as well as Italian GDP for the second quarter. Although inflation in Germany was below forecasts, as well as GDP in Italy, nevertheless, the European currency became more expensive during the day. When it would be much more logical to see a correction. But what can we do if the demand for the US dollar remains almost zero... September 1, Tuesday, will be more interesting in terms of macroeconomic statistics. First, the European Union will publish inflation for August (preliminary value). Second, the European Union will publish the unemployment rate for July. Third, the US will release a fairly important index of business activity in the manufacturing sector ISM. We believe that traders will not pay much attention to the inflation data, since this is only a preliminary value, and the inflation indicator itself is not important at this time. The unemployment rate will only attract attention if it is radically different from the forecast(8%). Therefore, we recommend paying attention to the ISM index, which may significantly decrease compared to the July value. Possible scenarios for September 1: 1) Novice traders are not recommended to buy the pair at this time, since there are currently no new patterns that support the upward movement. Thus, to buy the pair, you need to wait for a trend line to form as well as the corresponding buy signals from the MACD. Even overcoming the 1.1967 level does not guarantee that the upward movement will continue, but in this case, novice traders, if there is a signal to buy from the MACD, can still try to open longs while aiming for 1.2054 (to be clarified in the morning). The problem is that the MACD indicator should be sufficiently discharged and also fall to the zero level area to form a good buy signal. And at the same time, a rebound from the 1.1967 level will mean the possible end of the upward movement. 2) We also do not recommend considering sales right now, because there are currently no patterns that support the downward movement either. Theoretically, a rebound from the 1.1967 level can trigger a downward movement, but you can not be completely certain about this. Thus, we recommend that novice traders behave very carefully in the next few days. On the chart: Support and Resistance Levels are the Levels that serve as targets when buying or selling the pair. You can place Take Profit near these levels. Red lines are the channels or trend lines that display the current trend and show in which direction it is better to trade now. Up/down arrows show where you should sell or buy after reaching or breaking through particular levels. The MACD indicator consists of a histogram and a signal line. When they cross, this is a signal to enter the market. It is recommended to use this indicator in combination with trend lines (channels and trend lines). Important announcements and economic reports that you can always find in the news calendar can seriously influence the trajectory of a currency pair. Therefore, at the time of their release, we recommended trading as carefully as possible or exit the market in order to avoid a sharp price reversal. Beginners on Forex should remember that not every single trade has to be profitable. The development of a clear strategy and money management are the key to success in trading over a long period of time. The material has been provided by InstaForex Company - www.instaforex.com |
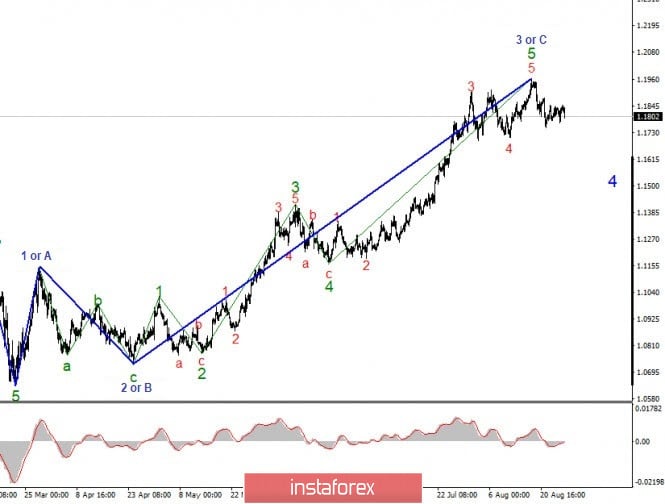
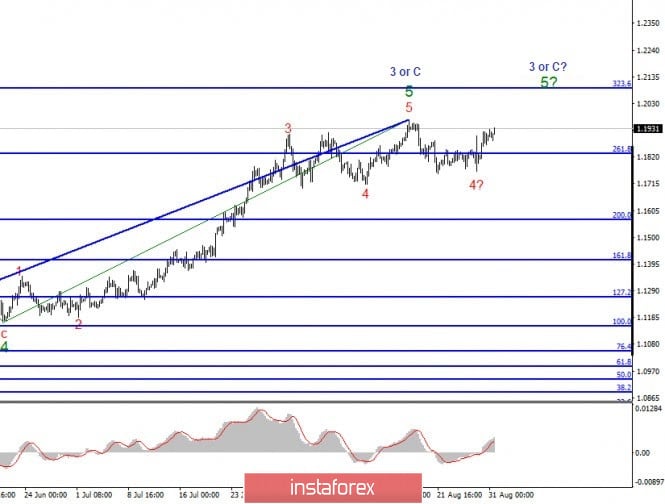
| Posted: 31 Aug 2020 09:44 AM PDT The wave pattern in the EUR / USD pair remains unchanged, but if the quote successfully passes the current high of wave 3 or C, then the entire structure will have a new and even more complex form. Nonetheless, wave 4 will still be built, and it will be part of the upward trend even if its form turns out to be a downward one. Meanwhile, wave 3 or C on the lower time frames seems to be completed already, however, several points in the pattern are frankly alarming. First, the EUR/USD pair failed to pass the low of the expected wave 4, thus, doubts have risen on the readiness of the markets in building a correction. In addition, the pair has a high chance of breaking out from the high of wave 5, which will lead to a complication in the upward trend, particularly in the rise of quotes in the market. There were also a lot of interesting events last Thursday and Friday, the most important of which was the speech of Fed Chairman Jerome Powell at the Jackson Hole economic symposium. There, Powell discussed the Fed's target inflation and said that the bank will pay more attention to average inflation rates for several months before making any decision on the monetary policy. In any case, in the future, even if inflation rises to 3% in the United States, the Fed will not go for a tighter monetary policy, as the US economy still needs serious stimulation. Such a decision led to a sharp decrease in demand for the US dollar. General conclusions and recommendations: Wave 3 or C in the EUR/USD pair is still in the process of completion, thus, at this time, long positions to 1.2089, or 323.6% Fibonacci are suggested. Such is the most profitable trading strategy in the market as of this moment. The material has been provided by InstaForex Company - www.instaforex.com |
| August 31, 2020 : GBP/USD Intraday technical analysis and trade recommendations. Posted: 31 Aug 2020 09:11 AM PDT
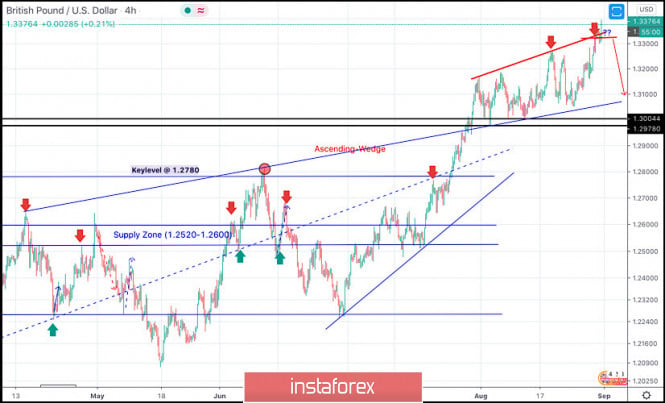
Transient bearish breakout below 1.2265 (consolidation range lower limit) was demonstrated in the period between May 13 - May 26. However, immediate bullish rebound has been expressed around the price level of 1.2080 bringing the GBP/USD back towards 1.2780 (Previous Key-Level) where another episode of bearish pullback was initiated. Short-term bearish movement was expressed towards 1.2265 where Significant bullish rejection was originated bringing the GBP/USD pair back towards 1.2780 where this key-level failed to offer enough bearish rejection. Intermediate-term Technical outlook for the GBP/USD pair remains bullish as long as bullish persistence is maintained above 1.2780 (Depicted KeyLevel) on the H4 Charts.On the other hand, the pair looks overbought after such a quick bullish movement while approaching the upper limit of the current expanding channel around 1.3320-1.3340.Hence, upcoming bearish reversal shouldn't be excluded provided that sufficient bearish reversal signs are expressed around the current depicted pattern upper limit. Trade recommendations : Intraday traders are advised to look for signs of bearish rejection around the current price levels (1.3340) as a valid SELL Entry. Initial T/p level is to be located around 1.3200 and 1.3100. On the other hand, bullish persistence above 1.3400 invalidates this trading scenario. The material has been provided by InstaForex Company - www.instaforex.com |
| Analysis of GBP/USD on August 31 Posted: 31 Aug 2020 09:06 AM PDT
The wave structure of the upward trend took a quite finished appearance several times, however, the high demand for British and low for the dollar led to the fact that the upward trend again has become more complicated and took an even longer look. The wave Z can become more complex under current conditions almost indefinitely. The lower graph will show that there can be any number of smaller wave structures inside the wave Z. Thus, now is the case when the wave pattern will adjust to the demand for the US dollar. If the demand does not grow in the near future, the increase in the quotes of the instrument will continue.
However, a closer examination of the current wave pattern shows that the upward trend has become more complicated. The wave pattern has once again assumed a complete form, however, the wave C-Z can become more complicated once and several times more. It's just that the internal wave structure of wave C-Z will become more complex each time. Thus, at the moment, I can't make a conclusion about when the construction of the upward trend section will be completed. Everything will depend on the news background and market demand for the US currency. The most important thing for the pound/dollar instrument was also the performance of Jerome Powell at Jackson Hole, after which the Briton soared up. However, on Friday, there was also a speech by the Governor of the Bank of England, Andrew Bailey, who did not make any high-profile statements about monetary policy. Nevertheless, Bailey still said that the Bank of England still has a fairly large number of tools to influence monetary policy, despite the extreme rate cut to 0.1% and the expansion of the QE program. That is, the British Central Bank can further increase the program of asset repurchase from the open market and lower the rate even more in order to support the British economy. In addition, America released an updated and inconclusive report on GDP in the second quarter, according to which losses were no longer 32.9%, but 31.7%. This is even good news for the US currency, although the failure of the US economy is still gigantic. Apparently, the markets decided that one and a half percent of the difference is insignificant, and did not increase the demand for the dollar. Thus, the current wave markup has become more complex. On Monday, August 31, there were no scheduled events or economic reports in the UK, the US and the European Union. Thus, the trading was held in a fairly calm mode. General conclusions and recommendations: The pound/dollar instrument resumed building the upward wave Z and could immediately complete it. Thus, I would not recommend making new purchases of the instrument now. At the same time, sales of the instrument also do not look very attractive, since there is no confirmation of the end of the upward trend section, and the low of the previous wave 4 was not passed. The material has been provided by InstaForex Company - www.instaforex.com |
| August 31, 2020 : EUR/USD Intraday technical analysis and trade recommendations. Posted: 31 Aug 2020 08:57 AM PDT
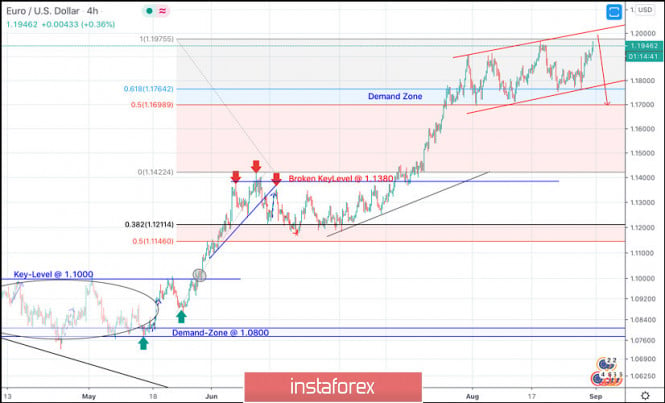
On May 14, the EUR/USD has expressed evident signs of Bullish rejection as well as a recent ascending bottom around the price zone of (1.0815 - 1.0775).Thus, enhancing the bullish side of the market in the short-term. Bullish breakout above 1.1000 has enhanced further bullish advancement towards 1.1150 then 1.1380 where another sideway consolidation range was established. The EURUSD pair has failed to maintain enough bearish momentum below 1.1150 (consolidation range lower zone) to enhance further bearish decline. Instead, the current bullish breakout above 1.1380-1.1400 has lead to a quick bullish spike directly towards 1.1700 (Fibonacci Expansion 150% level) which failed to offer sufficient bearish pressure. Bullish persistence above 1.1700-1.1760 favored further bullish advancement towards 1.1975 (200% Fibo Expansion Level) where some considerable bearish rejection has been demonstrated. The price zone around 1.1975-1.2000 ( upper limit of the technical channel ) remains a strong SUPPLY-Zone to be watched for bearish reversal. However, Conservative traders should be waiting for bearish re-closure below 1.1700. As this indicates lack of bullish momentum and enhances further bearish decline initially towards 1.1600 and 1.1500. Trade recommendations : Conservative traders should wait for the current bullish movement to pause and get back below 1.1700 as an indicator for lack of bearish momentum for a valid SELL Entry.T/P levels to be located around 1.1600 and 1.1500 while S/L to be placed above 1.176 to minimize the associated risk. The material has been provided by InstaForex Company - www.instaforex.com |
| August 31, 2020 : EUR/USD daily technical review and trade recommendations. Posted: 31 Aug 2020 08:29 AM PDT
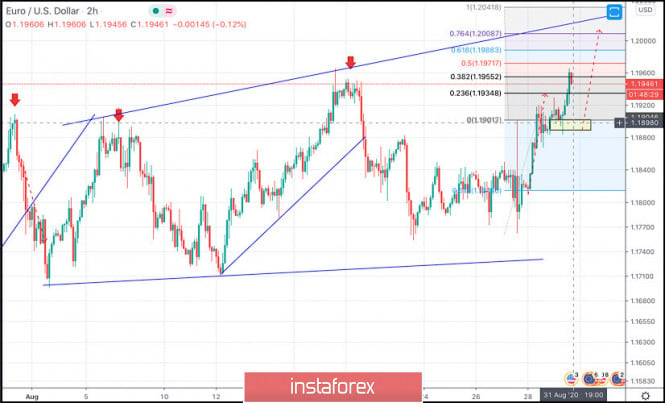
The EUR/USD pair has been moving sideways within the depicted expanding channel since August 3. Previously, a temporary resistance level was formed around 1.1900 which prevented further upside movement for some time and forced the pair to have a downside pause towards 1.1715.On August 12, a new short-term uptrend line was initiated around 1.1715 which allowed the EURUSD pair to achieve a new breakout above the previously mentioned resistance zone. On August 19, the mentioned breakout turned to be a buying trap. This enhanced the bearish side of the market towards 1.1800 where significant BUYING pressure has been demonstrated since then. Currently, the EUR/USD pair is demonstrating signs of strength being manifested on the chart by achieving H1 candlestick closure above 138% Fibonacci Expansion. Any downside pullback towards the previously mentioned broken resistance level around 1.1900, now acting as a support level, should be considered for a BUYING opportunity. Initial target would be located around 1.2000 where the upper limit of the current movement channel comes to meet the pair. On the other hand, Stop Loss should be placed just below 1.1865. The material has been provided by InstaForex Company - www.instaforex.com |
| Evening review on August 31, 2020 Posted: 31 Aug 2020 08:21 AM PDT
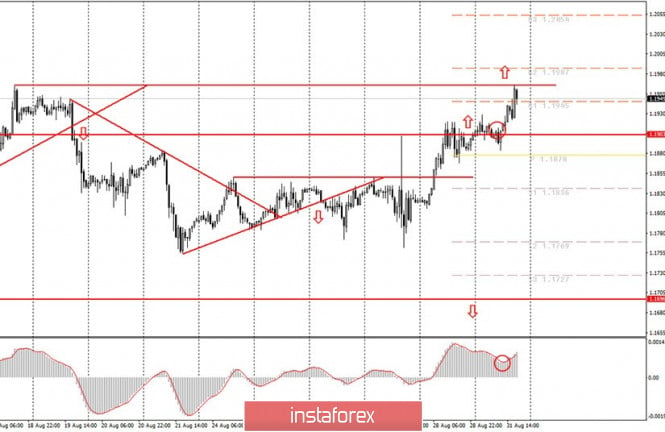
EURUSD: The US employment report is expected ahead of this week. Today, the euro has broken through the highs of the 1.1965 range and if it consolidates above, the second wave of the upward trend may begin. You may keep buying from 1.1905 with a stop at 1.1860, but more cautious ones could move the stop at 1.1880. The material has been provided by InstaForex Company - www.instaforex.com |
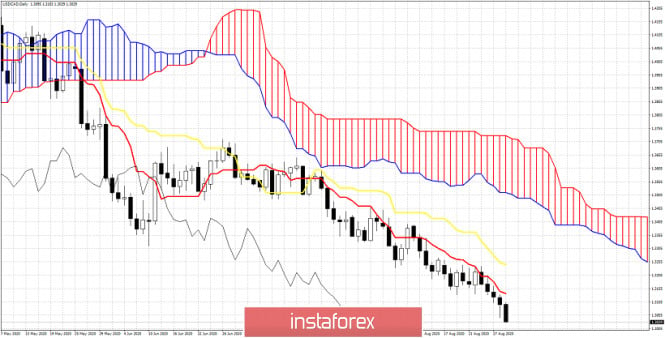
| USDCAD remains in a bearish trend approaching our target since 1.35. Posted: 31 Aug 2020 07:58 AM PDT Back in early July we noted our first bearish signal in USDCAD when price broke below 1.35. Since then we had given two possible targets. First target was at 1.32 and our next target was 1.30-1.2950. Price has now reached very close to our second target and we can lower our protective stops to 1.3230.
Price today continues to be in a bearish trend as can be clearly confirmed by the Ichimoku cloud indicator. Resistance levels are at 1.3135 and next at 1.3240. As long as price is below both the tenkan-sen (red line indicator) and kijun-sen (yellow line indicator) we remain short-term bearish. The material has been provided by InstaForex Company - www.instaforex.com |
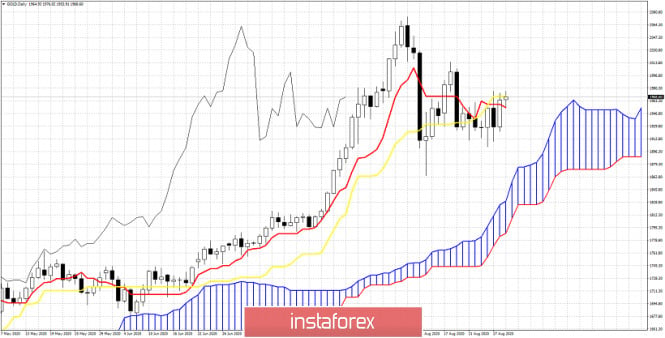
| Short-term Ichimoku cloud indicator analysis of Gold for August 31, 2020 Posted: 31 Aug 2020 07:49 AM PDT Gold price has bounced strongly off $1,900 support area but the advance has stopped at the major resistance area around $1,950-70 where we find the key indicators tenkan-sen and kijun-sen.
Gold price is above the Daily Kumo. Trend is bullish. Price is above the tenkan-sen (red line indicator) and is challenging the kijun-sen (yellow line indicator). The tenkan-sen is below the kijun-sen and we need to see the tenkan-sen cross above the kijun-sen to get another bullish signal. Price also needs to push above the kijun-sen (yellow line indicator) to have a bullish signal. The Chikou span (black line indicator) is above the candlestick pattern and this confirms bullish trend. A rejection at current levels will be a very bearish sign and could push price back to $1,900 or even lower. Bulls need to break resistance at $1,970 and stay above $1,950. The material has been provided by InstaForex Company - www.instaforex.com |
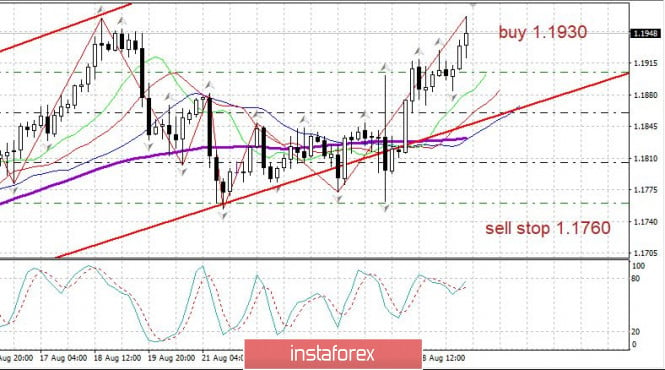
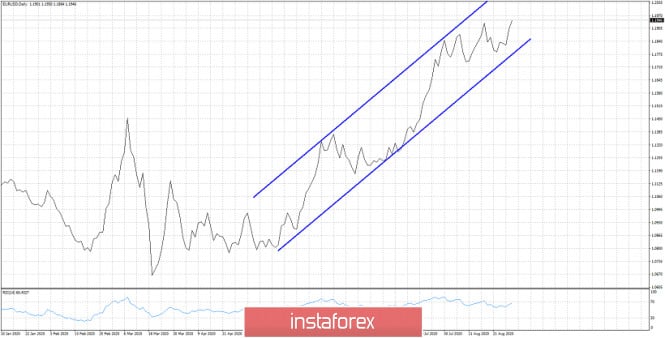
| EURUSD remains in a bullish trend challenging new highs Posted: 31 Aug 2020 07:42 AM PDT EURUSD has managed to recapture 1.1930 today. After breaking above the short-term resistance of 1.1850, EURUSD has moved towards 2020 highs as expected. Our next target was 1.20 with potential to reach 1.21.
Gold price is inside the blue upward sloping channel. Trend is bullish as price continues to make higher highs and higher lows. Price has so far managed to respect support at 1.17 and the higher low at 1.1750. Now price is about to make new 2020 highs. There are some warning signs by the RSI but as long as price is above the lower channel boundary, we remain bullish. Key support is now raised from 1.1750 to 1.18 The material has been provided by InstaForex Company - www.instaforex.com |
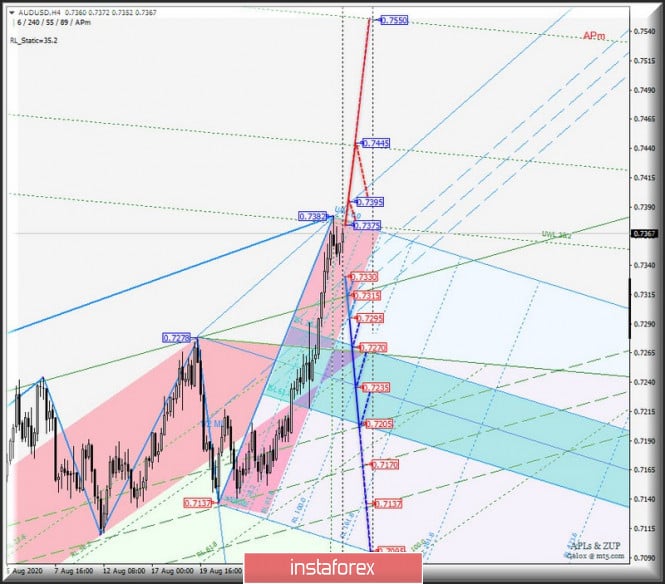
| Posted: 31 Aug 2020 07:20 AM PDT Minute operational scale (H4) The beginning of autumn - will the dominance of commodities over the US dollar continue? Overview of options for the development of movement of AUD/USD & USD/CAD & NZD/USD (H4) on September 1, 2020. ____________________ Australian dollar vs US dollar From September 1, 2020, the development of the movement of the Australian dollar (AUD/USD) will be determined by the development and direction of the range breakdown:
The breakdown of the support level at 0.7330 will determine the movement of AUD/USD in the channel 1/2 Median Line Minuette (0.7330 - 0.7315 - 0.7295) with the prospect. After the breakdown of the support level of 0.7295, the price of the instrument will reach the equilibrium zone boundaries (0.7270 - 0.7235 - 0.7205) of the Minuette operational scale fork and 1/2 Median Line (0.7205 - 0.7170 - 0.7137) of the Minute operational scale fork. If the resistance level of 0.7375 at the initial line SSL of the Minuette operational scale fork and update the local maximum 0.7382 will make the actual continuation of the upward movement of the Australian dollar to the line of control UTL Minuette (0.7395) and warning line UWL61.8 (0.7445) of the Minute operational scale fork. The markup of AUD/USD movement options from September 1, 2020 is shown on the animated chart.
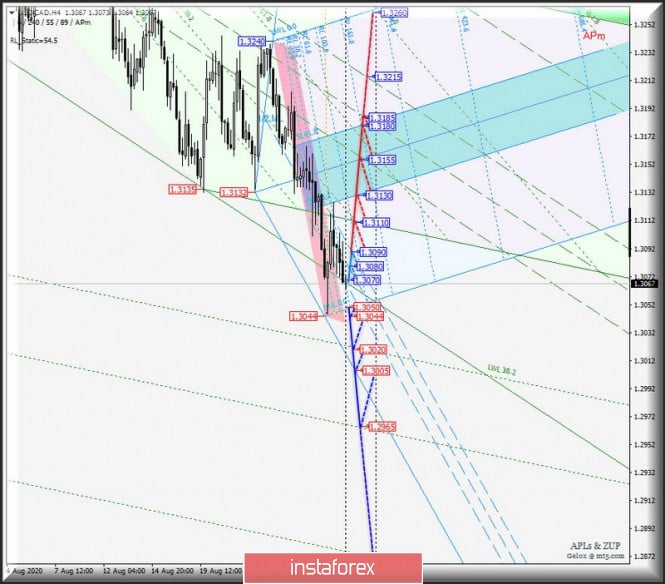
____________________ US dollar vs Canadian dollar The development of the movement of the Canadian dollar (USD/CAD) from September 1, 2020 will occur depending on the development and direction of the breakdown of the range:
In case of a breakdown of the resistance level of 1.3070, the USD/CAD movement will continue in the 1/2 Median Line Minuette channel (1.3070 - 1.3080 - 1.3090). In the event of a breakdown of the upper border (1.3090) of this channel, the upward movement can be continued to the initial line SSL (1.3110) of the Minute operational scale fork and the boundaries of the equilibrium zone (1.3130 - 1.3155 - 1.3180) of the Minuette operational scale fork. In case of a breakdown of the support level of 1.3050 on the initial SSL line of the Minuette operational scale fork and updating the local minimum 1.3044, the downward movement of the Canadian dollar will be directed to the targets:
Options for USD/CAD movement from September 1, 2020 are shown on the animated chart.
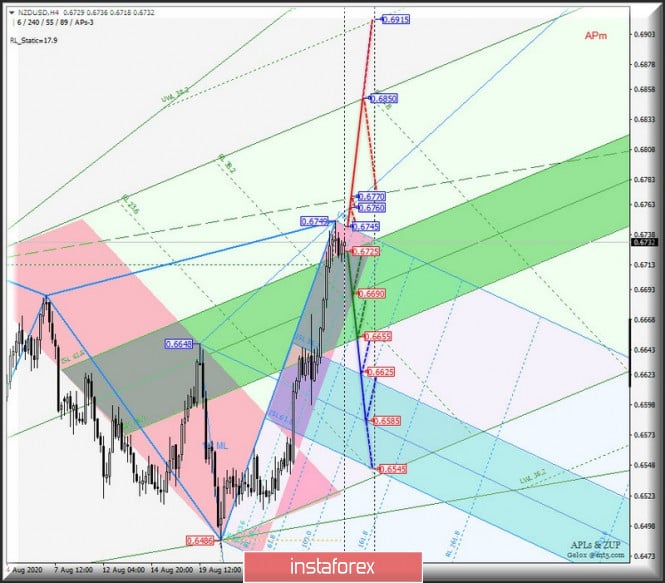
____________________ New Zealand dollar vs US dollar Working out and direction of the range breakdown:
Breakdown of ISL61.8 Minute - support level 0.6725 - return of the development of the NZD/USD movement within the equilibrium zone (0.6725 - 0.6690 - 0.6655) of the Minute operational scale fork, and upon breakdown of ISL38.2 Minute (0.6655), the downward movement of this instrument will continue to the equilibrium zone (0.6625 - 0.6585 - 0.6545) of the Minuette operational scale fork. Consecutive breakdown of resistance levels:
Options for the movement of NZD/USD from September 1, 2020 are shown on the animated chart.
____________________ The review is compiled without taking into account the news background, the opening of trading sessions of the main financial centers, and is not a guide to action (placing "sell" or "buy" orders). The material has been provided by InstaForex Company - www.instaforex.com |
| Posted: 31 Aug 2020 06:58 AM PDT The British pound continues to make attempts to rise against the US dollar, as well as the European currency, which is gradually approaching a fairly large maximum in the area of 1.1950. From a technical point of view, nothing has changed, as the bulls managed to protect a fairly important support level of 1.1885. Now their new target is the resistance of 1.1950, the breakout of which will provide new growth for risky assets in the area of the 20th figure. At the beginning of next month, you can also expect a new jump in the euro to the highs of 1.2060 and 1.2105.
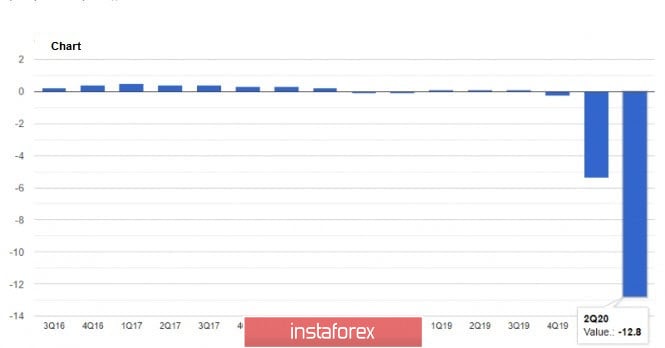
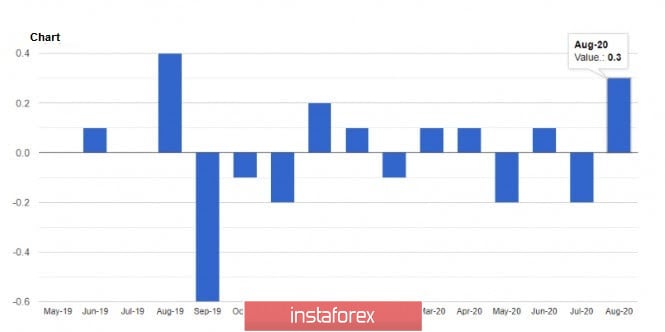
Today's series of reports on Italy, where the forecast for economic contraction was revised for the worse, and inflation in Germany, which declined, did not put much pressure on the euro, which continues to strengthen its position against the US dollar after statements by Federal Reserve Chairman Jerome Powell last week. Many experts expected that inflation would remain unchanged in August this year, however, this did not happen. A temporary reduction in VAT in Germany led to the indicator moving to the negative side. We should not forget that the pandemic-related restrictions in the service sector continue to operate, which leads to a reduction in sales. As for the positive contribution to the indicator, in August, it was associated with an increase in oil and energy prices. According to the report, the preliminary consumer price index (CPI) in Germany in August this year decreased by 0.1% compared to July and remained unchanged compared to the same period last year. Economists had expected both values to remain unchanged. As for the German consumer price index, which is harmonized according to EU standards, it fell by 0.2% and 0.1% in August, respectively. Another interesting report was published today by the Ifo Institute. It indicates that the number of part-time companies in Germany is declining. In August, the number of such companies fell to 37% from 42% in July. The reduction must be observed in all sectors, however, it is still a long way from completely abandoning such a system of work. In the manufacturing sector, 53% worked on a reduced schedule in August, compared to 57% in July. In the service sector, the indicator fell to 33% and in trade - 26%. Another indicator also did not lead to the formation of serious pressure on the euro. We are talking about the fall of the Italian economy, which in the 2nd quarter of this year was even more than previously announced. According to the National Bureau of Statistics Istat, from April to June 2020, Italy's GDP decreased by 12.8% compared to the previous quarter, while previously a reduction of 12.4% was announced. These figures once again confirm the plight of the Italian economy, which has suffered serious damage due to quarantine measures related to the coronavirus pandemic in the first half of this year. Consumer spending for the reporting period fell by 8.7%, and gross investment in fixed assets - by 14.9%. Meanwhile, due to the closure of borders and the suspension of several companies, exports fell by 26.4%, while imports decreased by 20.5%. Compared to the same period in 2019, Italy's GDP declined by 17.7% in the 2nd quarter. As for inflation expectations in August this year, things are a little better. The preliminary Italian consumer price index in August this year increased by 0.3% compared to July and decreased by 0.5% per annum. The data completely coincided with the forecasts of economists. GBPUSD As for the British pound, it continues its growth against the US dollar after recent statements by the Governor of the Bank of England, Andrew Bailey. According to the Governor, the Bank of England has not exhausted its capabilities, however, the choice of the instrument that will be used in the future is more important than ever before, as it depends on which path the next economic cycle will take. Bailey also noted that the set of monetary policy tools in the future may have "more nuances", thus making it clear that the topic of negative interest rates has not yet exhausted itself and this option continues to be considered by economists. Let me remind you that in March this year, the Bank of England lowered its key interest rate to a record low of 0.1% against the background of the government's introduction of strict quarantine measures to contain the new coronavirus pandemic. The existing asset purchase programs were also significantly increased, as well as additional lines of credit for enterprises and companies were opened. At its meeting in August, the Bank of England did not resort to changes in policy, saying that there are no good reasons for this yet. As for the technical picture of the GBPUSD pair, the further direction of the trading instrument will depend on how the bulls will show themselves in the support area of 1.3270, where the pound is gradually falling now. Approximately in the same range is the lower limit of the ascending price channel from August 24. A break in the resistance of 1.3390 will be another starting point for the GBPUSD pair, which will lead to an update of the highs in the area of 1.3470 and 1.3530. The material has been provided by InstaForex Company - www.instaforex.com |
| US dollar slightly stabilizes, future prospects still suggests resumption of decline Posted: 31 Aug 2020 06:22 AM PDT
The US dollar remained stable against the euro, and also demonstrates a fairly good strengthening against the Japanese yen Monday morning. The dollar even slightly neutralized the fall that happened in the previous trading sessions. Despite this, the greenback remains to have a few reasons to rejoice about. The new strategy of the US Federal Reserve, which was announced on Thursday last week, suggests that the inflation rate in the country may exceed the strategically important target of 2% during certain periods. At the same time, interest rates will remain at a low level for quite a long time, until the country's economy demonstrates confident stability and growth. All this is a growth factor for the sector of risky assets, which are practically all currencies of the Asian region, with the exception of the Japanese yen. Therefore, the US dollar will continue to be in a rather weak position, and soon its decline will resume. The Fed's new monetary policy is focusing on a different approach to inflation targeting. In the long term, the target of 2% inflation remains, but in some periods it is allowed to exceed this indicator in order to maintain the overall balance in the future. The Japanese yen moved to a negative position against the euro this morning. This is due to complex statistical data on the economic development of the state. The retail sales in the country declined by 3.3% in the second month of the summer, while in the previous month there was a huge increase of 13.1%. The current decline in the indicator is associated primarily with a jump in coronavirus infection in Japan. Meanwhile, Industrial production in Japan rose by a record of 8% in the second month of the summer. At the same time, preliminary forecasts turned out to be much more modest with an expected increase of no more than 5.8%. The euro, on the other hand, slightly moved down to the price level of $1.1902 per euro Monday morning. Note that at the end of the trading session on Friday, its value is $ 1.1903 per euro. The US dollar, on the contrary, rose 0.26% against the Japanese yen. Thus, the value of the dollar at present is around 105.64 yen, while the previous trading closed at 105.37 yen. The European currency increased against the Japanese by the same 0.26%. The current rate is 125.71 yen per euro, which was around 125.39 yen per euro on the previous trading. On Friday, the dollar against the euro began to cost less by 0.7%. While the dollar against the yen declined by 1.1% over the same period. The dollar index against a basket of six of the world's major currencies, including the euro, Swiss franc, Canadian dollar, Japanese yen, Swedish krona, and pound sterling fell 0.03% on Monday morning. While the dollar index against a basket of sixteen major world currencies, on the contrary, went up by 0.1%. The material has been provided by InstaForex Company - www.instaforex.com |
| Trading plan for Silver on August 31, 2020 Posted: 31 Aug 2020 06:21 AM PDT
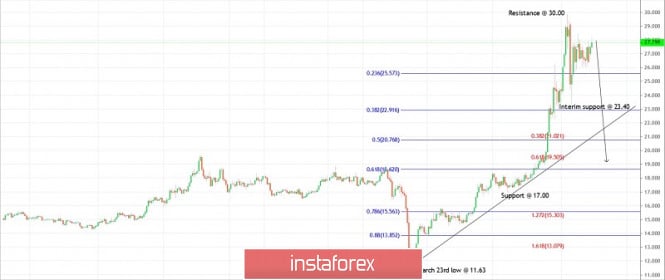
Technical outlook: Silver also seems to break a major top just above $30.00. The metal sharply reversed towards $23.40 soon after hitting $30.00 highs. It is seen to be trading around $28.00 at the moment of writing and it is expected to resume lower again. Ideally, Silver should stay below $30.00, but a break higher would keep the bearish structure intact. Immediate resistance is around $28.00, while support is seen at $23.40. A break below $23.40 would certainly confirm the trend reversal. The entire boundary between $11.63 and $30.00 could be retraced and Silver could reach the $18.50/19.50 levels or drop even lower. Trading plan: Remain short for now, stop is above $30.00, target is open. Good luck! The material has been provided by InstaForex Company - www.instaforex.com |
| Daily Video Analysis: USDCAD High Probability Setup Posted: 31 Aug 2020 06:13 AM PDT Today we take a look at USDCAD. Combining advanced technical analysis methods such as Fibonacci confluence, correlation, market structure, oscillators and demand/supply zones, we identify high probability trading setups. The material has been provided by InstaForex Company - www.instaforex.com |
| Trading plan for Gold on August 31, 2020 Posted: 31 Aug 2020 06:12 AM PDT
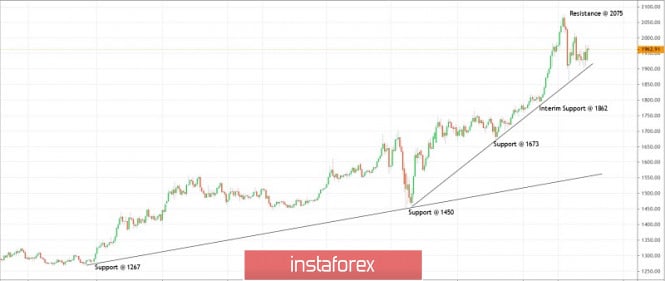
Technical outlook: Gold might have reached a meaningful top around $2,075. The yellow metal dropped sharply lower since then and hit the low of $1,862 before pulling back. It is seen to be trading around $1,967 at the moment of writing and it is expected to turn lower again soon. Immediate price resistance is seen towards $2,075, while support is around $1,862. A break below $1,862 would confirm the trend reversal. On the flip side, if Gold manages to rise above $2,075, it could reach $2,100 before finding resistance again. Please note that upside remains limited from here, hence it would be a safe strategy to sell on rallies. The 15-month uptrend in Gold might come to an end sooner than expected. Trading plan: Aggressive traders remain short, stop is above $2,075, target is open. Good luck! The material has been provided by InstaForex Company - www.instaforex.com |
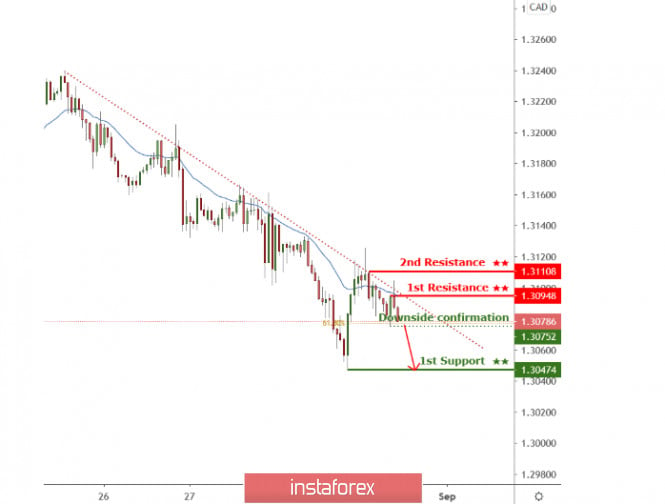
| USDCAD to reverse from downside confirmation, potential drop! Posted: 31 Aug 2020 06:12 AM PDT
Price holding below descending trendline and moving average resistance. A break below downside confirmation at 1.30752 should open further drop towards 1st support at 1.30474 Trading Recommendation Entry: 1.30752 Reason for Entry: 61.8% Fibonacci retracement Take Profit: 1.30474 Reason for Take Profit: Graphical swing low Stop Loss: 1.30948 Reason for Stop Loss: Descending trendline resistance, Moving average resistance The material has been provided by InstaForex Company - www.instaforex.com |
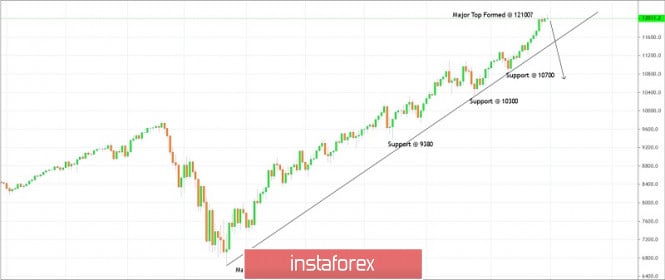
| Trading plan for NASDAQ on August 31, 2020 Posted: 31 Aug 2020 05:58 AM PDT
Technical outlook: NASDAQ broke resistance and extended its gains further close to the 12,094 level before pulling back. The index is seen to be trading around the 12,019/20 levels at the moment of writing and is expected to hit a top soon. A close below the 12,000 level today, would produce the shooting star candlestick pattern on the daily chart indicating a potential reversal ahead. Immediate resistance could be marked around 12,100, while support is seen at the 10,700 levels . A break below 10,700 would confirm a major top around the 12,094 level and that bears are back in control. Also note that the support trend line drawn through lows since March 23 around 66,29 would also be broken if NASDAQ drops below 10,700 mark. Trading plan: Aggressive traders remain short, stop is at 1,200, target is open. Good luck! The material has been provided by InstaForex Company - www.instaforex.com |
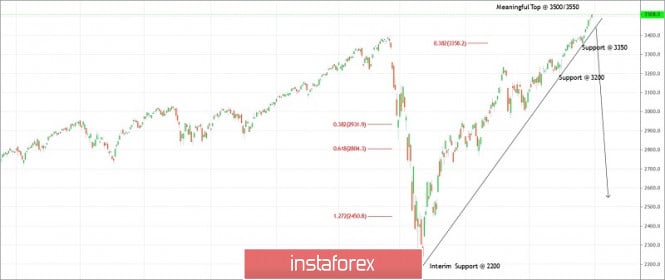
| Trading plan for SPX500 for August 31, 2020 Posted: 31 Aug 2020 05:48 AM PDT Technical outlook: SPX500 managed to break through the resistance level of 3.400 and climb above 3,500. The index finished trading around 3.508 on Friday. Futures are trading higher around 3.511 at this point in writing. The SPX500 index rallied through new highs while the Dow Jones remained below its 29,600 high. A bearish divergence and potential trend reversal could be seen sooner than expected. Immediate resistance might be seen at 3,530, while support is around 3.350 level, respectively. A break below 3,350 would confirm that the index may test new high and bears are back in control. Trading plan: Remain short, stop 3650, target is open. Good luck! The material has been provided by InstaForex Company - www.instaforex.com |
| What may crash markets in autumn? Posted: 31 Aug 2020 05:41 AM PDT
Many experts warned about a tough August, as there are usually risks of falling currencies and high volatility at the end of summer. However, the month passed calmly, despite the nationwide protests in Belarus and the difficult relations between Washington and Beijing. Investment flows are on the way to recover. Stock market capitalization has achieved the highest level. Moreover, average US dollar bond spreads are at their lowest level since early March. However, not everything is so optimistic. Do not forget about the growth of the COVID-19 cases in some countries. In addition, the Fed's stimulus will end soon. Also, the outcome of the US elections could be dangerous. This event could have negative consequences regardless of the winner. So, what will surprise investors in autumn? Firstly, it could be a victory of Democrat Joe Biden in the US presidential elections. Biden's political strategy significantly differs from Trump's one. Biden is expected to restore international relations. However, individual markets could be under pressure from reduced investment and trade flows. Timothy Ash, strategist at BlueBay Asset Management, warns that investors will have to learn to live with the new sanctions that Biden may impose. The politician will focus on human rights and democratic standards. This will become the foundation of the international relations. Secondly, we should remember about the tensions with China, which have stifled President Biden's attempts to turn the disputes with Beijing into constructive dialogue. That is why, many traders do not invest in Chinese assets. As a result, markets are likely to see another sell-off. Moreover, if Donald Trump takes the presidency again, the Cold War would only worsen. A military conflict in the South China Sea may begin very soon. Ultimately, global markets would collapse. In addition, a turbulent situation is observed in Latin America. There are really tough demonstrations against the level of poverty and the rapid spread of the coronavirus. Latin America lags far behind the economies of Asia and Europe, where living standards are much better. The region is losing ground compared to other emerging markets and Argentina is tightening capital controls. Index provider MSCI may start national classification of emerging markets. Daniel Tenengauser, head of market strategy at Bank of New York Mellon, argues that the pandemic will lead to a sharp jump in poverty in Latin America. Moreover, the Mediterranean countries are losing their popularity due to the weakening economy of the region. In this regard, Turkish President Recep Tayyip Erdogan is increasing the degree of political assertiveness. This could lead to new more serious sanctions from the European Union. In turn, this may result in a new round of falling lira exchange rate, and the authorities will be forced to tighten control over the market. Finally, the situation in Libya could bring down the markets in the autumn. A civil war in Libya could bring Egypt, France, Turkey, the United Arab Emirates, and Russia into conflict. Turkey and Egypt have sent their military forces to Libya and to its borders. The situation is really alarming. The government of the country believes that the introduction of forces from other states is a declaration of war. There is a risk that neither the EU nor the United States will be able to settle the situation, and investors will begin to withdraw funds from the countries involved in the conflict. The cost of default insurance could skyrocket amid a sell-off. The material has been provided by InstaForex Company - www.instaforex.com |


| You are subscribed to email updates from Forex analysis review. To stop receiving these emails, you may unsubscribe now. | Email delivery powered by Google |
| Google, 1600 Amphitheatre Parkway, Mountain View, CA 94043, United States | |
No comments:
Post a Comment