
Forex analysis review |
- Forecast for USD/JPY on September 3, 2020
- Hot forecast and trading signals for EUR/USD on September 3. COT report. US dollar grows, but data has nothing to do with
- Analytics and trading signals for beginners. How to trade EUR/USD on September 3? Getting ready for Thursday session
- Evening review on September 2, 2020
- September 2, 2020 : EUR/USD daily technical review and trade recommendations.
- September 2, 2020 : EUR/USD Intraday technical analysis and trade recommendations.
- September 2, 2020 : GBP/USD Intraday technical analysis and trade recommendations.
- US dollar slightly strengthened
- EURUSD: The euro is falling amid a loss of optimism by market participants after disappointing statistics on the Eurozone
- Ichimoku cloud indicator Daily analysis of Gold for September 2, 2020
- Strong pull back in EURUSD
- USDCAD bounces as expected but remains in bearish trend
- Comprehensive analysis of movement options for Gold & Silver (H4) on September 3, 2020
- US stock exchanges rose significantly tapping Asian and EU stocks
- Pound's future prospect: either a sharp rise or fall
- EUR/USD: plan for the American session on September 2
- GBP/USD: plan for the American session on September 2
- Trading recommendations for the GBP/USD pair on September 2
- USDCAD bounced from (Intermediate) support, potential for a further rise!
- AUDJPY testing downside confirmation, further drop expected !
- AUDUSD is facing bearish pressure, potential for further drop!
- Daily Video Analysis: EURJPY High Probability Setup
- BTC analysis for September 02,.2020 - Creation of the C leg is active with potential for drop towards $10.575
- Analysis of Gold forSeptember 02,.2020 - Rejection of the major pivot resistance at $1.975 and potential for the downside
- Best month for stock markets
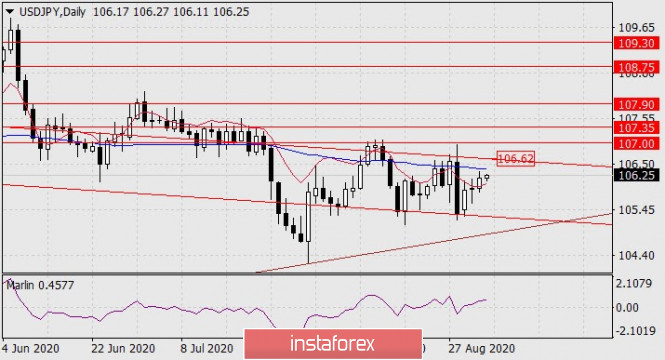
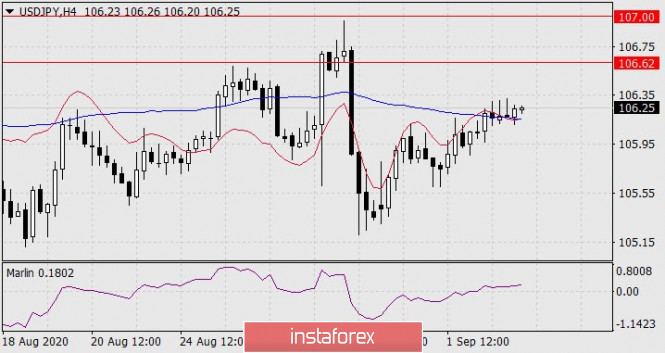
| Forecast for USD/JPY on September 3, 2020 Posted: 02 Sep 2020 07:44 PM PDT USD/JPY Yesterday, the stock market significantly grew by 1.54% (S&P 500) while the dollar strengthened by 0.37%. These factors made it possible for the USD/JPY pair to maintain an upward trend and also gain a foothold above key resistance indicators. The daily chart shows that consolidation took place above the balance line. Now the market's nearest price target is the price channel line at 106.62. The price leaving the area above it will prolong growth towards the 107.00 level. The price settled above both indicator lines on the four-hour chart: above the balance line (red) and the MACD line (blue). The Marlin oscillator is in the growth zone, and the 106.62 target is open. The material has been provided by InstaForex Company - www.instaforex.com |
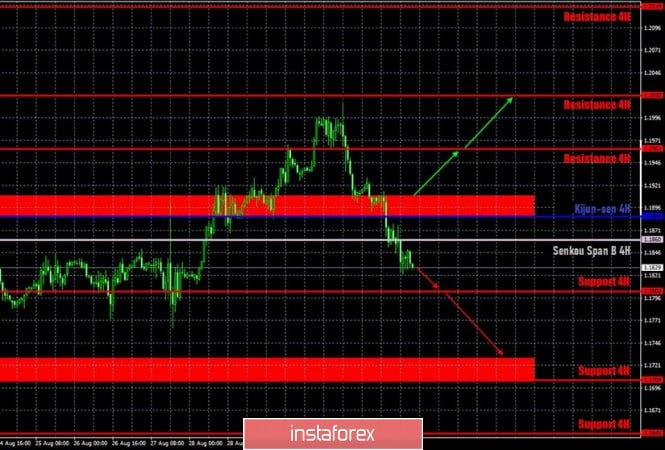
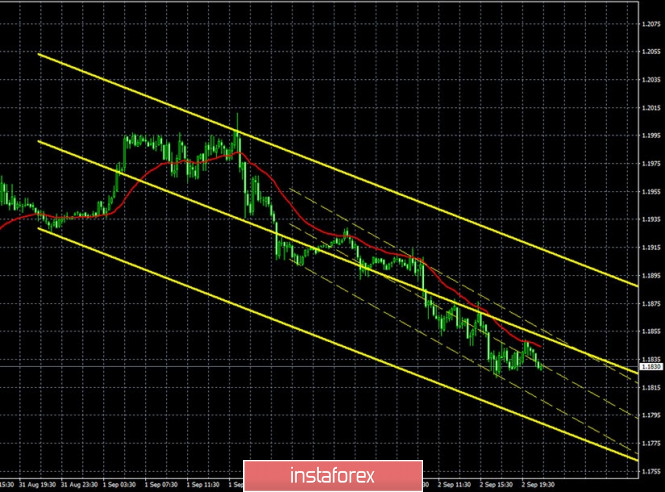
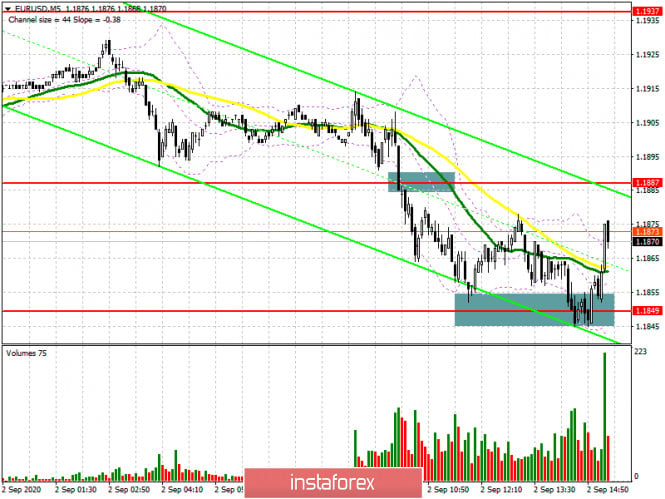
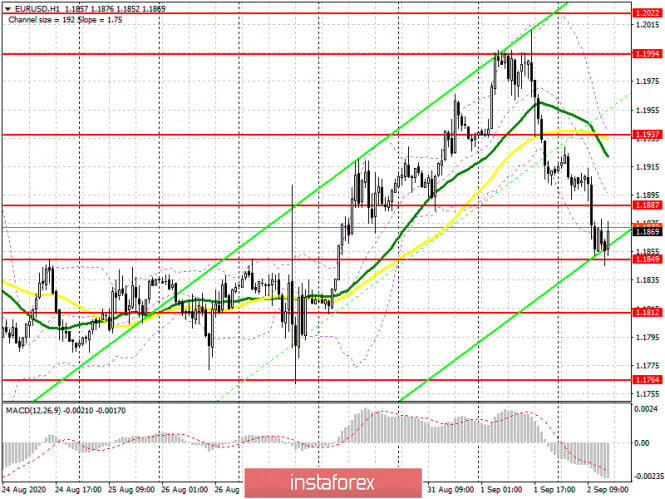
| Posted: 02 Sep 2020 05:44 PM PDT EUR/USD 1H The euro/dollar pair calmly crossed the support area of 1.1886-1.1910, then the Kijun-sen and Senkou Span B lines on the hourly timeframe on September 2. Thus, the bears were finally active and can now take the pair back to two-month lows located near the $1.17 level. It is still difficult to say whether the US dollar will be able to continue strengthening below this level. Considering the fundamental background that continues to come from overseas. However, as we have said more than once, no currency can rise in price forever, and a correction has been brewing for the euro for more than a month. And not a 200-point downward correction, but at least by 300-400 points, since the total upward movement over the past three months is 1200 points. Thus, at this time, we expect the quotes to decline to $1.17. EUR/USD 15M Both linear regression channels turned down on the 15-minute timeframe, thereby signaling a downward trend. A new Commitments of Traders (COT) report was released last Friday. Take note that its character has not changed at all compared to previous COT reports. Despite the fact that the euro/dollar has been trading within the side channel for more than a month, professional traders continue to increase their net position. In other words, the number of Buy-contracts is growing for non-commercial traders (the most important group of traders), while the number of Sell-contracts is decreasing. The non-commercial category of traders opened 1,302 Buy-contracts and closed 11,310 sell contracts during the reporting week on August 19-25. Thus, the net position (the difference between the number of buy and sell contracts) increased by 12,000. Therefore, we can draw the same conclusions as a week ago and two weeks ago: professional traders continue to view the euro as a more attractive currency to invest than the US dollar. The euro continued to steadily grow during the last five trading days (August 26 - September 1), which will be included in the next COT report. The fall started on the evening of September 1, thus, it is unlikely that the new report will reflect the euro's fall. Moreover, as before, so far the euro's fall is not too strong. All the same notorious 200 points. The only report that was released in the eurozone on Wednesday, September 2 was data on retail sales in Germany, which showed a decrease in July by 0.9% m/m. However, US data were no better - the ADP report on changes in the number of employees in the private sector showed an increase of only 428,000, while forecasts predicted an increase of 950,000. A month earlier, this report also turned out to be significantly weaker than expert forecasts. Thus, the US data could have hardly triggered the dollar's rise. Meanwhile, some case studies show that US President Donald Trump is closing the lead over his main opponent in the presidential election, Joe Biden. At the moment, USA Today reports Biden's 7% gap from Trump. Earlier, many publications and opinion polls showed a gap of at least 12%. However, in total, about 1,000 Americans were interviewed, which is very small for such conclusions. The error of the results can be 5-10%. Thus, in reality, Biden's lead of 10-12% may remain. Based on the above, we have two trading ideas for September 3: 1) Bulls continue to take profits after reaching the 1.2000 level. Since the price has settled below the Kijun-sen and Senkou Span B lines, which are the two strongest lines of the Ichimoku indicator, it is not recommended to open long deals at this time. Bulls can become active again above the 1.1886-1.1910 area. In this case, long positions will be relevant with targets at the resistance levels of 1.1961 and 1.2020. Take Profit in this case will be from 30 to 90 points. 2) Bears got a new opportunity to start forming a new downward trend, as they managed to gain a foothold below the Senkou Span B line (1.1860). Thus, we recommend staying in short positions with targets at the 1.1803 level and the support area of 1.1705-1.1728 as long as the price is below the Senkou Span B line. The potential Take Profit in this case is 20 to 90 points... An upward correction is possible after the quotes fall by almost 200 points. Explanations for illustrations: Support and Resistance Levels are the levels that serve as targets when buying or selling the pair. You can place Take Profit near these levels. Kijun-sen and Senkou Span B lines are lines of the Ichimoku indicator transferred to the hourly timeframe from the 4-hour one. Support and resistance areas are areas from which the price has repeatedly rebounded off. Yellow lines are trend lines, trend channels and any other technical patterns. The material has been provided by InstaForex Company - www.instaforex.com |
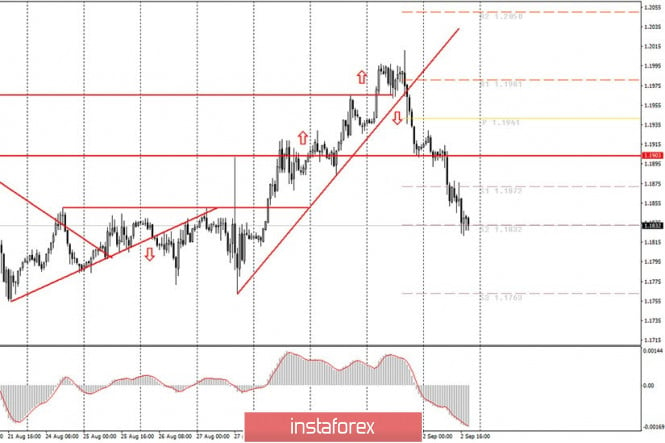
| Posted: 02 Sep 2020 10:02 AM PDT Hourly chart of the EUR/USD pair On Wednesday, September 2, the EUR/USD pair simply continued to move down without any correction or a hint of its beginning. Even the MACD indicator did not turn up and, thus, did not form a signal to close short positions. As a result, the first target level of 1.1872 was reached and overcome, and then the second support level 1.1832 was also reached. Thus, traders who have remained in the market since the price has settled below the upward trend line are currently in profit of about 120 points. Those traders who opened new trades this morning are in profits of 35 to 70 points. We believe it is possible to close sell orders around the 1.1832 level, although the quotes could continue to fall. The MACD indicator may start to discharge in the near future. An indicator discharge is when the histogram's movement and signal line are in a different direction than the price movement. That is, for example, the indicator began to rise, but the price continues to fall. This happens when the pair moves in one direction for too long and without corrections. The indicator has a limited one-way stroke, so it simply cannot go down infinitely and starts to discharge. Therefore, if the indicator reverses, but the price does not, this signal is considered false and invalid. So, if the price correction does not start by tonight and tomorrow morning, the indicator will most likely start to discharge. The most important event for today is the ADP report on changes in the number of employees in the US private sector. This is a very remarkable moment. As we have already figured out, the dollar continues to consecutively grow for days, and yesterday, we concluded that the ISM index and weak eurozone inflation contributed to its appreciation. Today the ADP report turned out to be below the forecasted values, and significantly lower. Accordingly, it could not provide support to the US dollar. Accordingly, the dollar continued to rise solely for technical reasons. And the technical reasons could be: 1) buyers closing long positions, which leads to an increase in the euro's supply in the market and a fall in its rate; 2) sellers opening short positions, which leads to a decrease in the dollar's supply in the market and a fall in the pair's rate. The European Union is set to release the following data on September 3: the index of business activity in the services sector and retail sales for July. The United States will publish applications for unemployment benefits, trade balance, ISM and Markit PMIs for services. We believe that from this entire list of macroeconomic reports, one can pay attention only to the ISM index for the service sector in the United States. European news is likely to be ignored. American ones can also be ignored, so you should pay more attention to technical factors. Possible scenarios for September 3: 1) Novice traders are not recommended to buy at this time, since the pair has already settled below the upward trend line, so the trend has now changed to a downward trend. There are currently no signals or technical patterns that support the upward trend. Thus, buyers only need to wait for the formation of trend lines or channels that would indicate an upward trend. 2) Sales continue to look more relevant, but after a two-day drop in quotes, an upward correction is already brewing. If the price fails to overcome the 1.1832 level, the upward movement could start from here. Therefore, we recommend reducing short positions near the 1.1832 level, and considering options for opening new sales after the pair corrects to the upside. On the chart: Support and Resistance Levels are the Levels that serve as targets when buying or selling the pair. You can place Take Profit near these levels. Red lines are the channels or trend lines that display the current trend and show in which direction it is better to trade now. Up/down arrows show where you should sell or buy after reaching or breaking through particular levels. The MACD indicator consists of a histogram and a signal line. When they cross, this is a signal to enter the market. It is recommended to use this indicator in combination with trend lines (channels and trend lines). Important announcements and economic reports that you can always find in the news calendar can seriously influence the trajectory of a currency pair. Therefore, at the time of their release, we recommended trading as carefully as possible or exit the market in order to avoid a sharp price reversal. Beginners on Forex should remember that not every single trade has to be profitable. The development of a clear strategy and money management are the key to success in trading over a long period of time. The material has been provided by InstaForex Company - www.instaforex.com |
| Evening review on September 2, 2020 Posted: 02 Sep 2020 09:02 AM PDT
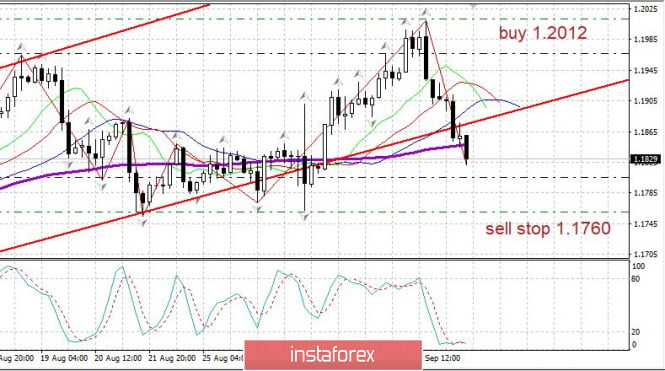
EURUSD: The euro suddenly rolled back down after the publication of data on the US ISM manufacturing report on business sector PMI. Meanwhile, the US employment report for the month of August was released. According to the report, there are around 426,000 new jobs in the country. This is significantly less than the estimated 1 million - 1.2 million in the preliminary forecasts. This, however, hindered the continuity of growth of the euro which already fell to 1.1830 and is not yet retrieving its upward position. In this regard, you may consider selling from 1.1760 and buy from 1.2010. The material has been provided by InstaForex Company - www.instaforex.com |
| September 2, 2020 : EUR/USD daily technical review and trade recommendations. Posted: 02 Sep 2020 07:45 AM PDT
The EUR/USD pair has been moving sideways within the depicted expanding channel since August 3. Previously, a temporary resistance level was formed around 1.1900 which prevented further upside movement for some time and forced the pair to have a downside pause towards 1.1715.On August 12, a new short-term uptrend line was initiated around 1.1715 which allowed the EURUSD pair to achieve a new breakout above the previously mentioned resistance zone. On August 19, the mentioned breakout turned to be a buying trap. This enhanced the bearish side of the market towards 1.1800 where significant BUYING pressure has been demonstrated since then. Recently, the EUR/USD pair is demonstrating downside retracement below the upper limit of the previous movement. Any downside pullback towards the key level around 1.1815, now acting as a support level, should be considered for a BUYING opportunity. Initial target would be located around 1.1865 and 1.1900 while Stop Loss should be placed just below 1.1775. The material has been provided by InstaForex Company - www.instaforex.com |
| September 2, 2020 : EUR/USD Intraday technical analysis and trade recommendations. Posted: 02 Sep 2020 07:37 AM PDT
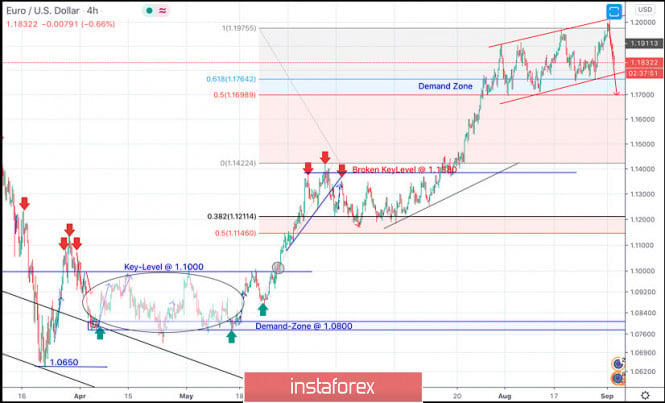
On May 14, the EUR/USD has expressed evident signs of Bullish rejection as well as a recent ascending bottom around the price zone of (1.0815 - 1.0775).Thus, enhancing the bullish side of the market in the short-term. Bullish breakout above 1.1000 has enhanced further bullish advancement towards 1.1150 then 1.1380 where another sideway consolidation range was established. The EURUSD pair has failed to maintain enough bearish momentum below 1.1150 (consolidation range lower zone) to enhance further bearish decline. Instead, the current bullish breakout above 1.1380-1.1400 has lead to a quick bullish spike directly towards 1.1700 (Fibonacci Expansion 150% level) which failed to offer sufficient bearish pressure. Bullish persistence above 1.1700-1.1760 favored further bullish advancement towards 1.1975 (200% Fibo Expansion Level) where some considerable bearish rejection has been demonstrated. The price zone around 1.1975-1.2000 ( upper limit of the technical channel ) remains a strong SUPPLY-Zone to be watched for bearish reversal. However, Conservative traders should be waiting for bearish re-closure below 1.1700. As this indicates lack of bullish momentum and enhances further bearish decline initially towards 1.1600 and 1.1500. Trade recommendations : Conservative traders should wait for the current bullish movement to get back below 1.1700 as an indicator for lack of bearish momentum for a valid SELL Entry.T/P levels to be located around 1.1600 and 1.1500 while S/L to be placed above 1.1760 to minimize the associated risk. The material has been provided by InstaForex Company - www.instaforex.com |
| September 2, 2020 : GBP/USD Intraday technical analysis and trade recommendations. Posted: 02 Sep 2020 07:35 AM PDT
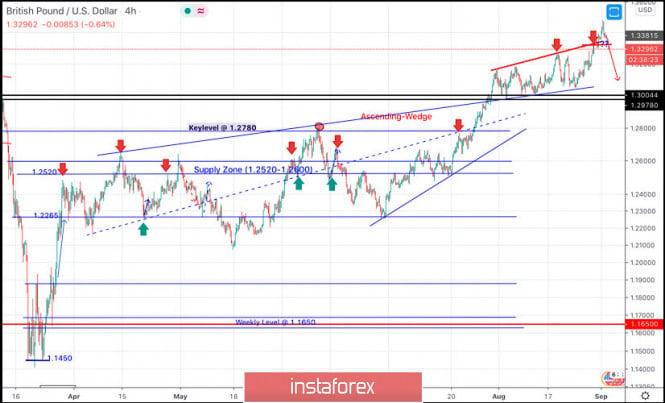
Transient bearish breakout below 1.2265 (consolidation range lower limit) was demonstrated in the period between May 13 - May 26. However, immediate bullish rebound has been expressed around the price level of 1.2080 bringing the GBP/USD back towards 1.2780 (Previous Key-Level) where another episode of bearish pullback was initiated. Short-term bearish movement was expressed towards 1.2265 where Significant bullish rejection was originated bringing the GBP/USD pair back towards 1.2780 where this key-level failed to offer enough bearish rejection. Intermediate-term Technical outlook for the GBP/USD pair remains bullish as long as bullish persistence is maintained above 1.2780 (Depicted KeyLevel) on the H4 Charts. On the other hand, the GBPUSD pair looks overbought after such a quick bullish movement while approaching the current price levels.That's why, short-term bearish reversal shouldn't be excluded provided that bearish persistence is maintained below the current price level Of 1.3300. Trade recommendations : Intraday traders are advised to look for continuation of bearish rejection below the price levels of (1.3300) as a valid SELL Entry. Initial T/p level is to be located around 1.3300, 1.3200 and 1.3100. On the other hand, bullish persistence above 1.3350 invalidates this trading scenario. The material has been provided by InstaForex Company - www.instaforex.com |
| US dollar slightly strengthened Posted: 02 Sep 2020 06:57 AM PDT
The dollar is marginally growing against the euro and the Japanese yen. There was a slight rise in Wednesday's trade on the foreign exchange market for the US dollar. The price of the euro was able to reach $ 1.1897 on Wednesday morning, earlier its rate was at around $ 1.1912. But it should be noted that Tuesday's trading marked a significant movement for the euro after finally stepping at the $ 1.2 mark several times during the trading day. However, a rollback then took place. The euro is striving to take a better position, and it has every chance for that, but weak statistics on economic growth in the European region so far prevents it from doing so. The consumer prices in the European Union declined in the last month of summer by 0.2% on a yearly basis. The data came as a surprise to experts, who argued that there should be an increase of 0.2% on average. In addition, the unemployment rate in nineteen countries in Europe significantly increased in the second month of the summer by 7.9%. This is the highest dynamics recorded over the past two years. The euro also slowed down its growth rates against the Japanese yen on Wednesday, which moved at £126.18 per euro. Note that it closed Tuesday's trading at £126.21 per euro. The Japanese yen, on the other hand, slightly weakened against the US dollar. On Wednesday, the price of the greenback moved to the level of £106.06 per dollar, although earlier it was at £105.96 per dollar. Earlier the same day, the price of the pound sterling went to the area of $1.3362 per pound. As a result of yesterday's trading, the level of $1.3384 per pound was fixed. Meanwhile, it slightly decreased against the euro moving from 1.1235 to 1.1231 euros per sterling. The Aussie was the only one that showed a significant decline against the US dollar which moved down by 0.22%. That is from 0.7372 to 0.7356 dollars per Aussie. The USD index managed to rise 0.4% on Wednesday in relation to a basket of six major world currencies, which includes the yen, franc, euro, Canadian dollar, krone, and pound sterling. The dollar index against a basket of sixteen major world currencies rose similarly by 0.4%. The material has been provided by InstaForex Company - www.instaforex.com |
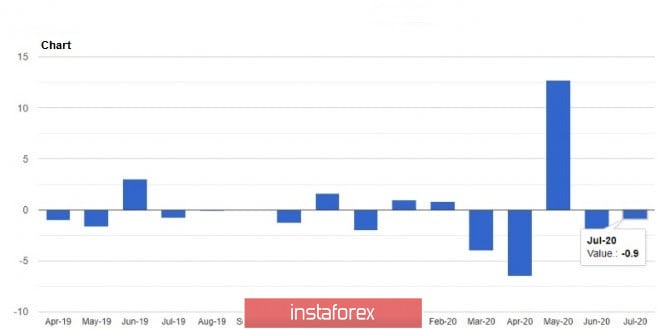
| Posted: 02 Sep 2020 06:51 AM PDT The euro continued its downward movement, which was formed yesterday after a series of weak fundamental statistics on inflation in the Eurozone. Today's data on retail sales in Germany added only pessimism to the market. The report disappointed economists and traders, as after the May peak, when there was a sharp surge in sales against the background of the cancellation of quarantine measures, the indicator began to decline again. A serious decline in volumes will negatively affect the prospects for a V-shaped recovery in the German economy in the 3rd quarter of this year. As we can see, deferred demand is no longer working, and many households are wary of new purchases and everyday spending. The indicator was not helped by the temporary reduction in VAT, which allowed many sellers to lower their prices. This parameter, if you remember, led to a sharp slowdown in the Eurozone consumer price index in August this year. Experts also expected that the refusal to take vacations due to the coronavirus pandemic could lead to increased spending in the summer, however, this did not happen. However, there are signs of normalization of sales in various areas. First of all, clothing sales have reached their acceptable level, while medicines and related products in pharmacies are losing momentum. So, today's report from the Federal Bureau of Statistics Destatis shows that retail sales in Germany in July 2020 decreased by 0.9% compared to the previous month. Compared to the same period of the previous year, sales increased by 4.2%. As noted above, retail sales of food and beverages grew by 4.2%, thanks to the recovery in the service sector. Sales of non-food items increased by 4.4%. Returning to the topic of inflation, after yesterday's rather weak report on the consumer price index, today's data on producer prices were surprising. But we must understand that this is a July indicator, which does not play a special role. The report shows that the Eurozone PPI producer price index in July this year rose by 0.6%, but decreased by 3.3% compared to last year. The data was better than the forecasts of economists, who expected this indicator at 0.5%. However, it should be understood that these are data for July, while such progress in growth in August can not be expected. The Eurozone producer price index excluding energy remained unchanged in July compared to the previous month. Let me remind you that the consumer price index CPI of the Eurozone in August 2020 decreased by 0.2% compared to the same period of the previous year, after an increase of 0.4% in July. Economists had expected the index to grow by 0.2%. Even though global oil and food prices have recovered, this has not led to the deflationary pressures caused by the pandemic. An interview with Richmond Fed President Thomas Barkin was also published today, who noted that now is not the time to exaggerate concerns about financial stability. We are also talking about the emergency assistance programs that are currently operating in the United States, which will certainly be adopted in the future. However, Barkin is confident that ultra-low interest rates will have to be paid for, however, the economy will need support for a long time, so no one will even think about changing them in the next few years. As for the technical picture of the EURUSD pair, the market continues to develop in a bearish morning scenario. At the moment, the bears are trying to break through the support of 1.1850, which will certainly push risky assets to new lows in the area of 1.1810 and 1.1760. Under the scenario of growth of the trading instrument, buyers will probably start having problems already in the resistance area of 1.1890, which until recently was a support. The material has been provided by InstaForex Company - www.instaforex.com |
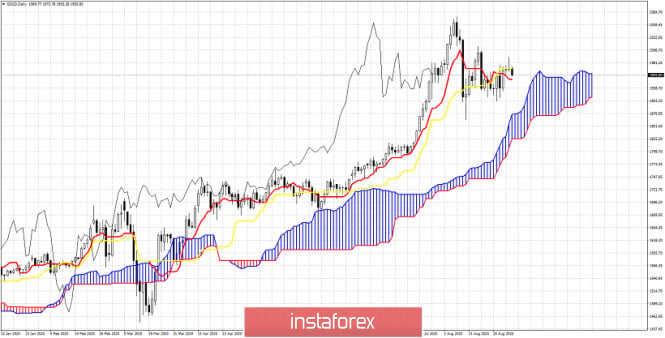
| Ichimoku cloud indicator Daily analysis of Gold for September 2, 2020 Posted: 02 Sep 2020 06:48 AM PDT Gold price remains stuck around $1,950. Gold made a high at $1,991 but price closed below key resistance of $1,970. Gold price was unable to break above the kijun-sen indicator and is now pulling back towards short-term support at $1,950.
|
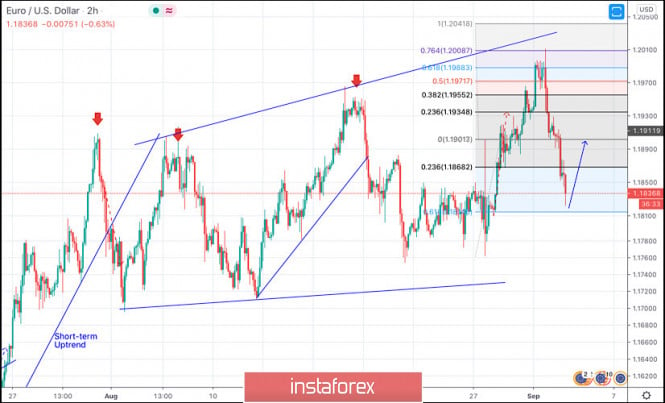
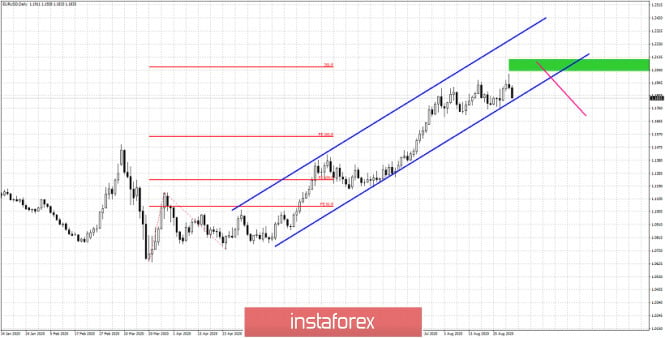
| Posted: 02 Sep 2020 06:39 AM PDT In our previous analysis we noted that our next target in EURUSD was around 1.2060 where we find the 261.8% Fibonacci extension of the first leg higher. EURUSD was expected to make a pull back towards 1.18-1.16.
Blue lines - bullish channel Green rectangle - target Purple line -expected path Red lines- Fibonacci extensions EURUSD made a high yesterday at 1.2010 and is now trading around 1.1834. Our first pull back target is very close. Price remains inside the bullish channel. Can EURUSD move towards 1.2060-1.21 again. As long as price holds above 1.1762 we could see the channel support hold and price bounce off the support area around 1.18-1.1760. If this is the case, then we could see a move inside or above the green rectangle area. If the channel fails to hold, then we expect the second pull back target of 1.16 to be challenged. The material has been provided by InstaForex Company - www.instaforex.com |
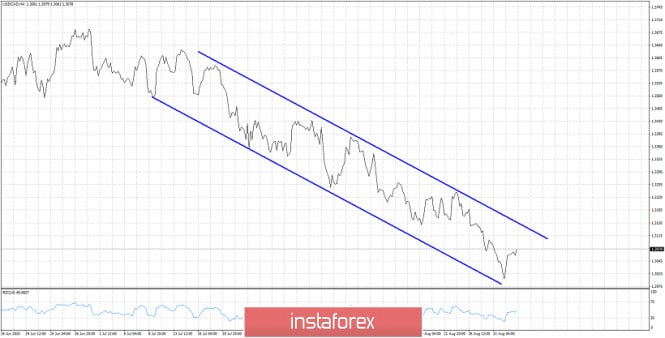
| USDCAD bounces as expected but remains in bearish trend Posted: 02 Sep 2020 06:35 AM PDT USDCAD has reached our 1.30 target area and is bouncing towards 1.31 as we expected in our last analysis. USDCAD remains inside the downward sloping channel making lower lows and lower highs.
USDCAD can continue its upward bounce towards 1.3150 and the upper channel boundary. This would be a normal counter trend bounce to relief some of the selling pressures. As long as price is below 1.3230 we consider each bounce as a selling opportunity. Bulls need to break above 1.3150 and stay above in order to hope for a bigger bounce. For now we believe that price is more probable to get rejected around 1.31-1.3150. The material has been provided by InstaForex Company - www.instaforex.com |
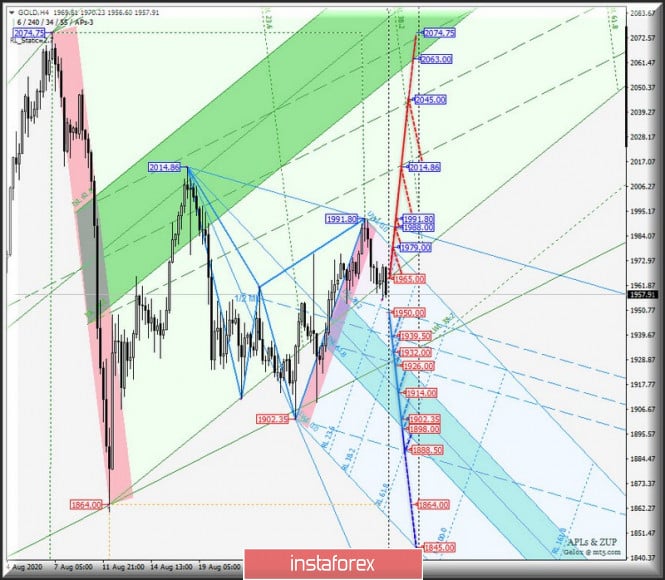
| Comprehensive analysis of movement options for Gold & Silver (H4) on September 3, 2020 Posted: 02 Sep 2020 06:31 AM PDT Minute operational scale (H4) How will the fight of metals vs US dollar continue? An overview of options for the movement of Gold & Silver on September 3, 2020. ____________________ Spot Gold The Spot Gold movement from September 3, 2020 will develop depending on the development and direction of the range breakdown:
In the event of a breakdown of the support level of 1950.00, the Spot Gold movement may develop within the boundaries of the 1/2 Median Line channel (1950.00 - 1939.50 - 1926.00) and equilibrium zones (1932.00 - 1914.00 - 1898.00) of the Minuette operational scale forks. In the event of a breakdown of the initial SSL Minute line - resistance level of 1965.00 - the development of the Spot Gold movement will be directed to the goals:
Details of the Spot Gold movement since September 3, 2020 can be seen on the animated chart.
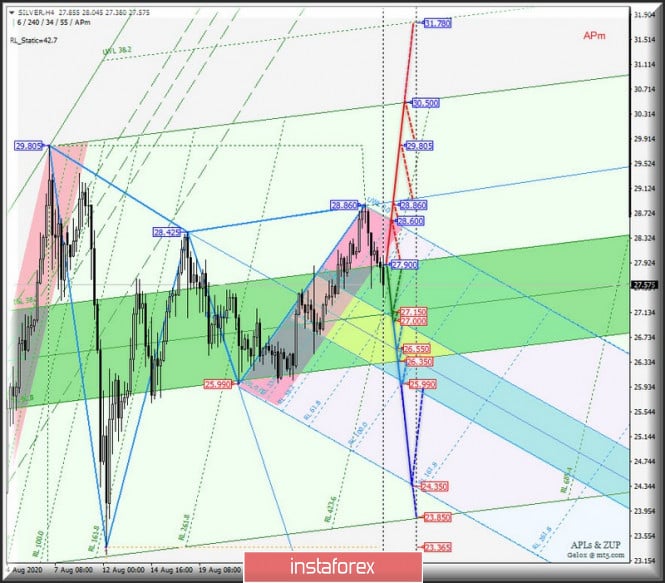
____________________ Spot Silver The development of the Spot Silver movement from September 3, 2020 will continue within the boundaries of the equilibrium zones of the operational scale fork - Minute (27.900 - 27.150 - 26.350) and Minuette (27.000 - 26.550 - 25.990) - details of movement within these zones are shown on the animated chart. Continued downward movement of Spot Silver will become possible when breaking the lower border ISL61.8 equilibrium zone of the Minuette operational scale forks - support level of 25.990 and will be sent to the ultimate line FSL Minuette (24.350). In turn, if the upper limit of ISL61.8 equilibrium zone of the Minute operational scale forks is broken - resistance level of 27.900 - the development of an upward movement of Spot Silver towards the goals will become relevant:
Details of the Spot Silver movement options from September 3, 2020 are shown in the animated chart.
____________________ The review is compiled without taking into account the news background, the opening of trading sessions of the main financial centers, and is not a guide to action (placing "sell" or "buy" orders). The material has been provided by InstaForex Company - www.instaforex.com |
| US stock exchanges rose significantly tapping Asian and EU stocks Posted: 02 Sep 2020 06:27 AM PDT
US stock markets continue to rise on Wednesday. The previous trading day session ended with a fairly significant increase in the main stock indicators. The S&P 500 and Nasdaq are once again rising above their previously recorded highs. On Tuesday, the ISM manufacturing report on business PMI in the US was released, which somehow created a positive impact on the activity of the stock market. According to the data, the US manufacturing sector was able to rise in August by 56%, a month earlier, it rose 54.2%. Note that the last time such a rise was recorded was almost two years ago. Experts' initial report estimated that the rise would not exceed to 54.5%. Of course, such a sharp jump could not fail to please market participants who have tangible hope for a faster recovery of the country's economy after the crisis brought by the pandemic. Another factor of excellent support was the rise in the US' own stock indicators during the last month of summer. The Dow Jones swiftly moved up by 7.6%, which was its best result over the past thirty-six years. The S&P 500 Index added 7% to its previous level in August, reflecting its highest growth in the last thirty-four years. However, the biggest success was achieved by the Nasdaq indicator, which jumped immediately by 9.6%, and this is its best rise in the last twenty years. Moreover, the positive dynamics on the US stock exchanges have been observed for the past five months in a row, which also did not go unnoticed by market participants, who were even more inspired by such work. The next important event for investors, which should happen very soon, will be the publication of data on the unemployment rate in the country over the past month. The US Department of Labor is to report on the number of jobs and new claims for unemployment benefits. However, don't forget about the new inflation targeting policy of the Federal Reserve. Perhaps now market participants will perceive all information on the labor market differently, since the state is going to direct the bulk of its efforts on it. The Dow Jones Industrial Average index added 0.76% on Tuesday, which allowed it to reach 28,645.66 points. The Standard & Poor's 500 Index gained about the same with 0.75%. Its current level has stopped at around 3,526.65 points. The Nasdaq Composite index became the leader of Tuesday's growth which immediately went up by 1.39%, pushing it to the level of 11,939.67 points. Meanwhile, Asian stocks recorded a rather weak dynamics in the main stock indicators on Wednesday. The market was less volatile. Nevertheless, a positive reaction from market participants was reflected in the rise on the US stock markets. Asian investors were very encouraged by the fact that the Standard & Poor's 500 and Nasdaq Composite were able to renew their record highs. This gave them hope that something similar could happen in their region. However, the recovery of the US economy itself is still in question, since the threat of the coronavirus pandemic still exists. Japan's Nikkei 225 Index rose 0.45%. China's Shanghai Composite index, on the other hand, dropped slightly by 0.03%. The Hong Kong Hang Seng Index followed suit and went down 0.08%. South Korea's Kospi Index rose 0.56%, however, the statistics on the inflation rate in the state were not very impressive. There was a rise in the inflation rate in the country over the last five months. Moreover, the consumer price index also rose 0.7% from the same period last year and 0.3% from a month earlier. These data did not coincide with the initial forecast estimating a 0.6% growth. Prices in the last month of summer increased by 0.6%, while earlier they remained at the same level. At the same time, analysts were preparing for an increase of no more than 0.5%. The Australian S & P / ASX 200 has become the leader of the growth which was able to immediately add 1.78%. At the same time, the news that the country's economy faced a recession for the first time in thirty years did not affect the indicator in any way. The main support here comes from the possibility of introducing additional incentive measures that will be able to affect the economic development in the country. The Australian economy in the second quarter of this year showed a 7% contraction. Moreover, the fall continues for the second quarter in a row. As a reminder, in the first quarter it was not so significant and amounted to 0.3%. Remarkably, the decline recorded between April and June was the largest ever recorded for this indicator. European stock exchanges, on the other hand, traded in a positive zone which was formed against the background of the growth of stock indicators in America. However, it closed Tuesday's trading with a drop in its indicators. The negative was due to the not so impressive statistics on the growth of the EU economy. Statistical data on changes in the level of consumer prices in European countries were released on Tuesday, which came as a complete surprise to analysts. As it turned out, consumer prices over the last month of the summer fell by 0.2% on an annualized basis. This is the first time this has happened in more than four years. The general index of large enterprises in the Stoxx Europe 600 rose significantly on Wednesday morning by 1.68%, moving it to the level of 371.35 points. The UK FTSE 100 Index jumped 1.59%. The German DAX index rose even more by 1.85%. France's CAC 40 Index went up 1.78%. Spain's IBEX 35 Index gained 0.51%. Italy's FTSE MIB Index climbed 1.19%. The material has been provided by InstaForex Company - www.instaforex.com |
| Pound's future prospect: either a sharp rise or fall Posted: 02 Sep 2020 06:08 AM PDT
According to analysts, in the medium and long term, the pound sterling may surprise the market with either rapid rise or fall. In addition, experts stressed that the pound may face a hard time in the near future. The pound may face serious volatility due to the difficult economic and political situation. One of the main risk factors for the pound is the current position of the Bank of England. Ahead of the meeting of the regulator, which will take place on Wednesday, September 2, the sterling began to rapidly lose its positions. It traded in the 1.3376-1.3377 range on Wednesday morning and then, later on, went in a downward spiral. By afternoon, the GBP / USD pair was cruising around 1.3352-1.3353, responsive to the alarming market sentiment. Experts express different opinions on further actions of the Bank of England. Currency strategists at Danske Bank are confident that the regulator will keep the rate at the previous level of 0.1%, but may again return to the issue of negative rates. Analysts do not exclude that in the fall the central bank will increase the asset purchase program by another 50-100 billion pounds. Note that this year, the Bank of England left interest rates at extremely low values and increased the purchase of government bonds. These measures were necessary to support the national economy, which is seriously affected by the COVID-19 pandemic, and to address the problems with the Brexit. The weak economic activity in the UK and a large-scale current account deficit in the country are some of the other risk factors for the pound sterling. Against this background, investor interest in GBP is declining, which does not add optimism to the said currency. At the beginning of autumn, the Brexit topic becomes relevant for the British government, the deadline for which is December 31, 2020. According to experts, in the second half of this year, the sterling may resume its decline if the UK and the European Union do not sign a trade agreement. At the same time, analysts emphasize that negative news has already been taken into account in the GBP price since the Brexit referendum. However, this will not prevent the pound from hitting the bottom, since Brexit without an agreement will still shock the British economy, despite the market's optimistic sentiment. The current situation keeps the pound in suspense, and the economy of the United Kingdom is in a state of uncertainty. This has an extremely negative effect on the pace of its recovery and the investment climate in the country, experts summarize. The material has been provided by InstaForex Company - www.instaforex.com |
| EUR/USD: plan for the American session on September 2 Posted: 02 Sep 2020 05:51 AM PDT To open long positions on EURUSD, you need to: A sharp decline in retail trade in Germany, together with yesterday's bearish momentum in the European currency, quickly led to a breakdown of the support of 1.1887, below which I recommended opening short positions. If you look at the 5-minute chart, you will see how the rapid breakdown of the level of 1.1887 resulted in another sale of the European currency in the support area of 1.1849, from where I advised you to open long positions for a rebound, which happened. Currently, while a false breakout is formed, and trading is conducted above the level of 1.1849, you can count on the return of the European currency to the resistance area of 1.1887. But only fixing above this level forms a signal for a new opening of long positions in the continuation of growth to the maximum of 1.1937, where I recommend fixing the profits and where the moving averages pass. If the euro falls further below the level of 1.1849, it is best to postpone long positions until the 1.1812 low is updated or buy EUR/USD for a rebound from the support of 1.1764 in the expectation of a correction of 30-40 points within the day.
To open short positions on EURUSD, you need to: Sellers of the euro are still able to keep the market under their control and the next task is to return the pair to the support of 1.1849. Another test of this level will certainly lead to a breakdown, which will form a signal to open short positions in the expectation of further movement of EUR/USD to the area of the minimum of 1.1812. A more distant target will be the area of 1.1764, where I recommend fixing the profits. In the scenario of an upward correction of EUR/USD in the afternoon, it is best to wait for the formation of a false breakout in the resistance area of 1.1887 or open short positions immediately to rebound from the high of 1.1937, counting on a correction of 20-30 points within the day. In the afternoon, a number of representatives of the Federal Reserve System will also speak, which may support the US dollar.
Signals of indicators: Moving averages Trading is conducted below the 30 and 50 daily moving averages, which indicates the further formation of a downward correction. Note: The period and prices of moving averages are considered by the author on the H1 hourly chart and differ from the general definition of the classic daily moving averages on the D1 daily chart. Bollinger Bands If the euro rises in the second half of the day, you can consider short positions on a false breakout from the average border of the indicator in the area of 1.1890 or immediately on a rebound from the upper border in the area of 1.1940. Description of indicators
|
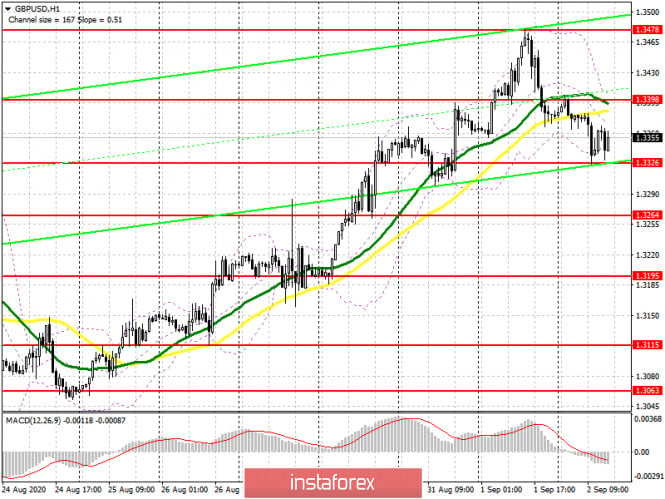
| GBP/USD: plan for the American session on September 2 Posted: 02 Sep 2020 05:49 AM PDT To open long positions on GBPUSD, you need to: In the first half of the day, I made a silent mistake with the support level, which was around 1.3326. Taking into account that we didn't reach my goal by about 5-7 points, we also failed to wait for the formation of a buy signal. At the moment, the technical picture in the GBP/USD pair has changed slightly. As long as trading is above 1.3326 and as long as the bulls hold this area, you can expect an upward correction to the resistance area of 1.3398. If the decline of the GBP/USD pair resumes, it is best to postpone long positions to the minimum of 1.3264 or even buy the pound for a rebound from the larger support of 1.3195 in the expectation of a correction of 20-30 points within the day. To open short positions on GBPUSD, you need to: Sellers have already tested support for 1.3326 several times, and most likely another decline to this level will form a good entry point for short positions. However, much will depend on what report the UK Treasury provides and how the Bank of England Governor Andrew Bailey speaks. In the case of an ultra-soft tone, a breakout of the level of 1.3326 is provided. In this case, we can expect a further decline in GBP/USD to the area of the minimum of 1.3264. The longer-term goal will be the area of 1.3195, where I recommend fixing the profits. If the growth scenario is based on the speech of the head of the Central Bank, it is best to be patient and look for short positions only when a false breakout is formed in the resistance area of 1.3398. I recommend selling GBP/USD immediately for a rebound only from the maximum of 1.3478, based on a correction of 30-40 points within the day.
Signals of indicators: Moving averages Trading is conducted below the 30 and 50 daily averages, which indicates the continuation of a downward correction for the pair. Note: The period and prices of moving averages are considered by the author on the H1 hourly chart and differ from the general definition of the classic daily moving averages on the D1 daily chart. Bollinger Bands A break in the lower limit of the indicator at 1.3330 will increase the pressure on the pound. Growth will be limited by the upper level of the indicator in the area of 1.3405. Description of indicators
|
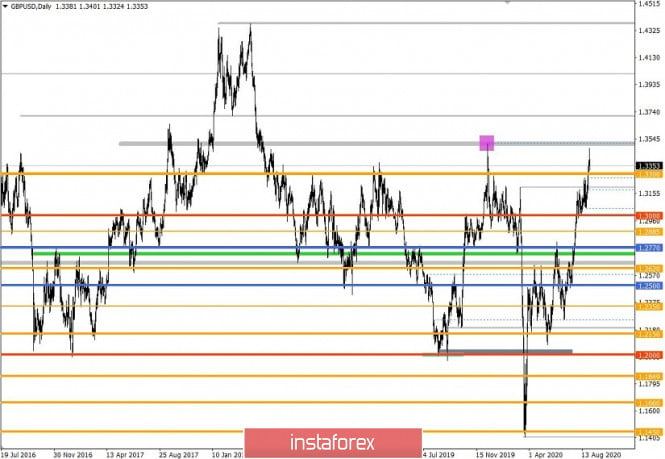
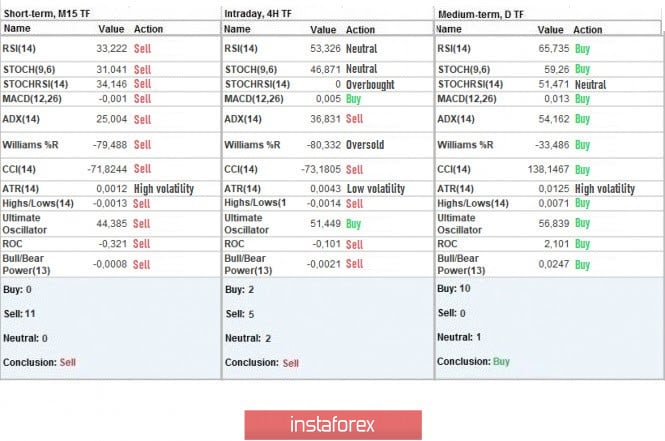
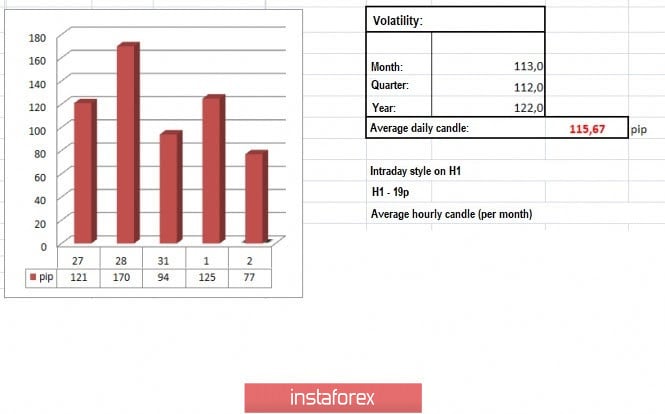
| Trading recommendations for the GBP/USD pair on September 2 Posted: 02 Sep 2020 04:47 AM PDT The pound remains trading upward in the market, and almost reached a price level of 1.3513. However, long positions were set lower than the control level, so the quote went into a correction and moved down again in the chart. Thus, if we look at the M15 chart for yesterday, we will see that short positions surged at 14: 30-18: 00, during the US trading session. It gave volatility of about 125 points, which is 8% higher than the average level. In addition, volatility has been high all throughout August, which means that market sentiment is high in GBP / USD. August: Monday - 107 points; Tuesday - 126 points; Wednesday - 103 points; Thursday - 75 points; Friday - 139 points; Monday - 84 points; Tuesday - 89 points; Wednesday - 62 points; Thursday - 95 points; Friday - 93 points; Monday - 47 points; Tuesday - 153 points; Wednesday - 173 points; Thursday - 159 points; Friday - 195 points; Monday - 95 points; Tuesday - 112 points; Wednesday - 101 points; Thursday - 121 points; Friday - 170 points; Monday - 94 points. At the same time, in the daily chart, it is clear that if the quote successfully pass 1.3513, price will automatically rise to the levels reached in spring 2018. As of the moment, there is only 30% left until the quote reaches these levels ... Data on the UK lending market was published yesterday, and it came out much better than the forecasts. Permits for mortgage lending rose 66.3 thousand amid recovery in the housing market, while the volume of mortgage lending, which was supposed to increase by £ 2.5 billion, jumped £ 2.7 billion. Consumer lending also showed a strong and healthy trend, with volume increasing by £ 1.2 billion, against a forecast of £ 0.6 billion. With regards to the long-awaited Brexit, London is losing hope in the conclusion of a trade agreement, and accused the European Union of not wanting to compromise. "The EU continues to insist that we must yield in difficult areas of negotiations, such as EU state aid, before further work can be done in any other area. This makes progress very difficult. We would like to solve simple issues first, in order to give impetus to the negotiations, since time is short on both sides, "said UK spokesperson, James Slack. "The talks are not progressing because of the unrealistic and uncompromising position of Great Britain," argued by the French Foreign Minister, Jean-Yves Le Drian. Today, ADP will publish its report on the level of employment in the US private sector, and its forecast is a rise by 950 thousand in August. Such an increase will have a positive effect on consumption, which will stimulate economic growth and strengthen the US dollar. US 13:15 - ADP report on employment in the private sector, for August Further development As we can see on the trading chart, the correction already to more than 150 points, and the mirror level of 1.3300 could become the support level for short positions. It is important to consider short positions after a consolidation below 1.3300, in order to avoid stagnation and return of long positions after a rebound from 1.3300. In any case, everything depends on 1.3300 / 1.3350, as it is in this range that upward scenarios could develop. Among which is the formation of the weekly channel, while the other is a long correction relative to an overbought pound sterling. Indicator analysis Looking at the different time frames, we can see that the indicators on the minute and hourly periods signal sell due to a correction in GBP / USD, while the daily period signals buy, in reflection of the current upward trend. Weekly volatility / Volatility measurement: Month; Quarter; Year Volatility is measured relative to the average daily fluctuations, which are calculated every Month / Quarter / Year. (It's dynamics on September 2 was calculated, all while taking into account the time this article is published) Volatility is 77 points today, which is 33% below the average. If speculation persists in the market, activity will increase even higher in the market. Key levels Resistance zones: 1.3600; 1.3850; 1.4000 ***; 1.4350 **. Support Zones: 1.3300 **; 1.3200; 1.3000 ***; 1.2885 *; 1.2770 **; 1.2620; 1.2500; 1.2350 **; 1.2250; 1.2150 **; 1.2000 *** (1.1957); 1.1850; 1.1660; 1.1450 (1.1411). * Periodic level ** Range level *** Psychological level Also check trading recommendations for the EUR/USD pair here, or brief trading recommendations for the EUR/USD and GBP/USD pairs here. The material has been provided by InstaForex Company - www.instaforex.com |
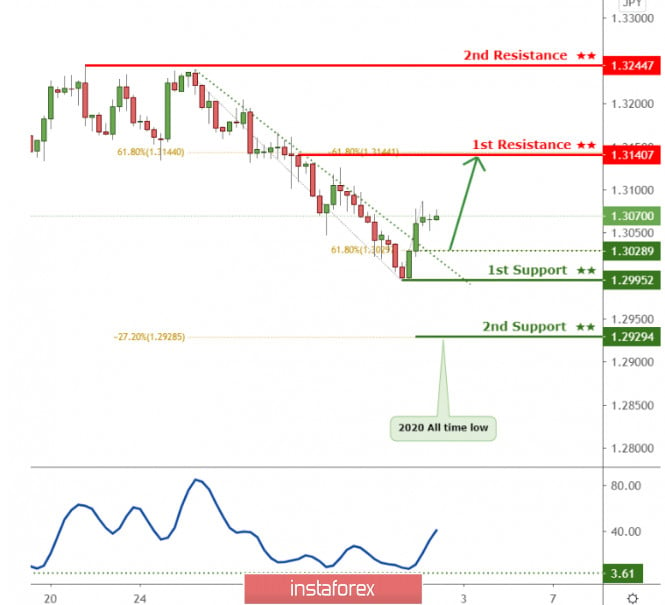
| USDCAD bounced from (Intermediate) support, potential for a further rise! Posted: 02 Sep 2020 04:29 AM PDT
Price broke above descending trendline resistance (now support). With stochastics reacting above support, a further push up above intermediate support at 1.30289 towards 1st resistance at 1.31407 can be expected. Trading Recommendation Entry: 1.30289 Reason for Entry: 61.8% Fibonacci retracement, descending trendline support Take Profit: 1.31407 Reason for Take Profit: 61.8% Fibonacci retracement Stop Loss: 1.29952 Reason for Stop Loss: Graphical swing low The material has been provided by InstaForex Company - www.instaforex.com |
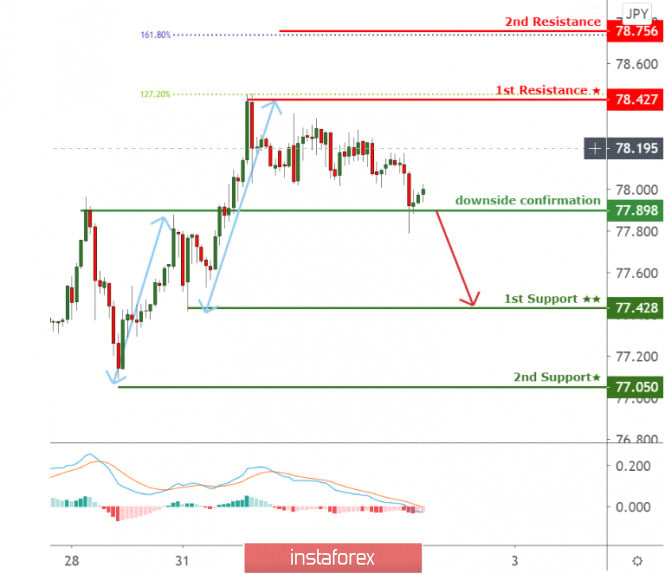
| AUDJPY testing downside confirmation, further drop expected ! Posted: 02 Sep 2020 04:29 AM PDT
Price is facing bearish pressure from our downside confirmation, where we could see a further drop towards 1st support at 77.43 if price breaks below downside confirmation at 77.90. MACD is also indicating more bearishness to come. Trading Recommendation Entry: 77.90 Reason for Entry: Horizontal overlap support Take Profit :77.43 Reason for Take Profit: Horizontal swing low Stop Loss: 78.43 Reason for Stop loss: Horizontal swing high The material has been provided by InstaForex Company - www.instaforex.com |
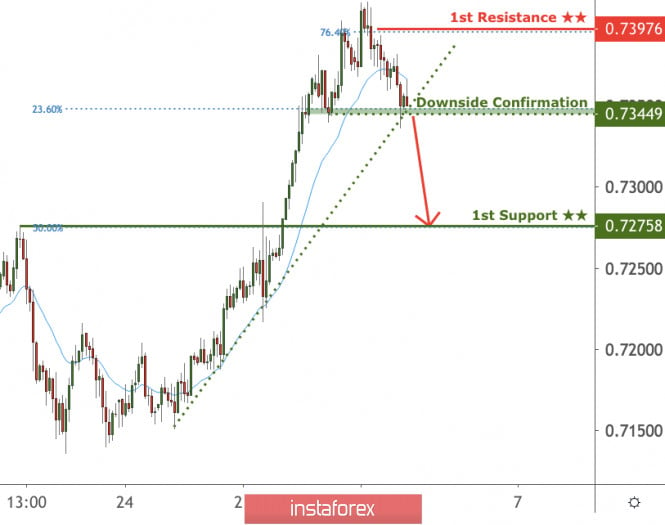
| AUDUSD is facing bearish pressure, potential for further drop! Posted: 02 Sep 2020 04:28 AM PDT
AUDUSD is facing bearish pressure from our 20 EMA and a break below our downside confirmation could provide the bearish acceleration to our support target. Trading Recommendation Entry: 0.73449 Reason for Entry: trend line, horizontal swing low support, 23.6% Fibonacci retracement Take Profit: 0.72758 Reason for Take Profit: Horizontal pullback support, 50% fibonacci retracement Stop Loss: 0.73976 Reason for Stop Loss: Horizontal swing high resistance, 76.4% fibonacci retracement The material has been provided by InstaForex Company - www.instaforex.com |
| Daily Video Analysis: EURJPY High Probability Setup Posted: 02 Sep 2020 04:26 AM PDT Today we take a look at EURJPY. Combining advanced technical analysis methods such as Fibonacci confluence, correlation, market structure, oscillators and demand/supply zones, we identify high probability trading setups. The material has been provided by InstaForex Company - www.instaforex.com |
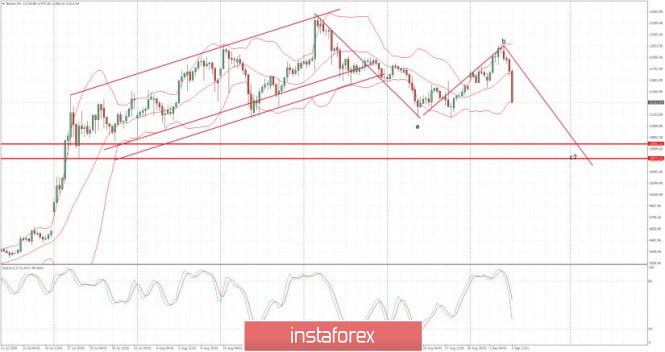
| Posted: 02 Sep 2020 04:14 AM PDT Further Development
Analyzing the current trading chart of BTC, I found that BTC is in creation of the C leg and it is probably heading towards the support cluster at $10,765 and $10,575 Key Levels: Resistance: $12,000 Support levels: $10,765 and $10,575 The material has been provided by InstaForex Company - www.instaforex.com |
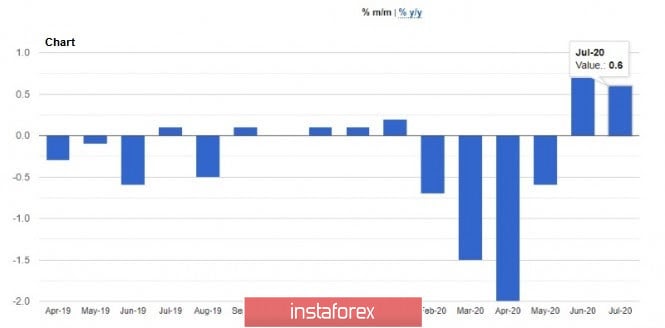
| Posted: 02 Sep 2020 04:08 AM PDT Latest data released by Eurostat - 2 September 2020Prior +0.7%
Producer prices improved slightly in the month of July, but this is very much a lagging indicator as we already saw the kind of deflationary pressures on inflation in the euro area for the month of August yesterday here. The downside risks posed by weaker inflation in the next few months could potentially turn into a major headwind for the euro and will be a key spot to watch.
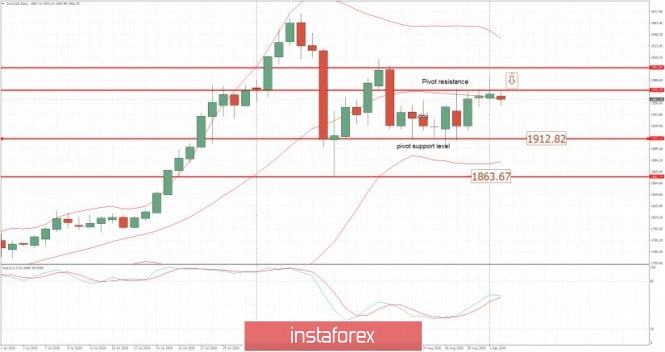
Further Development
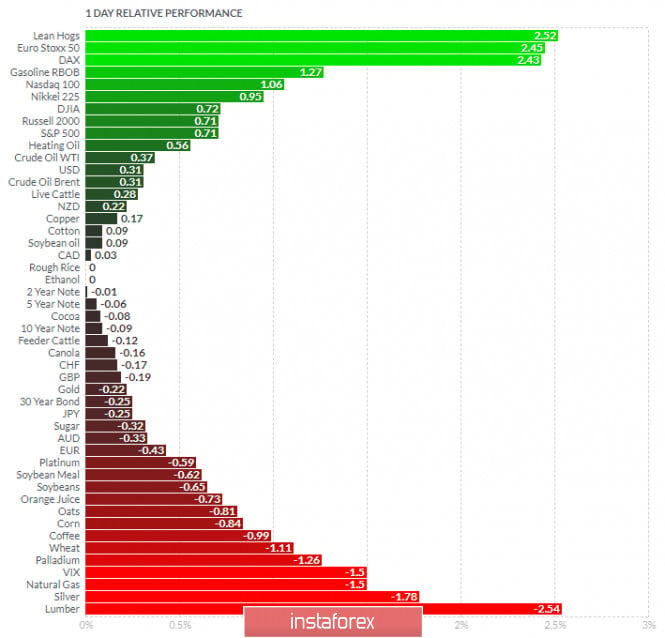
Analyzing the current trading chart of Gold, I found that Gold rejected of the strong pivot resistance at the price of $1,975 and confirmed downside rotation probably towards the support at $1,912 1-Day relative strength performance Finviz
Based on the graph above I found that on the top of the list we got Lean Hogs and Euro Stoxx 50 today and on the bottom Lumber and Silver. Gold is on the negative territory with no evidence of reversal yet. Key Levels: Resistance: $1,975 Support level: $1,912 The material has been provided by InstaForex Company - www.instaforex.com |
| Posted: 02 Sep 2020 04:05 AM PDT
In August, stock indices jumped around the world. There has not been such growth for several decades. The global rise in stocks was driven by the collapse of the US dollar, coupled with the monetary support from the Federal Reserve. The coronavirus pandemic horrified many investors. However, the situation has stabilized and the economy has begun to recover thus causing optimism in the markets. Shares set new records The MSCI global stock index in developed economies rose by 6.6% in August. The last time the same situation happened in 1986. To raise investors' interest in shares, the Fed was keeping interest rates near zero for a long time. The biggest growth showed Tesla's share soaring by 13% to a new record high. In general, the increase was 74%. And over the year, the company's shares of electric vehicles jumped by more than 495%. As a result, Tesla's market value skyrocketed by $389 billion. This exceeds the value of the largest US JPMorgan Chase bank in terms of assets. The pandemic is having a negative impact on the Wall Street S&P 500 Index. However, in August, it won back all losses and advanced by 7%, reaching a new record high. At the same time, shares in Germany, France, Italy, and Spain inched up by 4-7%. Japan's Topix increased by 8.2% and China's CSI 300 grew by 2.6% in local currency terms. Market waits for difficulties However, some analysts and investors fear such a record rally in the shares market. There are risks of a gap between market valuation and the fragile state of the global economy. Nikolaos Panigirtzoglou, the strategist at JPMorgan in London, warns of imminent market difficulties that will gloom the positive mood for future growth and inflation. The expert assumes that in mid-September the market will face the first trouble after the economic meeting of the Fed's leaders. They will decide whether it would be reasonable to extend the stimulus, as Jerome Powell announced the Fed's new approach to inflation. In November, the market may face new difficulties due to the US presidential elections. Both Biden and Trump have an equal chance of winning. Mr. Panigirtzoglu believes that investors will not take risks on the eve of the elections. Banks and governments themselves also pose a threat, taking unprecedented measures to stabilize financial markets and the economy. This has a strong impact on bond yields. Moreover, inflation expectations have also risen, especially in the US. Bonds have dropped in value and no longer arouse the interest of traders. Now they prefer riskier assets such as lower-rated stocks and debt securities. Some reasons to be optimistic Analysts are also concerned about dismal quarterly corporate earnings. However, the fears were useless. Japanese stocks recovered after a decline logged last week, and the Chinese services sector improved thus boosting Asian stocks. Japan's Topix Index rose by 0.8% amid the announcements of the purchase of a stake in Japan's largest trading houses by Warren Buffett's Berkshire Hathaway for $6 billion. The material has been provided by InstaForex Company - www.instaforex.com |


| You are subscribed to email updates from Forex analysis review. To stop receiving these emails, you may unsubscribe now. | Email delivery powered by Google |
| Google, 1600 Amphitheatre Parkway, Mountain View, CA 94043, United States | |
No comments:
Post a Comment