Cloud Software Co. on 'Buy' Signal

Oct 12th, 2020

Cloud Software Co. on 'Buy' Signal

Dear Reader,

On Friday, we looked at a Daily Price Chart of Black Knight, Inc., noting that the stock has been making a series of 52-Week Highs since early August.

For today's Trade of the Day e-letter we will be looking at a monthly chart for Twilio Inc. stock symbol: TWLO.

Before breaking down TWLO's monthly chart let's first review what products and services the company offers.

Twilio Inc., together with its subsidiaries, provides a cloud communications platform that enables developers to build, scale, and operate communications within software applications in the United States and internationally. Its customer engagement platform provides a set of application programming interfaces that handle the higher level communication logic needed for nearly every type of customer engagement, as well as enable developers to embed voice, messaging, and video capabilities into their applications.

Now, let's begin to break down the monthly chart for TWLO stock.

Below is a 10-Month Simple Moving Average chart for Twilio, Inc.

As the chart shows, in April, the TWLO 1-Month Price, crossed above the 10-Month simple moving average (SMA).

This crossover indicated the buying pressure for TWLO stock exceeded the selling pressure. For this kind of crossover to occur, a stock has to be in a strong bullish uptrend.

Now, as you can see, the 1-Month Price is still above the 10-Month SMA. That means the bullish trend is still in play!

As long as the 1-Month price remains above the 10-Month SMA, the stock is more likely to keep trading at new highs in the coming days and weeks.

We'll be keeping our eye on this stock as it continues to trend upward, so we'll know the moment the market conditions shift and the stock begins to come back down.

Our initial price target for TWLO stock is 330.00 per share.

Profit if TWLO is Up, Down or Flat


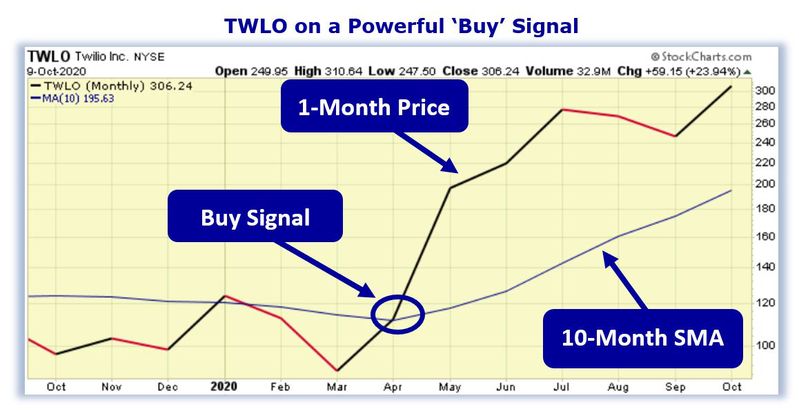
Now, since TWLO's Monthly Price is currently trading above the 10-Month SMA and the stock will likely rally from here, let's use the Hughes Optioneering calculator to look at the potential returns for a TWLO call option spread.

The Call Option Spread Calculator will calculate the profit/loss potential for a call option spread based on the price change of the underlying stock/ETF at option expiration in this example from a 10.0% increase to a 10.0% decrease in TWLO at option expiration.

The goal of this example is to demonstrate the 'built in' profit potential for option spreads and the ability of spreads to profit if the underlying stock is up, down or flat at option expiration. Out of fairness to our paid option service subscribers we don't list the option strike prices used in the profit/loss calculation.

The prices and returns represented below were calculated based on the current stock and option pricing for TWLO on 10/9/2020 before commissions.


Built in Profit Potential


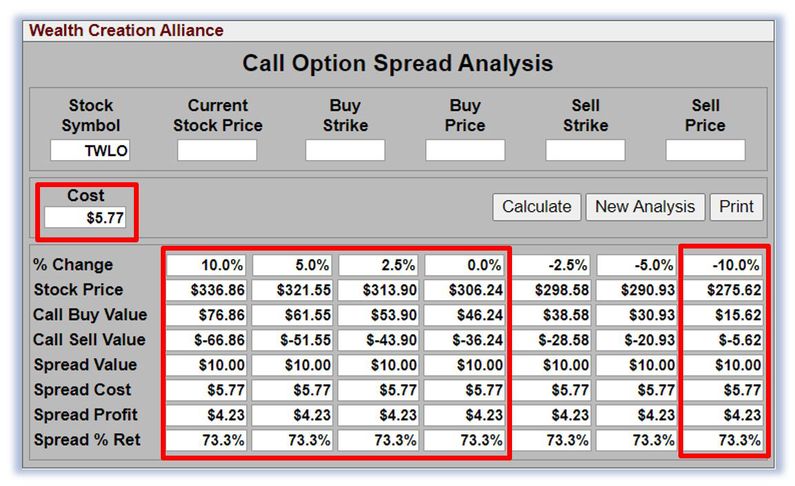
For this option spread, the calculator analysis below reveals the cost of the spread is $577 (circled). The maximum risk for an option spread is the cost of the spread.

The analysis reveals that if TWLO is flat or up at all at expiration the spread will realize a 73.3% return (circled). And if TWLO decreases 10.0% at option expiration, the option spread would make a 73.3% return (circled).

Due to option pricing characteristics, this option spread has a 'built in' 73.3% profit potential when the trade was initiated.

Option spread trades can result in a higher percentage of winning trades compared to a directional option trade if you can profit when the underlying stock/ETF is up, down or flat.

A higher percentage of winning trades can give you the discipline needed to become a successful trader.

The Hughes Optioneering Team is here to help you identify winning trades just like this one.


Interested in accessing the Optioneering Calculators? Join one of Chuck's Trading Services for unlimited access! The Optioneering Team has option calculators for six different option strategies that allow you to calculate the profit potential for an option trade before you take the trade.


Trade High Priced Stocks for $350 With Less Risk


One of the big advantages to trading option spreads is that spreads allow you to trade high price stocks like Amazon, Google, or Netflix for as little as $350. With an option spread you can control 100 shares of Google for $350. If you were to purchase 100 shares of Google at current prices it would cost about $151,000. With the stock purchase you are risking $151,000 but with a Google option spread that costs $350 your maximum risk is $350 so your dollar risk is lower with option spreads compared to stock purchases.


Chuck's Inner Circle Trading Service


You can start receiving hand-picked trades from Chuck today!

Chuck is offering special pricing for his Inner Circle Trading Service for Trade of the Day subscribers.

Just call Brad at 1-866-661-5664 or 1-310-647-5664 to join and use the code "Optioneering VIP" to receive special pricing!


Wishing You the Best in Investing Success,

Chuck Hughes

Editor, Trade of the Day


Have any questions? Email us at dailytrade@chuckstod.com

##Unsubscribe##

##SenderAddress##


© 2020 Tradewins Publishing. All rights reserved. The information provided by the newsletters, trading, training and educational products related to various markets (collectively referred to as the "Services") is not customized or personalized to any particular risk profile or tolerance. Nor is the information published by Legacy Publishing, LLC ("Legacy") a customized or personalized recommendation to buy, sell, hold, or invest in particular financial products. Past performance is not necessarily indicative of future results. Trading and investing involve substantial risk and is not appropriate for everyone. The actual profit results presented here may vary with the actual profit results presented in other Legacy Publishing LLC publications due to the different strategies and time frames presented in other publications. Trading on margin carries a high level of risk and may not be suitable for all investors. Other than the refund policy detailed elsewhere, Legacy does not make any guarantee or other promise as to any results that may be obtained from using the Services. Legacy disclaims any and all liability for any investment or trading loss sustained by a subscriber. You should trade or invest only "risk capital" - money you can afford to lose. Trading stocks and stock options involves high risk and you can lose the entire principal amount invested or more. There is no guarantee that systems, indicators, or trading signals will result in profits or that they will not produce losses. Some profit examples are based on hypothetical or simulated trading. This means the trades are not actual trades and instead are hypothetical trades based on real market prices at the time the recommendation is disseminated. No actual money is invested, nor are any trades executed. Hypothetical or simulated performance is not necessarily indicative of future results. Hypothetical performance results have many inherent limitations, some of which are described below. Also, the hypothetical results do not include the costs of subscriptions, commissions, or other fees. Because the trades underlying these examples have not actually been executed, the results may understate or overstate the impact of certain market factors, such as lack of liquidity. Legacy makes no representations or warranties that any account will or is likely to achieve profits similar to those shown. No representation is being made that you will achieve profits or the same results as any person providing a testimonial. No representation is being made that any person providing a testimonial is likely to continue to experience profitable trading after the date on which the testimonial was provided, and in fact the person providing the testimonial may have subsequently experienced losses. The cost basis for some of the options in a portfolio may be reduced by rolling over profits at option expiration which is one of the Hughes Optioneering Trade Management Rules. Some income figures presented represent the total amount of option premium collected during the referenced period. Actual profits were less. Open trade profit results may have increased or decreased when the trades were closed out. Chuck Hughes' experiences are not typical. Chuck Hughes is an experienced investor and your results will vary depending on risk tolerance, amount of risk capital utilized, size of trading position, willingness to follow the rules and other factors.

You are currently subscribed to tod as: phanhoa1821960.trader@blogger.com.
Add todaystrade@chuckstod.com to your email address book to ensure delivery.
Forward to a Friend | Manage Subscription | Subscribe | Unsubscribe | Snooze
                                 

No comments:

Post a Comment