Forex analysis review |
- GBP/USD forecast for October 12, 2020
- Hot forecast and trading signals for GBP/USD on October 12. COT report. Bailey's dovish rhetoric could trigger a correction
- Euro on the levels of the quarterly fair prices. What to do?
- Hot forecast and trading signals for EUR/USD on October 12. Buyers ready to rally towards 1.1855 and 1.1900, but bearish
- Overview of the EUR/USD pair. October 12. Displeasure and constant criticism from the markets and the media, as the main
- Analytics and trading signals for beginners. How to trade EUR/USD on October 12? Getting ready for Monday session
- Trading plan for the GBP/USD pair for the week of October 12-16. New COT (Commitments of Traders) report. Professional traders
- Trading plan for the EUR/USD pair for the week of October 12-16. New COT (Commitments of Traders) report. Major traders stop
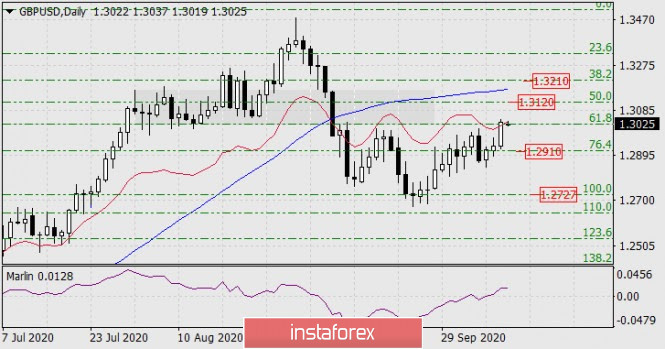
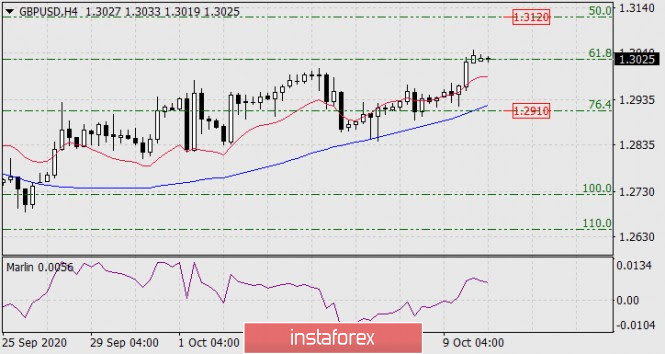
| GBP/USD forecast for October 12, 2020 Posted: 11 Oct 2020 08:00 PM PDT GBP/USD The pound went up to 100 points and stopped at the Fibonacci level of 61.8% on Friday. The Marlin oscillator broke out in the zone of a growing trend after a long time of work. Now the price will have to work out at the next Fibonacci level of 50.0% with the price of 1.3120. On a four-hour scale, the price is fixed above the indicator lines. The Marlin oscillator develops in a positive zone and the price is preparing for further growth. However, in the short term, we are not sure that with the upper limit of consolidation in the first half of August (marked with a gray rectangle on the daily chart), the price will break higher. If only the EU and London suddenly agree on an amicable "divorce". |
| Posted: 11 Oct 2020 07:59 PM PDT GBP/USD 1H The GBP/USD pair resumed the upward movement on October 9, which is generally similar to the EUR/USD pair's recent movements - a slight upward bias and frequent corrections. We have also formed a new rising channel, which supports bullish traders and the pound. The pair overcame a rather important resistance area of 1.3005-1.3025 last Friday, which significantly increases the likelihood of a succeeding upward movement, however, a downward correction on Monday is quite possible and highly probable. Bears are still out of work and are waiting for new chances from the bulls. GBP/USD 15M Both linear regression channels are directed upward on the 15-minute timeframe, which is a sign that the upward movement would continue on the hourly timeframe. The flat is over, but there are currently no signs of starting a downward correction on the smallest timeframe. COT report A new Commitments of Traders (COT) report on the British pound showed that non-commercial traders were practically resting between September 29 and October 5. The pound increased by about 140 points in this period, which, in principle, is not so much, a little more than the average daily volatility of this currency. The "non-commercial" group of traders opened 1,093 Buy-contracts (longs) and closed 435 Sell-contracts (shorts) during this time. Thus, the net position of professional traders slightly increased by 1,500 contracts. However, as with price changes, these changes in the mindset of professional traders are purely formal. It is impossible to draw any conclusions or predictions about the pair's future movement based on them. In general, the "non-commercial" group has been decreasing its net position since the beginning of September, which means that their bearish mood is strengthening. In principle, this particular behavior from large traders completely coincides with what is happening on the market during this period of time, but despite the pound's growth in the last few trading days, it still goes back to falling. Nonprofit traders have more sell contracts, and UK fundamentals remain extremely weak and dangerous for the pound in terms of the outlook for the rest of 2020 and all of 2021. Several important macroeconomic reports were released in the UK on Friday, October 9. For example, GDP added only 2.1% in August m/m, although forecasts predicted an increase of 4.6%. The indicator of industrial production was also not up to par and only reached +0.3% in August, although no less than +2.5% m/m was expected. But the quarterly estimate of GDP growth rates from NIESR was unexpectedly very positive for September and reached +15.2%. However, we would recommend paying more attention to the current indicators of the state of the British economy. Given the second wave of the epidemic in Great Britain and the lack of progress in negotiations on a trade deal between the UK and the EU, the prospects for the British economy remain very bleak. However, as we can see, market participants also ignored this package of macroeconomic data, as the pound rose in price on Friday. Thus, we can draw the same conclusion as before - traders continue to ignore macroeconomic data. Bank of England Governor Andrew Bailey is set to deliver a speech on Monday, who has recently been speaking quite often, and has also quite actively hinted at the use of negative interest rates in the near future. Thus, such dovish rhetoric could theoretically put pressure on the pound. The only question is whether it will be a round of a downward correction while maintaining an upward trend or leaving the rising channel. We have two trading ideas for October 12: 1) Buyers have seized the initiative in the market. Thus, you can formally consider long positions while aiming for the resistance level 1.3114. Take Profit in this case will be up to 70 points. However, take note of frequent corrections from the pair, so it is possible that a new one will begin today. 2) Sellers seemed to have tried to seize the initiative, but they still did not have enough strength to build on their success. Now the bears need, at least, to settle below the 1.3005-1.3025 area in order to count on a fall towards the Kijun-sen line (1.2945). You can reject this movement in small lots. Take Profit in this case can be up to 50 points. Sellers will be able to count on more but the price must settle below the rising channel. Explanations for illustrations: Support and Resistance Levels are the levels that serve as targets when buying or selling the pair. You can place Take Profit near these levels. Kijun-sen and Senkou Span B lines are lines of the Ichimoku indicator transferred to the hourly timeframe from the 4-hour one. Support and resistance areas are areas from which the price has repeatedly rebounded off. Yellow lines are trend lines, trend channels and any other technical patterns. The material has been provided by InstaForex Company - www.instaforex.com |
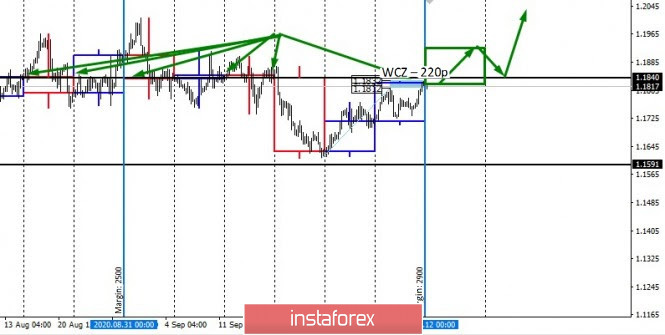
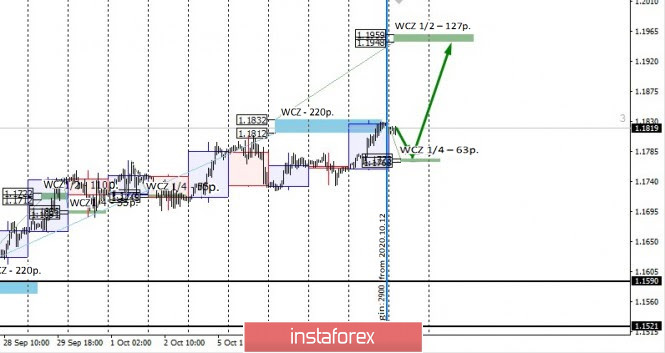
| Euro on the levels of the quarterly fair prices. What to do? Posted: 11 Oct 2020 07:57 PM PDT As the closing of the trading week occurred at its highs, euro purchases remain a priority. To continue growth, it is enough to form a shallow correction, which will allow you to re-enter purchases. Holding on to previously opened purchases is the most profitable strategy, since growth may stop after the test of the 1.1840 level. This mark serves as the rotation level, which alternately marks an increase in purchases and sales. It will be necessary to consolidate above this mark by the time of the current week's trading close for the growth to resume. Today, there was a transition in margin requirements on the Chicago Stock Exchange. The size of the required margin increased by $400, which implies an increase in volatility in the near future. It is necessary to rebuild all the control zones that were not worked out last week. When building an intraday trading plan, special attention should be paid to the formation of a daily engulfing candle. This indicates a high probability of the pair's continued growth in the next two days, which makes purchases profitable. |
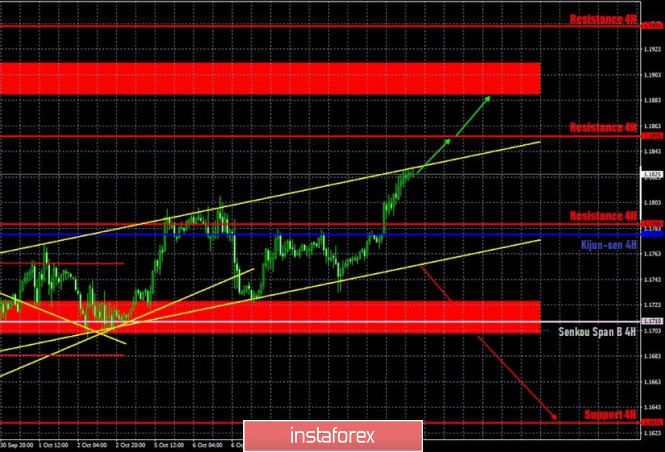
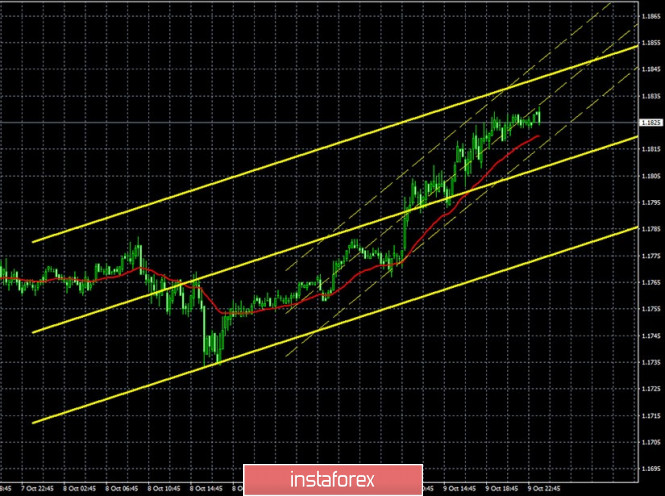
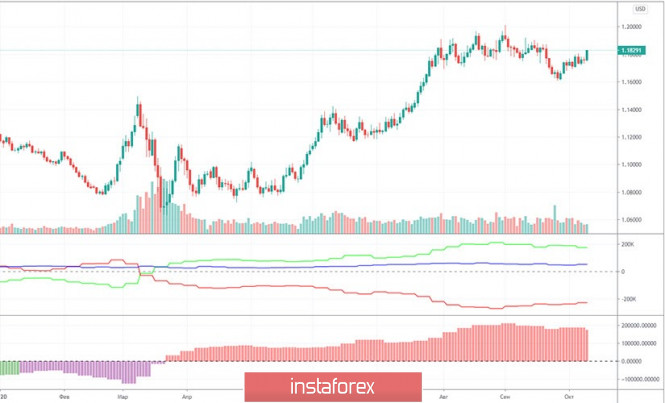
| Posted: 11 Oct 2020 07:55 PM PDT EUR/USD 1H The EUR/USD pair resumed its upward movement quite unexpectedly on the hourly timeframe on October 9, although it had experienced obvious problems with this several days before. However, the Kijun-sen line was once again overcome and the upward movement continued. An ascending channel was also formed on Friday, which now supports bull traders. A price rebound from the upper line of this channel can trigger a downward correction. As we can see from the slope of the channel, the upward trend is not too strong, and corrections are quite frequent. Nevertheless, at a leisurely pace, the pair can reach the levels of $1.19 and $1.20 in the next two weeks. EUR/USD 15M Both linear regression channels turned to the upside on the 15-minute timeframe, which fully corresponds to the picture of what is happening on the hourly timeframe. Thus, there are no signs of starting a new round of the downward correction on the 15-minute chart. COT report. The EUR/USD pair has risen in price by about 120 points during the last reporting week (September 29 - October 5). But in general, there are still no significant price changes for the pair. In fact, all trades are held in a horizontal range of 250-300 points. Thus, data from any Commitment of Traders (COT) report can only be used for long-term forecasting. The latest COT report showed that non-commercial traders, which we recall, are the most important group of traders in the forex market, closed 10,784 Buy-contracts (longs) and opened 2,078 Sell-contracts (shorts). Take note that two weeks earlier, the "non-commercial" group was relatively active in building up long positions, but now it is decreasing its net position for the second consecutive week. This may indicate that the upward trend for the pair is over. Or it is about to end. We have already said that the lines of the net positions of the "commercial" and "non-commercial" groups (upper indicator, green and red lines) diverge strongly when a trend change occurs. If this is the case, the peak point of the upward trend will remain at $1.20. The net position of non-commercial traders was at its highest (green line) at this point. After reaching this level, it falls steadily. Thus, the pair may try to make another upward breakthrough as a final assault on the bulls, but you should hardly expect the pair to go much higher than the 20 figure. No macroeconomic background for EUR/USD on Friday, October 9, while the fundamental background remained unchanged. We have already mentioned that the probability of strengthening the US dollar before the presidential elections in the United States is extremely low. Thus, by and large, news and reports, in principle, do not have a strong impact on the pair's movement. Traders simply do not risk serious dollar investments when they don't understand what will happen to the country in a month or two. A trade war with China, its development or de-escalation depends entirely on who will become the new owner of the White House. If it is Trump again, then there is no doubt that the war with China will continue. And, as we have already figured out in the previous articles, the results of the confrontation with China for America are very dubious. So the equation is extremely simple: Trump's election victory = de-escalation of the trade war = new challenges for the American economy. That is why the majority of market participants do not risk investing in the dollar at this time. We have two trading ideas for October 12: 1) The pair was in an open flat for several days, but now it is moving up. Thus, buyers can continue to trade the pair upward while aiming for 1.1855 and the resistance area at 1.1888-1.1912, as long as the price remains above the Kijun-sen line (1.1778). Take Profit in this case will be up to 80 points. We draw your attention to the fact that the price is often corrected. 2) Bears have not been able to build on their success and gain a foothold below the support area of 1.1701-1.1725. Thus, sellers need to wait for the next chance and to get the price to settle below the rising channel in order to open new short positions while aiming for the Senkou Span B line (1.1710). In this case, the potential Take Profit is up to 40 points. Explanations for illustrations: Support and Resistance Levels are the levels that serve as targets when buying or selling the pair. You can place Take Profit near these levels. Kijun-sen and Senkou Span B lines are lines of the Ichimoku indicator transferred to the hourly timeframe from the 4-hour one. Support and resistance areas are areas from which the price has repeatedly rebounded off. Yellow lines are trend lines, trend channels and any other technical patterns. The material has been provided by InstaForex Company - www.instaforex.com |
| Posted: 11 Oct 2020 05:16 PM PDT 4-hour timeframe
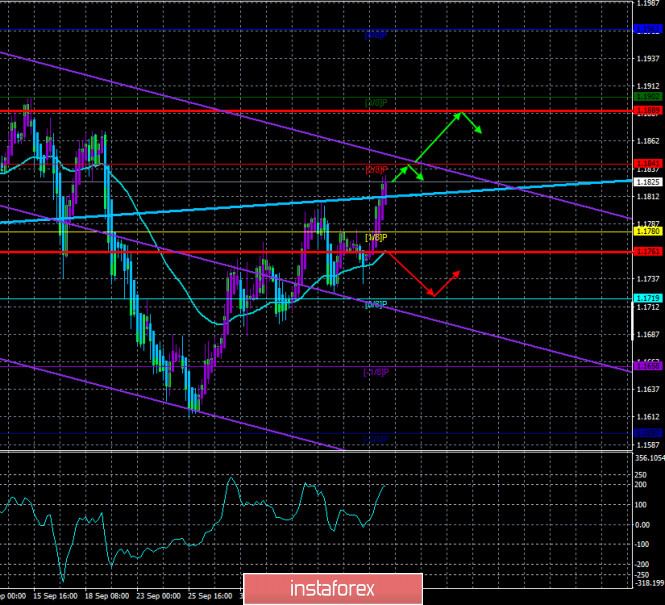
Technical details: Higher linear regression channel: direction - upward. Lower linear regression channel: direction - downward. Moving average (20; smoothed) - upward. CCI: 194.8288 For the EUR/USD pair, the last trading day of the week was quite active. The European currency corrected to the moving average line once again, bounced off it, and resumed its upward movement. Given the fact that no macroeconomic reports were planned for this day in the US and the EU, we can draw a clear conclusion: the new growth of the euro currency was not related to statistics. There was also no news on Friday. Therefore, we tend to believe that the reason for the new fall in the US currency lies in the same factors that we have already listed repeatedly - the fundamental background. A few months ago, we started writing that the epidemiological, economic, social, and political situation in the United States is much worse than in the European Union. And it was these "four American crises" that "beat" the US dollar in the last six months. What has changed in recent weeks? Nothing. America has finally managed to suppress mass protests, rallies, and riots caused by two racist scandals at once. However, this was the least of the four problems. Economic – has not gone away. Moreover, due to the inability of Republicans and Democrats to work "in the same cart", the US economy cannot now receive an additional package of stimulus measures. The political problem is still there. Elections are approaching and all the top political circles are busy with this issue, not solving urgent problems. The epidemiological situation is also not improving. Every day in America, 40-45 thousand people are still infected. Therefore, why should the US currency suddenly start to be in demand in the foreign exchange market? This should also include the uncertainty factor also associated with the presidential election. Investors and traders simply don't want to invest in the US economy and the dollar for the long term until it's clear who will be the next president? The only chance to strengthen the US dollar is only a technical factor. But, as we can see, over the past few months, traders have not managed to correct the pair by more than 300-400 points after a 1300-point increase. In principle, the activities of any manager can be evaluated quite easily. The more the president or the government as a whole is criticized, the higher the level of dissatisfaction with his actions among the population. Of course, we are talking only about democratic countries where there are opposition forces, and all power is not concentrated in the hands of one person. America is such a country, thus, the opinion of their media can be trusted. Also, there is the opposition, there are a huge number of high-ranking officials, and all of them are not afraid to express their opinions and criticize the government, because they do not dance to the tune of one person or a group of people. Let us go back to Donald Trump. In articles on the pound/dollar, we regularly "update" the "list of Boris Johnson's victories". In principle, if you want, you can make a similar "list of victories" of Donald Trump. Only in the case of the American president, this list will also include items that do not correspond to the statements and promises of the leader of the American nation. For example, about the fight against the "coronavirus", the confrontation with China, the situation with the impeachment, and blackmail of the President of Ukraine can be written down as a liability to Trump. And this is just the first thing that comes to mind. You can also recall Trump's repeated statements about "the maximum growth of the US economy in the entire history of the country" and "a brilliant new era". However, the US president naturally does not mention the fact that the growth of all economic indicators began under Barack Obama, and only continued under him. Therefore, the foundation was not laid by Trump. Well, Americans will remember the "brilliant new era" for a long time. And we are still deliberately not delving into more internal issues and problems, like health care reform, which, according to everyone, "flourished" under Barack Obama and "withered" under Donald Trump. The fight against the "coronavirus" has already resulted in the loss of more than 210 thousand Americans. Anthony Fauci, the chief epidemiologist of the United States, who warned from the very beginning about the highest danger of COVID-2019, predicts 400,000 deaths from this virus. And Donald Trump, meanwhile, continues to urge not to be afraid of the "Chinese virus" and compare it to the flu. At the same time, Trump continues to accuse China of "releasing this infection", and therefore contradicts himself. If "the virus is not to be feared", then why blame China so much if "the virus is not so dangerous"? However, contradictions are an integral part of the essence of the Trump administration. Further, the trade war with China has failed. The American president wanted to achieve a reduction in the trade balance with China, but, as official statistics show, the trade deficit with China has not decreased much since the beginning of 2018. And if you take the overall US trade deficit, it has increased even more during the four years of the Trump administration. While China's trade surplus increased. Various analytical agencies and publications make various calculations and conduct analyses, according to which it is extremely difficult to find at least one point on which America would benefit from a confrontation with Beijing. About 300,000 Americans lost their jobs due to the trade war. China's purchases of American goods fell by 30%. Also, Trump continued to fight with China not only on the economic front. "The Hong Kong issue", "the Xinjiang issue", the fight against TikTok, the closure of Chinese consulates in the United States, and sanctions. What's the use of all this? Well, there is no need to talk about politics at this time. The power struggle has always been and always will be in any country. However, in key issues and in the most difficult times, all the opposing forces must unite and help their country and their economy. What do we see in the US? The Democrats' four-year war against Trump. Not "against the Republicans," but "against Trump". Now there are three weeks left until the elections, and we can say with confidence that until the issue of power is resolved in the country, it makes no sense to expect a strengthening of the US currency. Just because Donald Trump in 2020 is personified with the fall of the American economy.
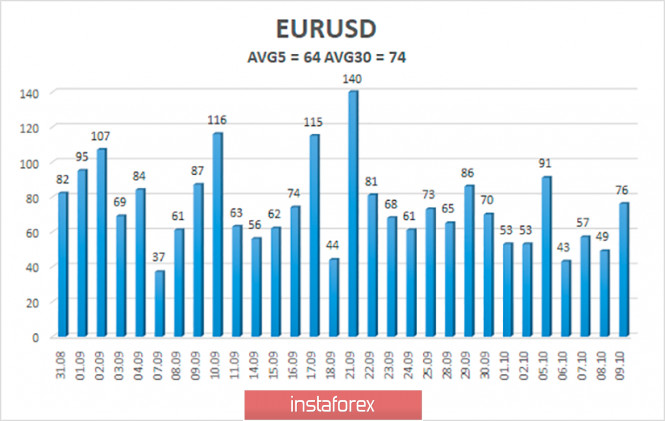
The volatility of the euro/dollar currency pair as of October 12 is 64 points and is characterized as "average". Thus, we expect the pair to move today between the levels of 1.1761 and 1.1889. A reversal of the Heiken Ashi indicator down may signal a new round of corrective movement. Nearest support levels: S1 – 1.1780 S2 – 1.1719 S3 – 1.1658 Nearest resistance levels: R1 – 1.1841 R2 – 1.1902 R3 – 1.1963 Trading recommendations: The EUR/USD pair continues to be located above the moving average line and continues its upward movement. Thus, today it is recommended to keep open long positions with targets of 1.1841 and 1.1889 until the Heiken Ashi indicator turns down. It is recommended to consider sell orders if the pair is fixed below the moving average with the first targets of 1.1719 and 1.1658. The material has been provided by InstaForex Company - www.instaforex.com |
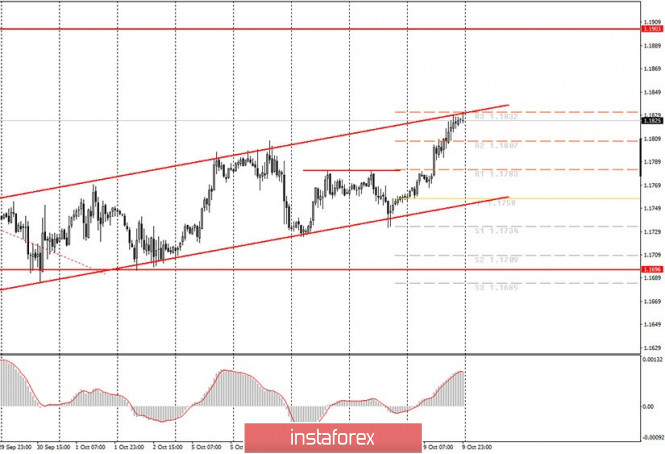
| Posted: 11 Oct 2020 02:08 PM PDT Hourly chart of the EUR/USD pair The EUR/USD pair continued to move up on Friday, October 9, instead of moving down after it broke the rising trend line. This is what we have been talking about recently. Trading the pair often takes place in a not quite standard way, which leads to such movements that are not quite logical. However, in any case, beginners should not have received any losses on Friday, since we recommended trading down, and not a single sell signal was generated that day. But now we have formed a new upward channel, which supports bull traders. However, there are problems with this channel. The price is already near its upper line and rose by 100 points on Friday. Thus, it is now absolutely necessary to wait for the downward correction if you are considering buy options for the EUR/USD pair. There was absolutely nothing to take note of in terms of Friday's macroeconomic news. The news calendar was completely empty in both the European Union and the United States. However, as is often the case, strong movement happens exactly when you are not expecting it. Actually, this is what happened on Friday. The US dollar went back to depreciating against both the pound and the euro, based on the same factor which is the upcoming elections and the sheer political confusion that reigns in America right now. Therefore, market participants simply returned to placing sell positions on the dollar from time to time, which are based on a negative fundamental background. One could note the fact that Republicans and Democrats again failed to agree on a new package of financial assistance to the American economy, and US President Donald Trump ordered to suspend negotiations altogether until the elections are over, but then again they have not been able to come to an agreement since early August. Nothing new here. We can expect speeches from European Central Bank President Chrisitine Lagarde, and ECB Vice President Luis de Guindos on Monday, October 12. These two figures have recently been speaking almost every other day. Nevertheless, we still do not expect any fundamentally new information from them. We also do not expect a change in the fundamental background for the euro/dollar pair. Thus, a not too strong upward movement with frequent pullbacks and corrections is likely to continue. Possible scenarios for October 12: 1) Buy positions on the EUR/USD pair have suddenly and unexpectedly become relevant at the moment since the upward trend line was canceled, and an ascending channel was formed. However, first you need to wait for the price correction to the lower area of this channel, and the MACD indicator to discharge to zero. After doing so, you can finally open new long positions with targets around 1.1800 and above. 2) Selling has lost its relevance at the moment, but the most interesting thing is that the quotes will most likely begin to fall on Monday, since the price reached the resistance level of 1.1832 and the upper line of the ascending channel on Friday. Thus, the probability of a 50-60 point downward correction is extremely high. The most risky traders may even try to work out this pullback, but we advise you to take restrictive Stop Loss orders. In general, short positions will become more attractive when the price settles below the rising channel. On the chart: Support and Resistance Levels are the Levels that serve as targets when buying or selling the pair. You can place Take Profit near these levels. Red lines are the channels or trend lines that display the current trend and show in which direction it is better to trade now. Up/down arrows show where you should sell or buy after reaching or breaking through particular levels. The MACD indicator (10,20,3) consists of a histogram and a signal line. When they cross, this is a signal to enter the market. It is recommended to use this indicator in combination with trend lines (channels and trend lines). Important announcements and economic reports that you can always find in the news calendar can seriously influence the trajectory of a currency pair. Therefore, at the time of their release, we recommended trading as carefully as possible or exit the market in order to avoid a sharp price reversal. Beginners on Forex should remember that not every single trade has to be profitable. The development of a clear strategy and money management are the key to success in trading over a long period of time. The material has been provided by InstaForex Company - www.instaforex.com |
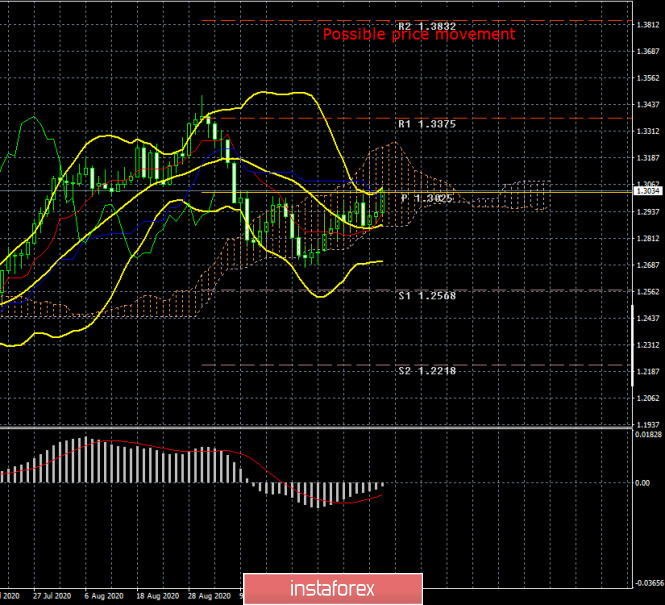
| Posted: 10 Oct 2020 07:07 AM PDT GBP/USD - 24H. The GBP/USD currency pair, unlike the euro/dollar, still shows signs of life and does not trade in absolute flat. Recent movements of the pair: correction after the upward trend to the Senkou Span B line on the 24-hour timeframe, rebound from this line and move up to the Kijun-sen line. As you can see, when there is no flat, all the strong lines of the Ichimoku indicator are worked out very accurately and clearly. Now we expect a price rebound from the Kijun-sen line with a resumption of downward movement (a rebound can occur from 1.3073 – this is the previous price value of this line) or a resumption of the upward trend. The fundamental background remains extremely heavy and negative for both currencies. Thus, it is the technical picture that now has the highest priority in forecasting. The COT report.
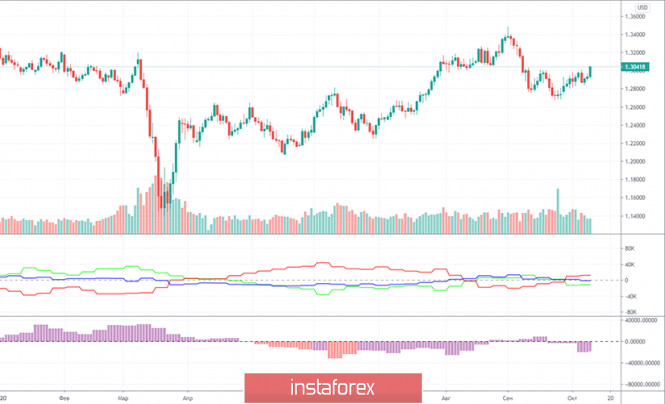
The New COT (Commitments of traders) report for the British pound showed that non-commercial traders in the period from September 29 to October 5 almost rested. The pound rose by about 140 points during this period, which is slightly more than the average daily volatility of this currency. A group of Non-commercial traders opened 1,093 buy contracts and closed 435 sell contracts during this time. Thus, the net position of professional traders increased by 1,500 thousand contracts. However, as with price changes, these changes in the mood of professional traders are purely formal. It is impossible to draw any conclusions or forecasts about the future movement of the pair. In general, since the beginning of September, the "Non-commercial" group has been reducing its net position, which means that they are becoming more bearish. In principle, this behavior of major traders completely coincides with what is happening in the market during this period. However, despite the growth of the British currency in the last few trading days, we are still inclined to resume the fall of the pound. Non-profit traders have more contracts to sell, and the fundamental background in the UK remains extremely weak and dangerous for the pound, in terms of prospects for the rest of 2020 and 2021. The fundamental background for the GBP/USD pair can be described in just a few words: Brexit, trade deal negotiations, US elections. Moreover, if the elections in America are more important for the EUR/USD pair, then Brexit and negotiations on further relations between London and Brussels are more important for the GBP/USD pair. And recently, priority has been given to the second "wave" of the "coronavirus" in the Foggy Albion, which a couple of weeks after its start has already broken all records for the incidence of the first "wave". Thus, the British economy is in a "state of emergency". The Bank of England has been sending signals to the market throughout 2020 that it will start lowering the key rate below zero if necessary. And no one doubts that this need will come. Every day in Britain, 13-14 thousand new cases of the disease are recorded. Brexit talks extended by 1 month and this is all positive news on this topic. Legal proceedings between London and Brussels over the "Johnson bill" have not yet begun and this is all positive news on this topic. In any case, the British economy will start 2021 with losses associated with severing ties with the European Union, even if a trade deal is somehow agreed. Thus, in light of all these events, we believe that in the long term, the British pound has only one road – down. If there is a trade deal between the Alliance and the Kingdom, it will certainly mitigate the negative impact a little, but not so much. It should only be noted that over the past year, many manufacturing and financial companies have been actively leaving London and the UK. And it is unlikely that they do this based on divination on coffee grounds. Few big companies want to stay in Britain if it falls out with the EU and trades with it under WTO rules. Trading plan for the week of October 12-16: 1) Buyers let the initiative out of their hands a few weeks ago. Now they need to return to the area above the critical line(1.2997-1.3073) on the 24-hour timeframe, and only then can we expect further strengthening of the British currency in the long term. So far, despite the growth of the pound in recent weeks, we are inclined to resume the fall of this currency. 2) Sellers still have a better chance of forming their own trend. To do this, they just need to keep the bulls above the Kijun-sen line and then consolidate below the Senkou Span B line (1.2865). Then the prospects for a new round of decline in the pair's quotes will grow significantly, and the first goal will be the support level of 1.2568. Explanation of the illustrations: Price levels of support and resistance (resistance/support) – levels that are targets when opening purchases or sales. You can place Take Profit levels near them. Ichimoku indicators, Bollinger bands, MACD. Support and resistance areas – areas that the price has repeatedly bounced from before. Indicator 1 on the COT charts – shows the net position size of each category of traders. Indicator 2 on the COT charts – the net position size for the "Non-commercial" group. The material has been provided by InstaForex Company - www.instaforex.com |
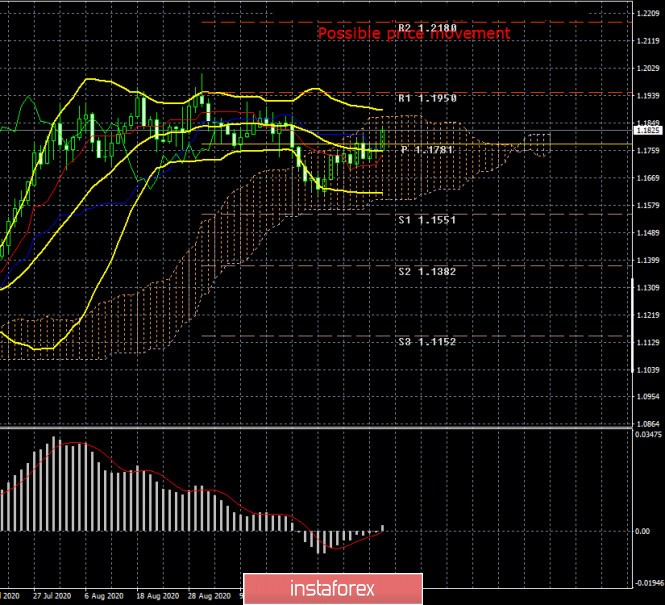
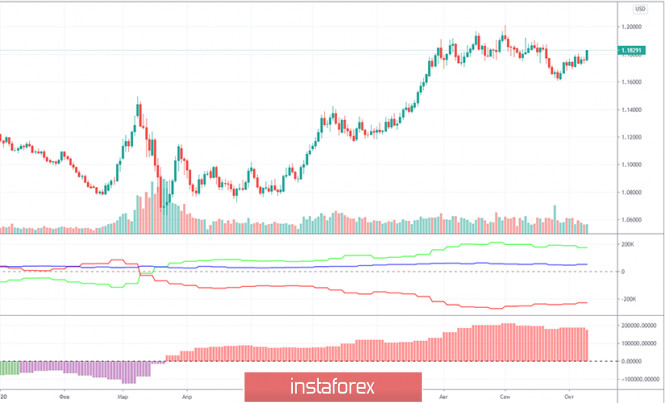
| Posted: 10 Oct 2020 07:07 AM PDT EUR/USD - 24H. As we have said many times in our daily articles, the euro/dollar pair has been trading mostly sideways in recent weeks and even months. There is no pronounced side channel at this time, however, the sideways movement itself is visible on the 24-hour timeframe. Previously, traders had a side channel of $ 1.17 - $ 1.19 at their disposal, however, now its borders are more blurred. The pair is trading approximately between 1.1620 and 1.1940. That is, the channel width is 320 points. The Bollinger bands are also mostly directed sideways, which is another proof of the lack of a trend at this time. Thus, it is very inconvenient to trade the pair on higher timeframes, i.e. in the long term. We'll talk about the reasons for the flat a little later. The COT report. During the last reporting week (September 29 - October 5), the EUR/USD pair rose by about 120 points. But in general, as we have already discussed above, there have been no major price changes for the pair in recent months. Thus, data from any COT report can only be used for long-term forecasting. A new COT report showed that non-profit traders, which are the most important group of traders in the foreign exchange market, closed 10,784 buy contracts and opened 2,078 sell contracts. Recall that two weeks earlier, the "Non-commercial" group relatively actively increased its long positions, but now, for the second week in a row, it is reducing its net position. This may indicate that the upward trend for the pair is complete. Or nearing its end. We have already mentioned that the net position lines of the "Commercial" and "Non-commercial" groups (the upper indicator, green and red lines) diverge greatly when a trend change occurs. If this is the case this time, the peak point of the upward trend will remain $ 1.20. It was at this point that the net position of non-commercial traders was maximum. After reaching this level, it falls steadily. Thus, the pair may try to perform another upward dash, like the final assault of the bulls, however, it is unlikely to expect a pair much higher than the 20th figure. Last week, Christine Lagarde and Jerome Powell spoke very often. So often that traders now have no doubts about what to expect from American and European regulators. Unfortunately, all this information passed the market. As well as 90% of macroeconomic statistics. Yes, we now clearly know that the US economy requires a new stimulus package to continue the recovery at the same pace. And negotiations on this package failed between Democrats and Republicans. In Europe, the second wave of "coronavirus" is feared. However, for the EUR/USD pair, the most important factor right now is political. Namely, the US presidential election. The economic situation in the Eurozone remains more stable than in the US, however, this factor has long been played back by traders (the euro has risen by 13 cents since April). Thus, to further strengthen the European currency, we need a new negative from overseas or a new positive from the EU. There are obvious problems with both now. Traders are simply afraid to buy the US currency three weeks before the election. As we have noted many times, there is no worse state for markets than a state of uncertainty. A change of government is always an uncertainty. Thus, we believe that the US dollar will not be able to show growth for at least another three weeks. Further, everything will depend on how smoothly and calmly the US elections will be held. Trading plan for the week of October 12-16: 1) Taking into account the fact that in the long term we observe the movement as close as possible to the definition of "flat", it is recommended to trade using small timeframes, hourly and 4-hour. At this time, the euro is growing and may well reach 1.1900. The further upward movement is questionable. Therefore, as long as the Ichimoku indicator and the graphical patterns (channels, trend lines) that we use every day to build trading strategies in our articles support the upward movement, we recommend buying the pair. 2) To resume selling the EUR/USD pair, we recommend waiting for the price to consolidate below the Kijun-sen line. There is no clear trend on the hourly and 4-hour charts, thus, we rely on the main lines of the Ichimoku indicator when making trading decisions. On the 24-hour timeframe, the lines of the Ichimoku indicator are currently formal, since they are not strong in the flat. Explanation of the illustrations: Price levels of support and resistance (resistance/support) – target levels when opening purchases or sales. You can place Take Profit levels near them. Ichimoku indicators, Bollinger bands, MACD. Support and resistance areas – areas that the price has repeatedly bounced from before. Indicator 1 on the COT charts – shows the net position size of each category of traders. Indicator 2 on the COT charts – the net position size for the "Non-commercial" group. The material has been provided by InstaForex Company - www.instaforex.com |
| You are subscribed to email updates from Forex analysis review. To stop receiving these emails, you may unsubscribe now. | Email delivery powered by Google |
| Google, 1600 Amphitheatre Parkway, Mountain View, CA 94043, United States | |



No comments:
Post a Comment