| | | |  For Inquiry : |
|
|---|
| |
| | | | Support and resistance price levels |
| | |
|---|
by Shane Daly | |
|
| | Trading support and resistance levels is a common approach to trading. Whether it's a viable strategy is another question and much of that will depend on the trader. One of the biggest issues with support and resistance is defining price levels that actually mean something. Quick Facts: - Support levels are where price is expected to cease declining and then resume moving upwards.
- Resistance levels are were price is expected to stop climbing and then reverse downwards.
- Support and resistance levels are estimates and not necessarily exact prices.
| |
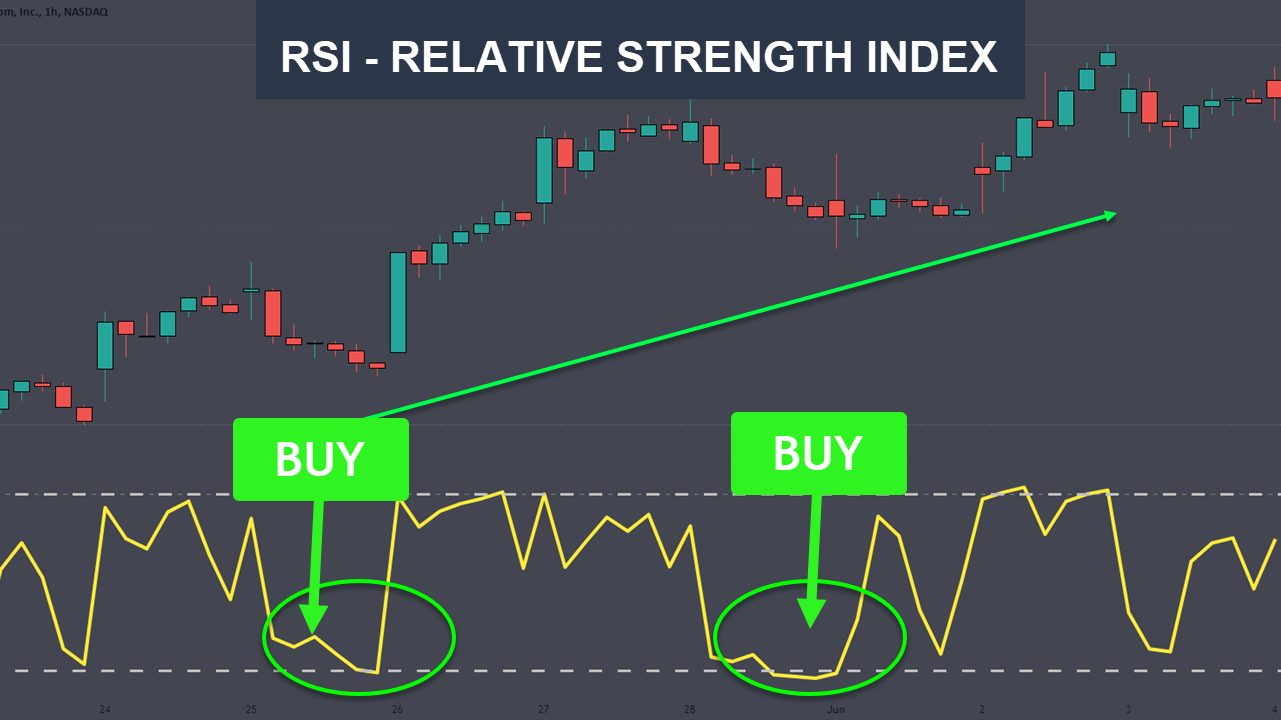
| | | How To Use The RSI by Shane Daly The Relative Strength Index (RSI) by J. Welles Wilder is one of the most popular technical indicators being used. The RSI compares the strength of up days to the strength of down days and with that calculation, we can determine if the momentum taking place is either bullish or bearish (consider lack of momentum as well). It them plots at value between 0 and 100 making it a bounded indicator. The most common settings that traders tend to watch are: - 80/20 where 80 is an overbought level and 20 is an oversold level
- 70/30 where 70 is overbought and 30 is oversold
Traders that blindly take make trading decisions at those levels or treat them as trading signals, tend to lose money over time. While these levels can show you the strength of the market, you need other techniques to trade off of them. |
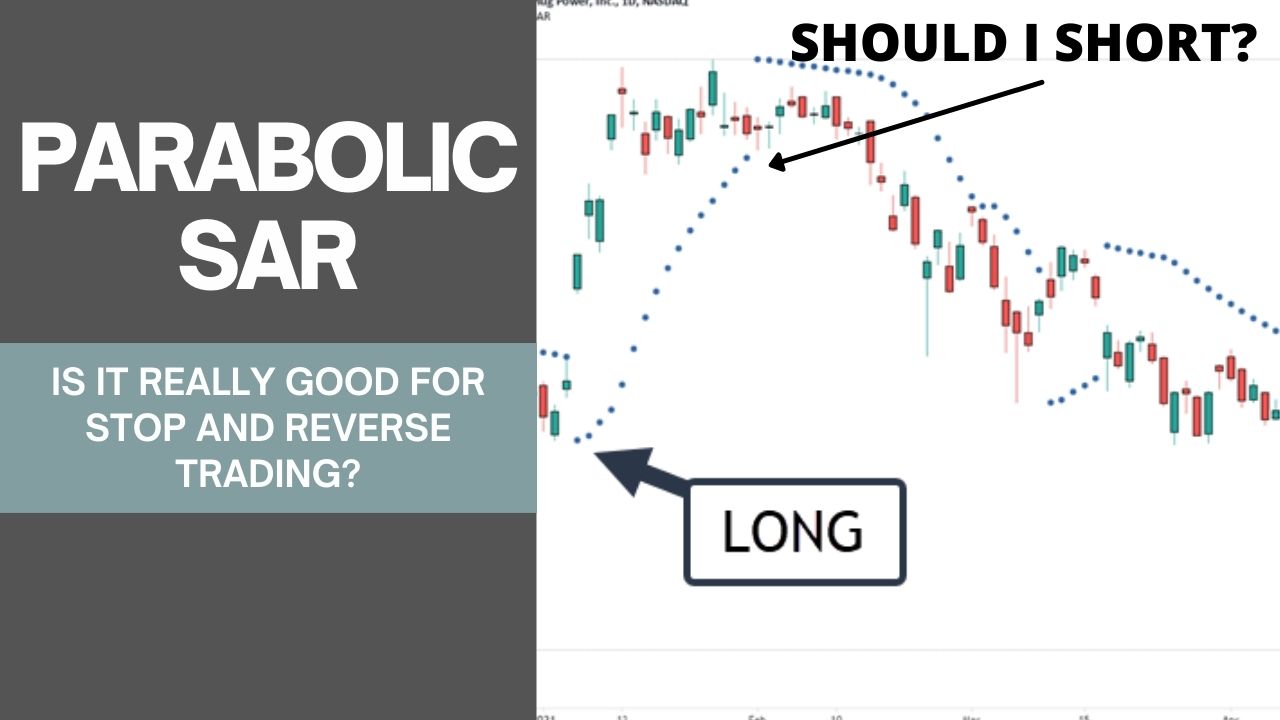
| | | Using The Parabolic SAR Indicator Effectively in Trading by Shane Daly What is the Parabolic SAR? The Parabolic Sar (stop and reverse indicator) by J. Welles Wilder, is a trading indicator that can be used for a few purposes: - Trend determination
- Trade entry signals
- Exit signals
The "stop and reverse" feature as shown by a series of dots above and below price, is designed for traders that are always either long or short in the market. - If the Parabolic Sar is plotting dots below price, price is an uptrend
- If plotting above price, we will consider the price is in a down trend
|
|
|---|
| |
|
|
|
|
|

If you no longer wish to receive our emails, click the link below:
UnsubscribeNetPicks.com 9400 MacArthur Blvd. 124-417 Irving, Texas 75063 United States (949) 481-2396

No comments:
Post a Comment