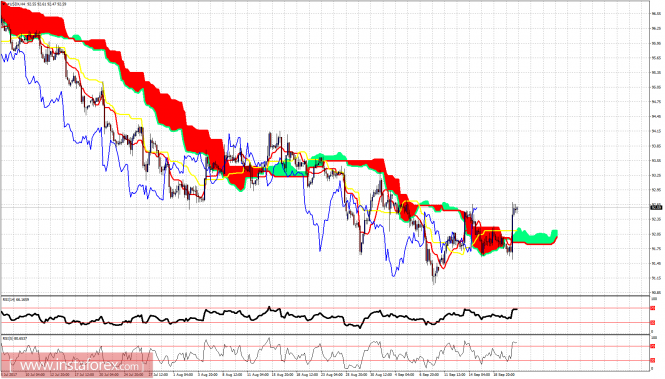
The Dollar index has broken out of the Ichimoku cloud in the 4-hour chart. This is a bullish sign. The Dollar index is however diverging. So a pullback towards cloud support at 92.10-92 is justified. Bulls will then need to hold above support. Otherwise we will see this breakout as a fake one.
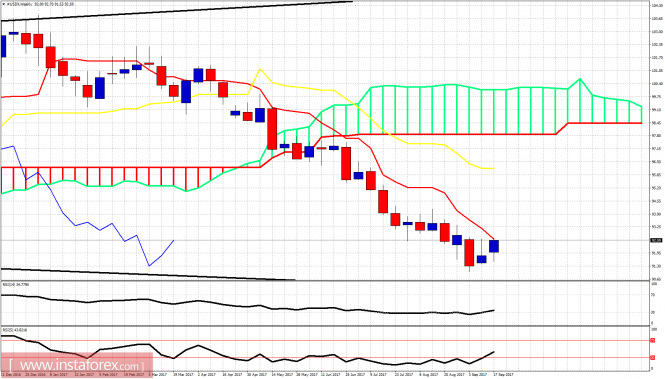
On a weekly basis, the Dollar index is testing the weekly tenkan-sen resistance (red line indicator). Price remains in bearish trend. The rest of this week and the next will be very important for the medium-term move which the index will make. A rejection here will open the way for new lows below 90. Continuation of Dollar strength will open the way for a bigger bounce towards 96.
Trading plan for 21/09/2017
The hawkish statements from Fed on Wednesday evening gave fuel to the US Dollar strengthening, which is continuing during the Asian session. The Bank of Japan decision was in line with expectations, though there was a voice for further loosening. AUD loses after dovish comments from the Reserve Bank of Australia. The Nikkei 225 is slightly rising, Gold is breaking down.
On Thursday 21st of September, the event calendar is busy with an important news release. During the London session, BOJ Press Conference will occur, then Eurozone will post ECB Economic Bulletin data, and the UK will present Public Sector Net Borrowing data. During the US session, Canada will post Wholesale Sales data and the US will present Unemployment Claims, Continuing Claims, Philly Fed Manufacturing Index and House Price Index data. Later during the session, there is a scheduled speech of Mario Draghi as well.
EUR/USD analysis for 21/09/2017:
The ECB Economic Bulletin data are scheduled for release at 08:00 am GMT and they might have some impact on the EUR/USD pair. Nevertheless, market participants will be still focused on yesterday's Fed decision regarding the interest rates. The Fed will begin the process of reducing its balance sheet total from October, but the more likely impact on the US Dollar would be the Federal Reserve's rate on the December rally and three more in 2018. At the conference, Jannet Yellen stressed that inflation was temporary and the hurricane effect is viewed as short-lived. As a result, USD is the unbeatable winner of the last trading hours. This situation might, however, get a little bit stopped after the Mario Draghi comments later tonight.
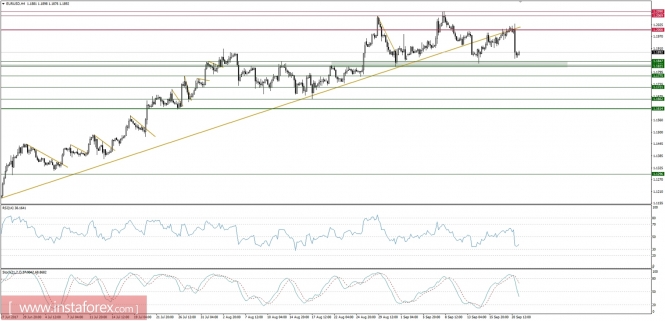
Let's now take a look at the EUR/USD technical picture on the H4 time frame. The EUR/USD pair dipped significantly after the Fed decision, but the pair is still trading inside of a range between the levels of 1.1821 - 1.2090. As long as the price stays in this zone, neither bulls or bears are the real winners. However, there are some signs of weakness in the EUR/USD pair as any rally needs a correction, but so far the drop was limited. The higher time frame trend remains bullish.
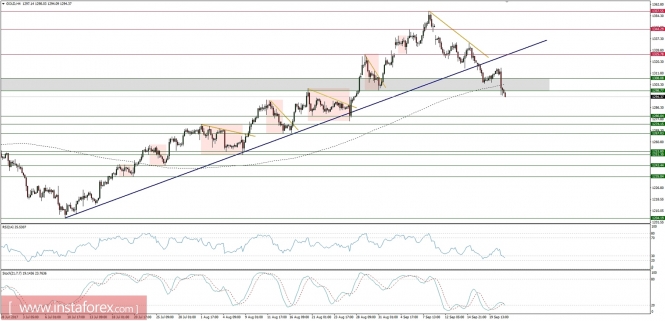
Market Snapshot: Gold drops below the important support
The price of Gold has dropped below the technical support zone between the levels of $1,308 - $1, 298 and now is heading towards the next support at the level of $1,280. The breakout below the 200-period moving average and the downward pointing momentum indicator supports the bearish outlook.
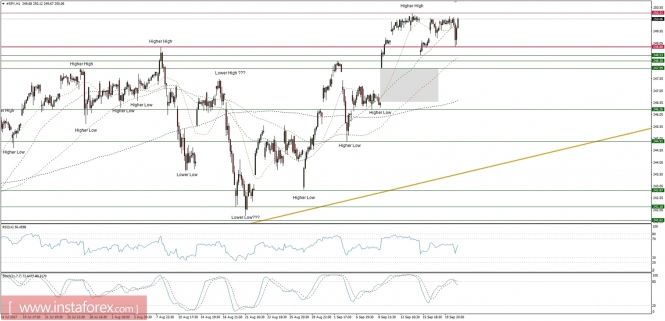
Market Snapshot: SPY bounces from support again
The price of SPY (SP500 ETF) has bounced from the technical support at the level of 248.88 after the Fed interest rate decision and currently is heading to test the all-time highs at the level of 250.31. The breakout above the all-time highs might become short-lived as the momentum indicator is still well below its fifty level and pointing downward.




No comments:
Post a Comment