
Forex analysis review |
- US economic growth as an indicator of the dollar's movement
- Minutes of glory, or the finest hour of the Swiss franc and the Japanese yen
- Gold got rid of the ballast
- GBP/USD. 28th of February. Results of the day. Labour again proposed a second referendum
- EUR/USD. 28th of February. Results of the day. The euro rose on the European trading session and fell on the US
- EUR/USD: the dollar allowed itself a correction, the euro is gaining strength
- Technical analysis for EUR/USD for February 28, 2019
- EURUSD: Results of the meeting of leaders of the USA and North Korea. Just a little time left before TLTRO launch
- Intraday technical levels and trading recommendations for EUR/USD for February 28, 2019
- February 28, 2019 : GBP/USD is retracing towards its newly-established Demand-Zone.
- BITCOIN Analysis for February 28, 2019
- Fundamental Analysis of EUR/CHF for February 28, 2019
- Bitcoin analysis for February 28, 2019
- Pound buyers trapped
- GBP / USD plan for the American session on February 28. Pound takes a break and waits for news from Theresa May on Brexit
- EUR / USD plan for the US session on February 28. Negative data is not an obstacle to the growth of the euro
- GBP / USD: next stop at 1.3520?
- EUR/USD analysis for February 28, 2019
- Gold rally continues due to geopolitical tensions
- Control zones of USD/CAD pair on 02.28.19
- Analysis of Gold for February 28, 2019
- Technical analysis of USD/CHF for February 28, 2019
- Technical analysis of GBP/USD for February 28, 2019
- GBP / USD: the reassessment of the prospects for the British currency by market participants can ensure its growth
- Technical analysis of EUR/USD for February 28, 2019
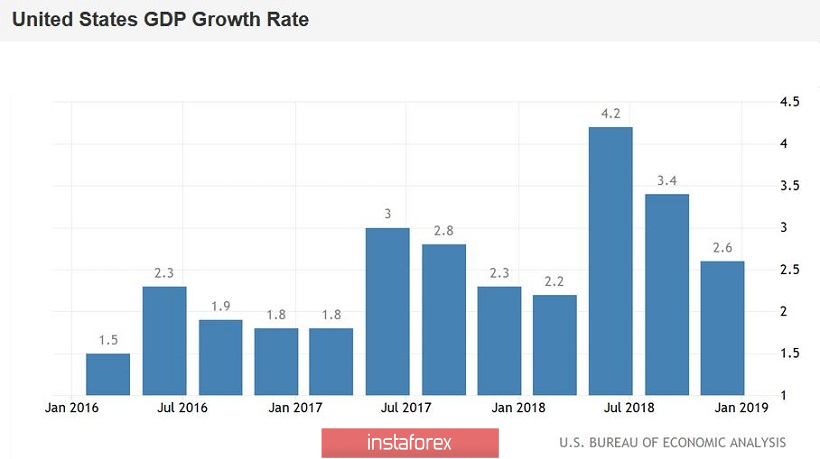
| US economic growth as an indicator of the dollar's movement Posted: 28 Feb 2019 04:47 PM PST The US economy slowed less than expected in the fourth quarter, but the decline in consumer and business spending caused the 2018 growth to fall short of the Trump administration's target. The report of the US Department of Commerce for GDP presented an assessment of President Donald Trump's economic policy, which speaks of economics as one of his greatest achievements and stated that his administration "has made an economic turn of historical proportions". As a result, GDP in the fourth quarter increased by 2.6 percent on an annualized basis, after rising 3.4 percent from July to September. In 2018, the economy grew by 2.9 percent, this was the best result since 2015 and better than the 2.2 percent recorded in 2017. Economists polled by Reuters forecast GDP growth at 2.3 percent. Despite the strong performance of the economy in the last quarter and in 2018, there are signs that activity is waning and most production figures will be lower in January and February. The economy slows down as monetary policy changes, and growth is also held back by a trade war between the United States and China. In addition, the economic outlook is overshadowed by signs of weakening global demand and uncertainty regarding Britain's withdrawal from the European Union. These factors support the "wait-and-see" position of the Federal Reserve in relation to further interest rate hikes this year. The dollar reacted positively to the GDP data and compensated for part of the loss against a basket of major currencies, the yield of US Treasury bonds rose. A trade dispute, combined with a strong dollar and weak global demand, holds back exports and forces businesses to accumulate imports, which leads to an increase in the trade deficit. The material has been provided by InstaForex Company - www.instaforex.com |
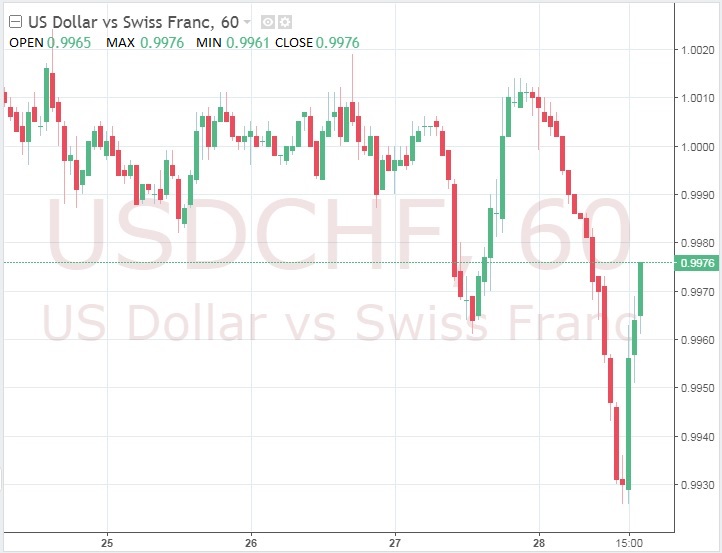
| Minutes of glory, or the finest hour of the Swiss franc and the Japanese yen Posted: 28 Feb 2019 04:23 PM PST The Swiss franc continues to rally and rises in price against the dollar. Factors for the growth of both the franc and the yen abound. The US and North Korea failed to reach an agreement on the denuclearization of the Korean Peninsula after two days of meetings, Chinese production shows a significant decline, as well as a lack of progress in trade negotiations between the US and China. All of the above pushes traders to take profit. At the same time, the British pound is still growing against the US dollar amid optimism about Brexit. Manufacturing activity in China fell to a three-year low in February, export orders declined at the fastest pace since the global financial crisis, this is another indication that the Chinese economy is facing a problem of weak demand, not only domestically, but also abroad. U.S. trade representative Robert Lighthizer added fuel to the fire as he stated that it is still "too early to predict the outcome of trade talks between Washington and Beijing." The result was excellent soil for the growth of the franc and the yen. Investors should choose "safe trading", which is primarily "long dollars". On the one hand, it is not very exciting, but on the other hand, it will really bring income. The material has been provided by InstaForex Company - www.instaforex.com |
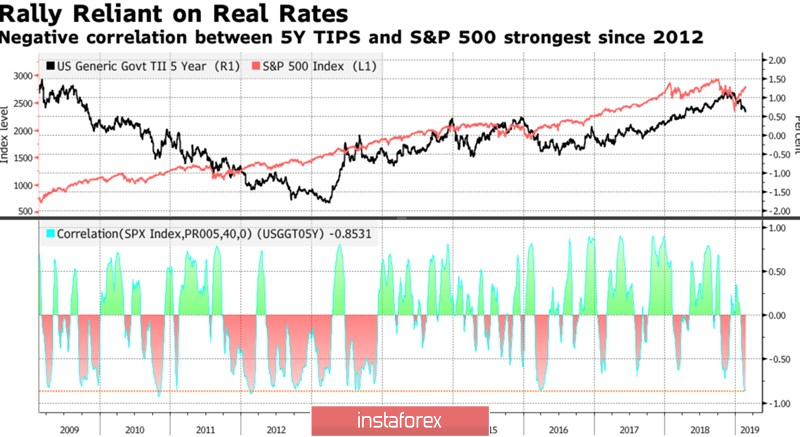
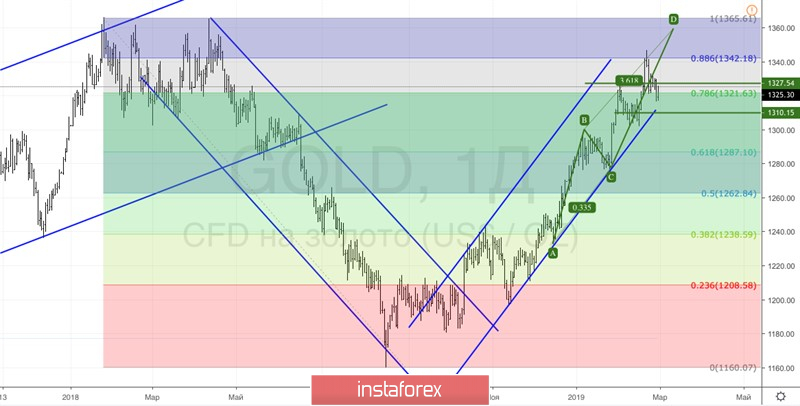
| Posted: 28 Feb 2019 04:00 PM PST Rebounding from support near two-week lows, gold quickly recovered and rushed to attack. The external background for the precious metal remains favorable, and the short-term correction is due to a partial profit-taking after a long rally and the statement of US trade representative Robert Lighthizer that there are still many issues in relations with China and the deal has not yet been concluded. Let me remind you that the conflict between the two largest economies in the world faithfully served the US dollar in 2018. Despite the fact that gold is considered a safe haven asset and a hedge against inflation, it is growing amid the recovery of US stock indices and the slowdown in consumer prices in the United States. In fact, one of the main drivers of the S&P 500 rally is the reduction in the cost of borrowing in real terms. The negative correlation between the stock index and the yield of US Treasury bonds reached its highest levels since 2012, due to the Federal Reserve's desire to pause the process of normalizing monetary policy. 7 years ago, the central bank announced another round of quantitative easing. The dynamics of the correlation of the S&P 500 and the yield of US bonds However, the fall in real rates of the US debt market creates favorable conditions not only for the shares, but also for many assets of the commodity market, including gold, oil and copper. Precious metal does not bring interest income to its holders, so it cannot compete with bonds if their yield increases. Currently, it is falling, and investors are actively diversifying their portfolios in favor of XAU/USD. The current consolidation of gold is due not only to profit taking by speculators after 9% of the winter rally, but also to the reluctance of the derivatives market to increase the chances of reducing the Federal funds rate in 2019. CME derivatives believe in the end of the normalization cycle, however, in order for them to adopt the idea of easing the Fed's monetary policy, further deterioration in macroeconomic statistics across the United States is necessary. Theoretically, it is very likely, because the traditionally bad weather for this time in the United States, the fading effect of the fiscal stimulus, the negative impact of the dollar's revaluation on exports and GDP, as well as the weakening of external demand due to trade wars draw moderately pessimistic prospects for US indicators. At least in the short-term investment horizon. The dollar can recover in the medium-term. The euphoria about the de-escalation of the trade conflict has driven the S&P 500 too high. The rally does not have a solid foundation in the form of improved macroeconomic statistics. According to 65% of more than 90 experts from Reuters, US stock indexes are in danger of falling in the second half of this year. This will have a positive effect on safe-haven assets, including the US dollar. Technically, if bulls on gold manage to keep quotes above $1,321 per ounce, the risks of continuing the rally in the direction of the target by 361.8% on the AB=CD pattern will increase. Gold daily chart |
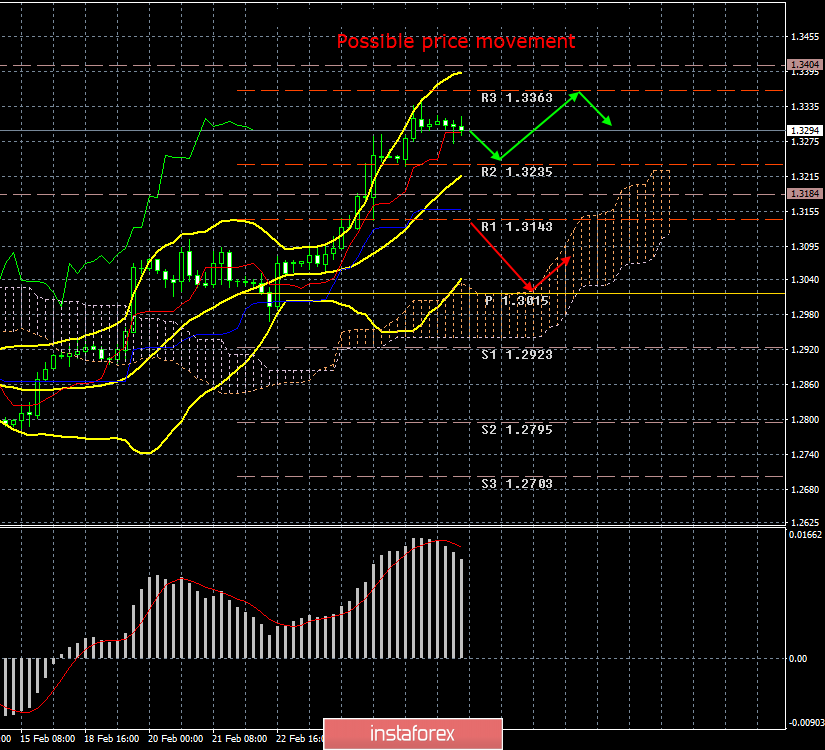
| GBP/USD. 28th of February. Results of the day. Labour again proposed a second referendum Posted: 28 Feb 2019 03:41 PM PST 4-hour timeframe The amplitude of the last 5 days (high-low): 69p - 111p - 63p - 195p - 116p. Average amplitude for the last 5 days: 111p (107p). On Thursday, February 28, the British pound sterling fell slightly amid a favorable fourth-quarter GDP report in the US. In general, the pound's situation remains simply paradoxical. Two months have passed in 2019 - and what has changed in the situation for Brexit? Nothing. Parliament rejected the initiatives of Theresa May, no one wants a "hard" version of Brexit, parties cannot agree on the Northern Ireland border, the EU does not want to make new concessions, it does not want to enter into new negotiations, but is ready to postpone the date of the UK's exit. Why, are there no new negotiations? Or will there be, but nobody talks about it yet? Furthermore: Labour is increasingly developing the idea of a second referendum, which, incidentally, is not so new. This time, citizens of Great Britain can offer to vote for the plan of Theresa May, for the "hard" Brexit, or, attention!, for refusing to leave the European Union. That is, in principle, even though this option remains unlikely (the rejection of a "divorce"), it still exists. Taking into account the fact that Brexit will be postponed, and precisely for an unknown period of time, since the parties can endure it as many times as necessary, it is still difficult to say how it will all end. In recent days, the pound sterling has grown significantly against the US dollar on expectations of the Brexit postponement. That is, buyers of the pound are well aware that nothing is changing for the better, either economically or politically, but the distance of a potentially unfavorable moment is regarded as a good reason to buy the British currency. That is why we believe that the current strengthening of the pound is groundless and at any time it could be replaced by no less a strong fall. Trading recommendations: The GBP/USD currency pair has started to adjust, so it is recommended to open new longs with a target of 1.3363 only if MACD turns up and the pair remains above the critical line. Buy orders will become actual small lots if the pair consolidates below the critical line. This will be the first step towards changing the trend to the downward, and the first goal will be the line Senkou Span B. In addition to the technical picture should also take into account the fundamental data and the time of their release. Explanation of illustration: Ichimoku Indicator: Tenkan-sen-red line. Kijun-sen – blue line. Senkou span a – light brown dotted line. Senkou span B – light purple dotted line. Chinkou span – green line. Bollinger Bands Indicator: 3 yellow lines. MACD: A red line and a histogram with white bars in the indicator window. The material has been provided by InstaForex Company - www.instaforex.com |
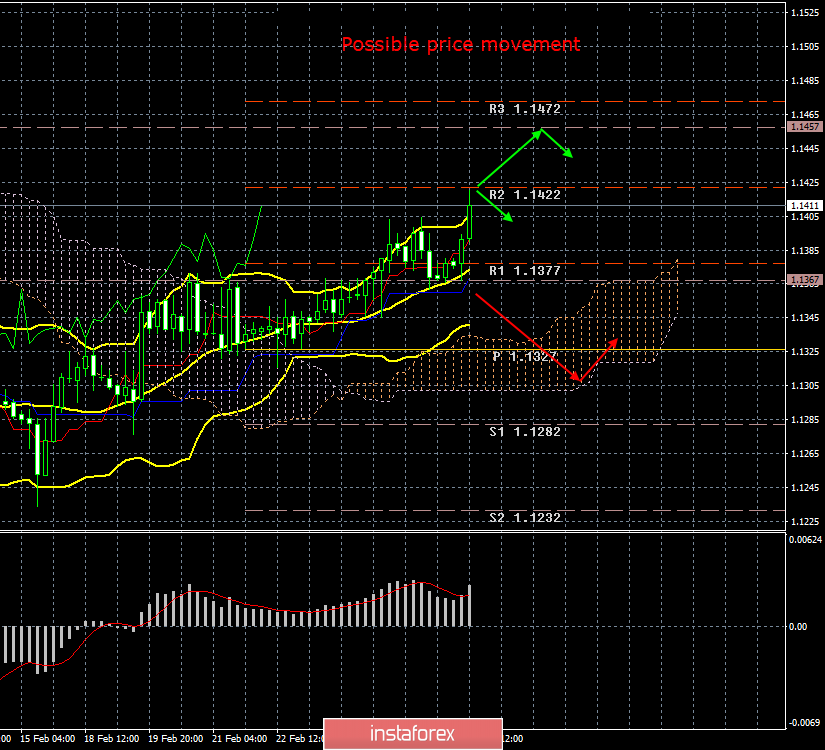
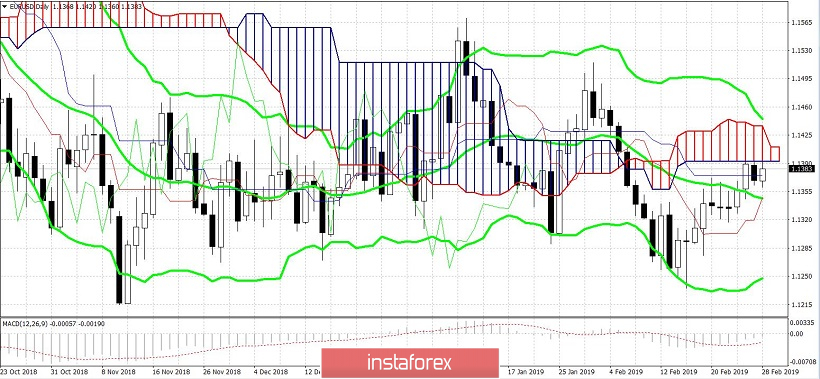
| Posted: 28 Feb 2019 03:21 PM PST 4-hour timeframe The amplitude of the last 5 days (high-low): 46p - 40p - 41p - 58p - 42p. Average amplitude for the last 5 days: 45p (46p). On Thursday, February 28, the EUR/USD currency pair resumed an upward movement after a small correction to the critical line. However, overall, instrument volatility remains low. In the first half of the day, there were no significant economic news in the European Union and the United States. But literally just half an hour ago data on US GDP for the fourth quarter was published, however, only at a preliminary value, and it turned out that the real value significantly exceeded market expectations (2.6% y/y versus 2.3%). Thus, now the US currency has received slight support. But, as we have said, all movements of the pair are in the daily range of 40-50 points, no more. Thus, we assess that the current state of the market is unfavorable for active trading. The pair is moving, but very weakly, there is practically no news, in such conditions, it is not necessary to expect a movement of 80-100 points in one direction without rollbacks and corrections. From a technical point of view, a new round of downward correction to the Kijun-Sen line is now possible. Below this line, the pair can not gain a foothold from February 18, that is 10 days. Therefore, the prospects for a weak upward movement remain, but it is still not too attractive for testing. The recent meeting between Donald Trump and Kim Jong-un has been concluded in Vietnam. It ended in nothing: the United States abandoned all sanctions against the DPRK, as the proposal of the North Korean leader did not suit Trump. This news did not have much impact on the dollar. Trading recommendations: The EUR/USD pair may start a new round of correction. If the MACD indicator turns down, it will be a specific signal for a correction. As before, formally, longs with a target of 1.1422 are now relevant, but weak volatility plays against active trading. It is recommended to consider sell orders not earlier than consolidation below the Kijun-sen line, but even in this case, given the weak volatility, the downward movement can be extremely weak. Therefore, it is recommended to work in small lots at the moment or expect an increase in volatility. In addition to the technical picture should also take into account the fundamental data and the time of their release. Explanation of illustration: Ichimoku Indicator: Tenkan-sen-red line. Kijun-sen – blue line. Senkou span a – light brown dotted line. Senkou span B – light purple dotted line. Chikou span – green line. Bollinger Bands Indicator: 3 yellow lines. MACD: A red line and a histogram with white bars in the indicator window. The material has been provided by InstaForex Company - www.instaforex.com |
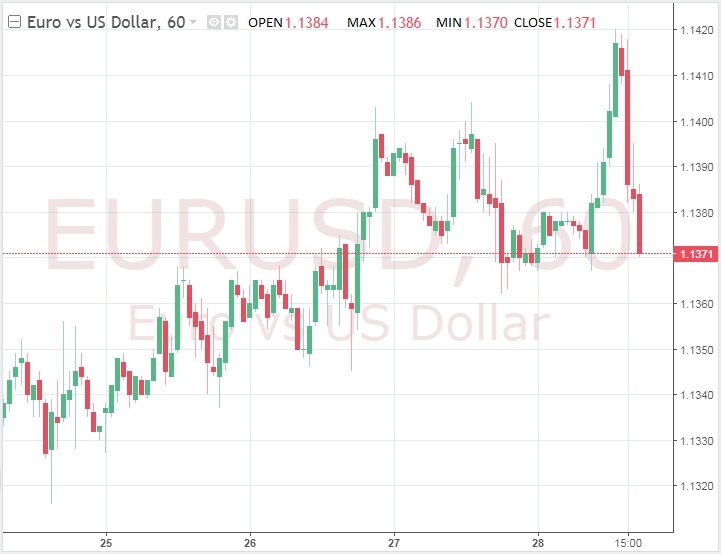
| EUR/USD: the dollar allowed itself a correction, the euro is gaining strength Posted: 28 Feb 2019 02:53 PM PST Today, the euro-dollar pair again tested the 14th figure against the backdrop of German inflation, but at the beginning of the US session the price went back home. Buyers are unable to gain a foothold above the mark of 1.1401, although this is a prerequisite for further growth to the main resistance level of 1.1440 (the upper Bollinger Bands line coinciding with the upper boundary of the Kumo cloud on D1). Bulls of EUR/USD for the third day attacked an irresistible mark, however, each time there is one or another argument that returns the pair to the area of the 13th figure. If yesterday geopolitical tensions were on the agenda in the light of the armed clashes between India and Pakistan, today, US macroeconomic data came to the fore. However, we can not say that the key indicator of the growth of the US economy was impressed with its dynamics. On the contrary, in the fourth quarter of last year, US GDP slowed again, however, the pace of this slowdown was slightly better than experts' expectations. Thus, if in the second quarter of 2018, the country's GDP reached its peak of 4.2%, the third quarter showed an increase of only 3.4%, and the fourth – up to 2.6%. The negative dynamics is visible to the naked eye, but today's results should have been even lower – at the level of 2.2%. Dollar bulls have tried to use a slower fall in the indicator in their favor – and they succeeded against many pairs. The dollar index again entered the area of 96 points, although its growth is very phlegmatic. An additional "bonus" from today's release was the dynamics of the price index of GDP. This indicator also came out slightly better than expected (1.8% instead of 1.7%), although in fact the index remained at the level of the third quarter. Thus, the reaction of dollar bulls is rather emotional. De facto, today's data has once again showed a slowdown in the US economy - moreover, the downward movement has acquired a strong trend, justifying the fears of the Federal Reserve members. In this context, it does not matter that the published figures turned out to be a few tenths of a percent higher than projected. What is important here is that alarming signals of an indirect nature are beginning to take on a real form with all the ensuing consequences. For example, the "dovish" wing of the Fed had additional arguments in favor of a wait-and-see position. After all, according to the minutes of the last meeting of the Federal Reserve, the regulator will raise the rate this year only if inflation is fixed above the target level. Given the dynamics of the GDP price index, we should not expect an inflation spurt in the foreseeable future. Nevertheless, bears of the EUR/USD pair decided to take advantage of the situation, especially against the background of the Chicago PMI, which peaked from December of the previous year. Thus, the business activity index in Illinois jumped to 64.7 points in February, contrary to forecasts of growth to 57.5. For comparison: this indicator came out at around 56.7 last month. The structure of this indicator suggests that the components of new orders, production and employment grew to their highest levels. And if the US macroeconomic statistics is very ambiguous, the geopolitical situation in the world on the contrary – provides only support to the dollar. The escalation of the conflict between India and Pakistan has a background effect on the foreign exchange market. Risk appetite has decreased, while anti-risk instruments are gradually gaining momentum. In addition to this fundamental factor, the situation with Brexit puts pressure on the euro/dollar pair. Despite the general belief that the British Parliament will vote to postpone the country's exit from the EU, the comments of some officials and politicians make traders nervous. For example, today, the head of the EU negotiating group Michel Barnier expressed doubts about the need to extend the transition period. In his opinion, the British will only postpone the problem for a few months, hoping to convince Brussels to reconsider the deal. However, once again, he reminded everyone that Europe's position is unwavering: the EU will not revise the deal and/or make any changes to it. This statement puts pressure on both the pound and the euro. Thus, further dynamics for the EUR/USD pair depends on the external fundamental background. The US macroeconomic data published today cannot reverse the situation, but the world is closely following the Indo-Pakistan conflict. If the parties do sit down at the negotiating table, bulls of the pair will again attempt to attack the 14th figure. Otherwise, the price will return at least to the mark of 1.1345 (at this price point, the Bollinger Bands middle line coincides with the Tenkan-sen line on the daily chart), and then to the bottom of the 13th figure. The material has been provided by InstaForex Company - www.instaforex.com |
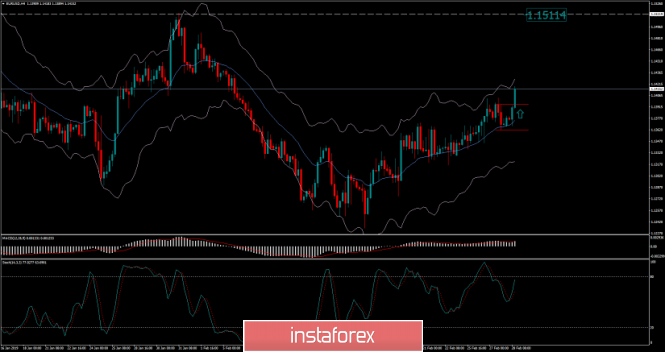
| Technical analysis for EUR/USD for February 28, 2019 Posted: 28 Feb 2019 07:27 AM PST EUR/USD reached our second target and major resistance area. Price got rejected and has given an important bearish signal. Has the upward correction ended? Are we starting the next leg down targeting below 1.13? As long as we trade below 1.1425 I remain bearish.
Green line - support trend line Blue line - short-term support trend line Black line - RSI support trend line Blue rectangle - second target area EUR/USD has broken the blue upward sloping support trend line. EUR/USD has reached my target area and got rejected. The RSI is breaking below support trend line. All these bearish signs imply a pull back at least. Support is found at 1.1350 and at 1.13. Breaking below 1.13 will open the way for a move towards 1.11. I'm bearish as long as we trade below today's highs. The material has been provided by InstaForex Company - www.instaforex.com |
| Posted: 28 Feb 2019 06:12 AM PST The results of the second summit devoted to the winding down of the North Korean nuclear program have become known today. As the White House said, US President Donald Trump and North Korean leader Kim Jong Un failed to reach a general agreement. All the statements made by Trump the day before that the two leaders managed to build excellent relations remained unheard by the leader of North Korea. In his twitter, Trump wrote that the meeting with Kim Jong-un was productive, but for the time being, it would be wrong to sign anything. Trump also noted that he is committed to long, but productive negotiations, which, ultimately, will lead to the signing of a joint agreement that suits both parties. The main obstacle at the end of the negotiations was trading sanctions, which the United States maintains against North Korea. However, one of the advantages is the fact that the North Korean leader Kim Jong-un is ready to give up nuclear weapons. As for the next meeting, there are currently no arrangements for additional summits with North Korea. Meanwhile, the European currency continues to strengthen its position, despite the fact that many economists expect the European Central Bank at the next meeting to be held next Thursday, will announce the start of a new round of long-term targeted refinancing operations TLTRO. This will mitigate concerns about the need to refinance cheap loans, as well as preserve the soft lending conditions, which many investors and traders fear. Given the risks of trade and political conflicts, along with weak macroeconomic statistics, the slowdown in the economic growth of the eurozone and its recession seems more real than before. All this suggests that the ECB may even postpone the increase in interest rates for the next year, which in the medium term will weaken the position of the European currency or limit the upward correction in a pair with a weaker, for almost the same reasons, US dollar. Today, data came out that showed that consumer spending in France in January of this year increased by 1.2% compared with December 2018, and by 1.0% compared with the same period last year. Economists had forecast growth in consumer spending by 0.5% and 0.1%, respectively. Inflation in France is not so good. According to preliminary data, the consumer price index in February remained unchanged compared with January and grew by 1.3% year on year. France's preliminary CPI in February was forecast at 0.4%. The preliminary consumer price index in Italy in February rose by only 0.2% and 1.1% per annum, which fully coincided with economists' forecasts. In the afternoon, reports are expected on inflation in Germany, as well as the US GDP for the 4th quarter of 2018, which could significantly affect the EURUSD pair. If inflation in Germany remains stable, and US GDP turns out to be worse than forecast, then the demand for risky assets may increase substantially, which will lead the trading tool to update the highs of 1.1440 and 1.1460. With a scenario of good performance in the growth rate of the American economy, and initially, they will be worse than in the 3rd quarter, the demand for the dollar may return, which will pull the EURUSD pair down to support levels of 1.1380 and 1.1340. The material has been provided by InstaForex Company - www.instaforex.com |
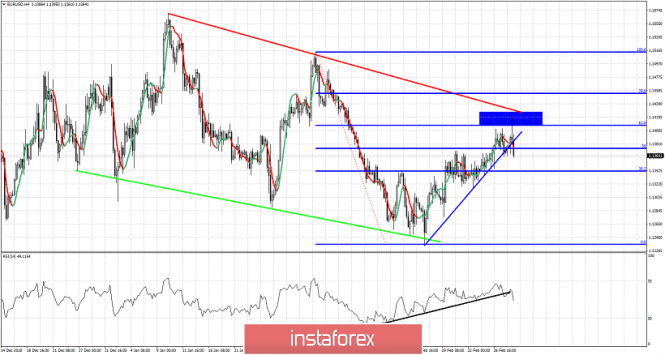
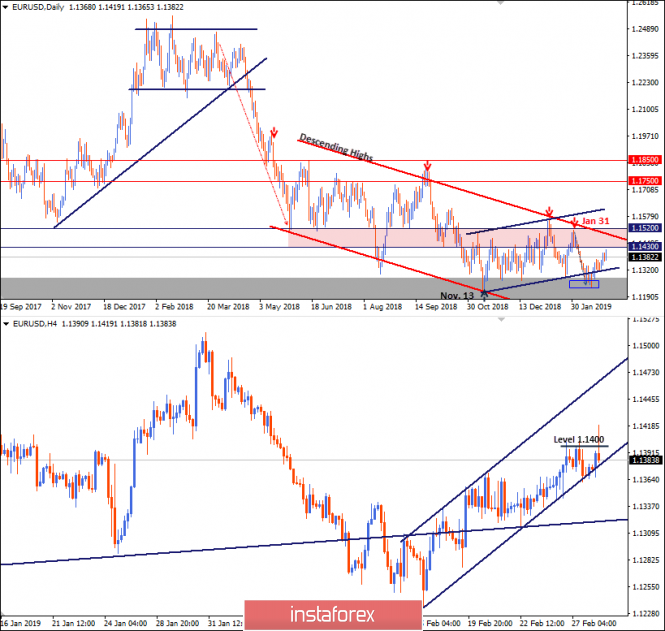
| Intraday technical levels and trading recommendations for EUR/USD for February 28, 2019 Posted: 28 Feb 2019 06:12 AM PST
On November 13, the EUR/USD demonstrated recent bullish recovery around 1.1220-1.1250 where the current bullish movement above the depicted short-term bullish channel (In BLUE) was initiated. Bullish fixation above 1.1430 was needed to enhance further bullish movement towards 1.1520. However, the market has been demonstrating obvious bearish rejection around 1.1430 few times so far. The EUR/USD pair has lost its bullish momentum since January 31 when a bearish engulfing candlestick was demonstrated around 1.1514 where another descending high was established then. This allowed the current bearish movement to occur towards 1.1300-1.1270 where the lower limit of the depicted DAILY channel came to meet the pair. Since February 20, the EUR/USD pair has been demonstrating weak bullish recovery with sideway consolidations around the depicted price zone (1.1300-1.1270). This week, significant bullish recovery has emerged around the lower limit of the depicted H4 channel on Tuesday. However, Today, the pair has failed to fixate above 1.1400 with early signs of bearish rejection on the H4 chart. This may indicate a high probability of a bearish reversal ONLY IF bearish breakdown below 1.1360 is achieved on H4 chart. Please note that a bearish flag pattern may become confirmed if bearish persistence below 1.1250 is achieved on the daily basis. Pattern target is projected towards 1.1000. Trade Recommendations: Intraday traders can wait for a bearish breakout below 1.1360 as a valid SELL signal. T/P levels to be located around 1.1300 and 1.1250. The material has been provided by InstaForex Company - www.instaforex.com |
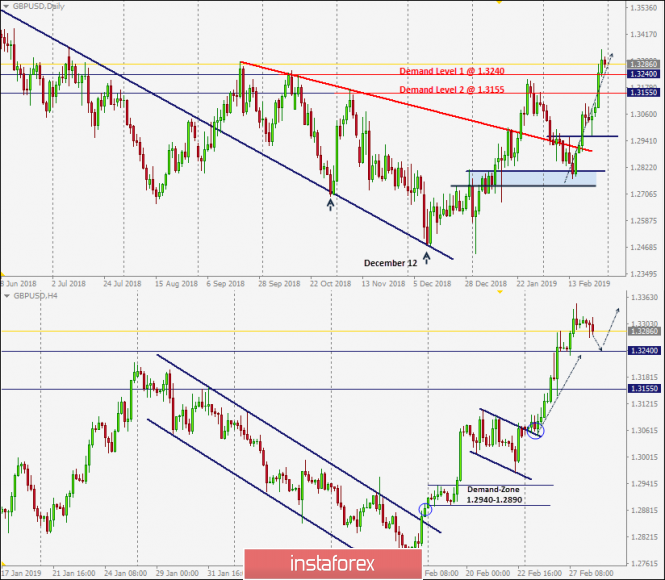
| February 28, 2019 : GBP/USD is retracing towards its newly-established Demand-Zone. Posted: 28 Feb 2019 06:04 AM PST
On December 12, the previously-dominating bearish momentum came to an end when the GBP/USD pair visited the price levels of 1.2500 where the backside of the broken daily uptrend was located. Since then, the current bullish swing has been taking place until January 28 when the GBP/USD pair was almost approaching the supply level of 1.3240 where the recent bearish pullback was initiated. Shortly after, the GBP/USD pair lost its bullish persistence above 1.3155. Hence, the short-term scenario turned bearish towards 1.2920 (38.2% Fibonacci) then 1.2820-1.2800 (50% Fibonacci level) within the depicted H4 bearish channel. On February 15, significant bullish recovery was demonstrated around 1.2800-1.2820 (Fibonacci 50% level) resulting in a Bullish Engulfing daily candlestick. This initiated the current bullish breakout above the depicted H4 bearish channel. Quick bullish movement was demonstrated towards 1.3155, 1.3240 and 1.3300. Early signs of bearish reversal/retracement were demonstrated around the price level of 1.3317. Bearish pullback is expected to extend down towards 1.3240 and 1.3200 where price action should be watched cautiously. Bullish persistence above the newly-established depicted demand-zone (1.3240-1.3155) is mandatory to allow further bullish advancement. Any bearish breakdown below 1.3240 invalidates the short-term bullish scenario allowing a quick bearish movement to occur towards 1.3150 (lower limit of the demand zone). Trade Recommendations : Conservative traders should wait for a bearish pullback towards 1.3240 for a valid BUY entry. S/L to be located below 1.3190. T/P levels to be located around 1.3290, 1.1330 and 1.3360. The material has been provided by InstaForex Company - www.instaforex.com |
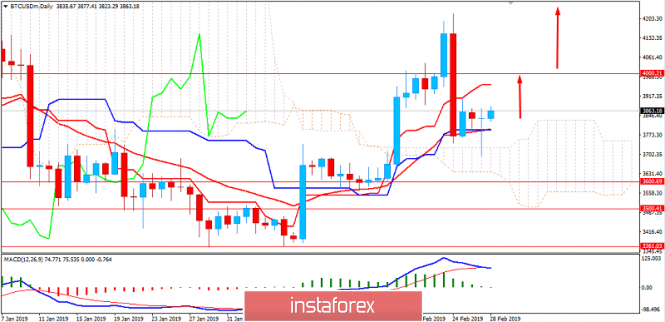
| BITCOIN Analysis for February 28, 2019 Posted: 28 Feb 2019 05:00 AM PST Bitcoin has been quite volatile after a recent bullish false breakout above $4,000. The price created a few inside bars where the third inside bar tried to push below the mother bar but failed with a Bullish Pin Bar daily candle bouncing off the Kumo Cloud support. The price is currently being held by the dynamic level of 20 EMA and Kijun line as support that is expected to lead the price towards $4,000 or even higher in the future. The bullish bias is still quite intact but certain indecision rose in the market after the impulsive bearish pressure making the recent breakout as false above $4,000. Currently the price being above the Kumo cloud signals further upward momentum as Chikou Span is also holding above the dynamic levels and price line. As the price remains above $3,500-600 support area, the bullish pressure is expected to continue. SUPPORT: 3,500, 3,600 RESISTANCE: 4,000, 4,250 BIAS: BULLISH MOMENTUM: VOLATILE
|
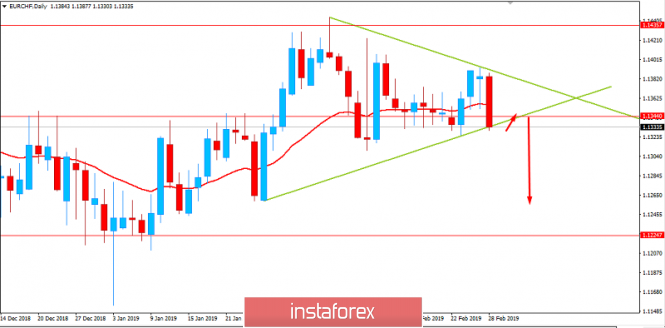
| Fundamental Analysis of EUR/CHF for February 28, 2019 Posted: 28 Feb 2019 04:49 AM PST EURCHF was quite surprising today with an impulsive bearish pressure after series of corrective bullish momentum building up since the bounce of the 1.1150 area. CHF has been the dominant currency in the pair whereas having better economic reports recently while Eurozone struggles with the economic slowdown resulted in further CHF gains in the process. Though EURO was quite optimistic ahead of economic reports published today, the actual result was a bit of a shock for the EURO buyers which resulted in the drastic fall against CHF. Today German Import Prices report was expected to increase to 0.2% but the actual result was published with -0.2%, French Prelim CPI was expected to increase to 0.4% but the actual result was published with 0.0% but French Consumer Spending showed a positive result with an increase to 1.2% which was expected to be at 1.1%. Recently German Buba President Weidmann spoke about Eurozone's weakness where he stated that no interest rate increase should take place at least before summer. The growth rate of Euro is quite below the expectation and inflation development is currently going to be the main focus. As per Weidmann, temporary solutions can be applied but long-term sustainability is yet very much uncertain for Eurozone. According to ECB policymaker Villeroy, ECB should look at how to reduce the risks from negative interest rates. As per current situation, fluctuations in the interest rate can be quite risky but it will have its advantage in certain point but currently ECB is not quite convinced to work on the interest rate at least by the end of 2019. On the CHF side, recently Credit Suisse Economic Expectation report was published with increase to -16.6 from the previous figure of -44.0 which impacted the growth of CHF quite positively and expected to lead to certain gains on the CHF in the process. Today CHF GDP report was unable to meet the expectation of 0.4% and was published with 0.2% while increasing from the previous value of -0.3% and KOF Economic Barometer was published with decrease to 92.4 from the previous figure of 96.2 which was expected to be at 95.2. As of the current scenario, while Eurozone and CHF is struggling with the economic reports, ahead of Retail Sales report to be published tomorrow which is also expected to increase to 0.3% from the previous value of -0.3%, CHF expected to have greater probability to gain sustainability with the upcoming gains if the results come positive in the process. Now let us look at the technical view. The price is currently residing at the edge of trend line support while breaking below 1.1350 support area with a daily close. Though the current candle has not closed yet but having such engulfing candle with tremendous bearish pressure in the building, further bearish momentum is expected in the coming days with target towards 1.1200-50 support area.
|
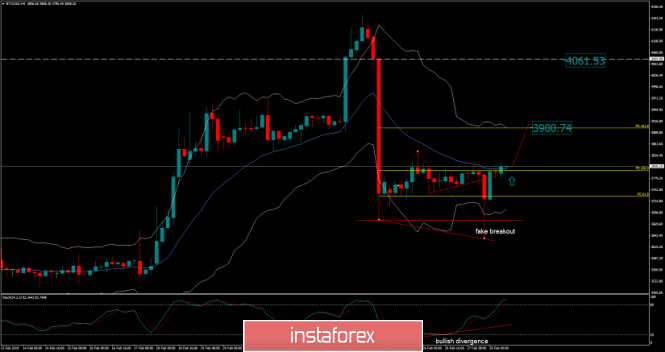
| Bitcoin analysis for February 28, 2019 Posted: 28 Feb 2019 04:10 AM PST BTC did a fake breakout of support at the price of $3.680, which is a clear-cut sign of a trend reversal.
We found a strong rejection of the support at $3.680 in combination with the bullish divergence on the Stochastic oscillator, which is an obvious sign of a trend reversal. Support is seen at the price of $3.634 and resistance is at $3.900. Trading recommendation: We are bullish about BTC from 3.810 with targets at $3.900 and $4.060. Protective stop is placed at $3.630. The material has been provided by InstaForex Company - www.instaforex.com |
| Posted: 28 Feb 2019 04:04 AM PST The pound sterling paired with the US currency continues to show positive, developing upward momentum. The highest mark on Wednesday was 1.3348, and on Thursday the GBPUSD pair gives up a little, hinting at the possibility of a weakening of the course. The enthusiasm of the trader is still connected with the expectation of postponing the date of the UK's official exit from the EU. British parliamentarians supported the proposal of Prime Minister Theresa May, agreeing to give their votes for the impossibility of exiting without a deal. In addition, they confirmed the need to appoint another, later date for the country's withdrawal from the union. In a vote on amendments to the Brexit Bill, British officials supported the initiative with 502 votes. The roadmap of the sensational political "divorce" looks like this:
However, there is no certainty that delaying exit from the EU will help the UK maintain access to the single European market, as well as to the European Customs Union. Do not overly hopeful that it will help to find a consensus on the temporary status of the backstop. Therefore, do not rush to further purchases of the pound. Analysts at Danske Bank have a similar opinion, who advise skimming the cream from long positions in the UK currency. The bank recorded a profit on a short position in EURGBP, opened by means of options. In connection with the talk about the Brexit transfer, the sterling has noticeably strengthened its position, but experts are not sure if the trend will continue. In their opinion, the lack of fresh positive drivers may bring a correction, which Danske Bank prefer not to wait. Recall that the sale of the pair EURGBP was one of the bank's trading ideas, voiced at the end of last year. Banking analysts also talked about the advisability of buying a dollar against a basket of yen, the Swedish krona, franc and buying a 9-month call option in EURUSD with the simultaneous sale of a 3-month straddle. The material has been provided by InstaForex Company - www.instaforex.com |
| Posted: 28 Feb 2019 04:04 AM PST To open long positions on the GBP / USD pair, you need: The technical picture has not changed compared with the morning forecast and the option of continuing the growth of the British pound remains quite good. However, this requires the completion of a number of divergences on various indicators, as well as, a correction to the support area of 1.3266, to which the bears have not reached today in the morning. The main goal of the bulls is to breakthrough and consolidate above the resistance of 1.3346, which will lead to the renewal of new monthly highs around 1.3386 and 1.3437, where I recommend taking profits. To open short positions on the GBP / USD pair, you need: The demand for the pound is declining but to go against a strong uptrend is not quite the right decision. Sellers need to form a false breakdown in the area of resistance 1.3346. Only after such an event, you can count on a larger downward correction in the pound to the support area of 1.3266 and 1.3204, where I recommend taking profits. In the scenario of further growth with the trend, you can open short positions from a maximum of 1.3386 and better from a larger area of 1.3437. More in the video forecast for February 28 Indicator signals: Moving averages Trading is above 30- and 50-moving averages, which indicates the bullish nature of the market but the price may move below the moving averages at any time, which will lead to a larger downward correction in the pound. Bollinger bands Bollinger Bands indicator volatility is very low, which does not give signals on market entry. Description of indicators MA (moving average) 50 days - yellow MA (moving average) 30 days - green MACD: fast EMA 12, slow EMA 26, SMA 9 Bollinger Bands 20 The material has been provided by InstaForex Company - www.instaforex.com |
| Posted: 28 Feb 2019 04:03 AM PST To open long positions on EUR / USD pair, you need: In the morning, a number of weak fundamental data on inflation from various eurozone countries did not interfere with the resumption of the upward movement in the euro. Fixing above the resistance level of 1.1403 and testing it on the volume from top to bottom in the second half of the day will be good signals for building up long positions in euro in consideration of the continuous upward correction to the area of maximum 1.1432 and 1.1459, where I recommend taking profits. In the case of EUR/USD decline under the support level of 1.1403, it is best to return to the euro from the support of 1.1374 for euro purchases. To open short positions on EUR / USD pair, you need: Only a weak report on inflation in Germany and good data on the US economy can influence the pair to return to the EUR/USD pair to the level of 1.1403, which will lead to the closure of long positions in the euro and a decrease to the minimum area of 1.1374 and 1.1348, where I recommend taking profits. In case of further growth of the pair amid poor statistics on US GDP for the 4th quarter of 2018, it is best to consider short positions after updating the resistance of 1.1432 or to rebound from a maximum of 1.1459. More in the video forecast for February 28 Indicator signals: Moving averages Trade remains in the region of 30- and 50- moving averages, which indicates the lateral nature of the market with the advantage of euro buyers. Bollinger bands Bollinger Bands indicator volatility is very low, which does not give signals on market entry. Description of indicators MA (moving average) 50 days - yellow MA (moving average) 30 days - green MACD: fast EMA 12, slow EMA 26, SMA 9 Bollinger Bands 20 The material has been provided by InstaForex Company - www.instaforex.com |
| GBP / USD: next stop at 1.3520? Posted: 28 Feb 2019 04:03 AM PST The British pound against the dollar is now forced to respond not only to the news background regarding Brexit prospects but also to events of a geopolitical scale. The threat of a war between India and Pakistan, as well as the failed US-DPRK negotiations in Vietnam, gave strength to the American currency, which again began to enjoy the status of a defensive asset. As a result, the GBP/USD bulls were forced to retreat from the annual highs but not entrenched in the area of the 33rd figure. It is worth noting that the further movement of the pair is quite difficult to predict. From a technical point of view, the price has the potential for growth. The Ichimoku indicator has formed a bullish signal "Parade of lines" on the daily chart and the pair, itself, is on the upper line of the Bollinger Bands indicator. After this line was broken, corresponding to the 1.3280 mark, the next resistance level is the area of 1.3520, which was the upper limit of the Kumo cloud on the weekly chart. There are no other serious obstacles in technical terms but the fragile fundamental background does not allow to speak with confidence about the implementation of this option. The main engine of growth for the pair is the belief that Brexit will be postponed for several months and the country will avoid the chaotic scenario at least in March. Every day this confidence increases and pushes the GBP/USD pair upwards. At the same time, traders currently have little interest in further prospects for negotiations, which will be very difficult. But the market starts at the moment, "here and now", starting from the comments of British politicians and leaders of the EU countries. For example, German Chancellor Angela Merkel and French President Emmanuel Macron said yesterday in Paris that they were ready to give Britain the opportunity to postpone Brexit "to a later date." However, they did not specify the permissible time frame, whereas earlier Merkel's representatives said that Germany would agree to postpone the key date only for a few months, namely until the end of June. However, this date will most likely become a new "deadline," since Theresa May also mentioned June in her speeches in the context of the extension of the 50th article of the Lisbon Treaty. Yesterday, the British Parliament approved May's plan for a strategy for further action. Hence, the deputies will give their assessment of the "updated" draft transaction on March 12. If they don't support him, the next day there will be a vote on Brexit without a deal. In case of failure of this option, on March 14, the parliament will consider the option of extending the term of the 50th article of the above contract (in other words, about deferring Brexit). It is noteworthy that the parliament rejected Labor's legislative initiative yesterday. According to which, Britain remains in the Customs Union and the single market from the EU after the actual exit from the Alliance. After the opposition's fiasco, they again declared that they would submit a question of holding a second referendum to parliament. In spite of the fact that lately laborers are increasingly talking about lobbying for this idea, they have not yet taken any actual steps in this direction. None of the opposition voiced the new strategy while the question of holding a repeated referendum is very difficult from a legal point of view. By the way, even Labor cannot answer key questions about the second referendum, for example, what then to do with the law that obliges Britain to leave the EU on March 29 this year? From which stage to begin negotiations with Brussels if the British re-agree on Brexit? Or Are the Europeans are categorically against revising the agreements reached? There are many questions such as these but most of them have no answer. One of the representatives of the Labor Party said yesterday that the British would be offered to make a choice between the May deal and the preservation of the country within the EU. However, this idea has not yet found a response among parliamentarians. In other words, the most realistic scenario is the postponement of Brexit's date and further negotiations between the parties until the end of June. Although the option of approving the transaction is not excluded on March 12, most experts do not believe in it. At the same time, the option of the chaotic Brexit has dropped significantly at least in the context of the coming months. All of these allow the pound to further strengthen, if not for one, "but" the deterioration of the geopolitical climate in the world. First, the conflict between India and Pakistan continues. According to a local media, the Pakistani military this morning fired mortar shells at settlements in the Indian state of Jammu and Kashmir. From India, there was also an answer the skirmish lasted about an hour. International mediators have not yet succeeded in bringing the conflicting parties to the negotiating table, hence, the risk of nuclear war still persists. Meanwhile, talks between Trump and the UN ended ahead of time. The United States did not agree to the conditions put forward by the DPRK. Thus, the leader of North Korea insisted on the lifting of sanctions before the dismantling of nuclear facilities but the American president insisted on the opposite. This news background slightly restored the dollar index position but it's too early to talk about a large-scale trend reversal, while the market still does not believe in a full-scale war between India and Pakistan and the leaders of the United States and the DPRK dispersed to the "ring corners" in a fairly friendly manner. Thus, if the armed conflict does not get its continuation today, the pound will again try to gain a foothold in the 33rd figure with an eye to achieving the main upward goal of 1.3520. The material has been provided by InstaForex Company - www.instaforex.com |
| EUR/USD analysis for February 28, 2019 Posted: 28 Feb 2019 04:01 AM PST EUR/USD has been trading upwards. The price tested the level of 1.1417. Bullish momentum is maintained.
We found the upward breakout of 1-day resistance at 1.1395, which confirms a further uptrend. I also found that bullish divergence in the background did set the bullish tone that EUR/USD is currently trading with. Key short-term resistance is seen at the price of 1.1511 and the support is at 1.1236. Trading recommendation: We are bullish on EUR/USD from 1.1415 with a target at 1.1510. Protective stop is set at 1.1360. The material has been provided by InstaForex Company - www.instaforex.com |
| Gold rally continues due to geopolitical tensions Posted: 28 Feb 2019 03:38 AM PST According to some analysts, the rally of gold price will be supported by an unstable geopolitical situation. This condition is aggravated due to the difficulties around Brexit and the unclear fate of the agreement on mutual trade between the US and China. Against this background, investors are still seeking to invest in safe assets, which include the yellow metal. The world's most popular precious metal maintains its uptrend. In August 2018, after reaching a minimum level of $ 1,160.88 per 1 ounce, the price of gold increased by 14%. At the beginning of 2019, its yield was an additional of 4%. According to a major expert and investor from US Global Investors, Frank Holmes, gold prices will continue to rise in the near future. The analyst is optimistic about the prospects for the precious metal. Experts of the large American bank Goldman Sachs agree with him. They predict a rise in the price of the yellow metal by the summer of 2019 by 4% to $ 1,374 per ounce. Goldman Sachs is confident that in a year the cost of the precious metal will reach $1,425. According to experts, given the possible start of a recession in the US economy and instability in global stock markets, the implementation of such a scenario is quite likely. Experts believe that a number of reasons are important factors in the growth of the price of gold. One of them is the fall in the yield of US government bonds, which began in the autumn of 2018. In this situation, the US currency will be under pressure, which will positively affect the value of gold. Recall that the US dollar and the yellow metal are inversely correlated to each other. According to analysts' calculations, technical factors also indicate a rise in the price of gold. In 2012-2013, the precious metal fell heavily. At the moment, the price ranges from $1340 to $1350 per 1 ounce continues to be the resistance level. As soon as the price of gold can rise above this level, its growth will be more confident. Another important factor in the rise in the price of gold may be the conclusion of a trade agreement between the United States and China. In this situation, the Chinese economy will receive a new impetus for development. This will increase the demand for commodities, including the yellow metal. Recall, the Middle Kingdom consumes almost 50% of many commodities. In a stable economic situation in the PRC, the middle class will acquire more jewelry. The third key factor in the growth of gold prices is the policy of a number of world central banks. They regularly buy yellow metal for the reserves of their countries. Gold is becoming an important asset for them to diversify international reserves. Last year, global regulators acquired a record volume of gold since 1968. According to experts of the World Gold Council, the previous record could be broken at the end of this year. The material has been provided by InstaForex Company - www.instaforex.com |
| Control zones of USD/CAD pair on 02.28.19 Posted: 28 Feb 2019 03:38 AM PST As long as the pair continues to trade above the weekly CZ of 1.3138-1.3119 with the growth remains to be the priority. The first goal of the upward movement is the 1/2 CZ of 1.3221-1.3211, formed from the low of the current week. All movement occurs in the accumulation phase, where transactions from flat boundaries are most profitable. Yesterday's purchases should be partially fixed when the price reaches the first goal while the rest can be transferred to breakeven. Working within the framework of the flat does not provide an opportunity to count on a large number of profit points, therefore, partial fixation compensates for this moment and makes it possible to improve the risk-to-profit ratio after the instrument leaves the flat trend. An alternative model will be developed if today's closure of the American session happens below the level of 1.3119. This will open the way for a further decline. The first goal of such a reduction will be the 1/2 CZ of 1.3022-1.3012. A movement to this zone will allow updating the February low or testing it already in the new month. Daily CZ - daily control zone. The area formed by important data from the futures market that change several times a year. Weekly CZ - weekly control zone. The area formed by marks from important futures market which change several times a year. Monthly CZ - monthly control zone. The area is a reflection of the average volatility over the past year. The material has been provided by InstaForex Company - www.instaforex.com |
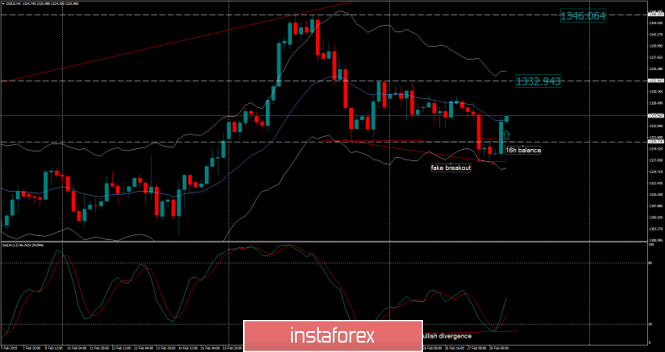
| Analysis of Gold for February 28, 2019 Posted: 28 Feb 2019 03:36 AM PST Gold made a fake breakout of the 4-day support at the price of $1.320.73, which is a sign that sellers got trapped.
We found a fake breakout of the 4-day low ($1.320.73 and the upward breakout of the 16H balance, which is strong bullish sign. Another confirmation of strength is the bullish divergence on the Stochastic oscillator. Support is seen at the price of $1.316.80 and resistance is at $1.332.95-$1.346.05. Trading recommendation: We are bullish about Gold from $1.325.00 with the stop at $1.316.00. Upward targets are set at $1.332.95 and $1.346.06. The material has been provided by InstaForex Company - www.instaforex.com |
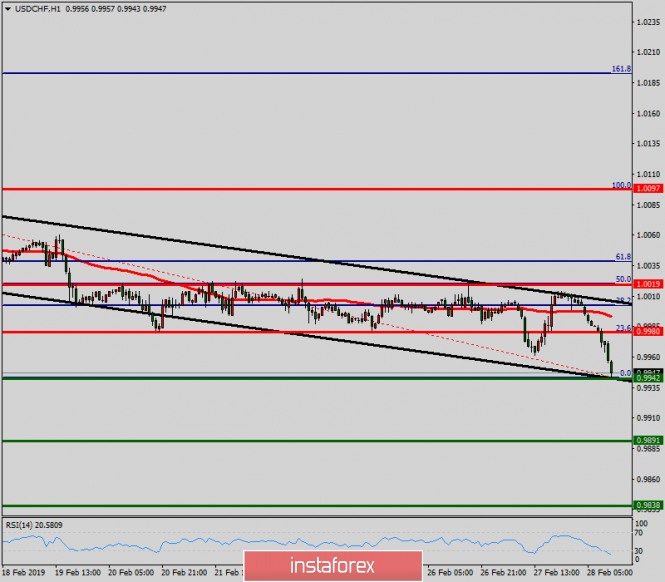
| Technical analysis of USD/CHF for February 28, 2019 Posted: 28 Feb 2019 02:57 AM PST The USD/CHF pair continues to move downwards from the level of 1.0019, which represents the double top in the H1 chart. Yesterday, the pair dropped from the level of 1.0019 to the bottom around 0.9945. Today, the first resistance level is seen at 0.9980 followed by 1.0019, while daily support is seen at the levels of 0.9940 and 0.9891. According to the previous events, the USD/CHF pair is still trapping between the levels of 0.9980 and 0.9891. Hence, we expect a range of 89 pips in coming hours. The first resistance stands at 0.9980, for that if the USD/CHF pair fails to break through the resistance level of 0.9980, the market will decline further to 0.9891. This would suggest a bearish market because the RSI indicator is still in a negative area and does not show any trend-reversal signs. The pair is expected to drop lower towards at least 0.9891 in order to test the second support (0.6693). On the contrary, if a breakout takes place at the resistance level of 1.0019 (the double top), then this scenario may become invalidated. The material has been provided by InstaForex Company - www.instaforex.com |
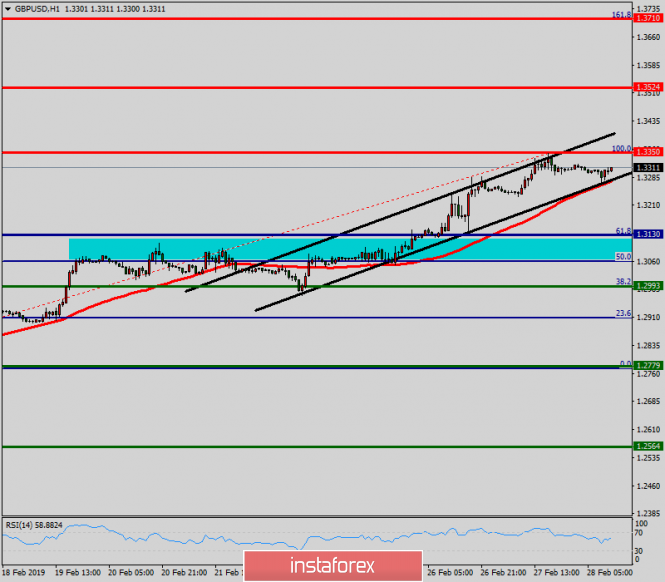
| Technical analysis of GBP/USD for February 28, 2019 Posted: 28 Feb 2019 02:22 AM PST The GBP/USD pair will continue rising from the level of 1.3130 in the long term. It should be noted that the support is established at the level of 1.3130 which represents the daily pivot point on the H1 chart. The price is likely to form a double bottom in the same time frame. Accordingly, the GBP/USD pair is showing signs of strength following a breakout of the highest level of 1.3130. So, buy above the level of 1.3300 with the first target at 1.3524 in order to test the daily resistance 1. The level of 1.3524 is a good place to take profits. Moreover, the RSI is still signaling that the trend is upward as it remains strong above the moving average (100). This suggests that the pair will probably go up in coming hours. If the trend is able to break the level of 1.3300, then the market will call for a strong bullish market towards the objective of 1.3524 today. On the other hand, in case a reversal takes place and the GBP/USD pair breaks through the support level of 1.3130, a further decline to 1.3080 can occur. It would indicate a bearish market. The material has been provided by InstaForex Company - www.instaforex.com |
| Posted: 28 Feb 2019 02:18 AM PST On the eve of the British currency, it rose against the dollar to maximum values for the first time since June 2018. Today, the GBP / USD pair is trading near the 1.33 level. Recently, the pound has strengthened largely due to the fact that the chances for the United Kingdom to leave the European Union without a deal have sharply decreased. "The positions of British Prime Minister Theresa May have been shaken, and her confident statements about the intention to implement Brexit according to the plan have replaced and promises have come in time to postpone the date of "divorce," said National Australia Bank (NAB). They believe that the likelihood of negative scenarios for the pound has decreased, and a reassessment of the prospects for the British currency by market participants could ensure further growth of the GBP / USD pair. "In our opinion, the most likely scenario is the extension of the term of Article 50 of the Lisbon Treaty, which in turn leaves three ways: a new variant of the deal with the EU, withdrawal from the alliance without an agreement, and rejecting Brexit, or rather holding a repeat referendum. Now politicians have started talking about the latter as a possible solution, which can add confidence to the bulls on the pound," representatives of the financial institute noted. According to experts, the weakness of the greenback can also come out on the side of the buyers of the British currency. Currently, traders are evaluating statements by Fed Chairman Jerome Powell, who spoke for two days in a row in the US Congress. The head of the Fed has once again confirmed that the regulator intends to adhere to a patient approach to making decisions on monetary policy, including in the matter of raising interest rates. This puts pressure on the US currency. Thus, if the postponement of the Brexit timeline helps to overcome the differences between the Cabinet and the British Parliament on the terms of the country's exit from the EU, and the dollar does not find a different basis for fundamental growth, the GBP / USD pair will be able to reach 1.37. However, the resumption of talk about the inevitable "hard" Brexit can quickly return to the market of sellers. The material has been provided by InstaForex Company - www.instaforex.com |
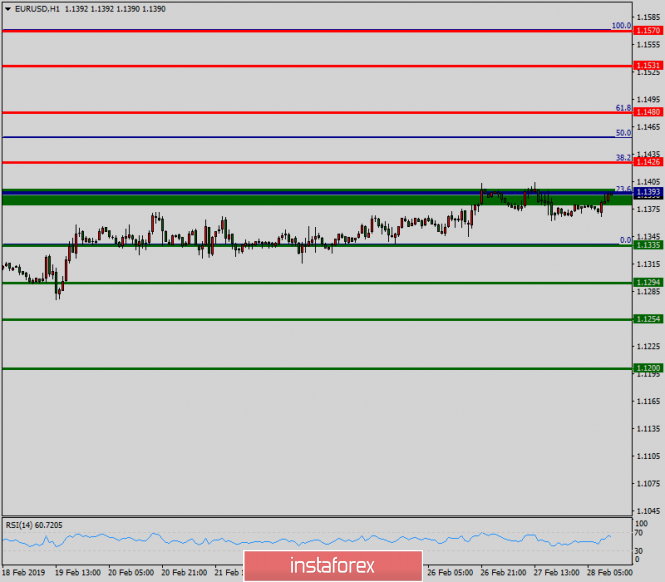
| Technical analysis of EUR/USD for February 28, 2019 Posted: 28 Feb 2019 02:03 AM PST The EUR/USD pair below around the weekly pivot point (1.1393). It continued to move downwards from the level of 1.1393 to the bottom around 1.1335. Today, the first resistance level is seen at 1.1393 followed by 1.1426, while daily support 1 is seen at 1.1335. Furthermore, the moving average (100) starts signaling a downward trend; therefore, the market is indicating a bearish opportunity below 1.1393. So it will be good to sell at 1.1393 with the first target of 1.1335. It will also call for a downtrend in order to continue towards 1.1294. The strong daily support is seen at the 1.1254 level. According to the previous events, we expect the EUR/USD pair to trade between 1.1393 and 1.1254 in coming hours. The price area of 1.1393 remains a significant resistance zone. Thus, the trend is still bearish as long as the level of 1.1393 is not broken. On the contrary, in case a reversal takes place and the EUR/USD pair breaks through the resistance level of 1.1393, then a stop loss should be placed at 1.1453. The material has been provided by InstaForex Company - www.instaforex.com |


| You are subscribed to email updates from Forex analysis review. To stop receiving these emails, you may unsubscribe now. | Email delivery powered by Google |
| Google, 1600 Amphitheatre Parkway, Mountain View, CA 94043, United States | |
No comments:
Post a Comment